


DESPITE increasingly tough restrictions in parts of Greater Sydney, the number of COVID-19 cases has trended steadily upwards over recent weeks. Of particular concern is that the number of new cases who were infectious in the community remains high; primarily for this reason Premier Gladys Berejiklian warned (rightly) over 2 weeks ago that “things are going to get worse before they get better”.
At the time of writing, it has been over 6 weeks since Sydney’s outbreak began. For most of this time, Sydneysiders have been subject to “stay at home” orders. Another 4-week period of lockdown was announced on 28 July, and with the current trajectory in cases, many saw easing of restrictions at that time as optimistic. Lockdown fatigue is becoming widespread and debilitating, and everybody in Australia is with Sydneysiders in hoping that outbreak will be over as soon as possible.
We appreciate that there has been an abundance of well-meaning but sometimes conflicting advice offered to the NSW Government and Sydneysiders. At the risk of adding to that, we want to offer what we believe are valuable observations and projections based on a detailed examination of Melbourne’s own outbreaks and lockdowns.
The Burnet Institute undertook detailed analysis of what did and didn’t work in Melbourne’s second COVID-19 outbreak in 2020. The data were used to calibrate detailed models (MACROMOD and COVASIM) that proved highly accurate in predicting the impact of various COVID-19 countermeasures, such as masks, and the timely release of restrictions. In this current work we fed data from Sydney into MACROMOD with the following results.
Controls introduced to date have restricted the epidemic
Despite the highly infectious nature of the Delta variant, the controls introduced to date, with effective contact tracing that makes use of new technology such as QR codes that was not available for the Melbourne second wave, have made an important impact. The record numbers of people in Sydney being tested daily is also important.
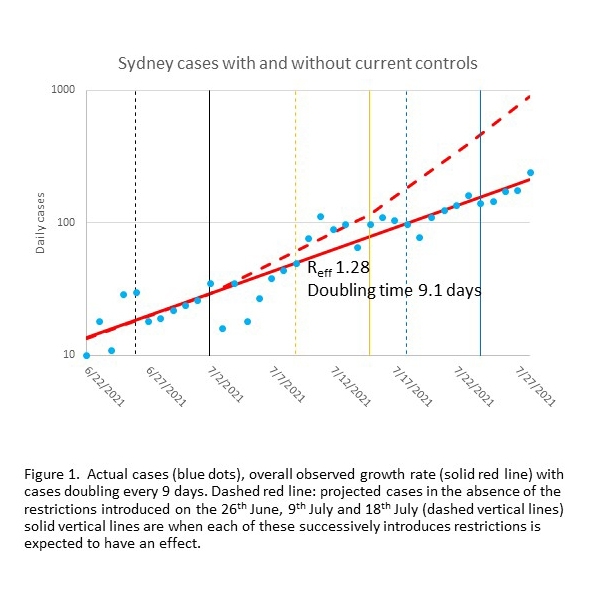
Using MACROMOD, we estimate that without the progressive introduction of restrictions starting on 26 June, including stay-at-home orders, further restrictions on 9 July and the closure of non-essential retail on 18 July, Sydney would have recorded approximately 1000 cases per day by now (29 July). We calculate that the restrictions implemented so far have avoided 4000 cases, over and above the many prevented by contract tracing and subsequent isolation (Fig. 1).
Despite the epidemic slowing, case numbers are still going up
Over the past 6 weeks, cases have doubled every 9 days on average (Figure 2).
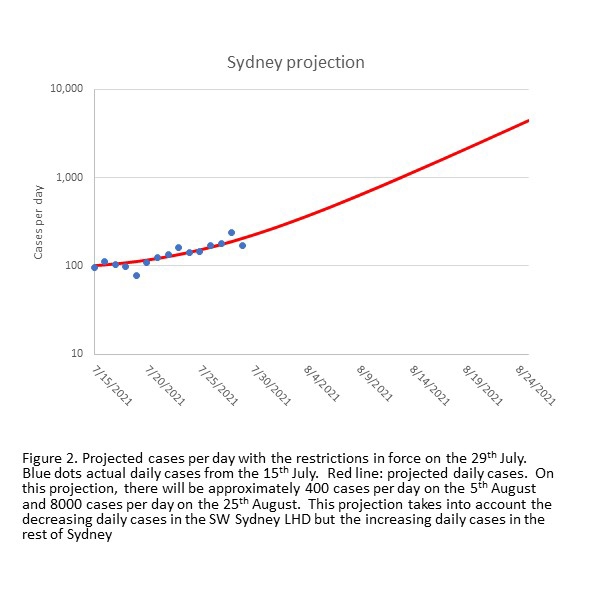
Presumably, the impact of toughened restrictions has been balanced by the epidemic spreading into new social groups, and contact tracers’ growing task to stay on top of infections and the number of people in the community while infectious. When we ran MACROMOD using trends in individual Local Health Authorities, it predicted that by this Friday, 5 August, Sydney will record about 570 cases per day. This is the result of stable or falling daily cases in south west Sydney Local Health District (LHD) being exceeded by rising cases elsewhere. It takes about a week before new controls have an effect, so we don’t expect new restrictions announced on 30 July to kick in until at least 7 August.
Furthermore, unless new controls introduced on 28 and 30 July or in the future (eg. LGAs that develop large case numbers are included in the tighter controls) have a major impact, our model projects that Sydney will have about 7700 cases per day 4 weeks from now.
Strong local suppression is being achieved, but seeding is still occurring
This epidemic started in the eastern suburbs, then south east Sydney, then spread through Greater Sydney from Wollongong in the south to the Central Coast in the north. The burden has been high in south west Sydney, particularly in Fairfield. As a consequence, south west Sydney had been subject to tighter restrictions than the rest of Sydney, as well the Government providing resources for significant community engagement and support.
Evidence suggests these measures have worked: an upward trend in daily cases in south west Sydney reversed on 15 July, exactly when we expected the restrictions introduced on 9 July would take effect (Fig 3a).
However, cases in the rest of Sydney did not follow this pattern (Fig 3b).
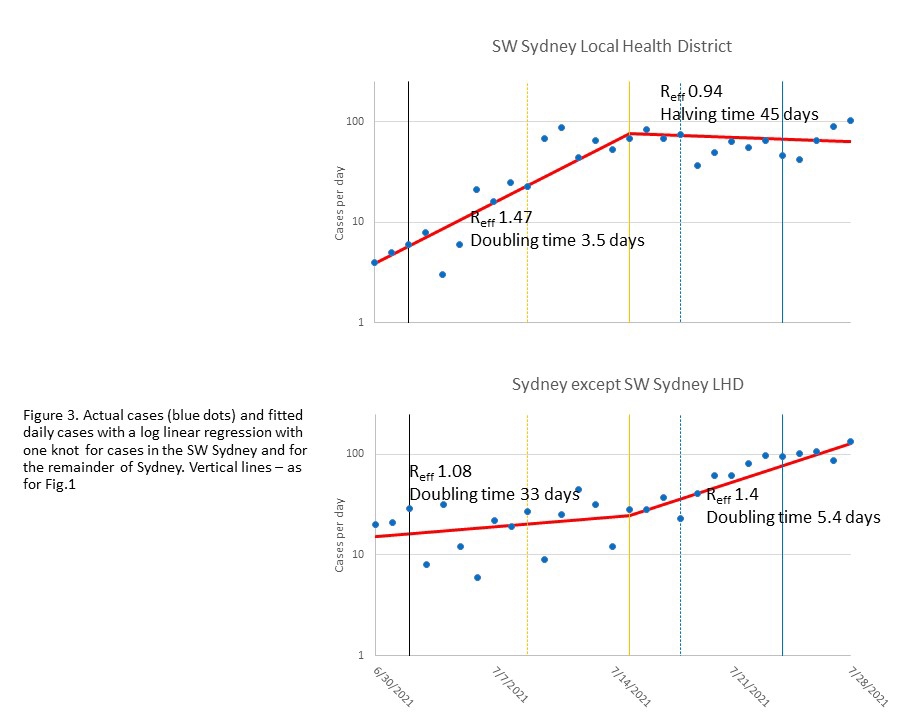
Although the number of cases is still lower outside south west Sydney, daily cases in the rest of Sydney are now increasing at about the same rate as happened initially in Fairfield – doubling every 4–5 days. It is not clear why the rates have accelerated, but this increase is statistically significant (p = 0.02). The NSW Government recognised the increasing problem outside the south west Sydney LHD, and has progressively imposed stringent restrictions on more local government areas (LGAs), such as Georges River, Campbelltown and Parramatta.
However, the adjacent LGAs of Burwood and Strathfield (west of the CBD) had higher incidences per capita during 19–26 July than either Parramatta and Campbelltown (Table 1), and Bayside (SW of Sydney Airport) had a higher rate than the adjacent LGA of Georges River, but have not yet been included in the more stringent restrictions.
[caption id="attachment_68712" align="aligncenter" width="720"]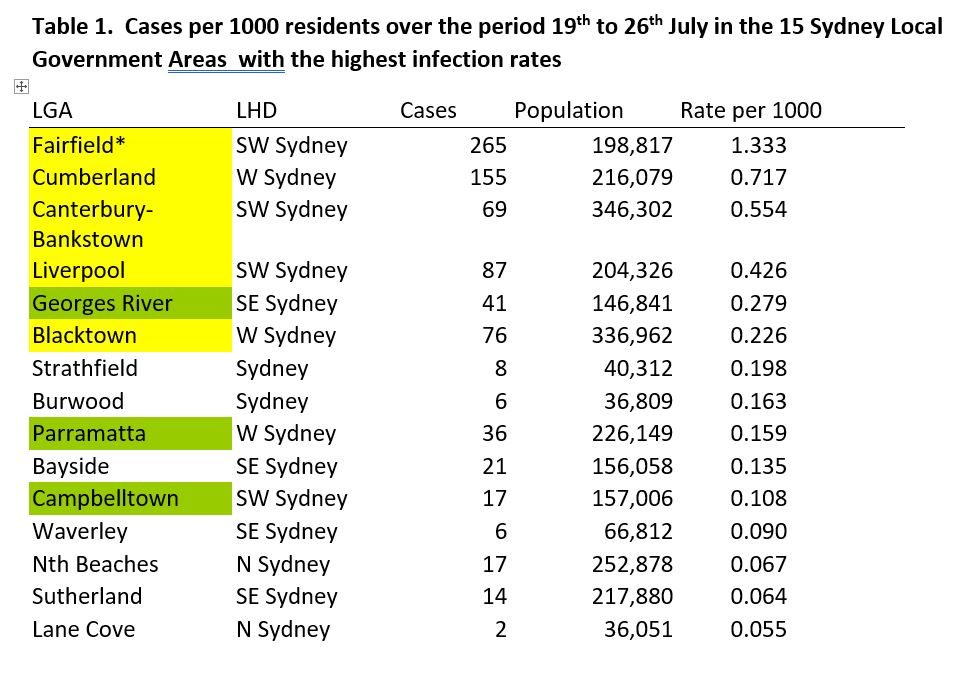 LGA in yellow: part of most restricted LGA as of 18 July. LGA in Green added 29th July Population based on 2016 census[/caption]
Which NSW locality is going to be hit next in this current “whack a mole” situation? After all, in mid-June, residents of south west Sydney, along with the rest of Australia, probably thought that this outbreak was just a Bondi problem.
The reality is that no one is safe until everyone is safe. Every positive case, no matter in which LGA, takes testing and contact tracing resources and has the potential to trigger new outbreaks. A highly mobile population means new outbreaks could occur anywhere in Sydney or NSW or across Australia, as recent exports of disease to Melbourne and Brisbane show.
What needs to happen next?
We recommend implementing more consistent stringent restrictions, akin to those announced for the 8 high-priority LGAs, uniformly across Sydney. Not only is this the equitable approach, but epidemiologically sound.
Importantly, our modelling shows even with these enhanced restrictions it is going to take until the end of September to reduce case numbers to below a 7-day average of five per day. We sincerely hope we are wrong, and the daily case load drops much faster.
Two things are likely to significantly reduce the time to the end of lockdown: first, that everyone follows the current restrictions in place and where necessary receive the appropriate supports to help them do so. Second, that people get vaccinated as soon as a vaccine is available. There is a lot at stake: saving lives, the health and economic well-being of the residents of Sydney and NSW and diminishing the threat of SARS-CoV-19 export to the rest of the Australian population.
Professor Allan Saul is Senior Principal Research Fellow (Honorary) at the Burnet Institute.
Professor Brendan Crabb AC is Director and CEO of the Burnet Institute.
Dr Campbell Aitken is a Research Fellow at the Burnet Institute.
Professor Margaret Hellard AM is Deputy Director (Programs) at the Burnet Institute.
The authors would like to acknowledge the contributions of Professor Mark Stoove and Dr Mike Toole.
The statements or opinions expressed in this article reflect the views of the authors and do not represent the official policy of the AMA, the MJA or InSight+ unless so stated.
At the time of writing, it has been over 6 weeks since Sydney’s outbreak began. For most of this time, Sydneysiders have been subject to “stay at home” orders. Another 4-week period of lockdown was announced on 28 July, and with the current trajectory in cases, many saw easing of restrictions at that time as optimistic. Lockdown fatigue is becoming widespread and debilitating, and everybody in Australia is with Sydneysiders in hoping that outbreak will be over as soon as possible.
We appreciate that there has been an abundance of well-meaning but sometimes conflicting advice offered to the NSW Government and Sydneysiders. At the risk of adding to that, we want to offer what we believe are valuable observations and projections based on a detailed examination of Melbourne’s own outbreaks and lockdowns.
The Burnet Institute undertook detailed analysis of what did and didn’t work in Melbourne’s second COVID-19 outbreak in 2020. The data were used to calibrate detailed models (MACROMOD and COVASIM) that proved highly accurate in predicting the impact of various COVID-19 countermeasures, such as masks, and the timely release of restrictions. In this current work we fed data from Sydney into MACROMOD with the following results.
Controls introduced to date have restricted the epidemic
Despite the highly infectious nature of the Delta variant, the controls introduced to date, with effective contact tracing that makes use of new technology such as QR codes that was not available for the Melbourne second wave, have made an important impact. The record numbers of people in Sydney being tested daily is also important.
Using MACROMOD, we estimate that without the progressive introduction of restrictions starting on 26 June, including stay-at-home orders, further restrictions on 9 July and the closure of non-essential retail on 18 July, Sydney would have recorded approximately 1000 cases per day by now (29 July). We calculate that the restrictions implemented so far have avoided 4000 cases, over and above the many prevented by contract tracing and subsequent isolation (Fig. 1).
Despite the epidemic slowing, case numbers are still going up
Over the past 6 weeks, cases have doubled every 9 days on average (Figure 2).
Presumably, the impact of toughened restrictions has been balanced by the epidemic spreading into new social groups, and contact tracers’ growing task to stay on top of infections and the number of people in the community while infectious. When we ran MACROMOD using trends in individual Local Health Authorities, it predicted that by this Friday, 5 August, Sydney will record about 570 cases per day. This is the result of stable or falling daily cases in south west Sydney Local Health District (LHD) being exceeded by rising cases elsewhere. It takes about a week before new controls have an effect, so we don’t expect new restrictions announced on 30 July to kick in until at least 7 August.
Furthermore, unless new controls introduced on 28 and 30 July or in the future (eg. LGAs that develop large case numbers are included in the tighter controls) have a major impact, our model projects that Sydney will have about 7700 cases per day 4 weeks from now.
Strong local suppression is being achieved, but seeding is still occurring
This epidemic started in the eastern suburbs, then south east Sydney, then spread through Greater Sydney from Wollongong in the south to the Central Coast in the north. The burden has been high in south west Sydney, particularly in Fairfield. As a consequence, south west Sydney had been subject to tighter restrictions than the rest of Sydney, as well the Government providing resources for significant community engagement and support.
Evidence suggests these measures have worked: an upward trend in daily cases in south west Sydney reversed on 15 July, exactly when we expected the restrictions introduced on 9 July would take effect (Fig 3a).
However, cases in the rest of Sydney did not follow this pattern (Fig 3b).
Although the number of cases is still lower outside south west Sydney, daily cases in the rest of Sydney are now increasing at about the same rate as happened initially in Fairfield – doubling every 4–5 days. It is not clear why the rates have accelerated, but this increase is statistically significant (p = 0.02). The NSW Government recognised the increasing problem outside the south west Sydney LHD, and has progressively imposed stringent restrictions on more local government areas (LGAs), such as Georges River, Campbelltown and Parramatta.
However, the adjacent LGAs of Burwood and Strathfield (west of the CBD) had higher incidences per capita during 19–26 July than either Parramatta and Campbelltown (Table 1), and Bayside (SW of Sydney Airport) had a higher rate than the adjacent LGA of Georges River, but have not yet been included in the more stringent restrictions.
[caption id="attachment_68712" align="aligncenter" width="720"]
LGA in yellow: part of most restricted LGA as of 18 July. LGA in Green added 29th July Population based on 2016 census[/caption]Which NSW locality is going to be hit next in this current “whack a mole” situation? After all, in mid-June, residents of south west Sydney, along with the rest of Australia, probably thought that this outbreak was just a Bondi problem.
The reality is that no one is safe until everyone is safe. Every positive case, no matter in which LGA, takes testing and contact tracing resources and has the potential to trigger new outbreaks. A highly mobile population means new outbreaks could occur anywhere in Sydney or NSW or across Australia, as recent exports of disease to Melbourne and Brisbane show.
What needs to happen next?
We recommend implementing more consistent stringent restrictions, akin to those announced for the 8 high-priority LGAs, uniformly across Sydney. Not only is this the equitable approach, but epidemiologically sound.
Importantly, our modelling shows even with these enhanced restrictions it is going to take until the end of September to reduce case numbers to below a 7-day average of five per day. We sincerely hope we are wrong, and the daily case load drops much faster.
Two things are likely to significantly reduce the time to the end of lockdown: first, that everyone follows the current restrictions in place and where necessary receive the appropriate supports to help them do so. Second, that people get vaccinated as soon as a vaccine is available. There is a lot at stake: saving lives, the health and economic well-being of the residents of Sydney and NSW and diminishing the threat of SARS-CoV-19 export to the rest of the Australian population.
Professor Allan Saul is Senior Principal Research Fellow (Honorary) at the Burnet Institute.
Professor Brendan Crabb AC is Director and CEO of the Burnet Institute.
Dr Campbell Aitken is a Research Fellow at the Burnet Institute.
Professor Margaret Hellard AM is Deputy Director (Programs) at the Burnet Institute.
The authors would like to acknowledge the contributions of Professor Mark Stoove and Dr Mike Toole.
The statements or opinions expressed in this article reflect the views of the authors and do not represent the official policy of the AMA, the MJA or InSight+ unless so stated.
Loading comments…
Newsletters
Subscribe to the InSight+ newsletter
Immediate and free access to the latest articles
No spam, you can unsubscribe anytime you want.
By providing your information, you agree to our Access Terms and our Privacy Policy. This site is protected by reCAPTCHA and the Google Privacy Policy and Terms of Service apply.