×

NHMRC funding of mental health research

A case for better alignment of research funding with burden of disease

Mental health research has long been the poor cousin in medical research, despite mental illness being both an independent and comorbid risk factor for every major medical disease, and a significant contributor to morbidity and mortality. Of the five major non-communicable disease areas, mental illness has the largest impact on the world economy by reducing gross domestic product.1 Yet, 11 times more money is donated from the private and corporate sectors to cancer research than to mental health research. In addition, cancer research receives twice the funding from governments.2

This pattern is reflected in the funding distribution from the National Health and Medical Research Council (NHMRC) in Australia, where mental health research has received a lower proportion of NHMRC health funding compared with other National Health Priority Areas such as cancer, diabetes and cardiovascular disease. Between 2001 and 2010, for example, mental health received about 9.5% of NHMRC funding.3 NHMRC funding for suicide research was lower than funding for falls, skin cancer and motor vehicle accidents, despite the fact that suicide is responsible for more deaths.4 In 2015, when NHMRC announced the membership of its strategic committees, there were no members with mental health expertise, in contrast to previous years.

We tested whether the proportional NHMRC funding to mental health has changed since our 2010 analysis, by estimating the number and dollar value of NHMRC funding schemes awarded to mental health-related topics during 2015. We also compared burden of disease estimates with NHMRC funding for mental health to determine whether the proportion of funding allocated to mental health-related research is in line with its effect on the population.

Using data from the October–November 2015 announcement of NHMRC results, we conducted a search of the following fields: grant title, field of research, all keywords and research summary. Our search used the following text strings: mental health, mental illness, depressi*, anxi*, psychosis, schizophrenia, substance use, alcohol use, smoking, adhd, stimulants, cocaine, heroin, amphetamine, sleep, obsessive, autism, panic, ptsd, suicid* and bipolar. The search conservatively counted psychosocial research with any mental health component as 100% “mental health”.

In 2015, the NHMRC funded 1037 projects or fellowships across all health categories, which were worth a total of $763 million. Of these, 85 were on the topic of mental health, constituting 8.6% of funding (Box). In 2009, the proportion of the total funding allocated to mental health was 9.5%. Recent data from the Australian Institute of Health and Welfare5 suggest that the burden of disease for mental disorders is 12.1%, or 14.6% if suicide and self-inflicted injuries are included, with mental and substance misuse disorders accounting for the largest burden in younger age groups. If funding was proportional to the burden of disease (disability adjusted life years), mental health research was short $26.6 million or 41% of the total funding. A comparison of cancer, cardiovascular and diabetes research using a similar search strategy found that 14.3%, 15.5% and 5.7% of funding went to these areas. Based on the burden of disease for these disease areas (18.5%, 14.6% and 2.3% respectively), these funding figures represent a smaller relative shortfall for cancer research ($32.1 million, 29%), a small gain for cardiovascular research ($7.1 million, 6%) and a large net gain for diabetes research ($17.6 million, 41% gain).

Our analysis indicates that, in the major NHMRC funding announcement for 2015, mental health research received significantly less funding than its disease burden (8.6% versus 12.1%), and less total funding than the average received in the previous decade (8.6% versus 9.5% for 2001–2010). This funding pattern is in contrast to the United Kingdom, where the research investment in mental health by the government has increased as a proportion of overall spend by 1.5% over the decade 2004–2014.2 The present analysis had limitations, such as not being able to deal with the problem of infrastructure and clinical environment in detail, compare in detail the nature of cardiovascular and cancer research, or reconfirm the high quality of Australian mental health research.3

There are many potential reasons as to why mental health research does not receive NHMRC funding proportional to disease burden. Given that the problem is not the quality of the research (mental health research outperforms other disciplines on the world stage),3 the working hypothesis remains that the primary causes are capacity (limited number of active mental health researchers) and the nature of mental health research (NHMRC category descriptors do not favour translational research — real-world trials are rarely flawless). Considering the capacity concern, it is disappointing that the number of opportunities provided to early- and mid-career fellowship applicants in mental health remains low.

The prevalence of depression and suicide rate has not changed in the past decade, while the costs of mental health to the community are increasing rapidly. Recent figures indicate that the government spent about $4.5 billion on mental health with about 21% of this spent on hospital funding; 21% on carer funding and 20% on the Medicare Benefits Schedule. These spends represented an increase of between 13% and 53% over the past 7 years.6 Critically, this investment has not increased access to evidence-based mental health care, which remains low at 11–20%.7 Yet, research funding has remained stagnant over the same period, with considerable decreases after adjusting for inflation. Mental health research has the potential to transform the lives of Australians and to save costs.

So what is to be done? First, impress upon the public, scientists, government and politicians the importance of research as the key solution to managing the escalating costs of mental health — estimated to be $4.5 billion, which represents an increase of up to 53% over the past 7 years.6 Second, recognise that research funding in Australia has to change, as in the UK, where the proportion of funding to mental health has increased by 1.5% from 2004–2014.2 Third, we need to determine the reasons for low yields from philanthropy and non-government support for mental health, and actively overcome barriers and capture funds.

We call on the Australian government to develop a clear, empirical basis for using health priorities to allocate funding from the emerging Medical Research Future Fund that accounts for indices such as burden of disease and building capacity in underfunded areas. The government approved the establishment of the Medical Research Future Fund in 2015 to drive innovation in medical research, with funding guidelines currently being developed. The resulting doubling of investment in medical research in Australia offers a unique opportunity to overcome the gap in the funding of mental health research identified here. The mental health community (consumers, researchers, clinicians and the wider community) look forward to continuing to contribute ideas to the Australian Medical Research Advisory Board regarding a more equitable distribution of research funding.

Box –
Counts and funding for major NHMRC grants and fellowship categories announced on 9 November 2015

Category

Number awarded

Number awarded related to mental health

Total funding across all domains ($)

Funding related to mental health ($)


Career development fellowship

55

5 (9.1%)

23 915 192

2 184 844 (9.1%)

Early career fellowship

124

13 (10.5%)

38 102 059

3 779 955 (9.9%)

Research fellowship

69

8 (11.6%)

51 239 170

6 070 820 (11.8%)

Development grant

24

0

14 142 312

0

Standard project grant

483

48 (9.9%)

404 722 995

48 622 759 (12.0%)

NHMRC–ARC dementia research development fellowship

76

6 (7.9%)

43 669 587

3 308 618 (7.6%)

Total (all schemes)

1037

85 (8.2%)

$763 481 138

$65 746 208 (8.6%)


ARC = Australian Research Council. NHMRC = National Health and Medical Research Council.

Vulvoplasty in New South Wales, 2001–2013: a population-based record linkage study

The known The number of vulvoplasty procedures in NSW has been rising over the past decade. 

The new One in 23 women who had vulvoplasty had repeat procedures; one in ten had had, or will have, other cosmetic surgery. One in 14 procedures resulted in serious adverse events. The caesarean delivery rate for primiparous women was about 30% higher among those who had had vulvoplasty. Vulvoplasty had no effect on perineal outcomes of a subsequent vaginal first birth. 

The implications Our population-based study provides important information that can inform pre-surgery counselling. 

Vulvoplasty refers to surgery performed on the external female genitals, generally reducing the size or correcting the asymmetry of the labia minora.1 Increasing demand for this procedure has been reported over the past two decades, with the number of procedures rising in high income countries, including Australia,1 the United Kingdom2 and the United States.3

In Australia, the number of Medical Benefits Schedule (MBS) rebates linked with item number 35533 for vulvoplasty procedures doubled from 744 during 2003–04 to 1588 in 2012–13.1 This MBS item was specifically intended to cover medically indicated vulvoplasty procedures performed in or out of hospital in private care. However, as no guidance or objective measures for assessing medical necessity were available to clinicians, concern was raised that the increasing number of rebates claimed might reflect demand for vulvoplasty as a cosmetic service.1

A review of vulvoplasty services was consequently undertaken by the federal Department of Health,1 and changes to the MBS were made. The former Medicare item number 35533 (vulvoplasty) was replaced in November 2014 by two item numbers: 35533 (surgical repair of female genital mutilation and major congenital anomalies) and 35534 (surgical repair for localised gigantism causing significant functional impairment).4 Rebates were no longer available for out-of-hospital services, and were available for item 35534 only when there was documented evidence of a clinical need.4

The Department of Health review incorporated both Medicare data and information from the National Hospital Morbidity Database (NHMD). The NHMD contains data for vulvoplasty procedures in public and private hospitals and in day-stay units, with or without a medical indication, and provides additional information about the hospital stay. The review also reported the associated principal diagnoses and age profiles of patients at the time of vulvoplasty. However, as data were for procedures and not for individual women, analysis of re-admissions and repeat procedures was not possible. Apart from age, neither the characteristics of women undergoing vulvoplasty nor rates of adverse outcomes were reported. No other studies have had the capacity to investigate outcomes at the population level.

The increased number of vulvoplasty procedures has attracted discussion and debate in both the medical community and the popular media.5,6 Commentators have explored possible reasons for the rise,1,7,8 as well as the ethics of cosmetic surgery marketing.7,911 The low level of evidence for the reported short and long term outcomes, including adverse events, has been criticised.1,8,9,11,12 Studies have relied on surgeon-initiated questionnaires9,13 or anecdotal and case reports.11,13 Further, no studies of the effects of vulvoplasty on subsequent childbirth have been undertaken.13,14

The aims of our study were to compare the characteristics of women undergoing vulvoplasty with those of other women of reproductive age; to quantify serious short term adverse events; and to determine the effect of vulvoplasty on subsequent outcomes for women giving birth. We hypothesised that vulvoplasty might have an impact on perineal trauma and decisions about the mode of delivery.

Methods

The study population consisted of all women of reproductive age (15–54 years) who had had a vulvoplasty in a New South Wales hospital during 2001–2013. To explore the relationship between vulvoplasty and subsequent birth outcomes (birth type and perineal status), we also analysed a subpopulation that included women who had undergone vulvoplasty and subsequently given birth for the first time during 2001–2012.

Data were obtained from two routinely collected population-based data collections: the NSW Admitted Patients Data Collection (APDC, “hospital data”) for 2001–2013, and the NSW Perinatal Data Collection (PDC, “birth data”) for 1994–2012. The APDC, an administrative data collection, is a census of discharges from all public and private hospitals and day procedure centres. As well as demographic data, it includes clinical diagnoses coded according to the International Classification of Diseases, tenth revision, Australian modification (ICD-10-AM), and procedures coded according to the Australian Classification of Health Interventions (ACHI; based on the MBS).15 The NSW PDC is a statutory dataset with information for all births in NSW of at least 20 weeks’ gestation or in which the birthweight was at least 400 g. It contains demographic, medical and obstetric information, as well as details about labour, birth and infant condition. Longitudinal linkage of the hospital records and birth records was undertaken by the Centre for Health Record Linkage, enabling admissions, re-admissions, serious adverse outcomes and birth outcomes for individual women to be analysed. The linkage rate between hospital and birth data for mothers has previously been reported as 98.1%.16 De-identified records were provided to the investigators.

Vulvoplasty was identified by ACHI procedure code 35533-00 in the hospital data. The principal diagnosis at the time of each vulvoplasty was identified by ICD-10-AM diagnostic codes.

Factors potentially associated with vulvoplasty and available in hospital records for analysis included age, marital status, smoking history, country of birth and socio-economic status (residential postcode was used to classify each woman according to the Socio-Economic Indexes for Areas [SEIFA] Index of Relative Socio-Economic Disadvantage17). Data on cosmetic breast augmentation (for women without prior mastectomy or breast cancer), liposuction, and face or brow lifting were also included in the analysis if the procedures had been undertaken during the study period.

Information about the vulvoplasty procedure and health service factors included hospital location, whether the woman had received public or private care, how many nights she had spent in hospital, the use of general anaesthesia, and whether she had been re-admitted to hospital within 14 days of the vulvoplasty surgery. Serious adverse events and complications ascertained from hospital records included haemorrhage, infection, and adverse urinary tract events, all of which have previously been reported in smaller, non-population studies.7 Information ascertained from the birth data included birth mode (non-instrumental vaginal, forceps, vacuum, and intrapartum or pre-labour caesarean delivery), episiotomy, and degree of perineal trauma.

The total number of vulvoplasties and the change in number over time were calculated for public and private hospitals, with the overall annual change estimated by Poisson regression. The characteristics of women with a first record of a vulvoplasty were described, and compared with 2011 NSW reference populations of all women aged 15–54 years (N = 1 982 710), including Australian census data for age and marital status18 and Australian migration data for country of birth.19 Data from the NSW Population Health Survey for women aged 15–54 years (N = 3258) were used as reference population data for smoking status.20 Rates of other cosmetic procedures were determined for all women of reproductive age who had no record of vulvoplasty and had been admitted to hospital for any other reason during the study period (N = 2 053 760), and compared with those for women who had undergone vulvoplasty. The characteristics of the vulvoplasty procedures and associated health service factors are described.

Women with a primiparous birth after a vulvoplasty were identified, and their birth characteristics compared with primiparous women without prior vulvoplasty by χ2 analysis. Primiparous women were chosen for this analysis to minimise any obstetric history effect on birth outcomes.

Ethics approval

Ethics approval for the study was obtained from the NSW Population Health and Health Services Research Ethics Committee (reference, 2012-12-430).

Results

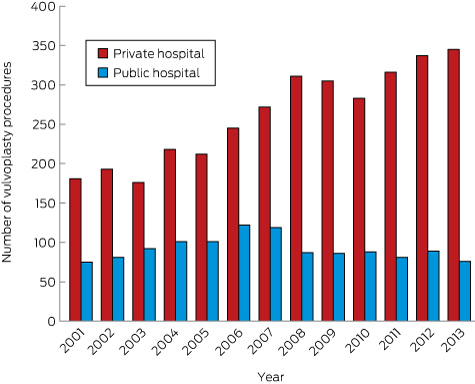
During 2001–2013, 4592 vulvoplasty procedures were performed on 4381 women in NSW hospitals and day-stay centres; 1198 were performed in public hospitals, 3394 in private hospitals. The number performed in public hospitals peaked in 2006 (122 procedures), while the number performed in private hospitals was still rising in 2013 (345 procedures) (Box 1). Of the 4381 women, 4193 (95.7%) had had only one vulvoplasty, 170 (3.9%) a total of two vulvoplasties, and 18 (0.4%) three or more. The total number of procedures rose from 256 in 2001 to 421 in 2013, a total increase of 64.5% and an annual increase of 3.3% (95% CI, 2.5–4.2%).

The two most frequent principal diagnoses linked with vulvoplasty were “hypertrophy of vulva” (26.1% of procedures in private hospitals, 23.1% in public hospitals) and “non-inflammatory disorders of vulva or perineum” (19.7% in private hospitals, 21.2% in public hospitals). “Plastic surgery for unacceptable cosmetic appearance” was the third most frequently cited indication in private hospitals (8.1%), and 23rd for procedures in public hospitals (0.7%).

Compared with the general population of NSW women aged 15–54 years, more women undergoing a first vulvoplasty were born in Australia (74.6% v 67.6%) and were 25–34 years of age (32.6% v 25.2%); fewer were married or in de facto relationships (42.5% v 55.4%) or aged 45–54 years (16.3% v 25.5%). A higher proportion lived in areas of higher socio-economic status, and six times as many had other cosmetic procedures performed during the study period (Box 2).

Most vulvoplasty procedures were performed in private hospitals in Sydney (59.4%); 13.9% were performed in public hospitals in Sydney, 14.5% in private hospitals outside Sydney, and 12.2% in public hospitals outside Sydney (Box 3). Most women (68.9%) had a day-only admission. Of the 679 women (14.8%) who were in hospital for two nights or more, 365 (53.7%) had gynaecological surgery other than vulvoplasty recorded as the principal procedure, including repair of uterine prolapse, pelvic floor or enterocoele (156 women), and vaginal hysterectomy (101 women).

Serious adverse events at the time of the vulvoplasty admission or during re-admission within 2 weeks of the initial admission were associated with 332 procedures (7.2%). For vulvoplasties with concomitant gynaecological surgery, the serious adverse event rate was 12.7%; for other vulvoplasties it was 5.0%. The most common events were urinary tract problems and complications (54.5% of complications; Box 3). One hundred and twenty-one women (2.6%) were re-admitted to hospital within 2 weeks of the procedure, with haemorrhage or haematoma complicating a procedure (30 women) and a variety of diagnoses related to wound complications or infection (29 women) being the most frequent principal diagnoses. A total of 4.3% of women had repeat vulvoplasties, with seven having a repeat procedure within 2 weeks of the first.

Of all vulvoplasty procedures, 3157 (68.7%) were for women who had not previously given birth in NSW. Women with one prior birth accounted for 694 of all vulvoplasties (15.1%), women with two prior births for 494 (10.8%), and women with three prior births for 247 procedures (5.4%).

Two hundred and fifty-seven women with a history of vulvoplasty subsequently gave birth for the first time during 2001–2012. The proportion of these women who had a caesarean delivery (40.0%) was significantly greater than for the 454 027 primiparous women with no history of vulvoplasty (30.3%; χ2 test, P < 0.001). This difference was evident for births in both private hospitals (56% v 39.7%; χ2 test, P = 0.004) and public hospitals (33% v 27.0%; χ2 test, P = 0.04). A higher proportion of women with prior vulvoplasty had a pre-labour caesarean delivery than other women (20% v 11.0%), while the rates of intrapartum caesarean delivery were similar (20% v 19.3%). For vaginal births, there were no significant differences in the episiotomy rates or in perineal trauma for primiparous women with and without previous vulvoplasty (Box 4).

Discussion

The annual number of vulvoplasties performed in NSW hospitals on women aged 15–54 years increased by 64.5% between 2001 and 2013. However, the majority of Australian providers who advertise vulvoplasty surgery services indicate that these procedures are performed on an outpatient basis under local anaesthetic.1 During the same period, Medicare rebate data for NSW (which also captured clinically indicated, out-of-hospital procedures) indicated a 142% increase in the number of procedures, suggesting marked increases in the numbers of vulvoplasty procedures both in and out of hospital.21 Following changes to the MBS in 2014, restrictions of the eligibility for Medicare rebates for these procedures were tightened. The number of vulvoplasties recorded by Medicare subsequently declined, with 240 rebates paid in NSW in 2015, compared with 448 in 2013.4 Data have never been available for cosmetic out-of-hospital procedures (ie, those that are not clinically indicated), so that the total number of vulvoplasty procedures performed cannot be determined.

It is unlikely that a rise in the incidence of vulval pathology is driving the increase in surgery, and we cannot determine whether any vulvoplasties undertaken in NSW hospitals were for reversal of female genital mutilation. Dissatisfaction with physical aspects (such as chafing and discomfort), the appearance of their genitalia or with sexual activity, and feeling abnormal are reported as motives for women requesting surgery.13,22 However, there is a great deal of variability in normal vulval anatomy; in view of concerns that providers of surgery may exploit vulnerable women, there is a growing call from professional bodies to improve education and counselling.23,24 Our study found that six times as many women who have had a vulvoplasty have had other cosmetic procedures as have other women, which suggests that they have a lower tolerance for perceived physical imperfections. A similar difference was reported by a small UK study, in which 10 of 55 women who had undergone vulvoplasty were also diagnosed with body dysmorphic disorder (compared with none of the control group of 70 women).22 The authors recommended further studies for exploring this relationship, and others have called for more psychological screening of women who request vulvoplasty.23,25

The quality of evidence in studies of women’s satisfaction after vulvoplasty has been criticised in terms of the follow-up and the measures employed.9 Most studies have been undertaken by the surgeons who performed vulvoplasties, reporting data based on questionnaires sent to their own patients.9,13 Impaired sexual function caused by scarring and nerve damage has been mentioned as a potential problem after genital surgery.9,23 Satisfaction and long term outcomes warrant further investigation, especially as the number of women having the procedure outside hospitals is unknown.

In our study, one in 14 procedures was associated with a serious short term adverse event or complication within 2 weeks of surgery. Urinary tract problems were the most common, but these are rarely mentioned in the literature; wound dehiscence has instead been reported as the most frequent short term adverse event.1 The serious complication rate in our study (7.2%) was slightly higher than reported by small, surgeon-led studies (2.7–6.0%).7 However, other studies have also included longer term complications (eg, dyspareunia and delayed local pain) that would not be recorded in the population data upon which we based our study. By analysing hospital data, we could only detect complications or adverse events sufficiently serious to warrant a diagnosis or hospital admission, so we may have underestimated the overall complication rate. Women who experienced more pain than they anticipated, were unhappy with the aesthetic results of the procedure, or felt dissatisfied in other ways would not be definitively captured. About one in 23 women had a repeat procedure, perhaps reflecting wound healing problems after being discharged from hospital, or longer term dissatisfaction with the results of the procedure.

The relationship between vulvoplasty and subsequent birth outcomes has not previously been explored. For vaginal births, perineal outcomes were similar for women with and without vulvoplasty, so that women who have had a vulvoplasty can be reassured about their prospects for a vaginal birth. However, the caesarean delivery rate was 30% higher for women who had had vulvoplasty; the increase was predominantly in pre-labour caesarean deliveries, suggesting a higher rate of planned birth interventions. Vulvoplasty may have influenced decisions about birth plans; surgeons or the women themselves may have been worried that a vaginal birth might disturb the results achieved by vulvoplasty.

As routine data about procedures performed outside hospitals are not available, the overall frequency of vulvoplasty in NSW could not be determined, and women who had vulvoplasties performed outside NSW (including overseas) were not captured by our study. Nevertheless, our investigation was the first population-based study of vulvoplasty. It thereby avoided sampling bias, and analysed routinely collected data to provide a snapshot of the current situation in NSW hospitals. Further, it provides information about serious complications that can be useful for pre-surgery counselling of women considering the procedure.

Box 1 –
Numbers of vulvoplasties performed in New South Wales private and public hospitals, 2001–2013

Box 2 –
Characteristics of 4381 women at their first record of vulvoplasty in New South Wales hospitals, 2001–2013, compared with a reference population of NSW women1720

Women undergoing first vulvoplasty

Reference population of NSW women


Country of birth

Australia

3269 (74.6%)

67.6%

Elsewhere/unknown

1112 (25.4%)

32.4%

Previous cosmetic procedures

Any cosmetic procedure, including:

444 (10.1%)

1.7%

Breast augmentation

236 (5.4%)

0.9%

Liposuction

230 (5.3%)

0.8%

Face/brow lift

44 (1.0%)

0.2%

Age

15–24 years

1109 (25.3%)

23.1%

25–34 years

1427 (32.6%)

25.2%

35–44 years

1132 (25.8%)

26.3%

45–54 years

713 (16.3%)

25.5%

Marital status

Never married

1884 (43.0%)

33.1%

Married/de facto

1861 (42.5%)

55.4%

Widowed/divorced/separated

439 (10.0%)

11.6%

Unknown

197 (4.5%)

Smoking status

Smoker

691 (15.8%)

14.2%

Socio-economic status (SEIFA score quintile)

1 (most disadvantaged)

643 (14.7%)

20.0%

2

633 (14.5%)

20.0%

3

779 (17.8%)

20.0%

4

800 (18.3%)

20.0%

5 (least disadvantaged)

1363 (31.1%)

20.0%

Unknown (residence outside NSW)

163 (3.4%)


SEIFA = Socio-Economic Indexes for Areas. * Based on postcode of residence at time of the procedure.

Box 3 –
Characteristics of vulvoplasty procedures performed in New South Wales hospitals, 2001–2013

Vulvoplasty procedures, 2001–2013


Total number of procedures

4592

Hospital

Public: Sydney

638 (13.9%)

Private: Sydney

2729 (59.4%)

Public: outside Sydney

560 (12.2%)

Private: outside Sydney

665 (14.5%)

Hospital stay

Day only

3165 (68.9%)

1 night

748 (16.3%)

2 nights

299 (6.5%)

> 2 nights

380 (8.3%)

General anaesthesia

4363 (95.0%)

Any serious adverse event*

332 (7.2%)

Haemorrhage

82 (1.8%)

Infection

14 (0.3%)

Urinary tract

181 (3.9%)

Other

73 (1.6%)

Re-admission within 2 weeks of procedure

121 (2.6%)


* Serious adverse event occurring during procedure admission or re-admission within 2 weeks (some women had more than one serious adverse event). † Includes disruption of operation wound and other complications.

Box 4 –
Birth outcomes for primiparous women in New South Wales, 2001–2012, according to vulvoplasty history

Women with previous vulvoplasty


Women without previous vulvoplasty


P*

Number

Percentage (95% CI)

Number

Percentage (95% CI)


Number of women

257

454 027

Hospital

0.33

Public

182

70.8% (65.0–76.0)

333 618

73.5% (73.3–73.6)

Private

75

29.2% (24.0–35.0)

120 409

26.5% (26.4–26.7)

Birth mode

< 0.001

Non-instrumental vaginal

118

45.9% (39.9–52.0)

225 042

49.6% (49.4–49.7)

Forceps

10

3.9% (2.1–7.0)

33 008

7.3% (7.2–7.3)

Vacuum

26

10.1% (7.0–14.4)

57 971

12.8% (12.7–12.9)

Intrapartum caesarean delivery

52

20.2% (15.8–25.6)

87 650

19.3% (19.2–19.4)

Pre-labour caesarean delivery

51

19.8% (15.4–25.1)

50 134

11.0% (10.9–11.1)

Missing data

0

0

222

< 0.05%

Episiotomy (vaginal births)

0.20

Yes

37

24.0% (18.0–31.4)

90 550

28.7% (28.5–28.8)

No

117

76.0% (69.6–82.0)

225 471

71.3% (71.2–71.5)

Perineal spontaneous tearing (vaginal births)

0.87

Intact/first degree tear

66

42.9% (35.3–50.8)

118 028

37.3% (37.2–37.5)

Second degree tear

46

29.9% (23.2–37.5)

90 690

28.7% (28.5–28.9)

Third/fourth degree tear

5

3.2% (1.4–7.4)

12 681

4.0% (3.9–4.1)

Other

30

19.5% (14.7–27.6)

58 042

18.4% (18.2–18.5)


* χ2 test. † Numbers do not sum to 100% as episiotomy and perineal tearing categories were not mutually exclusive until 2007.

[Editorial] The best science for achieving Healthy China 2030

2016 marks a major milestone in the history of China’s health-care reform. Health has been made an explicit national political priority. In August, the Healthy China 2030 plan was officially approved by China’s Central Committee, and President Xi Jinping called for putting health at the heart of the country’s entire policy making endeavour to ensure the health of the Chinese population. In President Jinping’s remarks at the national meeting on health, crucial health issues such as environmental health and meeting the challenges of an ageing society were all addressed.

[Articles] Global, regional, and national comparative risk assessment of 79 behavioural, environmental and occupational, and metabolic risks or clusters of risks, 1990–2015: a systematic analysis for the Global Burden of Disease Study 2015

Declines in some key environmental risks have contributed to declines in critical infectious diseases. Some risks appear to be invariant to SDI. Increasing risks, including high BMI, high fasting plasma glucose, drug use, and some occupational exposures, contribute to rising burden from some conditions, but also provide opportunities for intervention. Some highly preventable risks, such as smoking, remain major causes of attributable DALYs, even as exposure is declining. Public policy makers need to pay attention to the risks that are increasingly major contributors to global burden.

Gluten content of imported gluten-free foods: national and international implications

Coeliac disease (CD) is the only common disease for which strict dietary compliance is the sole treatment. Sensitivity to gluten varies between patients with CD, so that restricting levels in food to under one part per million (ppm) would protect the maximum number of patients.1 In a daily diet of 500 g food, 1 ppm is equivalent to 0.5 mg, the amount in 1/5000 of a slice of wheat flour bread containing 2.5 g gluten.

International food codes require that foods labelled “gluten-free” (GF) contain less than 20 ppm gluten; in Australia and New Zealand, however, a “no detectable gluten” standard applies.24 Current laboratory techniques have a reporting limit of 1 ppm, and a detection limit of 0.5 ppm gluten in food. We assessed the compliance of imported GF-labelled foods with the local food standard, as well as the international capacity of industry to comply with Australian standards, given commercially available analytical reporting and detection limits.

A total of 169 GF-labelled food items manufactured overseas were purchased from four retailers in Perth, Western Australia. The countries of origin were in Europe (nine countries), Asia (nine), and North (two) and South America (five); the food categories included crackers, bread and biscuits (41 items), cereals, flour and grains (37), condiments and sauces (30), spices (21), pasta (16), drinks and soups (15), and confectionary and snacks (nine).

We used a sandwich enzyme-linked immunosorbent assay (ELISA) gliadin detection kit (ESGLISS-48, ELISA Systems). Testing complied with strict food chemistry testing protocols: five variable concentration calibration standards and blank solution tests were used, calibration standards performance was confirmed every 15 samples, internal control materials were employed, and duplicate random samples (1 in 10) from each ELISA plate were tested. All positive results were confirmed on a stored original food sample.

Gluten was detected in 24 of 169 products (14%), of which 20 had unquantifiable but detectable levels (< 1 ppm) and four had quantifiable levels (three, 1.0 ppm; one, 1.1 ppm). Gluten was detected in products supplied from each of the four continents and from each food category (except pasta and drinks/soups).

Our findings, in conjunction with those of 2008 and 2010 surveys of foods mostly produced in Australia,5 have three important implications. Firstly, people with CD can confidently consume GF-labelled products purchased in Australia. Secondly, a marked tightening of international GF standards is readily achievable by industry; the gluten levels in the foods we analysed were all below 1.5 ppm, less than one-tenth of the standard set by the Codex Alimentarius of < 20 ppm.2 Thirdly, we recommend that authorities revise the current Australian GF standard of “no detectable gluten”4 to “≤ 1 ppm”, as it is not practical or reasonable for industry to comply with the stricter standard. In our survey, 14% of products were non-compliant with the current Australian standard, but none contained more than 1.1 ppm gluten.

No Jab, No Pay — no planning for migrant children

Migration should be considered by immunisation policy

The Social Services Legislation Amendment (No Jab, No Pay) Act 2015 (Cwlth) was passed in November 2015, closing the conscientious objection exemption to immunisation requirements for family assistance payments. The intention was to reinforce the importance of immunisation and protect public health, especially for children.1,2 While these aims are sound, there are far-reaching, presumably unintended, consequences for migrant and refugee children.

The legislative changes (which took effect in January 2016) require children and young people under 20 years of age to be up to date for their early childhood immunisations in order to qualify for the Child Care Benefit, Child Care Rebate and Family Tax Benefit Part A supplement (Box).3 These Centrelink payments are available for Australian citizens and people holding a permanent visa (including offshore humanitarian entrants), special category visa or certain temporary visas (including temporary protection visas). Immunisation status is assessed through the Australian Childhood Immunisation Register (ACIR), which is linked to Medicare.

Medical contraindications (including immunosuppression and anaphylaxis) and natural immunity are still grounds for vaccination exemption. However, the legislation now specifies that only general practitioners can certify exemptions, with the expectation that specialists will refer back to GPs.2 The legislation is paired with a number of supporting measures, including funded catch-up immunisations (time-limited for people aged 10–19 years), expansion of the ACIR to include all people under 20 years of age,4 and provider incentive payments for catch-up vaccination in children aged less than 7 years.5

There are multiple issues arising for refugee and migrant children. First, any child arriving and receiving catch-up vaccination in Australia after the age of 7 years who is eligible for these Centrelink payments will lose them until their ACIR record is updated, even if he or she is fully immunised. Before 1 January 2016, the upper age limit for data entry into the ACIR was 7 years — overseas and catch-up vaccinations could not be recorded on the register for older children. Australia’s Humanitarian Programme intake has been 13 750 people annually, with around 50% aged less than 18 years on arrival.6 Therefore, up to 35 000 refugee children and young people (those who have arrived at the age of 7 years or older and are currently under 20 years of age) will need their vaccination status assessed and ACIR records entered. This number will increase when other migrant children meeting the residency requirements for Centrelink payments are included.

The workforce challenges regarding the No Jab, No Pay measures are substantial. Immunisation providers across Victoria report that refugee families have received (multiple) letters from Centrelink. This has resulted in large numbers of people presenting to services, and an increased demand for providers to clarify previous vaccination history, notify the ACIR of these details, and provide catch-up vaccines where needed. Providers report being inundated, under-prepared and inadequately resourced to meet demand.

Establishing prior vaccination is difficult, time consuming, and may not be possible. Refugee-background families tend to be mobile in the early years of settlement, and often see multiple providers for health care, which may (or may not) include immunisation. Children may receive vaccinations in different parts of the health system — from GPs, from specialists, at school, and, particularly in Victoria, through local government areas (LGAs).7 However, comprehensive records are rare, and information about past vaccinations is often unavailable.

Reporting to the ACIR is time consuming, and there is variation in how information is handled. Providers estimate it takes 20 minutes to enter a full vaccine history into the ACIR online, and longer if overseas vaccinations are recorded. They report delays between submission and registration of data on the ACIR. While on-site vaccines are usually registered within 24 hours, prior vaccines (administered in Australia or overseas) take 1–3 weeks, and individual errors can result in batches of ACIR entries being rejected, affecting ACIR registration for multiple individuals. Many services are now faxing records to the ACIR due to inadequate capacity to enter information directly; these are taking up to 8 weeks to register and delays appear to be increasing. Providers report discrepancies between Centrelink and the ACIR, and cases where families have been sent Centrelink letters, despite children being registered as fully immunised on the ACIR. Paediatricians are the key workforce in childhood immunisation; however, unlike, GPs, they are not automatically registered with the ACIR and the process to obtain or activate specialist ACIR registration is complicated. While specialists may have prescribed catch-up vaccines, they are usually not able to enter this information onto the ACIR, which reduces the opportunity to disseminate the workload and enhance ACIR recording.

Catch-up immunisation generally requires three visits over at least 4 months (four visits over 10 months for children aged 4–9 years), with several vaccines on each visit. Calculating catch-up schedules for migrant children is complex and far more difficult than providing a missed schedule point for an Australian-born child. Primary Health Networks and LGAs report that many GPs feel poorly equipped to deal with this complexity and the time requirements and, in Victoria, are deferring this work to LGAs.

The increase in workload is not reflected in funding arrangements, and the new provider catch-up incentive payments are not structured to support best practice immunisation. Catch-up incentive payments ($6 additional to ACIR notification payments) are only available for children aged less than 7 years, and for vaccines given after 1 January 2016 that are more than 2 months overdue. Thus, if an immunisation provider gives the first doses of a catch-up schedule and recalls the child 1 month later (the minimum interval and best practice), the second vaccinations will not trigger a catch-up incentive payment, as they are not considered to be overdue in relation to the first. Further, the national due and overdue rules in relation to hepatitis B8 are not consistent with the minimum catch-up dosing intervals recommended by the Australian immunisation handbook.9 Hepatitis B vaccination at 0, 1 and 4 months (minimum intervals) will register the child as overdue at the time of the final dose (3 months from previous dose), risking loss of Centrelink payments.

Finally, there is complexity concerning medical contraindications and natural immunity, in that the new legislation specifies that only GPs can provide this information. Many refugee children do not require hepatitis B (or other) vaccines, on the basis of natural immunity from infection or immunity from (undocumented) overseas vaccination. Hepatitis B serology is part of the routine post-arrival refugee health assessment, detecting both infection and immunity. Available Australian data suggest that around 30% of East African and 50% of Karen refugee children have immunity to hepatitis B,10,11 and 2–5% of African children are infected with hepatitis B.12 Many children have thus completed catch-up vaccination without needing hepatitis B (or other) vaccines, but will not be regarded as up to date on the ACIR. They will need a medical exemption form completed by a GP; however, many families have changed GPs in the years after settlement and/or were initially managed and immunised at specialist or nurse-led clinics. GPs will likely be asked to enter historical information on behalf of other providers (which will be almost impossible to verify) and there may be considerable reluctance to do so.

These issues are likely to create duplications within the health system in:

  • appointments — where children had specialist refugee health screening, it is feasible that an LGA may refer children to GPs who may refer them to specialists to clarify immunisation history and serology, who will then refer children back to the GPs for the medical exemption form, who in turn refer them back to the LGA for vaccine delivery;

  • serology — where there is no documentation, GPs and specialists (and families) may choose repeat hepatitis B serology instead of undertaking three immunisation visits; or

  • vaccines — where vaccination history or natural immunity cannot be established.

All these options incur additional costs and represent inefficiencies in the health system.

While the No Jab, No Pay policy offers an opportunity to improve immunisation coverage rates, the legislation will exclude thousands of Australia’s most disadvantaged families from Centrelink payments as a result of system issues rather than any form of conscientious objection. Clinical experience suggests that refugee background families are extremely pro-immunisation, which is consistent with the large numbers presenting to clarify their children’s immunisation status and access catch-up vaccinations. Unfortunately, the legislative and policy changes presume continuity of care, administration of early childhood vaccines during early childhood, prior use of the ACIR, and centralised immunisation delivery, which is not the reality for migrant families.

There are several strategies that could reduce the impact of the No Jab, No Pay measures on migrant children. There is a strong argument to apply the legislation prospectively (to children born 2009 onwards) or to extend the period before Centrelink payments are affected, allowing adequate lead time for entering data into the ACIR and obtain catch-up vaccination if needed. Due and overdue rules and catch-up incentive payments should be structured to support best practice, including removal of the payment age limit. Funding for catch-up vaccinations in those aged 10 years and older should be ongoing, and better resources to support providers, including a whole-of-life calculator and information on refugee immunisation, would increase efficiency and remove barriers to service delivery. Extending the ACIR across the lifespan offers an opportunity to address usability issues and capture relevant demography to monitor immunisation in this group. Finally, authority to document medical exemptions, specialist ACIR registration and workforce pressures require urgent attention. Fundamentally, good policy development should recognise that migration is part of the fabric of Australia, and it is not clear this has been adequately considered in the implementation of No Jab, No Pay.

Box –
Family assistance payments affected by the No Jab, No Pay measures

  • Family Tax Benefit Part A (FTB-A) is a two-part payment supporting disadvantaged families with dependent children or secondary students younger than 20 years of age, consisting of an adjusted base rate and a supplement of up to $726.35 per child at the end of the financial year. The maximum adjusted taxable income limits for FTB-A are over $100 000, and it is likely most refugee background families will be eligible for this payment.
  • The Child Care Benefit supports costs of registered/approved childcare and outside-school-hour care, with current rates of $4.17 per hour or $208.50 per week (85% for school-aged children), which is income-tested and adjusted for family size, service type and hours attended.
  • The Child Care Rebate (non-income-tested) covers 50% of out-of-pocket expenses for childcare to an annual limit for each child, in addition to other childcare assistance.
  • Together, these benefits are a substantial support for families with children. For further information, go to https://www.humanservices.gov.au/customer/subjects/payments-families.

[Comment] Renewing commitments to physical activity targets in Thailand

The Lancet 2016 Series on physical activity provides global evidence on how physical activity contributes to healthy nations through primary prevention of non-communicable diseases (NCDs), a growing epidemic.1–4 The Series presents compelling evidence on the benefits of physical activity not only for health, but also for social, environmental, and economic outcomes.2,5

Primary amoebic meningoencephalitis in North Queensland: the paediatric experience

Primary amoebic meningoencephalitis (PAM) is a rare but fulminant disease leading to diffuse haemorrhagic necrotising meningoencephalitis, and has a very poor prognosis.1 Naegleria fowleri is the causative agent. At Townsville Hospital, our first confirmed case of PAM was an 18-month-old girl from a rural location in North Queensland who presented with fever, seizures and an altered level of consciousness.2 Organisms resembling Naegleria spp. were seen on microscopy of cerebrospinal fluid (CSF). Despite aggressive therapy with multiple antimicrobial agents, the patient died within 72 hours of presentation. An older sibling of the patient had presented with a similar syndrome several years earlier and had died of an undifferentiated meningitic illness. The sibling was retrospectively suspected to also have had PAM.2

Our second confirmed patient presented in early 2015. A previously well 12-month-old boy from a nearby West Queensland cattle-farming area had had a 36-hour history of fevers, rhinorrhoea and frequent emesis, which progressed to lethargy and irritability. Before arrival at the local rural hospital, he had a tonic–clonic seizure lasting 3–5 minutes. On arrival he appeared drowsy, had mottled skin, a blanching maculopapular rash, which may not necessarily have been related to PAM, and a central capillary refill of 3–4 seconds. He was treated with intravenous antibiotics for presumed bacterial meningitis. Given the remote location and clinical suspicion of elevated intracranial pressure, lumbar puncture was not performed. On arrival at Townsville Hospital, his Glasgow Coma Scale score was 8/15, he was increasingly febrile, and had an evolving maculopapular rash. Broad spectrum antimicrobial therapy was subsequently started for presumed meningoencephalitis. Within 18 hours of leaving home, he had no spontaneous respiratory effort, reduced tone, up-going plantar reflexes and fixed pupils.

Neuroimaging showed diffuse cerebral oedema with progressive dilation of the ventricular system on sequential studies. An external ventricular drain was placed because of clinical instability, and CSF microscopy showed motile trophozoites on a wet preparation and Giemsa stain, consistent with N. fowleri. The patient was commenced on intrathecal amphotericin, with no improvement in his clinical state. The organism seen in the CSF was confirmed after the patient’s death by polymerase chain reaction (PCR) analysis as being N. fowleri. When reviewing the patient’s history, it was noted that, as in previous cases, he lived on a property that used untreated and unfiltered bore water domestically, to which he had multiple potential exposures, including via water play with hoses and bathing.

Literature review

We searched the PubMed database using the terms “Naegleri”, “fowleri” and “meningitis”. No time period was specified. The James Cook University eJournal database was searched for historical information.

We also searched the Queensland Health Communicable Diseases Branch and the Communicable Diseases Network Australia databases for Australian cases, but, as N. fowleri infection is not a notifiable disease, this returned a low yield.

History of Naegleria fowleri

In 1899, the Austrian scientist Franz Schardinger published the first description of an amoeba that transforms into a flagellate, with drawings of the amoeba, cysts and flagellates. In 1912, Alexeieff coined the name Naegleria, but physicians at the time thought that the genus did not cause disease in humans.3 It was not until the late 1960s that Naegleria was implicated as the cause of PAM by the work of Adelaide pathologists Malcolm Fowler and Rodney Carter, and of South Australian rural general practitioner Robert Cooter. In 1965, it was first proposed that the organism entered the CSF through the cribriform plate after Fowler isolated the organism in autopsy specimens. Following communication of his findings, Cooter and colleagues were able to directly observe the live amoeba in a CSF sample from a 10-year-old boy who presented with meningoencephalitis.4,5

Pathophysiology

N. fowleri lives and multiplies in warm freshwater areas, and acquisition is often associated with water-based recreational activities.6 Infection may occur when contaminated water is flushed into the nasal cavity. After penetrating the nasal mucosa and passing through the cribriform plate, trophozoites migrate along the olfactory nerve directly into brain tissue. Cases are almost universally fatal, although survival has been reported in the literature following early diagnosis and management.7,8

Epidemiology

The worldwide incidence of PAM is not accurately known,9 and the disease is likely to be under-diagnosed and under-reported. In the developing world, numerous factors affect accurate identification, including a lack of resources or expertise in microbiological diagnosis; prioritising management of other infections that are more common; and cultural beliefs that prevent autopsies.9 Higher water temperatures, inadequate sanitation, unsafe water sources, and religious ablution practices, such as the use of Neti pots for nasal cleansing, could potentially increase the risk for acquiring PAM.10,11 N. fowleri is a thermophilic organism and would therefore be expected to occur more frequently in tropical areas; however, the majority of cases are reported from subtropical or temperate regions.12 In a study in Karachi, Pakistan, N. fowleri was recovered from 8% of 52 domestic water taps that were sampled.13

An epidemiological review of PAM cases in the United States showed that N. fowleri infections are rare and primarily affect younger males exposed to warm recreational freshwater in the southern states.1416 There are two case reports of patients who acquired N. fowleri from using treated municipal water for nasal irrigation,17 and another patient who contracted the disease from inadequately treated municipal water.18

In Australia, Dorsch and colleagues reported 20 cases of PAM, 13 of which occurred between 1955 and 1972 in South Australia. These cases were attributed to household water that was piped overland for long distances,19 allowing it to be heated to temperatures that promoted growth of the amoeba.5 After the introduction of continuous water chlorination in 1972, only one further case was reported in South Australia in 1981.19 In Queensland, only three previous patients have been described in the literature: one from Mount Morgan who survived, one from Charters Towers,19 and one referred from North West Queensland to Townsville Hospital.2

Clinical challenges

Patients with PAM present with the same symptoms as those with bacterial meningitis, and clinical differentiation between the two conditions is impossible. Patients often have a history of recent exposure to warm fresh water, although the definite exposure event is not always identified.9 The incubation period ranges from 2 to 15 days, and presenting symptoms may include meningism, fever, confusion and signs of elevated CSF pressure, such as seizures or coma.14

Diagnosis is made more difficult in North Queensland by the vast distances between remote towns in the western part of the state. Townsville Hospital services an area of nearly 150 000 km2 and has the only dedicated paediatric intensive care unit north of Brisbane. Patients with PAM inevitably require intensive care unit management and tertiary level investigations. Obtaining CSF samples for formal microscopic diagnosis is often impossible in small clinics with limited medical imaging or local laboratory services, and where performing a lumbar puncture is contraindicated by symptoms of raised intracranial pressure. Because of the rarity of the infection, greater awareness of PAM among primary health care professionals is required in order to increase suspicion in a clinically compatible case. Most importantly, education about prevention is essential for the continued health of rural communities, of which local medical professionals are a vital part. To this end, recent guidelines for the management of encephalitis20 include assessing risk factors for this condition and performing appropriate testing, as described below.

Diagnostic challenges

Diagnosis requires identification of motile trophozoites in CSF or characteristic morphology in stained specimens by a trained microbiologist (Box 1), with confirmation using molecular methods (PCR) or culture (Escherichia coli lawn culture). The trophozoites are visible in a wet unstained preparation of CSF (magnification, × 400), exhibiting sinusoidal movement by means of lobopodia; however, specimens need to be examined very soon after collection, as the amoebae degenerate rapidly in vitro and can be easily mistaken for leucocytes.

CSF chemistry is not diagnostic and will usually reveal a similar pattern to that of bacterial meningitis (Box 2). PCR analysis is performed using in-house methods at reference laboratories, and confirmation is often posthumous due to the rapid decline experienced by most patients. The US Centers for Disease Control and Prevention has developed a multiplex real-time TaqMan PCR assay to simultaneously identify three free-living amoebae (N. fowleri, Acanthamoeba spp. and Balamuthia mandrillaris) in clinical specimens.21 In Queensland, the pathology laboratory which performs all N. fowleri molecular testing uses primers and probes in line with the method of Qvarnstrom and colleagues.21 Culture may take several weeks and is difficult to perform.

Treatment

Given the limited data available, there are no set guidelines for antimicrobial therapy; however, it can be extrapolated from cases of patients who have survived that combination therapy with multiple anti-parasitic agents is required.

In 1969, Carter was able to demonstrate the sensitivity of the organism to amphotericin B (AMB) and it has remained the mainstay for treatment of PAM to this day.22 AMB has been used in all patients who have survived the illness.23 N. fowleri is highly sensitive to AMB in vitro with a minimum amoebicidal concentration of 0.01 μg/mL,24 and no resistance has been reported. Conventional AMB is preferred to liposomal forms as it can be given intrathecally as well as intravenously. Despite this, only a few patients have survived.25

Other antifungal drugs, such as miltefosine and the azoles, have all shown in vitro activity against N. fowleri.2224 Miconazole has synergistic activity when combined with AMB, and fluconazole is used as first line in combination therapy.

Miltefosine is a protein kinase B inhibitor that was originally developed as an antineoplastic agent. It also has anti-parasitic activity and is used for the treatment of leishmaniasis. Schuster and colleagues26 reported that miltefosine showed in vitro activity against free-living amoebae, including N. fowleri, Acanthamoeba spp. and B. mandrillaris. Recently, miltefosine has been used in the treatment of Acanthamoeba granulomatous amoebic encephalitis and PAM. Linam and colleagues27 described the case of a child treated for PAM with combination therapy including amphotericin, miltefosine, fluconazole and rifampicin, who survived with no significant neurological sequelae.

Rifampicin is commonly used in the treatment of PAM; however, it has variable central nervous system penetration and poor efficacy in vitro.24 It may also reduce the efficacy of the azole drugs due to cytochrome P450 interactions. Although azithromycin has shown some in vitro and in vivo activity against N. fowleri, the other macrolides are less effective.9 Atypical agents such as the diamidines and chlorpromazine have been studied in animal models but have yet to be utilised clinically.24,28

Public health

As described, our patient was probably the third child to die with PAM in 14 years in a small area with a tiny population on remote Queensland cattle stations. As a response to the third death, a public health investigation found large numbers of N. fowleri at the patient’s homestead. In this district, water was sourced from deep artesian bores at about 60°C (Box 3) and cooled in open surface dams before being piped hundreds of metres on the surface to households, keeping water temperatures high. It was noted that the cases described in North Queensland were of children too young to be swimming in surface waters, the assumption being that they contracted the disease in the home environment. There had never been water treatment or filtration in the homesteads for generations; the clarity and taste of the bore water had often been a source of pride for owners. The difference in the present era of rural life was the advent of modern facilities, allowing the heated bore water to be pressurised via taps, hoses, toys and showerheads and delivered directly into the homestead.

The public health hypothesis was that:

  • Hot artesian bore water and long surface pipelines promote large concentrations of N. fowleri, which can be sucked into water pipes from sediments, particularly in drought years.

  • There had been no form of treatment for apparently clean water.

  • In recent years, among young families with modern water facilities, there were many more opportunities for water to be forced into a vulnerable (non-immune) child’s nose at pressure.

  • Simple filtration and disinfection of all water for washing and playing would prevent child deaths on these properties.

The public health dilemma was whether health promotion for a single, rare disease could be cost-effective or gain traction among rural people possibly reluctant to accept an expensive treatment of their water. Untreated surface water can also lead to a whole spectrum of gastrointestinal diseases, even if these were not familiar to the remote communities. It was decided that a health promotion campaign about domestic water filtration and treatment could protect not only from PAM but also from a range of other diseases.

The family of our second confirmed patient embarked on a rural education campaign of their own to prevent any further deaths from PAM or other waterborne diseases, culminating in an episode of the television series Australian Story in November 2015.29 To coincide with this story, public health physicians gave a series of talks to communities and health staff across a wide area of outback Queensland. To follow up the face-to-face campaign, Queensland Health released a safe water booklet with advice on cost-effective filtration and disinfection.30 As a result, many rural properties and some small towns are installing water treatment equipment for the first time. The South Australian and Western Australian governments have online education resources specifically targeting rural communities at risk of amoeba acquisition,31,32 with the primary focus on prevention. The aim of the Queensland public health booklet was to provide a more comprehensive education document for water treatment in rural communities.30

Conclusion

We hope an increased awareness of N. fowleri and its association with warm, non-chlorinated water provides an opportunity for counselling families about safe water use: avoiding diving or jumping into or squirting untreated water, and disinfecting or filtering water used for washing and playing, as well as for drinking. In particular, bore water at warm or hot temperatures and other warm water sources should be considered ideal reservoirs for this organism. In the clinical setting, difficulties with analysing CSF make it unlikely that an accurate diagnosis could be provided in a remote environment. The presentation of an acutely unwell child with a history of bore water exposure and signs of meningitis or encephalitis should, however, prompt consideration of PAM as a potentially life-threatening diagnosis. Our experience with this disease clearly demonstrates the crucial role of medical professionals working in rural and remote Australia in primary prevention of this almost universally fatal condition.

Box 1 –
Microscopy of cerebrospinal fluid of Patient 2,showing trophozoites (Giemsa stain, black arrows) and mononuclear leucocytes (white arrows)

Box 2 –
Analysis of cerebrospinal fluid (CSF) in patients with primary amoebic meningoencephalitis at Townsville Hospital

Microscopy

White cell count (106/L)

Polymorphonuclear leucocytes

Protein (mg/L)

CSF:blood glucose


Normal

No organisms

< 1

0

< 0.4

> 0.6

Patient 1

Motile trophozoites

7200

91%

3900

0.17

Patient 2

Motile trophozoites

240

54%

2700

0.12


Box 3 –
Great Artesian Basin


The Great Artesian Basin, from which bore water comes, covers a vast area of rural Australia. Western Queensland has a particularly wide coverage, and rural properties use bore water extensively.

Source: Australian Government Department of Sustainability, Environment, Water, Population and Communities, 2011. Available at http://www.agriculture.gov.au/water/national/great-artesian-basin (accessed Aug 2016).

No link between ‘obesity gene’ and ability to lose weight

People who have one of the genetic profiles associated with obesity, known as the FTO gene, respond equally well to diet, exercise, and drug-based weight loss interventions as the rest of the population, a study has found.

The findings, published this week in The BMJ, indicate that the FTO gene does not appear to affect a person’s ability to lose weight.

An international team of researchers tested the relation between the FTO gene and weight loss interventions using data from almost 10,000 participants in eight randomised control trials.

Participants with the FTO gene were slightly heavier (0.89 kg) than those not carrying the gene at the start of the trials (baseline). The researchers could find no relation between FTO and the ability to lose weight whereby changes in body mass index, body weight, and waist circumference by FTO genotype did not differ by intervention, ethnicity, sample size, sex, or baseline body mass index and age.

Related: Obesity: we know what to do

In a linked editorial, Dr Alison Tedstone, Public Health England’s chief nutritionist, said while the causes of obesity were multiple and complex, current evidence suggested that they have little to do with gene profiles.

Dr Tedstone said that personalised obesity interventions based on the genome may not be effective in the short term, and that an examination of environmental factors could be more beneficial.

“A rebalancing of research towards whole systems approaches including environmental drivers may be of greater benefit to the population in the long term,” she said.

The study authors acknowledged limitations in their analysis, but said it had been an important finding for the development of effective weight loss interventions in the context of the global epidemic of obesity.

Obesity is a major public health burden and its prevalence is increasing worldwide. With an estimated 2.1 billion adults now overweight or obese, there is an urgent need to develop more effective strategies for preventing and managing obesity.

One in five children in NSW now qualifies as overweight or obese, according to a recent state government report.

Latest news

Australia’s Health 2016 report card: experts respond

Australians are living longer than ever but with higher rates of chronic disease, the latest national report card shows.

According to the Australian Institute of Health and Welfare’s Australia’s Health 2016 report, released today, Australian boys can now expect to live into their 80s (80.3), while the life expectancy for girls has reached the mid-80s (84.4).

The single leading cause of death in Australia is coronary heart disease, followed by:

  • dementia
  • stroke
  • lung cancer
  • chronic obstructive pulmonary disease.

Grouped together, cancer has overtaken cardiovascular disease (heart disease and stroke) as Australia’s biggest killer. Cancer is also the largest cause of illness, followed by cardiovascular disease.

Chronic diseases are becoming more common, due to population growth and ageing. Half of Australians (more than 11 million) have at least one chronic disease. One quarter have two or more.

The most common combination of chronic diseases is arthritis with cardiovascular disease (heart disease and stroke).

Australians have high rates of the biomedical risk factors that increase the risk of heart disease and stroke. Almost a quarter (23%) of Australian adults have high blood pressure and 63% have abnormal levels of cholesterol.

Lifestyle choices

From Jackson-Webb, Health + Medicine Editor, The Conversation

The good news is Australians are less likely to smoke and drink at risky levels than in the past.

Australia now has the fourth-lowest smoking rate among 34 OECD countries, at 13% in 2013. This is almost half that of 1991 (24%).

The volume of alcohol Australians consume fell from 10.8 litres per person in 2007–08 to 9.7 litres in 2013–14. This is the lowest level since 1962–63. But 16% of Australians are still drinking to very risky levels: consuming 11 or more standard drinks on one occasion in the past 12 months.

Around eight million Australians have tried illicit drugs in their lifetime, including 2.9 million in the last 12 months. The most commonly used illicit drugs are cannabis (10%), ecstasy (2.5%), methamphetamine (2.1%) and cocaine (2.1%).

Use of methamphetamine has remained stable in recent years. However, more methamphetamine users are opting for crystal (ice) rather than powder (speed).

The bad news is Australians are still struggling with their weight. Around 63% are overweight or obese, up from 56% in 1995. This equates to an average increase of 4.4kg for men and women. One in four children are overweight or obese.

Junk foods high in salt, fat and sugar account for around 35% of adults’ energy intake and around 39% of the energy intake for children and young people.

Most Australians (93%) don’t consume the recommended five serves of vegetables a day and only half eat the recommended two serves of fruit. Just 3% of children eat enough vegetables, though 70% consume the recommended amount of fruit.

Almost half (45%) of adults aged 18 to 64 and 23% of children aren’t meeting the national physical activity recommendations. These are for adults to accumulative 150 to 300 minutes of moderate intensity physical activity or 75 to 150 minutes of vigorous intensity physical activity each week. Children are advised to accumulate at least 60 minutes of moderate to vigorous physical activity every day.

Lifestyle choices have a huge impact on the risk of chronic disease; an estimated 31% of the burden of disease in Australia could have been prevented by reducing risk factors such as smoking, excess weight, risky drinking, physical inactivity and high blood pressure.

Preventing chronic disease

Rob Moodie, Professor of Public Health, University of Melbourne

This report outlines a number of positives in Australia’s health – our life expectancy, the health services at our beck and call, major declines in tobacco and road deaths. We’re doing well, it says, but we could do better.

If we took prevention and health promotion far more seriously, we could do a lot better.

The report nominates tobacco use, alcohol, high body mass and physical inactivity as the chief causes of preventable illness and the chief causes of our increasing level of chronic illnesses. Yet national investment in prevention is declining.

Tobacco use is rapidly declining because of really effective measures (plain packaging, advertising bans and increasing price through taxes) that save lives and enormous amounts of money over a lifetime for people who used to smoke.

However, we can’t seem to make any major dent in the commercial, industrial and lifestyle diseases related to junk food and drinks, harmful consumption of alcohol and car dependency.

We’ve known what will work for many years but the power of some of these unhealthy industries is still overwhelming – a situation in which our politicians fear these industries and their associations more than they fear the voters.

Our collective health would have been much better if we’d been able to follow the guidance of our own national task forces and learnt from other countries. The report card should read, “Doing well, but could have done a lot better”.

Inequities

Fran Baum, Matthew Flinders Distinguished Professor and Foundation Director at the Southgate Institute for Health, Society & Equity, Flinders University

Australia’s Health 2016 shows many Australians are not getting a fair go at health. There is a gradient across society whereby the richer the area you live in, the longer you can expect to live. The difference between the highest and lowest is four years.

The gradient is evident from early life. Children most at risk of exclusion – those from poor areas who experience problems with education, housing and connectedness – are most likely to die before they reach 15 years from potentially preventable or treatable causes.

Our most glaring inequity is the ten-year life gap between Aboriginal and Torres Strait Islander Australians and others. Indigenous life expectancy is 69.1 years for males and 73.7 years for females.

Compared with the non-Indigenous population, Indigenous Australians are:

  • 3.5 times as likely to have diabetes and four times as likely to be hospitalised with it or to die from it
  • five times as likely to have end-stage kidney disease
  • twice as likely to die from an injury
  • twice as likely to have heart disease.

Australians living outside major cities have higher rates of disease and injury. They also live in environments that make healthy lifestyles choices harder (such as more difficulties buying fresh fruit and vegetables) and so their risk of chronic diseases is increased.

The data on who has private health insurance coverage points to the emergence of a two-tiered health system, where those who can afford to pay receive better access and quality of care. Just 26% of those in the lowest socioeconomic group have cover compared to about 80% of the top group.

Cost of care

Professor Stephen Duckett, Director of the Health Program at Grattan Institute

Over the last decade, health expenditure grew about 5% each year, above the 2.8% average growth in Gross Domestic Product (GDP). As a result, health took up an increasing share of GDP.

Spending more on health means Australia spent less on other things. This is not necessarily bad, as long as the benefits from that increased expenditure – such as increasing life expectancy or increased quality of life – are worth the increased costs.

But spending above GDP growth cannot continue indefinitely. And the last few years saw an increase in rhetoric about health spending increases being “unsustainable” from so-called “futurists” and politicians.

Informed commentators have generally rejected the unsustainability claim, some labelling it a “myth”, while others take a more nuanced view.

Australia’s Health 2016 shows a slowing of the real growth rate in the most recent two years to about half that of the previous decade – 1.1% from 2011-12 to 2012-13 and 3.1% from 2012–13 to 2013–14.

This suggests the “unsustainability” rhetoric is at least overblown and potentially prompting budget decisions which are counter-productive, such as introducing a co-payment for general practice.

Commonwealth government expenditure was more or less stable over these most recent two years, declining 2.5% initially then increasing 2.4% in the last year.

Savings to the government came from shifting costs to consumers, by slowing the growth in government subsidies to private health insurers, and also by slowing spending on pharmaceuticals.

This latter slowdown was achieved through tighter controls on payments to drug manufacturers and because some big-selling drugs came off patent, resulting in falls in prices.The Conversation

Stephen Duckett, Director, Health Program, Grattan Institute; Fran Baum, Matthew Flinders Distinguished Professor, Foundation Director, Southgate Institute for Health, Society & Equity, Flinders University, and Rob Moodie, Professor of Public Health, University of Melbourne

This article was originally published on The Conversation. Read the original article.