×

Diabetes apps: regulation concerns grow

PATIENTS with diabetes should be warned about the potential for insulin dosing errors with glycaemic control smartphone apps, experts warn, as regulators struggle to oversee the rapidly growing sector.

There are over 1500 diabetes apps available online – a number growing faster than any other health care sector, according to Dr Rahul Barmanray and Dr Esther Briganti, Melbourne endocrinologists writing in this week’s MJA.

“Although apps increasingly advise on insulin doses, there is minimal published information on safety and efficacy, despite these apps effectively providing drug treatment recommendations without health care professional oversight,” they wrote.

Most diabetes apps are not listed with the Therapeutic Goods Administration (TGA), but even those that are have not been required to undergo third-party assessment as they are only Class I devices. Dr Barmanray and Dr Briganti wrote that as a result, the Australian public were not receiving the health and safety protection they ought to reasonably expect from the regulator.

A spokesperson for the TGA told MJA InSight it was considering stricter regulation of the sector, consistent with reforms in Europe.

“The new rules [in Europe] capture decision making software like dosage calculators … [These] apps will now be a higher classification requiring third-party certification. Australia is preparing to undertake consultation for similar regulatory reforms,” the spokesperson said.

The new rules align with the categories proposed by an international working group, which included the TGA.

However, the TGA has previously highlighted challenges with regulating the fast-moving medical software sector. In a recent presentation, TGA Medical Officer Dr David Hau highlighted the problem of “feature creep”, in which therapeutic functions are added to new updates without regulatory oversight.

The most popular diabetes apps in Australia are the companion apps to diabetes pumps, which are regulated as part of the entire glucose monitoring or insulin delivery system, Dr Barmanray noted. However, many apps are developed by home-tinkerers.

Simon Carter is a lead software engineer. He has also lived with type 1 diabetes for 29 years. He developed an Australian app when his daughter was diagnosed with the disease. He told MJA InSight that he would not welcome greater regulation of medical apps.

“It is already too costly, and existing regulation is too outdated to capture the nuances offered by apps,” he said.

Mr Carter said that some patients were using the app to guide multiple daily insulin injections, others were using it in conjunction with an insulin pump.

Mr Carter argued that it was “absurd to imply that only doctors or diabetes educators can provide insulin dose advice”.

“My practical experience and self-education far outstrips the content of the 1-year part-time diabetes educator course.

“Diabetes is probably the only disease where the doctor provides a suggested dose and the patient has to tailor that multiple times per day based on food intake, activity level, blood sugar results and other factors,” he said.

“The doctor is not there to provide round-the-clock guidance, and this is why these apps are so important.”

Dr Barmanray and Dr Briganti urged health care professionals to “remain circumspect” about recommending diabetes apps – especially those with therapeutic functions – in the absence of adequate regulatory safeguards.

They cited the largest review of insulin dose calculation apps to date, which found that of 46 apps, only one was without a safety concern.

Some apps had design flaws that made them more prone than others to patients incorrectly entering data, the study found.

Others had fundamental problems with the underlying software, with two-thirds carrying the risk of generating incorrect and hypoglycaemia-inducing outputs despite data being correctly entered.

Dr Barmanray and Dr Briganti warned: “It is unclear who, if anyone, is medico-legally responsible for adverse effects related to app-derived therapeutic recommendations”.

Mr Carter commented: “We take total responsibility for both preventing patients receiving flawed advice from the app, as well as promptly correcting any issues that might occur.”

Professor Jane Speight, Foundation Director of the Australian Centre for Behavioural Research in Diabetes at Deakin University told MJA InSight that patients should treat diabetes apps as “tools with limitations”.

“The very use of the term ‘[dose] calculator’ implies a level of accuracy that may not be appropriate or realistic,” she said. “That said, many people are making such decisions every day based on guesswork or informed by education undertaken at diagnosis. So, I think we need to be realistic that people will try these apps.”

Professor Speight said that there were promising examples of industry and academia now working together to carefully develop diabetes apps with appropriate regulatory considerations.

“The opportunity to reduce the cognitive and psychological burden of managing diabetes is quite considerable,” she said. “However, we do need the reassurance that industry will go through appropriate steps to ensure the safety and effectiveness of these apps before we can recommend them wholesale.”

The TGA encourages users of medical device software, including apps, to report any issues encountered, even if they may be considered “user errors” or fixable by a reboot.

Between 2016 and 2018 the TGA recalled four diabetes apps – three by Roche (Accu-Check) and one by Medtronic (Guardian). Errors in the apps could have led to incorrect bolus insulin advice or to patients not receiving alerts associated with hypoglycaemic or hyperglycaemic events, the TGA warned.

Professor Speight recommended the T1 Resources website, which provides advice and recommendations about apps and other resources for type 1 diabetes.


This article was first published by MJA InSight. Read the original version here.

How weight loss surgery affects marriage and relationships


People who have undergone bariatric surgery are more likely to divorce if they were married before the intervention, and more likely to get married if they were previously single, a first-of-its-kind study has found.

The finding shows that although improving physical health is the key motivator for weight loss surgery, it often impacts on the patient’s personal life as well, the Swedish study authors say.

The study, published in JAMA Surgery, looked at two large cohorts, the first with nearly 2000 bariatric surgery patients plus matched obese controls, and the second with nearly 30,000 patients matched with general population controls.

In the first group, those who were single at the time of the surgery were twice as likely to be married or in a new relationship after four years, compared with obese controls, and were still substantially more likely to be in a relationship at ten years. And in the second group, new marriages and relationships were 24% more likely than in the single general population.

But separations and divorces among those in a relationship at the time of surgery were also more common than in both obese and general population controls.

The authors argue that the two findings are probably the result of a new-found self-confidence that patients have after their intervention. For those who are single, that confidence allows them to engage in social activities that they would have shunned before and opens up the possibility of new relationships. For those already married or in a relationship, the surgery may change the power dynamics of that relationship, giving people more confidence to exit a relationship that isn’t working or making them happy.

In a linked commentary, two US-based surgeons say the new research has important implications.

“From a research perspective, we must continue to explore the causes of relationship disruption and initiation so that health care professionals can support patients before and after surgery,” they write.

This will help reassure patients that bariatric surgery is not only the most effective treatment for severe obesity, but also “an extremely powerful tool for positive transformation in their lives”.

You can access the full study here.

Have we got the causes of type 2 diabetes wrong?


The proportion of adults with diabetes around the world has risen from 4.7% in 1980 to more than 8.5% today. More than 422m people now suffer from diabetes – so there is an urgent need to better understand the disease and develop new treatments. However, new research from Heidelberg University in Germany suggests that we may have got the causes of type 2 diabetes wrong. But have we? And if so, how might it affect treatment?

People with diabetes need to carefully monitor their blood-sugar levels. This is important, as it helps to reduce the risk of developing complications, such as heart disease and blindness. But even with good control of blood-sugar levels, people with diabetes often go on to develop further complications, including nerve damage and kidney damage. This suggests that effective treatment of diabetes requires more than simply good control of blood-sugar levels.

Type 2 diabetes – often associated with obesity – happens when the pancreas doesn’t release enough of the hormone, insulin, or the body’s cells don’t react to insulin. (Insulin helps the body use glucose for immediate energy needs or store it for future energy needs.) This means that sugar (glucose) stays in the blood and isn’t used as fuel for energy. The cause of these defects remains controversial.

The latest research, published in Cell Metabolism, suggests that a molecule called methylglyoxal (MG) may cause many of the defects associated with type 2 diabetes. But what does it do?

MG is a reactive metabolite (a byproduct of cells) that leads to the formation of other powerful molecules that are readily able to modify protein, fats and DNA in cells. This typically prevents those molecules from working – and this can then result in cells no longer functioning properly. These events are known to lead to the development of diseases such as atherosclerosis, which can trigger strokes and heart attacks.

MG is formed as a result of metabolic pathways – a linked series of chemical reactions occurring in a cell – that are overactive in diabetes and obesity. So it was previously thought that MG production was the result of obesity and diabetes. However, this new research suggests that MG might also contribute to the development of these conditions.

Using genetic engineering, the researchers turned off the enzyme that breaks down MG in flies. MG then accumulated in their bodies and the flies developed insulin resistance. Later they became obese and as time went on their glucose levels subsequently also became disrupted.

These new findings might help explain why, even with good control of blood-sugar levels, diabetic complications still develop. There are important implications from this work, as this suggests that it might be possible to slow down – or even prevent – diabetes complications from developing through a combination of good glucose control along with MG reduction.

An obese fruit fly from the experiment. Its body fat glowing with green fluorescence.
Aurelio Teleman

What does it mean for diabetes treatment?

While diabetes treatments are often effective at bringing blood-sugar levels down, over time their effectiveness usually decreases. As such there is an urgent need to develop new drugs that work to control diabetes and its complications in different ways.

Most current strategies aim to stop the development of type 2 diabetes by targeting cells and tissues linked to insulin secretion from the pancreas, glucose uptake into cells, or by preventing glucose release from stores in the liver. Together these strategies can help control blood-sugar levels.

The new research, however, suggests that in addition to controlling blood-sugar levels we should also consider additional treatments that work by preventing reactive metabolites, such as MG, from forming. But what would be the best way to achieve this?

Reactive metabolites can lead to extensive damage within cells. There is good news, though, in that there are molecules that can effectively stop these products from forming.

Antioxidants, such as vitamin C and vitamin E, have previously been suggested as possible diabetes treatments. However, studies using this approach have had mixed results. One possible explanation for this is that there are multiple reactive metabolites, not all of which are sensitive to antioxidants.

A new champion may now have emerged, though, in the form of the naturally occurring nutritional supplement called carnosine. This is a molecule that was recently shown to prevent formation of numerous reactive metabolites that are formed from glucose and fatty acids.

The ConversationClinical trials are ongoing, but initial findings are promising. They suggest that carnosine is able to reduce blood-sugar levels, as well as prevent multiple complications that are associated with diabetes. Even better, as this is classified as a dietary supplement rather than a drug, no prescription is needed in order to take carnosine.

Mark Turner, Associate Professor, Nottingham Trent University

This article was originally published on The Conversation. Read the original article.

Reducing cardiovascular disease risk in diabetes: a randomised controlled trial of a quality improvement initiative

The known Managing risk factors for cardiovascular disease (CVD) in patients with diabetes improves their outcomes, but many are not prescribed the recommended treatments. Electronic decision support is a scalable strategy for improving guideline implementation. 

The new The implementation of recommended management of CVD risk factors in people with diabetes is incomplete, but better than for patients without diabetes. An electronic decision support tool achieved modest improvements in CVD risk factor screening and treatment escalation in patients with diabetes. 

The implications While computerised tools may play an important enabling role, broader strategies are needed to close evidence–practice gaps. 

By 2030, diabetes may affect more than 300 million people worldwide.1 Cardiovascular disease (CVD) is the primary cause of mortality and morbidity in patients with type 2 diabetes,2 and large studies have found that managing risk factors for CVD in patients with diabetes reduces both.3,4 According to risk management guidelines, decisions about the need for and the intensity of intervention should be based on the estimated absolute risk.5

A number of guidelines for managing CVD risk in people with diabetes have been published, but studies in Australia6,7 and overseas810 have consistently found that these strategies have been only incompletely implemented. Most Australian studies, however, predate a number of targeted quality improvement (QI) programs, including the National Divisions Diabetes, Australian Primary Care Collaboratives, and National Integrated Diabetes Programs, as well as the introduction of targeted incentive payments to general practitioners and practices, and may therefore not accurately reflect current practice. Whether any of these initiatives improved quality of care is unknown.

In this article we describe the contemporary primary care management in Australia of patients with diabetes participating in a study of CVD risk management in primary health care. Our primary objectives were to assess adherence to CVD risk screening and management guidelines, and to determine the effectiveness of a new QI intervention for improving risk management. The main results of the QI study have been published elsewhere;11 we report here a subgroup analysis comparing the outcomes for patients with and without diabetes.

Methods

The Treatment of Cardiovascular Risk in Primary care using Electronic Decision Support (TORPEDO) study was a parallel arm, cluster randomised, controlled trial involving 60 Australian primary health care services (40 general practices and 20 Aboriginal Community Controlled Health Services [ACCHSs]). It assessed whether a QI intervention combining point-of-care electronic decision support with audit and feedback tools improved CVD risk management. The TORPEDO study methods have been described in detail elsewhere.11

Practice eligibility criteria

Health services were eligible to participate if they exclusively used either of the two most common electronic health record systems in Australia for recording risk factor information, pathology test results and prescribed medications. General practices from the Sydney region were recruited between September 2011 and May 2012 through primary health care networks (previously: Medicare Locals), and ACCHSs through two state representative bodies in New South Wales and Queensland.

Patient eligibility criteria

Eligible patients were Aboriginal and Torres Strait Islander people at least 35 years old and non-Indigenous people at least 45 years old (age ranges based on national CVD risk guidelines5) who had attended a participating service at least three times during the preceding 24 months and at least once during the past 6 months. The presence or absence of diabetes was established by a recorded diagnosis of diabetes (type not specified) or a glycosylated haemoglobin (HbA1c) measurement at baseline of more than 53 mmol/mol. This threshold was chosen as a conservative estimate during the transition period in Australian diagnostic criteria for diabetes, which now recommend a threshold of 48 mmol/mol.

Randomisation

Services were randomised (1:1) to intervention or control groups, stratified at three levels: ACCHSs v mainstream general practices; service size (less than 500 v 500 or more eligible patients); and current participation in a national or state QI program. Permuted block randomisation was performed centrally; outcome analyses were blinded to allocation.

Intervention

Full details of the intervention have been published previously.12 In brief, a screening and management algorithm was developed and validated, based on a synthesis of recommendations from several guidelines (online Appendix 1).13 The algorithm incorporated CVD risk assessment, as well as recommendations for managing CVD, chronic kidney disease, blood pressure (BP) and cholesterol, but not for blood glucose management.

Five-year risk of a cardiovascular event was estimated with the Australian risk calculator, based on the 1991 Anderson Framingham equation.14 High CVD risk is defined in Australian guidelines5 as a calculated 5-year CVD risk of greater than 15%; the presence of diabetes in a person over 60 years old, diabetes together with albuminuria, estimated glomerular filtration rate (eGFR) below 45 mL/min/1.73 m2, systolic BP greater than 180 mmHg, diastolic BP greater than 110 mmHg, or total blood cholesterol level over 7.5 mmol/L; or the presence of CVD, defined as a recorded diagnosis of coronary heart disease, cerebrovascular disease (ischaemic stroke or transient ischaemic attack), or peripheral vascular disease. Risk was based on the most recent available results, whether or not the participant was being treated for that risk factor.

The algorithm interfaced directly with the two eligible electronic records systems. Data from the patient record were automatically prepopulated in the tool, and used to generate point-of-care CVD risk management recommendations. A data extraction tool provided site-specific audits, and feedback performance reports were generated. Clinical staff were trained in the application of the tool and had access to a support desk and bi-monthly webinars. The intervention lasted a minimum of 12 months.

Data collection

De-identified data for all patients who met the eligibility criteria were extracted from the clinical database of each health service with a validated data extraction tool.15 The extracts were uploaded to the study database together with an encrypted identifier code.

Outcomes

The primary outcomes for the randomised trial11 were:

  • The proportion of eligible patients who received appropriate screening for CVD risk factors by the end of the study. This was defined as data for all relevant risk factors having been recorded or updated (smoking status, BP in the past 12 months, total blood cholesterol and high-density lipoprotein (HDL)-cholesterol levels in the past 24 months).

  • The proportion of patients at high CVD risk at baseline who were receiving recommended medication prescriptions at the end of the study (prescription of at least one BP-lowering drug and a statin for people at high risk without CVD; reduction of CVD risk to below 15% by the end of study; prescription of at least one BP-lowering drug together with a statin and an antiplatelet agent for people with established CVD, unless contraindicated by oral anticoagulant use).

Secondary outcomes included:

  • the primary outcomes for individuals at high risk who were undertreated at baseline;

  • measurements of individual CVD risk factors (smoking status, BP, blood lipid levels, body mass index [BMI], eGFR, albuminuria);

  • escalation of drug prescription for patients at high risk of CVD (either newly prescribed or additional antiplatelet, BP-lowering and lipid-lowering agents); and

  • BP and serum lipid levels in people at high risk of CVD.

Sample size

Randomisation of 60 services (30 per arm) would provide 90% power to detect an absolute higher occurrence of 10% for each primary study outcome in the intervention arm, assuming a 10% absolute improvement in the control arm, an average cluster size of 750 patients (30% of whom were at high risk of CVD), baseline risk factor measurement and prescribing rates of 50%, α = 0.05 (two-sided), and an intraclass correlation coefficient of 0.05.

Statistical analysis

Post hoc descriptive analyses of baseline data from the TORPEDO study and of data for the cohort of participants present at both baseline and study end were undertaken. Data are presented as means with standard deviations, medians with interquartile ranges, or proportions. Baseline differences between patients with and without diabetes were tested in generalised estimating equations (GEEs) with an exchangeable correlation structure to account for clustering of patients in services.

To determine the predictors of suboptimal drug therapy at baseline, cross-sectional analyses were conducted in a GEE model with logit link function, including both patient level characteristics and service level data. Associations between risk factors and drug therapy were expressed as unadjusted odds ratios (with 95% confidence intervals [CIs]) for binary outcomes.

Intervention effects were analysed by log-binomial GEE regression. The rate ratios of intervention effect were calculated for the individual outcomes at the end of the study. The effects of the intervention in the subgroup of undertreated participants at baseline were analysed in the same model, stratified by diabetes status. An interaction term was included in all models to assess heterogeneity of effects by diabetes status.

Statistical analyses were conducted in SAS Enterprise Guide 5.1 (SAS Institute).

Ethics approval

The study was approved by the University of Sydney Human Research Ethics Committee (HREC) (reference, 2012/2183) and the Aboriginal Health and Medical Research Council of New South Wales HREC (reference, 778/11). Signed agreements with participating sites were obtained. Individual consent waiver was granted because data were collected from de-identified extracts from the electronic health record system.

Results

Recruitment

Sixty-four services were initially recruited; 31 were randomised to the intervention arm (but one withdrew shortly after randomisation) and 30 to usual care (online Appendix 2). Baseline data were extracted for 53 164 patients, including 8829 with diabetes; a cohort of 38 725 (6909 with diabetes) were followed up for outcome evaluation. The median follow-up time was 17 months.

Sample characteristics at baseline

Of the 8829 patients with diabetes at baseline, most had a recorded diagnosis of diabetes (97%); 3% were defined by HbA1c levels exceeding 53 mmol/mol. The mean age, and the proportions who were men, smokers or Indigenous Australians were higher for people who had diabetes than for those who did not. Their mean systolic BP and blood triglyceride levels were also higher, while their low-density lipoprotein (LDL)- and HDL-cholesterol levels were lower. Albuminuria, renal impairment and an established diagnosis of CVD were more common in people with diabetes (for all differences: P < 0.001; online Appendix 3).

Recording of risk factors and CVD risk at baseline for people with diabetes

Overall, appropriate measurement of CVD risk factors in people with diabetes was greater than for those without diabetes (62.0% v 39.5%; P < 0.001; online Appendix 3), a difference that remained after adjusting for age, sex, and Indigenous status (P < 0.001). BMI was recorded for 81% of people with diabetes, smoking status for 89%, HbA1c levels for 86%, systolic BP for 94%, albuminuria assessment for 59%, and eGFR for 87%. Recording rates for total, LDL- and HDL-cholesterol levels were 87%, 82% and 79% respectively.

More than one-quarter of patients with diabetes (26%) had established CVD; a further 12%, 4%, and 49% had an estimated 5-year CVD risk that was low (< 10%), medium (10–15%), or high (> 15% or clinically high risk condition present) respectively. There was insufficient information for 825 patients (9%) to categorise their risk (online Appendix 3).

Prescribing rates at baseline for people with diabetes at high risk of CVD

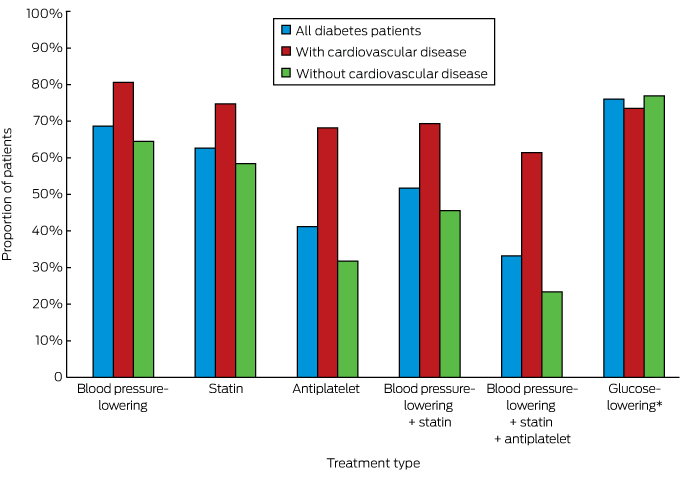
Appropriate prescribing of medications for those identified as being at high risk of CVD was greater among people with diabetes than for those without diabetes (55.5% v 39.6%, P < 0.001; online Appendix 3). Overall, 52.4% of people with diabetes at high risk of CVD but without established CVD and 61.4% of patients with diabetes and established CVD were prescribed recommended medications for averting CVD; the corresponding figures for people without diabetes were lower (22.0% and 49.3% respectively; for each comparison, P < 0.001) (online Appendix 3). The individual medication types prescribed for people with diabetes are shown in Box 1.

Risk factor targets

The HbA1c levels of 57.3% of patients with diabetes exceeded 53 mmol/mol; about one-quarter of these patients were not prescribed glucose-lowering therapy (Box 2). Similarly, the BP and lipid levels of large proportions of patients with diabetes exceeded recommended target levels (online Appendix 4); of the 61.9% of patients who did not meet the LDL-cholesterol target of 2.0 mmol/L, 44.3% were not prescribed a statin (Box 2).

Predictors of drug prescription

People with diabetes who were older (P < 0.001) or Indigenous (P = 0.030), or had a higher HbA1c level (P = 0.030), higher systolic BP (P < 0.001), or albuminuria (P < 0.001), were more likely to be prescribed the recommended combination treatment. Conversely, those with higher total cholesterol levels were less likely to receive optimal combination treatment (P < 0.001). Those who did not have a government-reimbursed health assessment (P = 0.012) or care plan (P < 0.001) were also less likely to be prescribed the recommended medications. Service type (general practice v ACCHS) did not influence drug prescription in univariable or multivariable analyses (online Appendix 5).

Effectiveness of the QI intervention

The baseline characteristics of the cohort used for outcome evaluation were similar for the intervention and control groups (online Appendix 3). The intervention was less effective in improving risk factor screening in patients with diabetes than in those without diabetes (P = 0.01). The intervention was only effective in improving rates of prescribing of recommended medications for undertreated individuals at high risk. and was not influenced by diabetes status (P = 0.28). The intervention was associated with intensification of existing antiplatelet, lipid-lowering, and BP-lowering therapy to a similar extent in people with and without diabetes. The intervention did not affect the prescription of glucose-lowering therapy (Box 3).

Discussion

People with diabetes in a contemporary Australian primary care population were more likely to be screened and prescribed the recommended medications for managing CVD risk factors than those without diabetes. The QI intervention was modestly effective in improving screening and treatment levels, but the evidence–practice gaps remained substantial.

Screening deficits were most marked with regard to cholesterol and albuminuria tests, consistent with both overseas16 and local17,18 reports. A recent French study16 found that only half of a group of patients with diabetes had been screened for proteinuria or albuminuria during the previous 12 months, suggesting that renal function is a poorly assessed CVD risk factor. Underprescribing of recommended treatments was striking when the patients with diabetes in our study were stratified by absolute risk: 39% of those with established CVD and 48% of those at high risk of CVD were not prescribed the recommended treatments; almost half of those with diabetes and LDL-cholesterol levels above 2.0 mmol/L were not receiving statin therapy. Similarly, BP targets were not met by half the patients with diabetes, of whom more than one-quarter were not prescribed antihypertensive therapy. These treatment deficits are consistent with international experience,810,16 and reflect modest improvements when compared with the findings of previous Australian studies of lipid6,7 and BP7,19 management.

About one-half of people with diabetes did not meet the recommended HbA1c goal of 53 mmol/mol or less, similar to the 57% figure in the 2003/2004 assessment of the United States National Health and Nutrition Examination Survey (NHANES) participants.20 It is worrying that about one-quarter of our patients with HbA1c levels over 69 mmol/mol were not prescribed glucose-lowering medication, a proportion substantially larger than the 3% of patients with HbA1c levels of 53 mmol/mol or more not treated in a recent Canadian study.10 Our findings may be partly explained by patient preference for non-pharmacological treatment, and by relaxed glycaemic targets in certain populations (older people, and people with frequent hypoglycaemia or hypoglycaemic unawareness).

Our findings suggest that undertreatment has diminished to some degree since 2002, which may reflect the effect of incentive schemes and quality of care initiatives. The deficits that remain may be explained by the proliferation of guidelines with differing perspectives, and time-pressured consultations with patients presenting with several complaints. Patients with diabetes who had a formal care plan, enabling coordination of their management with other health care providers, were more likely to be treated as recommended. However, causal inferences cannot be made, as numerous factors may confound this association.

The finding that CVD risk screening and management at baseline was better for those with diabetes than for people without diabetes is consistent with other reports,21,22 and may explain why the effect of the intervention was less marked in these patients. Although it was not effective in improving the overall level of new prescriptions for individuals at higher risk of CVD, the intervention was associated with improvements for people who were not receiving recommended treatments at baseline, regardless of their diabetes status. This is important in light of suggestions that therapeutic inertia may be a greater contributor to lost therapeutic benefit in patients with diabetes than lack of treatment.23

There is evidence that patient-directed interventions combined with physician-focused strategies may be more effective than the latter alone.24 Successful elements of collaborative care programs for improving chronic disease management include evidence-based guidelines, systematic screening and monitoring of risk factors, scheduled recall visits, new or adjusted roles for team members, information support for the clinician, enhanced self-management by the patient, effective communication between all members of the care team, and audit information for the practice.25 New policy proposals, such as “Health Care Homes”,26 and a renewed focus on initiatives such as “My Health Record” incorporate some of these elements.

Study limitations

Many of the sites in our study were teaching practices; this may explain why performance was higher than reported in previous studies. However, the recruited services were reasonably representative of Australian general practice with respect to the use of information technology.27 The ACCHSs recruited were geographically diverse and had similar service characteristics to the sector as a whole.28

The National Vascular Disease Prevention Alliance (NVDPA) guidelines5 recommend incorporating pre-treatment risk factor levels when assessing CVD risk. As pre-treatment data were not available, we analysed the patients’ most recent BP and lipid data, regardless of treatment status, and this may have led to underestimating risk for some individuals. However, as 72% of patients with diabetes were at high risk regardless of their risk score (online Appendix 3), this was probably not a major problem.

We regarded 2 years as an appropriate interval between lipid measurements, rather than varying the interval according to risk status as recommended by NVDPA guidelines. This may not have been appropriate for individuals at high risk, for whom more frequent testing is recommended. Conversely, the Royal Australian College of General Practitioners guidelines recommend 5-yearly lipid measurements for people at low risk;29 if doctors are adhering to these recommendations, the frequency of assessment may be adequate, but with a median follow-up period of 17 months we were not able to assess whether this was the case. If biases were introduced by using different lipid measurement intervals, we would expect them to be the same for the intervention and control arms.

Other limitations included the fact that that the type of diabetes was not specified, and that relying on electronic records data precluded assessing the role of clinical judgement in treatment decisions.

Conclusion

Although recommendations for managing CVD risk were more frequently implemented for people with diabetes than for those without diabetes, evidence–practice gaps remain. While the evaluated intervention was moderately effective in improving screening of risk factors, additional strategies are needed if Australia is to meet targets of reducing mortality for CVD and diabetes by 25% over the next 10 years.30

Box 1 –
Rates of prescribing of currently recommended cardiovascular disease risk-factor-specific medications for patients with diabetes


* For patients with HbA1c levels above 53 mmol/mol.

Box 2 –
Patients with diabetes with values above targets at baseline, and number who did not receive the corresponding recommended treatment

Patients with elevated level

Number not treated to reduce level


HbA1c level

> 53 mmol/mol

4329 of 7556 (57.3%)

1038 (24.0%)

> 69 mmol/mol

1822 of 7556 (24.1%)

450 (24.7%)

Blood pressure (BP)

Systolic BP > 130 mmHg or diastolic BP > 80 mmHg

4835 of 8329 (58.1%)

1354 (28.0%)

LDL-cholesterol level

> 2.0 mmol/L

4339 of 7007 (61.9%)

1922 (44.3%)

> 2.5 mmol/L

2769 of 7007 (39.5%)

1412 (51.0%)


HbA1c = glycated haemoglobin; LDL = low-density lipoprotein.

Box 3 –
Effects of the quality improvement intervention in patients with and without diabetes

Intervention

Usual care

Rate ratio

95% CI

P*


Receiving appropriate screening

12 164/19 385 (62.8%)

10 317/19 340 (53.4%)

1.25

(1.04–1.50)

0.01

With diabetes

2738/3617 (75.7%)

2323/3292 (70.6%)

1.14

(1.00–1.30)

Without diabetes

9426/15 768 (59.8%)

7994/16 048 (49.8%)

1.28

(1.04–1.58)

Receiving appropriate screening (undertreated at baseline)

3773/9276 (40.7%)

3532/10 782 (32.8%)

1.38

(1.10–1.73)

< 0.01

With diabetes

559/1160 (48.2%)

507/1151 (44.0%)

1.28

(1.00–1.63)

Without diabetes

3214/8116 (39.6%)

3025/9631 (31.4%)

1.40

(1.11–1.78)

Patients at high risk of cardiovascular disease

Receiving appropriate prescriptions

3030/5335 (56.8%)

2483/4846 (51.2%)

1.11

(0.97–1.27)

0.10

With diabetes

1700/2679 (63.5%)

1458/2495 (58.4%)

1.06

(0.93–1.21)

Without diabetes

1330/2656 (50.1%)

1025/2351 (43.6%)

1.18

(1.03–1.36)

Receiving appropriate prescriptions (undertreated at baseline)

1085/2827 (38.4%)

472/2263 (20.9%)

1.59

(1.19–2.13)

0.28

With diabetes

553/1269 (43.6%)

178/923 (19.3%)

1.63

(1.11–2.38)

Without diabetes

532/1558 (34.2%)

294/1340 (21.9%)

1.53

(1.16–2.01)

Increased antiplatelet therapy

470/2638 (17.8%)

65/2424 (2.7%)

4.79

(2.47–9.29)

0.08

With diabetes

210/908 (23.1%)

20/829 (2.4%)

7.28

(3.34–15.9)

Without diabetes

260/1730 (15.0%)

45/1595 (2.8%)

4.05

(2.03–8.08)

Increased lipid-lowering therapy

1026/5335 (19.2%)

226/4846 (4.7%)

3.22

(1.77–5.88)

0.84

With diabetes

608/2679 (22.7%)

130/2495 (5.2%)

3.32

(1.74–6.33)

Without diabetes

418/2656 (15.7%)

96/2351 (4.1%)

3.22

(1.77–5.86)

Increased blood pressure-lowering therapy

1243/5335 (23.3%)

586/4846 (12.1%)

1.89

(1.09–3.28)

0.54

With diabetes

729/2679 (27.2%)

316/2495 (12.7%)

1.91

(1.09–3.35)

Without diabetes

514/2656 (19.4%)

270/2351 (11.5%)

1.96

(1.10–3.47)

Patients with HbA1clevels > 53 mmol/mol at baseline

Appropriate glucose-lowering drug

1111/1269 (87.6%)

955/1118 (85.4%)

1.02

(0.95–1.11)

Increased glucose-lowering therapy

711/2679 (26.5%)

304/2495 (12.2%)

1.75

(0.95–3.22)


* Patients with diabetes v patients without diabetes. † For patients not meeting recommended targets for corresponding parameters (online Appendix 4).

Long term risk of severe retinopathy in childhood-onset type 1 diabetes: a data linkage study

The known Microvascular complications in people with type 1 diabetes mellitus are directly related to glycaemic control. 

The new This is the first study to assess the risk of complications in people with type 1 diabetes according to their glycaemic control trajectory between childhood and adulthood. Severe diabetic retinopathy (SDR) was associated with higher paediatric HbA1c levels, independent of glycaemic control during adulthood. Importantly, SDR was not documented in patients with a stable low glycaemic control trajectory. 

The implications Target-based treatment from the time of diagnosis of type 1 diabetes in childhood is required to reduce the risk of SDR during adulthood. 

Whether microvascular complications develop in people with type 1 diabetes mellitus is critically dependent on their glycaemic control.13 In the large Diabetes Control and Complications Trial (DCCT) and the Epidemiology of Diabetes Complications (EDIC) trial, however, mean glycated haemoglobin A1c (HbA1c) levels could only be estimated from data acquired at trial entry; consequently, the effect of the cumulative glycaemic exposure of the 195 adolescents in these studies during their 1–5 years of diabetes could not be analysed. As a result, the importance and contribution of childhood glycaemic control could not be fully assessed, which may explain some of the differences between adolescent and adult outcomes at follow-up.4 Apart from these two large scale studies, few investigations have followed individuals with childhood-onset type 1 diabetes into adult life.5,6 One longitudinal study (15 participants) found that mean HbA1c levels at diagnosis in childhood were higher for those who developed retinopathy during the 20-year follow-up, and that differences in HbA1c levels between those with and without retinopathy gradually declined with time.7 However, no study has compared the effect of optimal and poor glycaemic control across life on the risk of later complications.

The objectives of our study were to examine the impact of childhood glycaemic control on the future risk of complications in people with type 1 diabetes. Specifically, we aimed to delineate the effect of glycaemic control trajectory on risk, and to determine the relative effects of paediatric and adult metabolic control. We hypothesised that a stable low trajectory would be associated with a lower risk of microvascular complications, and that glycaemic control during childhood would modify the future risk of complications.

Methods

Study design

We undertook a retrospective cohort study of data collected from the time of diagnosis of type 1 diabetes in childhood until the time of our analysis (November 2013). Adults with a diagnosis of type 1 diabetes8 (diagnosed in childhood during 1975–2010) were included if they had attended at least one specialist adult diabetes clinic at the Royal Melbourne Hospital, and their care had been transferred from the paediatric diabetes clinic at the Royal Children’s Hospital (Melbourne) during 1992–2013. Individuals who had been lost to follow-up at the time of care transition from the paediatric diabetes clinic or who had died were therefore excluded. The choice of transition referral centre follows a discussion between the physician and young adult, and is not based on any biological or clinical criteria. Because of its proximity, the Royal Melbourne is the main adult referral centre for patients who transition from the Royal Children’s Hospital, receiving about 40% of its transitioning cohort.

We used a data linkage system, BioGrid Australia, that facilitates linkage of de-identified clinical data from member institutions. All individuals with type 1 diabetes common to both hospitals were identified. Data obtained from clinical department databases at each institution, including standardised clinical data for all routine outpatient clinic visits, were combined with mortality outcome data from the National Death Index (NDI), which has recorded all deaths in Australia since 1980. The process of sequential data linkage was performed with SAS 9.2 (SAS Institute).

Main outcomes and measures

Severe complications

The primary outcome of interest was a database record of diabetes-specific microvascular complications; in this study, only the most severe forms were considered. The date and cause of death were obtained from the NDI. Severe diabetic retinopathy (SDR) included one or more of maculopathy, proliferative retinopathy, and a need for photocoagulation surgery. Chronic kidney disease (CKD) was defined by a glomerular filtration rate of less than 60 mL/min/1.73 m2 (stage 3 CKD or worse),9 calculated from serial creatinine measurements using the Chronic Kidney Disease Epidemiology Collaboration (CKD-EPI) equation.10 Ulceration and amputation were recorded according to the clinical database files.

Glycaemic control

HbA1c levels were summarised as paediatric (mean of all pre-transition paediatric clinic measurements), adult (mean of all post-transition measurements as an adult), and life course values (mean HbA1c level from diagnosis to November 2013). The glycaemic control trajectory was defined across the life course, with 66 mmol/mol set as the upper cut-off value for good glycaemic control. This value was preferred to the standard paediatric target of 58 mmol/mol because it was anticipated that some of the cohort had commenced treatment before publication of the DCCT findings1,2 upon which the current HbA1c target values are based.8,11 The median HbA1c level in children aged 0–18 years with type 1 diabetes in Australia in 2009 was reported to be 66 mmol/mol;12 this was also the median HbA1c level for a cohort of children who had recently transitioned from care at the Royal Children’s Hospital.13

Each individual was assigned to one of four glycaemic control trajectory groups:

  • stable low (mean paediatric and adult HbA1c ≤ 66 mmol/mol);

  • improving (mean paediatric HbA1c > 66 mmol/mol, mean adult HbA1c ≤ 66 mmol/mol);

  • worsening (mean paediatric HbA1c ≤ 66 mmol/mol, mean adult HbA1c > 66 mmol/mol); or

  • stable high (paediatric and adult mean HbA1c > 66 mmol/mol).

Statistical analyses

Differences between the trajectory groups in participant characteristics, HbA1c levels, and complications were examined by one-way ANOVA (continuous variables) or in χ2 tests (categorical variables). The standardised mortality ratio was calculated as the ratio of the number of observed deaths to the number of expected deaths in the general population, based on 2012 Australian Bureau of Statistics data for Victoria. SDR was the only complication we examined in a regression analysis, as the aetiology of the other outcome measures could not be precisely defined. The relative effect of paediatric and adult glycaemic control on the risk of developing SDR was assessed by generalised estimating equation (GEE) analysis, which could allow for unmeasured variables and confounders. Statistical analyses were performed in Stata 13.0 (StataCorp); P < 0.05 was deemed statistically significant.

Ethics approval

The study received ethics approval from all participating institutions, the Royal Children’s Hospital Human Research Ethics Committee (reference, 31206), BioGrid (project reference, 201202/1), and the Australian Institute of Health and Welfare Research Ethics Committee (reference, EC2013-2-30).

Results

Participant characteristics

We identified 503 people (including 253 men) who were diagnosed with type 1 diabetes during 1975–2010 and had transitioned from paediatric to adult diabetes services over a 21-year period (1992–2013) at a mean age of 18.4 years (standard deviation [SD], 0.9 years; Box 1). The mean age at diagnosis was lower for girls (9.6 [SD, 3.9] v 10.3 [SD, 4.1] years; P < 0.05) but higher for women at the time of our analysis (28.8 [SD, 6.7] v 27.2 [SD, 5.7] years; P < 0.05); the mean duration of type 1 diabetes was therefore longer for women (19.3 [SD, 7.8] v 16.9 [SD, 7.1] years; P < 0.01). The mean number of HbA1c measurements per individual was 22.0 (SD, 13.0), 10.0 (SD, 8.1) and 29.6 (SD, 15.9) during the paediatric, adult and life course periods respectively; the corresponding mean HbA1c levels were 68 mmol/mol (SD, 13.1), 70 mmol/mol (SD, 17.5), and 68 mmol/mol (SD, 12.0) (Box 1).

Severe complications

At least one severe complication was documented for 26 participants (5.2%), including 16 with SDR (3.2%; Box 1). No severe complications were recorded in the paediatric dataset. Based on age- and sex-matched data from 2012 Victorian state data, the overall standardised mortality ratio in this cohort was 1.9 (95% CI, 0.7–4.3) (men, 1.3 [95% CI, 0.2–4.1]; women, 2.7 [95% CI, 0.7–7.4]).

Lifetime glycaemic control trajectory and risk of complications

For the stable low group (143 participants, 28%), the mean paediatric, adult and overall HbA1c levels were 57 mmol/mol (SD, 6.6), 57 mmol/mol (SD, 6.6), and 58 mmol/mol (SD, 3.3) respectively (Box 1). Only one person in this group had a documented complication (a 29-year-old man who had had an amputation).

The glycaemic profiles for the stable low, improving (82 participants, 16%), worsening (96 participants, 19%) and stable high trajectories (182 participants, 36%) are shown in Box 2. Given the low frequency of complications, further analyses were restricted to SDR, for which a causative role for hyperglycaemia could be confidently assumed. No-one in the stable low group had developed SDR, but three in the improving (4%), one in the worsening (1%), and 12 in the stable high groups (7%) had developed SDR (P = 0.004; Box 1). The overall mean age of onset of SDR was 28.8 years (SD, 4.4) years (for the improving group, 23.9 years [SD, 3.7]; worsening group, 28.5 years; stable high, 30.3 years [SD, 3.9]; P = 0.6). However, the mean interval between diagnosis with type 1 diabetes and onset of SDR was shorter for the worsening (30.5 years) and stable high groups (28.1 years; SD, 0.8) than for the improving group (31.9 years; SD, 6.2; P = 0.01).

Paediatric HbA1c level and SDR risk in adulthood

GEE analysis that included significant variables from exploratory multivariate logistic regression models (online Appendix) indicated that each 10.9 mmol/mol increase in paediatric HbA1c level was associated with an almost threefold risk of SDR (odds ratio [OR], 2.9; 95% CI, 1.9–4.3; P < 0.01); each 10.9 mmol/mol increase in adult HbA1c level was associated with a twofold risk (OR, 2.1; 95% CI, 1.4–3.1; P < 0.01). Longer duration of type 1 diabetes was also associated with an increased risk of SDR (per additional year: OR, 1.3; 95% CI, 1.2–1.5; P < 0.01).

Discussion

By incorporating all recorded HbA1c data from diagnosis onwards, this study offers a unique insight into a cohort of adults with childhood-onset type 1 diabetes who were not managed in clinical trials. None of those who maintained a mean HbA1c level of 66 mmol/mol or less from the time of diagnosis (the stable low group) developed SDR. The mean paediatric, adult and overall HbA1c levels in this group were each 58 mmol/mol or less, supporting the adoption of this target in paediatric practice.11 Each additional year of diabetes conferred a significant increase in the risk of SDR, and our data indicate that both paediatric and adult mean HbA1c levels are modifiable factors that moderate this risk. This is important for paediatric care providers, as 64.6% of participants remained in the same HbA1c level category (low or high) during the paediatric and adult periods, indicating that glycaemic control generally neither markedly deteriorates nor improves after the transition to adult services. This challenges the widely held belief that glycaemic control in young adults with type 1 diabetes improves during their mid- to late 20s following deterioration during the adolescent years,14 a premise that may not apply to every patient.

The major limitations of this study are its retrospective design and the low numbers of severe complications reported. Detailed clinical information beyond that recorded in the clinical databases was not available; as the data were de-identified, this problem could not be overcome. Assessing the potential relevance of lifetime glycaemic control for the risk of complications, with the exception of retinopathy, is therefore difficult. Further, we lacked information about outcomes for those who were lost to follow-up immediately after the transition from paediatric care, for whom we consequently have no information about glycaemic control trajectory or complication rates. This could account for the discrepancy between the standardised mortality ratio we estimated and that based on a population-based dataset in Western Australia (1.7 for men, 10.1 for women).15 Although glycaemic control for most of the participants had been suboptimal throughout their lives, the SDR rate was low, but consistent with the recent report that 3.7% of young people (14–30 years old) with type 1 diabetes in Norway required laser therapy within 20 years of the onset of diabetes.16

A number of factors contribute to a higher risk of diabetes-related complications, including genetic susceptibility and cardiovascular risk factors (such as smoking, higher body mass index, greater waist:hip ratio, hyperlipidaemia, hypertension). Data on these factors were not available, and the omission of these known confounders from our analyses is a major limitation of this study. The duration of follow-up varied between individuals, and a shorter period of follow-up during adulthood may have led to misclassification of trajectory category. Cohort studies that assess individuals from diagnosis to death could overcome this limitation, but would be possible only for population-based registries or in large, multicentre cohort studies.

As the study period was broad, we also assessed the effect of era of diagnosis on SDR outcome (data not shown). While SDR was more common among those diagnosed prior to the publication of the DCCT findings (1994), the effect was not independent of the collinear higher glycaemic control that commenced before contemporary target-based practice.

Our report describes the risk of diabetes-specific microvascular complications in a cohort of Australian adults who were diagnosed with type 1 diabetes during childhood. It is the first to assess clinical outcomes according to glycaemic control trajectory between childhood and adulthood, and is the largest to use all available metabolic data from the diagnosis of type 1 diabetes onwards, with a longer duration of follow-up than reported elsewhere. In the absence of an Australian population-based registry of individuals with type 1 diabetes, this data linkage study facilitated assessment of the effects of glycaemic control during the paediatric and adult periods. From this novel perspective, we found that, after adjusting for duration of diabetes (a non-modifiable factor), HbA1c level throughout the course of life was independently associated with the risk of retinopathy in adulthood; the predictive effects of paediatric and adult HbA1c levels were equivalent. However, as severe retinopathy commenced during the third decade of life in our cohort and most people had similar glycaemic control levels in childhood and adulthood, the contribution of metabolic memory (the concept that hyperglycaemia appears to have a chronic rather than an acute effect on the development of complications)4 from the paediatric period was integral to this risk.

Box 1 –
Participant characteristics, HbA1c levels, and complication rates for all participants and for each glycaemic control trajectory group

All participants

HbA1c trajectory group


P*

Stable low

Improving

Worsening

Stable high


Number (% of participants)

503

143 (28%)

82 (16%)

96 (19%)

182 (36%)

Sex (women)

250

58 (40%)

46 (56%)

44 (46%)

102 (56%)

0.02

Age at diagnosis (years), mean (SD)

9.9 (3.9)

10.7 (4.1)

9.1 (3.9)

10.3 (4.2)

9.5 (3.9)

0.80

Duration of paediatric observation (years), mean (SD)

8.5 (4.2)

7.8 (4.1)

9.2 (4.1)

8.1 (4.6)

8.9 (4.1)

0.02

Range (years)

0.6–19.1

1.0–19.1

3.8–19.1

1.1–18.3

0.6–18.9

Age at transition (years), mean (SD)

18.4 (0.9)

18.5 (0.8)

18.3 (0.8)

18.4 (1.1)

18.4 (1.2)

0.10

Duration of adult observation (years), mean (SD)

8.9 (5.8)

7.8 (5.3)

10.0 (6.9)

9.4 (5.5)

9.2 (5.8)

0.04

Range (years)

0.3–21.8

0.8–20.9

0.4–21.8

0.3–20.9

0.5–21.6

Age at last follow-up (years), mean (SD)

27.9 (6.3)

26.4 (5.1)

30.4 (7.7)

27.6 (5.5)

28.4 (6.3)

< 0.001

Duration of type 1 diabetes, (years), mean (SD)

18.1 (7.5)

15.5 (6.7)

21.3 (8.6)

17.5 (7.4)

18.9 (7.0)

0.07

HbA1c measurements, mean number (SD)

Paediatric

22.0 (13.0)

21.9 (12.8)

21.9 (15.5)

19.9 (12.8)

22.3 (12.8)

0.50

Adult

10.0 (8.1)

11.3 (8.9)

11.1 (9.5)

9.5 (8.0)

8.6 (8.1)

0.40

Lifetime

29.6 (15.9)

33.3 (15.4)

28.5 (18.0)

27.9 (14.3)

28.1 (15.8)

0.17

HbA1c level (mmol/mol), mean (SD)

Paediatric

68 (13.1)

57 (6.6)

74 (9.8)

60 (5.5)

78 (9.8)

< 0.001

Adult

70 (17.5)

57 (6.6)

60 (5.5)

77 (10.9)

85 (17.5)

< 0.001

Lifetime

68 (12.0)

58 (3.3)

67 (8.7)

65 (6.6)

79 (9.8)

< 0.001

Severe complications

26 (5.2%)

1 (1%)

6 (7%)

3 (3%)

16 (9%)

0.006

Severe retinopathy

16 (3.2%)

0

3 (4%)

1 (1%)

12 (7%)

0.004

Renal disease

8 (2%)

0

0

4 (5%)

2 (2%)

0.07

Ulceration/amputation

4 (1%)

1 (1%)

1 (1%)

0

4 (2%)

0.76

Death

5 (1%)

0

0

1 (1%)

4 (2%)

0.18


* Differences between trajectory groups tested in χ2 (categorical) and one-way ANOVA analyses (continuous variables).

Box 2 –
Profile of HbA1c levels over time, by glycaemic control trajectory group

The frequency of eye examinations in people with diabetes

The findings of the National Eye Health Survey are encouraging, but also identify areas for improvement

This article by Foreman and colleagues in this issue of the MJA1 explores how well people with diabetes are adhering to the 2008 recommendations by the National Health and Medical Research Council (NHMRC)2 about regular eye examinations. Their report analyses data for a recent population-based sample, the National Eye Health Survey (NEHS),3 which included sizable samples of both Indigenous and non-Indigenous Australians. The authors found a moderate level of non-compliance with the NHMRC recommendations, particularly among Indigenous people, and they argue that a carefully integrated and accessible diabetic retinopathy screening service for Indigenous Australians is needed.

A number of questions arise. Are the current NHMRC guidelines, which recommend more frequent eye examinations for Indigenous than non-Indigenous Australians, still appropriate in 2017? Are these new data sufficiently robust to reflect current practice in these two groups of Australians? And how would the proposed screening service work in practice, and what models are available for implementing it?

First, there is a concern whether the evidence available in 2017 still supports the difference in recommended eye examination frequency for Indigenous (yearly) and non-Indigenous (2-yearly) Australians. While the age-specific rates of vision impairment were substantially higher among Indigenous than non-Indigenous NEHS participants, the study also found that the proportion of vision impairment attributable to diabetic retinopathy was relatively low, but similar, in both groups. The report,2 however, provides only preliminary data on the prevalence of retinopathy, and its prevalence among Indigenous people with diabetes is currently unknown. Earlier studies had found an earlier onset and higher prevalence of diabetic retinopathy in Indigenous Australians. More detailed information needs to be collated to determine whether differing recommendations for these two groups of Australians remain appropriate.

Second, the NEHS study was a major and welcome undertaking, providing the first large scale data (30 representative sites) on the prevalence of vision impairment in middle-aged to older Australians since two major population-based studies conducted about 25 years ago, the Blue Mountains Eye Study4 and the Melbourne Vision Impairment Project,5 each of which assessed more limited samples than the NEHS.

The overall clinical eye examination rate in the NEHS was 71.5%,3 lower than the 82–83% in the earlier studies.4,5 The rate was substantially higher among Indigenous (77.6%) than non-Indigenous participants (68.5%); the non-Indigenous examination rate was 65.7% in New South Wales and 52% in Victoria. A further concern was the low proportion of dwellings where somebody was found to be home when contacted by the NEHS (overall, 51.1%; Indigenous, 77.9%; non-Indigenous, 46.2%). The combination of this low contactability — perhaps resulting from the short time spent at each of the 30 NEHS sites, all seen within less than one year — with the relatively low examination rates of those contacted may have led to selection and other biases.

The higher contact and examination rates for Indigenous participants provide greater confidence that the estimated yearly examination adherence of 52.7%3 accurately reflects that of the entire Australian Indigenous population, although documenting their rates of 2-yearly examinations would also have been valuable. The adherence rate for the non-Indigenous group of 77.5%3 (2-yearly tests) could have been affected by selection bias linked with its lower contactability and examination rates.

The prevalence of diabetic retinopathy has not yet been reported from the NEHS. However, some limitations of the study are already evident, particularly when compared with earlier studies.4,5 A non-mydriatic camera examination was used, for which only 14% of participants had pupil dilation;3 further, photographs from both fields of each eye were gradable for only one-third of participants, and no clinical fundus examination was performed.3

Third, the main recommendation by Foreman and colleagues is that a carefully integrated and accessible diabetic retinopathy screening service for Indigenous Australians be established.1 While integrating eye examinations with diabetes medical assessments is critical, screening could also be linked with telemedicine procedures for rural and remote communities, and with general practitioner annual cycle of care programs for people with diabetes.

Regular eye examinations could also be linked with the recently introduced Medicare item number for practitioners performing non-mydriatic retinal photography in people with diagnosed diabetes.6 The Australian government has expressed some commitment to funding supporting infrastructure for this program. The potential for improved diabetes screening facilitated by the new item number is a positive development, but general practitioners will need to be trained in the procedure. The problem of mandated yearly screening for Indigenous patients with diabetes also remains, as the new Medicare item can only be claimed every 2 years. A potential pitfall is the frequency of low quality or ungradable images, as was found by the NEHS.3 Reminders linked to Medical Benefits Schedule claims (for optometric or ophthalmic consultations, for instance) by people with diabetes are also now being explored.

The findings of the NEHS regarding adherence of Australians with diabetes to NHMRC recommendations for eye examinations are encouraging, but the optimal timing of screening for retinopathy in Indigenous and non-Indigenous populations remains unresolved, and further work is needed to establish whether the current guidelines are still appropriate.

Controversies in diagnosis and management of community-acquired pneumonia

Community-acquired pneumonia (CAP) continues to generate a large amount of interest, both for the clinician and the researcher. It is a very frequent diagnosis and the leading infection-related cause of death in most developed countries.1

Although CAP is a relatively common infection, there are wide disparities in its management, including the class of antibiotics chosen, the duration of therapy and the role of adjunctive therapy such as corticosteroids. In this review, we assess the evidence for the approaches to some of these clinical questions regarding CAP management. We agree with the Australian antibiotic guidelines2 regarding recommended antibiotics. Therefore, we do not specifically consider the question of the most appropriate class of antibiotics for treating patients with CAP — the Box summarises the antibiotics commonly used in Australia.

We used a PubMed search for original and review articles from 2005 to 2017, and reviewed specialist society publications and guidelines from Australia and overseas, to formulate an evidence-based overview of the topic as applied to clinical practice.

Are we overdiagnosing CAP?

Although it may seem self-evident, an essential question in the management of patients with CAP is whether the diagnosis is in fact correct. CAP can present in variable ways, some of which are similar to other conditions such as acute bronchitis, viral respiratory tract infections and cardiac failure. Patients with dementia, who are more likely to develop CAP, may not be able to give a reliable description of symptoms.3 Patients may present with two or more conditions at once, confusing the diagnostic process.3 This may occur as a coincidence or alternatively be due to a cause–effect relationship between them. Examples of the latter include that a chest infection can precipitate either an exacerbation of cardiac failure or an acute coronary syndrome.4 In addition, particularly in the era of the 4-hour National Emergency Access Target, staff members in the emergency department (ED) are under greater pressure to move patients out of the ED and thus may need to change the focus of their assessment to “does this patient need admission?” rather than “what is the correct diagnosis?”.

From clinical studies of CAP performed in Australia, of all the patients screened for inclusion on the basis of being given the label of CAP in the ED, a large proportion are subsequently excluded from the study because their chest x-ray is not consistent with CAP.5,6 This issue is not limited to Australia, with international studies showing that chest x-rays reported by treating clinicians as being consistent with CAP are not confirmed as being so by a radiologist in 20–50% of cases.711

There are several downsides to excessive diagnosis of CAP. The most obvious is the use of unnecessary antibiotics in patients who have conditions that do not require antibiotics such as viral respiratory infections or cardiac failure. This has the potential to add to the problem of antibiotic resistance as well as putting the patient at risk of antibiotic-related complications such as Clostridium difficile-associated diarrhoea. A further issue, particularly when cultures are not performed in patients initially labelled as having CAP, is the potential delay in diagnosis and inappropriate antibiotic therapy of those patients whose true diagnosis is something more serious, such as sepsis, infective endocarditis or pulmonary embolism. Some of these misdiagnosed patients can have their admission prolonged by many days due to the non-performance of blood cultures. We believe that the diagnostic uncertainty for admitted patients initially given the diagnosis of CAP means that recommendations that discourage the performance of blood cultures in CAP patients are inappropriate.1215

Duration of antibiotic therapy

The optimal duration of antimicrobial therapy for CAP is another area of controversy. The tendency in hospitals appears to be to overtreat rather than undertreat, often with a long oral tail.1618 Whether this is a case of believing that “more is better” or due to the disparity between the time to clinical resolution compared with microbiological resolution, the excessive prescription of antibiotics puts the patient at greater risk of side effects and colonisation with resistant organisms, including nasopharyngeal carriage of penicillin-resistant Streptococcus pneumoniae.19,20 Ecologically, the prescription of antibiotics for respiratory infection contributes to a rise in resistance in the community.21

Should the physician turn to national guidelines for advice on duration and choice of antibiotic (Box); the Australian Therapeutic guidelines: antibiotic recommend 7 days of total therapy for moderate and most cases of severe pneumonia,2 as does the British Thoracic Society,22 while the United Kingdom NICE guidelines suggest 5 days for mild CAP and 7–10 days for moderate to severe CAP.23 However, the Infectious Diseases Society of America (IDSA) supports a 5-day treatment for inpatient CAP, provided the patient is afebrile and clinically improving.24 So, with all this variation, which is correct?

There is agreement that a 7-day course of an antibiotic is effective for most cases of CAP, and this is relatively non-controversial, albeit adhered to poorly.25 There is increasing evidence, however, that shorter courses of 5 or even 3 days’ therapy may be just as effective. Overseas literature provides support for short course therapy with azithromycin, including as little as a single dose.26 This likely relates to the high tissue penetration and persistence of adequate tissue levels of this macrolide for some days following administration.27 A multicentre randomised clinical trial evaluating the safety of the IDSA recommendations found that a 5-day course of therapy is safe and effective, although most patients received quinolone antibiotics, a class of antibiotic rarely used in Australia for treating CAP.28 Regarding the β-lactam therapy that would be more likely prescribed in the Australian setting, a 3-day course of intravenous (IV) amoxycillin monotherapy has been shown to be as effective as 3 days of IV amoxycillin followed by 5 days of oral amoxycillin in adult patients who were improving at 72 hours.29 Two previous studies reached a similar conclusion in paediatric populations.30,31

Given the accumulating evidence, we suggest that a 5-day course of antibiotics should be effective in most cases of uncomplicated CAP, even though complete symptom resolution is unlikely to have occurred at this time point. For patients on IV therapy who are clinically improving at 72 hours, a switch to oral therapy is appropriate, but clinicians should keep in mind that the oral antibiotics should complete the 5-day total course and not add another 5 days to what has already been prescribed. If improvement has been rapid in the first 72 hours, it would be reasonable to cease all therapy at 3 days, provided close follow-up is available.

Some international studies have suggested that bundles of care for patients with CAP, which include antibiotic administration within 4 to 8 hours of presentation, may lead to better patient outcomes.3234 However, it is not clear that this would provide benefits in the Australian setting. In relation to the United States studies,33,34 this finding may reflect past differences in the US health system, where antibiotics may not have been given until the patient was seen by their attending physician, potentially leading to delays in therapy. The US recommendations have now changed to recommend commencement of antibiotics while the patient is in the ED.24 This is already the norm in Australia.

Other studies35,36 have suggested that increases in mortality in patients with CAP may be due to an atypical presentation which leads to a delay in diagnosis, rather than being associated with a delay in antibiotic administration. When this was taken into account in one study, the association between a delay in antibiotic administration beyond 4 hours and increased mortality was not statistically significant.35

Potential cardiac side effects of newer macrolide antibiotics

A 2012 study reported an excess of both cardiovascular and all-cause deaths in patients with pneumonia treated with a 5-day course of azithromycin compared with those treated with other antimicrobials, potentially related to its ability to prolong the QT interval.37 As a result, in 2013, the US Food and Drug Administration issued a warning regarding prescription of azithromycin for CAP, even though that study had a number of limitations, including its non-randomised nature and outpatient study population.

However, the case was far from closed, and results from other retrospective studies reached the opposite conclusion. Mortensen and colleagues studied older patients with CAP and found that those treated with macrolides had a lower rate of mortality, in spite of a small rise in rates of myocardial infarction “consistent with a net benefit”.38 This conclusion was shared by Cheng and colleagues in their 2015 meta-analysis.39 In 2016, a Canadian population-based retrospective cohort study involving about one million adults aged over 65 years found no increase in rates of cardiac arrhythmias at 30 days, in addition to lower all-cause mortality, in patients treated with a macrolide antibiotic.40

Given the evidence that the benefit of using macrolide therapy outweighs potential cardiac risk, we support recommendations to use a macrolide in place of doxycycline for atypical cover when the latter cannot be used, and the use of azithromycin in combination therapy for severe hospitalised CAP, such as that requiring management in an intensive care unit (ICU). We also point out the excellent oral bioavailability of oral azithromycin,27 and recommend its use in preference to the IV formulation in patients for whom oral therapy is tolerated and expected to be absorbed.

The link between CAP and cardiovascular disease

In recent years, evidence has emerged regarding the role of inflammatory conditions in the development of cardiovascular disease such as myocardial infarctions and strokes.41 It is postulated that inflammation, especially when persistent, may have an effect on vascular plaques, making them more unstable or prone to acute occlusion.42,43 Various infections including CAP, influenza and human immunodeficiency virus, as well as other sources of chronic inflammation such as rheumatoid arthritis, have all been shown to be associated with higher rates of acute cardiovascular disease and deaths.4,4451

In a large study, in the 30 days following an episode of CAP requiring inpatient care, incidence of worsening heart failure, cardiac arrhythmia and acute myocardial infarction were 21%, 10% and 3% respectively.4 However, it is important to note that the problem does not end after 30 days. There is a measurably higher rate of cardiovascular deaths in the following few years, when patients admitted with CAP are compared with matched cohorts admitted with non-infection-related conditions. The rate increases most in older patients (aged over 40 years) and those with greater number of cardiovascular risk factors.52

The mechanism of this increase in cardiovascular complications during and after the CAP episode appears to be multifactorial. Inflammation is a pro-thrombotic state; myocardial inflammation and damage may occur, potentially in response to NADPH oxidase 2 upregulation; cardiac strain may be present in the setting of increased sympathetic nervous system activity with relative hypoxia caused by the lung consolidation; increased fluid and sodium loading associated with some IV antibiotic may worsen fluid overload problems in some cardiac failure patients; and QT interval prolongation with the use of other antibiotics may contribute to arrhythmic potential.46,47,53

What remains to be seen is whether we can act on this in a useful way. It is notable that the vast majority of patients who die from CAP are very old with multiple comorbidities, for whom death may be an expected terminal event. While acutely addressing cardiac risk factors with, for example, the addition of anti-platelet agents like aspirin or cholesterol-lowering statin therapy has not yet been shown to alter mortality in the acute setting,54 it would appear prudent to assess whether such treatments are indicated in patients admitted with CAP, especially if they are aged over 40 years.52

The role of corticosteroids in the management of CAP

Given that the inflammatory state during and after an episode of CAP appears to have an important role in contributing to both morbidity and mortality,4,4447 there has been interest in the role of inflammatory modulators such as corticosteroids as adjunctive CAP therapy. Levels of cytokines vary with severity of CAP and highest levels of the pro-inflammatory cytokine interleukin (IL)-6 and the anti-inflammatory cytokine IL-10 are associated with higher chance of dying from severe CAP.55 Glucocorticoids reduce the levels of such cytokines,56 and thus are theoretically attractive as a means to reduce CAP mortality.

There have been a number of attempts to address the question about whether this theoretical benefit may be true. Individual studies have varied in terms of the severity of the CAP studied, the choice of corticosteroid used, the route by which it was given, its dose and duration, and the outcomes measured. Results have been mixed, and several attempts at performing meta-analyses on these studies — with all the expected problems associated with attempting to combine such a heterogeneous collection of methodologies — have shown marginal benefits in terms of mortality, particularly in patients with the most severe CAP managed in the ICU, as well as a shorter time to becoming afebrile.5760 These small benefits need to be weighed against the potential downside of high-dose corticosteroids, both in terms of potential side effects like immune suppression and also the fact that outcomes may have been worse in patients whose infection was caused by an influenza virus or Aspergillus.61,62

Thus, the potential role of corticosteroids as adjunctive therapy in CAP appears to be very limited. They could be considered in patients with CAP severe enough to require management in the ICU, but caution should be taken until the aetiology is known, particularly during influenza season. Their use should also be very carefully considered in patients at higher risk from corticosteroid complications, such as the immunocompromised, women who are pregnant, patients with recent gastrointestinal haemorrhages, and patients at greater risk of neuropsychiatric problems.59 The possible shortened time to defervescence is not sufficiently clinically useful to justify the potential harm from such therapy.

Conclusion

In this era of burgeoning antibiotic resistance, the treatment of CAP is an area where we have the potential to reduce antibiotic consumption. We are diagnosing it too often and treating it for too long. Most non-ICU patients with CAP could be treated for 3–5 days in total.

CAP is a common cause of death, both in the short term and also in the subsequent few years, and many of these deaths appear to be cardiovascular related. Although most deaths from CAP occur in very old people with multiple comorbidities — and so may not easily be prevented — the management of a patient with CAP should be seen as an opportunity to address and treat cardiac risk factors when they are present.

Box –
Antibiotics commonly used to treat community-acquired pneumonia (CAP) in Australia2

CAP severity

Antibiotic

Comments

Suggested duration


Mild (treated as outpatient)

Doxycycline

Monotherapy; avoid in pregnancy and young children

3–5 days

Amoxycillin

Monotherapy; side effect profile better than amoxycillin–clavulinate and spectrum of activity more appropriate

3–5 days

Macrolide (eg, clarithromycin, azithromycin or roxithromycin)

Monotherapy; potential option when patient intolerant of doxycycline and amoxycillin

3–5 days

Amoxycillin–clavulinate

Consider in patients from nursing homes or following recent hospital admissions

5 days

Cefuroxime*

Consider in patients with non-hypersensitivity reactions to amoxycillin

3–5 days

Moderate (admitted patients not requiring ICU)

Benzylpenicillin

Use in combination with either doxycycline or a macrolide

Switch to oral therapy when clinical improvement occurs, generally in 1–3 days

Doxycycline

Oral; used in combination with benzylpenicillin

5 days

Macrolide (eg, clarithromycin or azithromycin)

Alternative second agent to doxycycline (oral or IV); used in combination with benzylpenicillin

5 days

Moxifloxacin

Use as monotherapy if hypersensitivity reaction to penicillins; excellent oral bioavailability

5 days

Severe (patients potentially requiring ICU care)

Ceftriaxone plus azithromycin IV

Alternative choices may be appropriate in tropical northern Australia

7 days


ICU = intensive care unit. IV = intravenous. * Cefaclor is not useful owing to poor antibacterial activity and high rate of causing rashes; cephalexin is not ideal given the poor spectrum of activity against respiratory pathogens.

Nurses should have greater role in diabetes management – study

A study has found a new program where primary care nurses led insulin treatment for Type 2 diabetics can dramatically improve longer term health outcomes of patients.

Published in the BMJ, it looked into 74 primary health clinics across Australia and compared a nurse led insulin treatment initiation with a traditional approach to diabetes management.

70% of patients in the ‘Stepping Up’ program began treatment when compared to just 22% at clinics taking a traditional approach to diabetes management.

According to Associate Professor John Furler from the University of Melbourne: “By focusing on an enhanced role for the practice nurse, who is trained and mentored by a registered nurse with diabetes educator credentials, the model uses existing resources within the practice to improve outcomes.”

Related: Childhood diabetes not under control

Early adoption of insulin can improve health outcomes and reduce the chance of damage to the eyes, kidney and nerves.

However according to the study: “Insulin initiation is often delayed, however, particularly in primary care, where  implementation is not widespread despite being recommended as part of routine clinical management of type 2 diabetes.”

Related: Diabetes: “lip service” to behavioural approaches

“After 12 months, we found that patients had significantly better HbA1c levels (an important measure of glucose in the blood), which is associated with better long term outcomes, such as reduced rates of kidney and eye disease, compared to the control group,” Associate Professor Furler said.

Thanks to these results, a further implementation study of the ‘Stepping Up’ model of care will be widened to include diabetes therapy generally and will be carried out in the North-West Melbourne Primary Health Network.

Latest news

Understanding 30-day re-admission after hospitalisation of older patients for diabetes: identifying those at greatest risk

The known Re-admissions are a significant contributor to the burden and medical costs associated with hospitalisation of people with diabetes. 

The new Almost one-quarter of older patients hospitalised for diabetes were re-hospitalised within 30 days, most of whom were re-admitted within 14 days of discharge. The patients at greatest risk of re-admission were those with comorbid heart failure, multiple recent hospitalisations, and multiple prescribers involved in their care. 

The implications Identification in hospital of at-risk patients with diabetes, together with targeted follow-up during the first 14 days after discharge, may facilitate appropriate interventions that avert their re-admission. 

People with diabetes are often admitted to hospital several times; it was reported in the United States that 30% of patients hospitalised for diabetes had been admitted at least twice during the previous year.1 These findings have important consequences for health care costs; hospital inpatient care was identified as the largest item of medical expenditure for patients with diabetes in the US, accounting for 43% of the total medical costs, or US$409 billion.2 In Australia, hospital inpatient care for people with diabetes was conservatively estimated to cost $647 million in 2008–09, or more than 40% of all diabetes-related health care expenditure.3 About 85% of patients hospitalised for type 2 diabetes in Australia are aged 65 years or over,4 and the average cost per hospitalisation is $8755.3 Many of these admissions could potentially be prevented were appropriate primary care provided.5 Hospitalisations for diabetes account for almost one-quarter of all potentially preventable admissions in Australia.5

Re-admissions are a significant contributor to the burden and medical costs associated with hospitalisation of people with diabetes.6,7 Studies in the US have found that as many as 20% of patients hospitalised for diabetes are re-admitted within 30 days of discharge, compared with 5–14% for other types of admission.8,9 Almost half of these re-hospitalisations (9.4% of index admissions) are for a diabetes-related diagnosis.8

Hospital re-admission, particularly within 30 days of discharge, is used as a quality-of-care metric in the US, and has been identified as a high priority health care quality measure for patients with diabetes.10,11 It is suggested that poor coordination of care and discharge planning contribute to high rates of re-admission;10 a large US study of almost 600 000 re-admissions within 30 days of discharge (for either a medical or surgical index condition) found that half of the patients had had no primary care visit between discharge and re-hospitalisation.11,12

Little is known at the population level about the rate of re-admission after hospitalisation for diabetes in Australia or the factors that contribute to the risk of re-admission. The aim of our study was to identify which patients are at risk of 30-day re-admission, and factors that contribute to re-hospitalisation of older Australians with diabetes.

Methods

Data source

We undertook a retrospective cohort study of administrative claims data in the health claims database of the Department of Veterans’ Affairs (DVA) for all patients hospitalised for a diabetes-related condition between 1 January 2012 and 31 December 2012. The DVA database contains details of all subsidised prescription medicines, medical and allied health services, and hospitalisations for a treatment population of 240 000 veterans and war widows and widowers.13

Cohort selection

Patients were included if they were eligible for all health services subsidised by the DVA in the 12 months prior to 1 January 2012 and had been hospitalised for diabetes (primary diagnosis: International Classification of Diseases, version 10, Australian modification [ICD-10-AM] codes E10, E11, E13, E14, R73, T383, Y423) during the period 1 January 2012 – 31 December 2012. Diabetes in these patients included insulin-dependent diabetes, non-insulin-dependent diabetes, other specified and unspecified types of diabetes, with or without complications (coma; hypoglycaemia; ketoacidosis; renal, ophthalmic, neurological, or peripheral circulatory complications; arthropathy). Also included were hospitalisations for elevated blood glucose levels and adverse effects specifically caused by insulin and oral hypoglycaemic (anti-diabetic) drugs. The first index hospitalisation during the study period for each patient was included. Patients who were alive at discharge from the index hospital stay and were neither re-hospitalised with a primary diagnosis of dialysis or rehabilitation within 30 days of discharge, nor re-admitted on the day of discharge, were included in the final study cohort.

Study outcomes and clinical characteristics

The primary study outcomes were the causes of re-hospitalisation and the prevalence of clinical factors associated with re-hospitalisation, including age, sex, residential status at the index admission; length of stay for the index hospitalisation; number and types of comorbid conditions, number of unique medicines, and number and type of prior hospitalisations (in the 6 months before the index admission); and the number of standard general practitioner visits and numbers of unique prescribers and pharmacies (in the 12 months before the index admission). Whether a medication review was undertaken or a GP management plan prepared (during the 12 months before the index admission) and the specific types of anti-diabetic medicines used (during the 6 months before the index admission) were also examined. Secondary outcomes included the proportions of patients who were re-hospitalised within 1–3 days, 1–7 days and 1–14 days of discharge; the proportions of patients who visited a GP within 14 and 30 days of discharge; and the proportion of patients who visited a GP before re-hospitalisation.

Comorbid conditions were identified using the validated, pharmaceutical-based comorbidity index Rx-Risk-V model (Australian adaptation), diagnoses in hospital records (based on ICD-10-AM codes), and specific Anatomical Therapeutic Chemical (ATC) codes for medications (that are not part of the Rx-Risk score).14 Specifically, depression was identified by the dispensing of a non-tricyclic antidepressant (ATC codes N06AB, N06AG02, N06AX; tricyclic antidepressants were excluded because they are commonly used to treat diabetic neuropathy). Cancers, except non-malignant skin cancer, were identified from hospital records for the 12 months before the index admission (ICD-10-AM codes C00–C97, excluding C44). Urinary incontinence was identified by dispensing of medicines for urinary incontinence (ATC code G04BD). Comorbidities were categorised as those related to diabetes (conditions with a shared pathogenesis or management plan, including macrovascular and microvascular diseases) and those unrelated to diabetes (as described previously14).

Following discharge, patients were followed up for 30 days, or until re-hospitalisation or death. Re-hospitalisations were classified according to whether they were potentially preventable according to criteria previously defined in Australia; that is, admissions that might have been prevented by high quality primary and preventive care.5 Potentially preventable hospitalisation diagnoses included chronic conditions, selected acute conditions, and vaccine-related hospitalisations, as described previously (online Appendix).5 We used principal diagnosis codes for this study, as the recording of secondary diagnoses may not reflect the reason for admission, but rather the presence of co-existing conditions or conditions that developed during the episode of admitted patient care.15

Statistical analyses

Data are presented as medians (with interquartile ranges [IQRs]) and percentages. Characteristics predictive of 30-day re-hospitalisation were identified by univariate logistic regression. Variables for which P ≤ 0.10 in the univariate analyses were included in a backward stepwise multivariate logistic regression analysis; P < 0.05 was deemed statistically significant for including a factor in the final model. The goodness of fit of the final model was assessed with the Hosmer–Lemeshow statistic. All statistical analyses were performed in SAS 9.4 (SAS Institute).

Ethics approval

Ethics approval was obtained from the University of South Australia Human Research Ethics Committee (reference, P099/10) and the Department of Veterans’ Affairs Human Research Ethics Committee (reference, E010/010).

Results

A total of 848 older patients hospitalised for diabetes were included in the study cohort, of whom 209 (24.6%) were re-hospitalised within 30 days of discharge. Of all 30-day re-admissions, the re-admission diagnosis for 51 patients (24%) was a diabetes-related condition; in most cases (41 of all re-admissions, 20%) these were type 2 diabetes-related conditions, namely hospitalisation for foot ulcer (19 patients, 9.1%) or hyperglycaemia or hypoglycaemia (11 patients, 5.7%). One-fifth of re-admissions (43 patients, 21%) were for cardiovascular conditions, including heart failure (10 patients, 5%) or atherosclerosis (9 patients, 4%). Other re-admission diagnoses included respiratory disorders (8 patients, 4%), cellulitis (8 patients, 4%) and pneumonia (6 patients, 3%). Eighty-five re-admissions (40.7%) were potentially avoidable; most were hospitalisations for chronic conditions (75 patients, 88% of potentially avoidable re-admissions), including diabetes complications (49 patients, 65%). The median lengths of stay were 5 days (IQR, 2–9 days) for re-hospitalisation, and 6 days (IQR, 2–12 days) for the index hospitalisation.

The demographic and clinical characteristics of the 848 older patients hospitalised for diabetes are shown in Box 1. The median age of the study cohort was 87 years (IQR, 77–89 years); 60% were men. The proportion of patients who had seven or more comorbid conditions in the 6 months before the index hospitalisation was greater among those who were re-hospitalised; the number of visits to a GP and numbers of prescribers and pharmacies where medicines were dispensed in the 12 months before admission were also higher for these patients than for those who were not re-admitted (Box 1). The prevalence of both comorbid heart failure (unadjusted odds ratio [OR], 1.53; 95% confidence interval [CI], 1.06–2.21) and end-stage renal disease (OR, 1.96; 95% CI, 1.03–3.72) was significantly higher in people with a 30-day re-admission. There were no significant differences in the types of anti-diabetic medicines used at the time of admission. Almost one-quarter (23.4%) of patients re-admitted within 30 days had had two or more hospitalisations in the 6 months before the index admission, compared with 14.9% of people who were not re-admitted (OR, 1.98; 95% CI, 1.29–3.06; Box 1).

Multivariate analysis indicated that comorbid heart failure, higher numbers of prescribers, and two or more prior hospitalisations were independent predictors of re-admission within 30 days (Box 2).

Of the 209 re-admissions within 30 days, 162 (77.5%) were within 14 days of discharge, and more than one-third within 7 days (Box 3). Of the patients who were re-admitted within 30 days of discharge, 128 (61.2%) visited a GP before their re-admission; of the 162 patients re-admitted within 14 days of discharge, 96 (59.3%) had visited a GP before the re-admission. Following discharge, 654 patients in the entire study cohort (77.1%) saw a GP within 30 days, including 515 (60.7%) within 14 days of discharge.

Discussion

Almost one-quarter of older patients hospitalised for diabetes were re-admitted to hospital within 30 days of discharge, of whom three-quarters were re-admitted within 14 days of discharge. We identified a number of factors that characterised diabetic patients at higher risk of re-admission, including comorbid heart failure, more than two recent previous hospitalisations, and seeing multiple prescribers. Proactive identification of patients at higher risk may facilitate preventive actions, including organising GP visits one to two weeks after discharge, particularly for patients who have had a recent prior hospitalisation and who have more than one medical practitioner prescribing their medicines; 41% of patients who were re-admitted had not visited a GP during this period.

While hospital re-admissions are a multifaceted problem, our findings highlight the need for improved care transitions and coordination of care to reduce this significant burden on both patients and the Australian health care system. Re-admissions are expensive, demanding on health care resources, and pose a significant risk to patient safety.6

More than 40% of re-admissions in our study were potentially preventable by providing appropriate primary care. This underscores the importance of the timeliness of clinical handover and of GP visits after discharge, but the proportion of re-admissions within 30 days that are truly preventable is unknown. A recent US study found that 31% of all re-admissions of older patients admitted to hospital for treatment of diabetes were potentially preventable, with hospitalisations for heart failure and diabetes respectively accounting for 48% and 22% of preventable admissions, costing the US health care system an estimated $US62 million.16

Heart failure was the only comorbidity that was a significant predictor of re-admission in our study; it was associated with a 49% increase in the likelihood of re-hospitalisation within 30 days (Box 2). In a large US study, the most common diagnosis among 580 000 Medicare patients re-hospitalised within 30 days of an initial hospitalisation for a medical condition or surgical procedure was also heart failure.12 Another US study reported that the most common cause of re-admission within 30 days for patients initially hospitalised for diabetes, heart failure, ischaemic heart disease, atrial fibrillation or chronic kidney disease was heart failure; comorbid heart failure was associated with a 23% increase in risk of re-admission (risk ratio, 1.23; 95% CI, 1.02–1.48).6

Together with the results from our study, this highlights the significance of comorbid heart failure for the risk of re-hospitalisation of older patients with diabetes. These patients should be targeted for continuity of care services after discharge, particularly during the first 14 days. A 2014 systematic review of 47 studies found that post-discharge interventions, such as home visit programs and multidisciplinary clinics, reduced all-cause re-admission and mortality rates among people with heart failure, and structured telephone support services reduced mortality and the number of heart failure-specific re-admissions.17

Patients who had been admitted to hospital several times during the 6 months before the index hospitalisation were almost 80% more likely to be re-admitted within 30 days (Box 2). Re-admissions are more common among older people, and this population has a higher risk of adverse events and use health services more.18 In a US study, only 30% of patients hospitalised for diabetes had been admitted to hospital more than once in the previous 12 months, but these patients accounted for most (55%) of the inpatient costs for this disorder; many hospitalisations were considered to be preventable by quality outpatient care.19 Inpatient diabetes education, in particular, was found to be associated with a 34% reduction in 30-day re-admission rates (OR, 0.66; 95% CI, 0.51–0.85) for patients with poor glycaemic control at the index hospital admission.20

The risk of re-admission involves a complex relationship between the presence of chronic and acute conditions, the health status of the patient, and health system factors, such as the transition between primary and hospital care and coordination of care, including timely, comprehensive communication.11 It was recently postulated that post-hospital syndrome, an acquired transient condition of generalised vulnerability after discharge, also contributes to re-admissions within 30 days.21 Focused, comprehensive holistic strategies that target stressors which contribute to increased vulnerability may mitigate post-hospital syndrome and the risk of re-hospitalisation.21 Structured multidisciplinary post-discharge support visits have been shown to reduce re-admission rates in people with heart failure, chronic obstructive pulmonary disorder, and in older frail people in general,18,22 as has comprehensive inpatient geriatric health care assessment together with ongoing multidisciplinary support after discharge.23 An Australian study found that such intervention reduced emergency re-admission rates by more than 50%, reduced the number of emergency GP visits, and improved patients’ quality of life;23 the intervention was also found to be cost-effective.24

Medicines reviews had not been undertaken for most of our study cohort (Box 1). Collaborative medicines reviews expedite identifying and resolving medication-related problems and delay the time to hospitalisation for several conditions,25 and may therefore also reduce the risk of re-admission of patients hospitalised for diabetes.

There were limitations to our study. We analysed DVA administrative health data that may not be representative of the overall older Australian population. Members of the DVA cohort can access all health care services, and this may influence their health-seeking behaviour and, potentially, their health outcomes. However, age-specific comparisons of members of the DVA cohort with non-service-related disabilities with people in the wider Australian population have found similar annual rates of GP visits, use of prescriptions, and numbers of hospitalisations.26 We were unable to determine whether re-admission was directly related to the index condition on the basis of the ICD-10 codes for the hospital separation. Further, we could not examine in-hospital changes to medications or the provision of inpatient subacute services during the index admission that may have influenced re-admission, as the dataset did not completely capture in-hospital medicine use and services.

In summary, older people hospitalised for diabetes with comorbid heart failure, more than two other hospitalisations in the previous 6 months, or multiple prescribers involved in their care are at greater risk of being re-admitted to hospital within 30 days of discharge. Improved timeliness of primary care after discharge may be warranted, as almost half of those re-admitted within 14 days of discharge had not seen their GP during this time. The identification of these at-risk patients may help to target appropriate interventions for preventing these re-admissions.

Box 1 –
Characteristics of 848 older patients hospitalised for diabetes, according to whether they were re-admitted to hospital within 30 days of discharge

No re-admission

30-day re-admission

Unadjusted odds ratio (95% CI)

P


Number of patients

639

209

Demographic data

Age category

≤ 85 years old

309 (48.4%)

114 (54.5%)

Reference

> 85 years old

330 (51.6%)

95 (45.5%)

0.78 (0.57–1.17)

0.12

Sex (men)

363 (56.8%)

132 (63.2%)

1.31 (0.95–1.81)

0.09

Location of residence

Community

534 (83.6%)

180 (86.1%)

Reference

Residential aged care

105 (16.4%)

29 (13.9%)

0.85 (0.54–1.33)

0.47

Clinical characteristics

Median index LOS (IQR), days

5 (2–11)

6 (2–12)

1.14 (0.85–1.36)

0.09

Index LOS 0–5 days

329 (51.3%)

101 (48.3%)

Reference

Index LOS 6–11 days

164 (25.6%)

52 (24.9%)

1.05 (0.68–1.61)

0.85

Index LOS > 11 days

149 (23.2%)

56 (26.7%)

1.24 (0.81–1.90)

0.29

Median number of comorbid conditions* (IQR)

6 (4–8)

7 (5–8)

0.95 (0.79–1.78)

0.31

0–4 comorbid conditions

182 (28.5%)

48 (23.0%)

Reference

5–6 comorbid conditions

250 (39.1%)

89 (42.6%)

0.92 (0.78–1.12)

0.75

≥ 7 comorbid conditions

207 (32.4%)

72 (34.5%)

1.28 (1.08–1.53)

0.04

Median number of unrelated comorbid conditions (IQR)

2 (1–3)

2 (1–3)

1.06 (0.98–1.17)

0.20

Median number of unique medicines* (IQR)

11 (8–16)

11 (8–17)

0.97 (0.91–1.14)

0.23

1–7 unique medicines

125 (19.6%)

34 (16.3%)

Reference

8–14 unique medicines

324 (50.7%)

106 (50.7%)

1.13 (0.73–1.76)

0.71

≥ 15 unique medicines

190 (29.7%)

69 (33.0%)

1.47 (1.0 –2.17)

0.04

Health service use

Median number of GP visits* (IQR)

7 (4–11)

8 (5–15)

1.03 (1.02–1.04)

0.02

Median number of prescribers (IQR)

3 (2–5)

4 (2–5)

1.07 (1.01–1.13)

0.02

Median numbers of pharmacies (IQR)

2 (1–2)

2 (1–3)

1.15 (1.03–1.29)

0.02

Medicines review

49 (7.8%)

15 (7.2%)

0.89 (0.47–1.67)

0.73

General practitioner management plan

135 (21.2%)

53 (25.4%)

1.06 (0.72–1.57)

0.78

Specific comorbid conditions/medications*

Depression

187 (29.3%)

51 (24.4%)

0.78 (0.54–1.13)

0.19

Anxiety

73 (11.4%)

22 (10.5%)

0.91 (0.55–1.51)

0.72

Chronic respiratory disease

174 (27.2%)

53 (25.4%)

0.96 (0.67–1.38)

0.82

Heart failure

121 (18.9%)

55 (26.3%)

1.53 (1.06–2.21)

0.02

Dementia

15 (2.2%)

5 (2.4%)

1.02 (0.37–2.84)

0.97

End-stage renal disease

26 (4.1%)

16 (7.7%)

1.96 (1.03–3.72)

0.04

Cancer

18 (2.8%)

10 (4.8%)

1.46 (0.62–3.43)

0.39

Urinary incontinence

25 (3.9%)

11 (5.3%)

1.37 (0.66–2.82)

0.40

Non-steroidal anti-inflammatory drugs

61 (9.5%)

23 (11.0%)

1.17 (0.71–1.95)

0.54

Oral corticosteroids

88 (13.8%)

36 (17.2%)

1.36 (0.85–1.99)

0.22

Anti-psychotics

41 (6.4%)

19 (9.1%)

1.46 (0.83–2.60)

0.19

Anti-diabetic medicines

Median number of medicines for diabetes (IQR)

1 (1–2)

1 (0–2)

0.94 (0.79–1.10)

0.43

Insulins and analogues (ATC code, A10A)

162 (25.4%)

50 (23.9%)

0.99 (0.68–1.43)

0.95

Other anti-diabetic medicine (ATC code A10B)

328 (51.3%)

100 (47.8%)

0.84 (0.61–1.17)

0.30

Insulin and other anti-diabetic

104 (16.3%)

27 (12.9%)

1.02 (0.99–1.05)

0.22

Number of prior hospitalisations*

None

269 (42.1%)

70 (33.5%)

Reference

1

169 (26.4%)

52 (24.9%)

1.18 (0.78–1.78)

0.37

2

106 (16.6%)

38 (18.2%)

1.38 (0.88–2.17)

0.86

> 2

95 (14.9%)

49 (23.4%)

1.98 (1.29–3.06)

0.009

Type of prior hospitalisations*

Diabetes-related admission

37 (5.8%)

24 (11.5%)

1.63 (0.94–3.17)

0.08

Cardiovascular-related admission

132 (20.7%)

67 (32.1%)

1.36 (0.89–2.05)

0.07

Infection-related admission

46 (7.2%)

25 (11.9%)

1.09 (0.60–2.07)

0.82

Respiratory-related admission

14 (2.2%)

9 (4.3%)

0.94 (0.30–2.90)

0.92


ATC = Anatomic Therapeutic Chemical classification system; LOS = length of stay. * During the 6 months before hospitalisation. During the 12 months before hospitalisation.

Box 2 –
Predictors of re-admission within 30 days of a diabetes-related hospitalisation (multivariate analyses)*

Predictors of 30-day re-admission

Adjusted odds ratio (95% CI)

P


Comorbid condition: heart failure

1.49 (1.03–2.17)

0.036

Number of prescribers

1.06 (1.01–1.08)

0.031

Two or more hospitalisations during 6 months before index admission

1.79 (1.15–2.78)

0.009


* Backward stepwise multivariate logistic regression: all variables with α ≤ 0.10 in the univariate analyses in were included; only those for which α ≤ 0.05 were included in the final model. Goodness-of-fit test: P = 0.67. † Odds ratio: for each additional prescriber.

Box 3 –
Time between discharge and re-admission for 209 patients re-admitted within 30 days of an index admission for diabetes

The Australasian Diabetes Data Network: first national audit of children and adolescents with type 1 diabetes

The known International diabetes registries report that many young people with type 1 diabetes do not meet recommended targets for glycaemic control. Relevant Australian data have been lacking. 

The new 73% of Australian children and adolescents with type 1 diabetes do not meet the recommended target for glycaemic control. Uptake of intensive insulin therapy varies between diabetes centres. Rates of overweight and obesity were higher than for this age group in the general population. 

The implications Strategies for improving glycaemic control in young people with diabetes are urgently needed to prevent the acute and chronic complications of this disorder. 

Large population-based diabetes registers in several countries have collated data on glycaemic control, management and clinical outcomes for young people with diabetes, facilitating the international benchmarking of paediatric diabetes centres.1 Analysis of these databases has indicated that glycaemic control in many young people with type 1 diabetes is suboptimal; 54–84% do not achieve the internationally established target haemoglobin A1c (HbA1c) level for young people (below 58 mmol/mol).2,3 This statistic has prompted discussion of the evidence-based management of childhood diabetes and the most effective application of emerging therapies. Several registers have reported improved glycaemic control over time,4,5 and it has been proposed that benchmarking activity, consisting of actively identifying problems and adopting systematic improvement methods (including reporting of results by centre), has contributed to improving patient outcomes.5

In Australia, state-based diabetes incidence registers have operated for more than 20 years; the National Diabetes Register (NDR), which sources data from these registers, was established in 1999.6 However, the NDR reports only the overall incidence and prevalence of insulin-treated diabetes in Australia. While a number of paediatric diabetes centres with established clinical databases have reported clinical outcomes for younger patients over recent decades,710 there has been no national surveillance of glycaemic control or the management of diabetes in young people. More recently, a national audit of paediatric diabetes centres described variations in staffing and resources, and reported that clinician-to-patient ratios were below recommended levels, particularly in allied health care and psychological services.11

The Australasian Diabetes Data Network (ADDN) is a prospective longitudinal diabetes register that provides the first opportunity for the long term monitoring of diabetes outcomes of a national sample of Australian patients. The ADDN is an initiative of the Australasian Paediatric Endocrine Group (APEG), the Australian Diabetes Society (ADS), and the Juvenile Diabetes Research Foundation Australia Clinical Research Network. The development of the ADDN has been described in detail elsewhere.12 In this article, we report on glycaemic control, anthropometry, and insulin regimens in a cross-section of Australian children and adolescents with type 1 diabetes.

Methods

The ADDN model involves the transfer of de-identified, prospectively collected patient data from the clinical databases or electronic medical record systems of participating ADDN centres to a web-based staging server hosted by the University of Melbourne. Participating centres collect data using a common data dictionary. Data are transferred every 6 months to the ADDN registry from the five largest paediatric diabetes centres in Australia, located in New South Wales, Queensland, South Australia, Victoria and Western Australia.

We analysed data extracted from the ADDN registry for 1 January 2015 – 31 December 2015 for patients who had been diagnosed with type 1 diabetes at least 12 months before their visit to the paediatric diabetes centre, and who were 18 years old or younger at the time of the visit.

Glycaemic control was assessed by measuring HbA1c levels, using either point-of-care or laboratory methods that complied with national accreditation programs for laboratory testing. Body mass index standard deviation scores (BMI-SDS; measures of relative weight adjusted for child age and sex) were calculated from height and weight, using the Centers for Disease Control and Prevention 2000 reference scale for children aged 2–18 years (CDC-2000).13 Children were classified as either normal/underweight, overweight, or obese according to the International Obesity Task Force guidelines.14 Insulin regimens were classified as twice-daily injections (BD), multiple daily injections (MDI; ie, at least three injection times per day), or continuous subcutaneous insulin infusion (CSII). Mean HbA1c levels and BMI-SDS were estimated for each participant over the 12-month study period, with the most recent recorded insulin regimen used for analysis. The descriptive statistics reported are means with standard deviations (SDs) for normally distributed variables and medians with interquartile ranges (IQRs) for skewed data. Statistical analyses were performed in Stata IC 14.0 (StataCorp).

Ethics approval

Ethics approval was granted by the Hunter New England Human Research Ethics Committee (HREC) (for all New South Wales sites: reference, 08/11/19/5.04), the Children’s Health Services Queensland HREC (for all Queensland sites: reference, HREC/09/QRCH/68; amendment: HREC/09/QRCH/68/AM02), the Women’s and Children’s Health Network HREC (for all South Australian sites: reference, REC1048/2/16), the Royal Children’s Hospital HREC (for all Victorian sites: reference, DAF DA032-2014-01), and the Princess Margaret Hospital for Children HREC (for all Western Australian sites: reference, 2013051EP). Informed consent was obtained from parents and from adolescents over 14 years old, and, when required by the HREC, assent was obtained from children aged 10–14 years.

Results

The clinical characteristics of the 3279 children and adolescents meeting the inclusion criteria for whom data were registered in the ADDN registry during 2015 are shown in Box 1, stratified by centre. 52% were boys. Clinical characteristics stratified by age group and insulin regimen are presented in Box 2.

Glycaemic control

The mean number of HbA1c measurements per patient was 3.0 (SD, 1.1); 99% of the patients had at least one recorded HbA1c measurement during 2015. The mean HbA1c level was 67 mmol/mol (SD, 15 mol/mol; Box 1). Mean HbA1c level increased with age, from 63 mmol/mol (SD, 11 mol/mol) in children aged 6 years or under to 69 mmol/mol (SD, 17 mol/mol) in adolescents 14–18 years old (Box 2). Overall, 3% of patients had HbA1c levels greater than 108 mmol/mol; only 27% met the APEG/ADS national guidelines target level of less than 58 mmol/mol,3 and the proportion of children and adolescents meeting this target declined with age, from 34% of those aged 6 years or less to 25% of those aged 14–18 years (Box 3). When stratified by insulin regimen, there was little difference in mean HbA1c level within age groups, but adolescents (14–18 years old) treated with BD insulin had the highest mean HbA1c levels (77 mmol/mol; SD, 19 mmol/mol; Box 2).

Anthropometry

Anthropometric measurements were available for 99% of participants. The mean BMI-SDS was 0.6 (SD, 0.9). Children aged 6 or less had higher BMI-SDS scores than older children and adolescents. The prevalence of being overweight was 25% and of obesity 8%, with the highest proportions in the youngest and the oldest children (Box 1, Box 2).

Insulin regimen

The insulin regimen was recorded for 98% of participants: CSII was used by 44%, MDI by 38%, and BD by 18%. The pattern of insulin regimen use varied between ADDN centres (Box 1) and age groups (Box 2); BD regimens were more frequent in the youngest age groups, with more than one-third of children under 10 using BD insulin therapy.

Discussion

In this first nationwide snapshot of Australian children and adolescents with type 1 diabetes, fewer than one-third had attained the national and international recommended HbA1c target level of less than 58 mmol/mol.2,3 It has been established that the risk of microvascular and macrovascular complications is increased for children and adolescents who do not reach this target; evidence is also emerging that poor glycaemic control in childhood persists into adulthood, increasing the lifetime risk of complications.15 One-third of children and adolescents in our snapshot were overweight or obese, conditions also associated with a greater risk of complications and other comorbidities.16

The proportion of Australian children and adolescents achieving appropriate glycaemic control is comparable with that reported by a number of overseas registries,1 but lower than that in Sweden and Germany, where 41% and 49% respectively achieved the target.4,5 It is concerning that the national median HbA1c level in 2015 was similar to that reported in NSW in 1999 (8.2% = 66 mmol/mol)17 and that the proportion of young people reaching the recommended glycaemic control target in 2015 was similar to that in Brisbane in 1998 (33%).7 Further, our participants were all treated in specialist tertiary referral diabetes centres; as the ADDN database expands to include children from less specialised centres, the characteristics of the participant group may change. Our results indicate a need to substantially improve outcomes, a common theme worldwide.

Managing diabetes in adolescents is particularly challenging for clinicians. Parental involvement in the self-management of diabetes by adolescents often declines at the same time as the changes associated with the metabolic effects of puberty and growth commence. Only one-quarter of the 1425 adolescents (14–18 years) in our study met the recommended target for glycaemic control. We did not assess people over 18, but evidence is emerging that the deterioration of glycaemic control during adolescence continues into early adulthood, and does not improve to recommended levels before age 30;15 limited Australian data also indicate that targets for glycaemic control are not even closely approached by young adults.18

The ADDN centres included in this report are all publicly funded hospitals in metropolitan areas with comparable patient numbers, so we were not surprised to find similar levels of glycaemic control. We had incomplete data about the ethnic background and socio-economic status of the participants, factors known to influence glycaemic control in other populations; children from minority groups or socio-economically disadvantaged backgrounds in the United Kingdom, for example, were reported to have higher HbA1c levels.19 Ideally, the effect of these and other modifiable factors on levels of glycaemic control should be explored using longitudinal data adjusted for confounders. This is one of the major goals of the ADDN, and our report provides important baseline data.

The mean of 3.1 visits by patients to diabetes centres each year is lower than the 3.7 reported by a national audit in 2010.11 HbA1c is assessed routinely during such visits, and the mean annual number of HbA1c measurements was 3.0 per patient in our sample. In a recent report based on data for more than 79 000 patients with diabetes in the UK, less frequent HbA1c assessment was associated with poorer glycaemic control; the optimal frequency was four times per year.20 The ADDN centres included in this report are tertiary referral centres with multidisciplinary diabetes teams, but we did not examine the types of health professional seen by the patient, nor the overall staff structure of the diabetes teams. Nevertheless, limited access to the full range of allied health professionals recommended for the intensive management of diabetes was reported in 2010,11 and the relationship between staffing levels and glycaemic control should be investigated in future analyses.

To reduce the risk of vascular complications, intensive insulin therapy, including MDI or CSII therapy, is recommended for children, adolescents and adults with type 1 diabetes.3 Clinicians must balance this recommendation against individual patient characteristics and the specific clinical situation. In our study, more than one-third of children under 10 years of age were treated with BD insulin therapy. This may reflect the challenges of managing diabetes in the school setting and the capacity of schools to provide adequate support for intensive insulin therapy.21

The overall uptake of CSII in this sample was 44%; the rate varied little between age groups, but differed between ADDN centres. The consistency of CSII uptake across age groups contrasts with a recent report from three registries including data for 54 410 children and adolescents with type 1 diabetes recruited from clinics in Germany and Austria, the United States and the UK.22 In Germany and Austria, about 70% of children under 6 years of age with type 1 diabetes were treated with CSII, compared with 35–40% of older children. In the US, 30% of children under 6 used CSII, compared with 40–45% of older children, while in the UK 15–20% of children across all age groups used CSII. In a pooled cross-sectional analysis of data from the three registries, the mean HbA1c level was 5.5 mmol/mol lower in children and adolescents treated with CSII than in those using insulin injections. Similarly, an Australian study of children and adolescents with type 1 diabetes found a mean reduction of 6.6 mmol/mol HbA1c associated with CSII.23

In our sample, there was little variation in mean HbA1c levels between centres, despite the differing uptake of CSII. However, patient selection bias is possible when comparing outcomes according to their insulin regimens. For example, adolescents with high HbA1c levels may be moved from more intensive treatment to the simpler BD therapy in an attempt to improve glycaemic control. The relationship between HbA1c level and insulin therapy should be examined by multivariable analysis of longitudinal data, with adjustment for potential confounders. The rates of CSII use in different countries may reflect variations in funding models, clinical practice, and patient demand. In Australia, insulin pumps are available to patients with private health insurance, or through a means-tested pump access program administered by Juvenile Diabetes Research Foundation (JDRF) Australia. It would be valuable to further explore the factors that influence choice of therapeutic regimen for Australian children and adolescents with type 1 diabetes.

In our sample, 33% of children and adolescents with type 1 diabetes were overweight or obese, with little difference between ADDN centres. This is higher than the rate (27%) for children and adolescents in the general population.24 Our finding is consistent with the reported rate for children and adolescents under 16 with type 1 diabetes in NSW.25 The youngest children had the highest mean BMI-SDS scores; the proportions who were overweight or obese were highest for the youngest and oldest children. This contrasts with a 2007 report from Victoria that the mean BMI-SDS was lowest (0.64) in children with type 1 diabetes under 5 years of age.26 Healthy weight is an important goal for children and adolescents with type 1 diabetes, as being overweight has implications for long term health. Further, obesity, as a marker of insulin resistance, is associated with early neuropathy16 and retinopathy, as well as with higher HbA1c levels and rates of severe hypoglycaemia.27 The challenges for maintaining healthy weight associated with type 1 diabetes include weight gain as the result of supra-physiological insulin doses, and overeating to avoid or treat hypoglycaemia.

Our survey of glycaemic control involved more than 3000 children and adolescents with type 1 diabetes from diverse geographic regions, but we do not know if our data are representative of all Australian children with type 1 diabetes, as the participants were seen in five large tertiary, city-based diabetes centres. Further, ascertainment of data differed between states: most children with type 1 diabetes in WA are managed at one centre, in contrast to other states, where diabetes care is less centralised. As the ADDN enters phase 2, when it will include regional and remote and adult diabetes centres, the representativeness of the available data will improve.

In conclusion, the ADDN project has shown that benchmarking glycaemic control, use of insulin therapies, and anthropometry across Australian paediatric diabetes centres is feasible. It is worrying that less than one-third of Australian children and adolescents with diabetes type 1 met the recommended target for glycaemic control, and that rates of being overweight or obese were higher than in the general Australian population of children and adolescents. As the ADDN registry grows, so will its ability to explore and understand the factors that influence clinical outcomes for Australian children and adolescents, supporting our aim of continually appraising and improving the diabetes services we provide.

Box 1 –
Clinical characteristics of Australian children and adolescents with type 1 diabetes, as registered in the Australasian Diabetes Data Network (ADDN) registry during 2015, by ADDN centre

All centres

Australasian Diabetes Data Network centre


New South Wales

Queensland

Western Australia

Victoria

South Australia


Number of children and adolescents

3279

614

382

832

927

524

Age (years), mean (SD)

12.8 (3.7)

13.0 (3.5)

12.0 (3.4)

12.8 (3.7)

13.0 (3.8)

12.4 (3.8)

Sex (male)

1705 (52%)

315 (51%)

202 (53%)

419 (50%)

484 (52%)

285 (54%)

Duration of diabetes (years), mean (SD)

5.7 (3.7)

6.3 (3.7)

4.8 (3.4)

5.8 (3.8)

5.8 (3.6)

5.6 (3.8)

Number of visits to centre, mean (SD)

3.1 (1.1)

3.2 (1.4)

3.0 (1.2)

3.4 (1.1)

3.0 (0.9)

3.0 (1.1)

Number of HbA1c measurements, mean (SD)

3.0 (1.1)

3.1 (1.3)

2.8 (1.1)

3.3 (1.0)

2.9 (0.9)

2.9 (1.1)

HbA1c level (mmol/mol), mean (SD)

67 (15)

69 (16)

67 (15)

66 (16)

66 (13)

70 (15)

HbA1c level (mmol/mol), median (IQR)

65 (58–74)

66 (59–77)

65 (57–73)

63 (55–71)

64 (58–71)

67 (61–78)

HbA1c level < 58 mmol/mol

876 (27%)

145 (24%)

103 (27%)

300 (36%)

242 (26%)

86 (16%)

Body mass index–standard deviation score, mean (SD)

0.6 (0.9)

0.7 (0.9)

0.6 (0.9)

0.5 (0.9)

0.8 (0.9)

0.6 (0.9)

Underweight/normal weight*

2168 (67%)

391 (64%)

256 (68%)

604 (73%)

560 (61%)

357 (69%)

Overweight*

828 (25%)

159 (26%)

85 (23%)

191 (23%)

263 (29%)

130 (25%)

Obese*

257 (8%)

60 (10%)

34 (9%)

36 (4%)

98 (10%)

29 (6%)

Insulin regimen

Two injections per day

564 (18%)

12 (2%)

12 (4%)

124 (15%)

352 (38%)

64 (12%)

Three or more daily injection times

1219 (38%)

227 (37%)

171 (52%)

339 (41%)

299 (32%)

183 (35%)

Continuous subcutaneous insulin infusion pump

1428 (44%)

373 (61%)

144 (44%)

368 (44%)

269 (29%)

274 (53%)


* Defined according to International Obesity Task Force guidelines, adjusted for age (2–18 years of age) and sex.

Box 2 –
Clinical characteristics of Australian children and adolescents with type 1 diabetes, as registered in the Australasian Diabetes Data Network registry during 2015, by age group and insulin regimen

Average age over 12 months (2015)


≤ 6 years

< 6–10 years

> 10–14 years

> 14–18 years


Number of children and adolescents (proportion of all participants)

185 (6%)

575 (18%)

1094 (33%)

1425 (44%)

Sex (male)

109 (59%)

308 (54%)

540 (49%)

748 (52%)

Duration of diabetes (years), mean (SD)

2.2 (1.0)

3.7 (2.0)

5.3 (3.1)

7.4 (4.0)

Insulin regimen

Two injections per day

61 (34%)

193 (34%)

162 (15%)

148 (10%)

Three or more daily injection times

41 (23%)

124 (22%)

396 (37%)

658 (46%)

Continuous subcutaneous insulin infusion pump

79 (43%)

243 (44%)

510 (48%)

596 (43%)

HbA1c level (mmol/mol), mean (SD)

All regimens

63 (11)

62 (10)

68 (14)

69 (17)

Two injections per day

65 (12)

64 (11)

70 (15)

77 (19)

Three or more daily injection times

63 (10)

63 (10)

69 (15)

70 (17)

Continuous subcutaneous insulin infusion pump

62 (9)

60 (8)

66 (11)

67 (15)

HbA1c < 58 mmol/mol

62 (34%)

202 (35%)

260 (24%)

352 (25%)

Body mass index–standard deviation score, mean (SD)

1.0 (0.9)

0.6 (0.7)

0.5 (0.9)

0.7 (0.9)

Underweight/normal weight*

112 (61%)

436 (76%)

753 (69%)

867 (61%)

Overweight*

56 (31%)

107 (19%)

261 (24%)

404 (29%)

Obese*

15 (8%)

32 (6%)

70 (7%)

140 (10%)


* Defined according to International Obesity Task Force guidelines, adjusted for age (2–18 years of age) and sex.

Box 3 –
Haemoglobin A1c (HbA1c) levels of 3279 Australian children and adolescents with type 1 diabetes, as registered in the Australasian Diabetes Data Network registry during 2015, by age group