There was a time in world health efforts when Big Men (yes, all men, European and North American) had Big Ideas, backed by money and power. They had offices in places like the World Bank, UNICEF, and the Rockefeller Foundation. And they made scientific and programmatic decisions, financing and executing schemes that affected the survival and lives of hundreds of millions of people. When their decisions were sagacious and well executed the results could be breathtaking. Millions of children might in a single year be spared death from measles, for example, thanks to a targeted immunisation campaign.
Preference: World Health
1236
[Comment] A new chapter for the NCD Alliance: stronger together
The 70th World Health Assembly (WHA) coincides with a milestone in the history and development of the NCD Alliance (NCDA), and a new chapter for non-communicable disease (NCD) advocacy.
[Editorial] National progress on antimicrobial resistance
On May 22, in the shadow of WHO Director-General elections, WHO, the Food and Agriculture Organization of the UN, and the World Organisation for Animal Health presented progress on the first open survey of countries’ national action plan preparedness on Antimicrobial Resistance (AMR) at the 70th World Health Assembly.
[Correspondence] Dr David Nabarro is the best candidate for WHO Director-General
At the World Health Assembly this month, the health ministers of the world will elect the next Director-General (DG) of WHO.
Malaria expert to head up WHO
Internationally recognised malaria researcher, Dr Tedros Adhanom Ghebreyesus from Ethiopia, will be the next Director-General of the World Health Organisation (WHO).
He will be the first African to lead the United Nations agency and will replace Dr Margaret Chan who steps down from the role at the end of June.
He will also be the first non-physician to lead WHO – holding a PhD in community health. His leadership of WHO is for a five-year term.
Dr Tedros, aged 52, was previously the Ethiopian Health Minister and the Foreign Affairs Minister, and was also the chairman of the Global Fund to Fights Aids, Tuberculosis and Malaria.
He has been elected to the Director-General’s post after winning the most votes from WHO’s 194 Member States during three rounds of secret ballots that began in January and culminated on May 23.
In a three-way face-off during the final vote, he first knocked off Pakistan’s Dr Sania Nishtar then defeated Britain’s Dr David Nabarro 133 votes to 50 (with some abstentions).
The agency has been criticised for its response to the Ebola epidemic in West Africa – particularly for missing warning signs of just how bad 2013 outbreak that went on to kill more 11,000 would be.
Before being elected, Dr Tedros committed WHO to responding to future emergencies more rapidly and effectively.
And he has promised to champion the health rights of the world’s poor.
“All roads should lead to universal health coverage. I will not rest until we have met this,” he said while campaigning for the role.
“(My vision as the new Director-General is of a) world in which everyone can lead health and productive lives, regardless of who they are or where they live.
“I promise I will get up every day, determined to make a difference. I am ready to serve.”
The campaign was controversial at times, with Dr Tedros being accused of covering up cholera epidemics in Ethiopia – accusations that have been vigorously denied.
His candidacy was also greeted by Ethiopian opposition groups as an attempt to improve the country’s profile and smooth over accusations of human rights abuses by its government.
Dr Tedros has listed his top priorities in the new role as: advancing universal health coverage; ensuring WHO responds rapidly and effectively to disease outbreaks and emergencies; putting the wellbeing of women, children and adolescents at the centre of global health and development; helping nations address the effects of climate change on health; and making the agency transparent and accountable
Chris Johnson
World body upholds Australian law on tobacco plain packaging
Following a five-year legal battle, the World Trade Organisation (WTO) has upheld the landmark Australian law on restrictive tobacco packaging, better known as plain packaging.
Tobacco firms claimed their trademarks were being infringed, while Cuba, Honduras, Dominican Republic and Indonesia complained at the WTO that the rules constituted an illegal barrier to trade.
Australia was the first country to sign on to the World Health Organisation’s (WHO) Framework Convention on Tobacco Control. Bipartisan support in the federal parliament enabled the introduction of legislation so that all tobacco products sold, offered for sale, or otherwise supplied in must be in plain packaging.
Evidence demonstrates that changes to tobacco packaging there led to more than 100,000 few smokers in Australia in the first 34 months since implementation in 2012.
Former Australian Health Minister Nicola Roxon, who oversaw the introduction of plain packaging for cigarettes, said the decision should encourage other countries to follow suit.
“We’ve already seen a large number of countries introduce or take steps to introduce plain packaging, so it’s a really significant international outcome,” Ms Roxon said.
As laid out in the WHO Framework Convention on Tobacco Control, the plain packaging of tobacco products entails restricting or prohibiting the use of logos, colours, brand images or any promotional information other than brand and product names displayed in a standard colour and font.
The objectives of tobacco plain packaging as set out in the Tobacco Plain Packaging Act 2011 are to improve public health by discouraging people from using tobacco products, encouraging people to give up using tobacco products, discouraging relapse of tobacco use and reducing exposure to tobacco smoke.
The United Nations continues to advocate for the use of plain packaging of tobacco products in an effort to save lives by reducing demand for such products, which kill nearly 6 million people every year.
Six nations have legislated for and have implemented or will shortly be implementing plain packaging (Australia, France, UK, Norway, Ireland and Georgia) and a more are set to follow.
Tobacco smoking is the single largest preventable cause of premature death and disease in Australia. Smoking contributes to more deaths and hospitalisations than alcohol and illicit drug use combined. While smoking prevalence in Australia has declined over time, the 2010 National Drug Strategy Household Survey found that 2.8 million Australians aged 14 years or older still smoke daily (15.1 per cent). Continued effort is therefore necessary to maintain the decline and reduce the social and economic costs of tobacco use to the community.
The AMA recognises that tobacco is unique among consumer products in that it causes disease and premature death when used exactly as intended. There is no safe level of tobacco smoking.
The AMA also believes that all forms of public promotion and marketing of tobacco products should be banned.
Meredith Horne
[Editorial] WHO: Director-General campaign closes amid anxiety and hope
The current race to replace Margaret Chan, outgoing Director-General of WHO, has been a different kind of contest. The unprecedented level of transparency and accountability in the election campaign is to be welcomed—voting by member states and not only by the agency’s executive board, publication and scrutiny of candidate manifestos, and public debates. But will the final decision making, to take place next week at the World Health Assembly in Geneva, also be different? The vote remains a secret ballot, member states can pledge their support to one candidate but vote for another, and, in the end, the choice of WHO’s next leader, still the world’s top international health post, will be as political as ever.
[Correspondence] Open letter to WHO DG candidates: keep policy and priority setting free of commercial influence
In May, 2017, WHO Member States will meet in Geneva for the 70th World Health Assembly (WHA) and a new WHO Director-General (DG) will be elected. As public-interest non-government organisations (NGOs) involved in global health governance and the prevention and treatment of chronic diseases, we believe that a fundamental consideration for Member States when electing the DG will be how the new leadership will ensure appropriate interactions with alcohol, food, pharmaceutical, and medical technology industries.
[Correspondence] Health professional associations and industry funding—reply from Parry et al
We write to commend Anthony Costello and colleagues1 for their Correspondence regarding the recent decision by the UK Royal College of Paediatrics and Child Health (RCPCH) to continue accepting funds from manufacturers of breast milk substitutes (BMS). This decision violates the World Health Assembly International Code of Marketing of Breast-milk Substitutes (also known as the International Code).
Prevalence of microcephaly in an Australian population-based birth defects register, 1980–2015
The known Microcephaly has recently received increased attention because it is associated with congenital Zika virus infection. The World Health Organization recommends that countries at risk of Zika virus transmission collate baseline data on the historical prevalence of microcephaly.
The new We report the prevalence and characteristics of microcephaly in a geographically defined Australian population over a 35-year period. Significant rate differences between Aboriginal and non-Aboriginal births were identified.
The implications Our study provides a useful baseline that will allow changes in microcephaly prevalence to be measured, and raises important matters for consideration by other jurisdictions reviewing their birth defects surveillance systems.
Microcephaly is a birth defect in which a child’s head is smaller than expected for their age, sex and ethnicity; there are, however, varying operational definitions of how much smaller (eg, head circumference below the first or third percentile, or more than two or three standard deviations below the mean value). The lack of a universally accepted definition complicates the comparison of prevalence estimates, which range from 2 to 12 per 10 000 live births in the United States,1 0.5 to 10 per 10 000 total births in EUROCAT registries (source: http://www.eurocat-network.eu/accessprevalencedata/prevalencetables), and 2 to 6 per 10 000 total births in Australia.2–4
Known causes of microcephaly include genetic conditions, metabolic diseases, teratogens (eg, alcohol), severe malnutrition (eg, extreme placental insufficiency), and transplacental infections.5 For many children the cause is unknown.
Microcephaly has recently gained increased attention because of its association with congenital Zika virus infection.6 It is predicted that more than 2.2 billion people live in areas where there is a risk of Zika virus infection.7 Local transmission has recently been reported in Singapore8 and in other common travel destinations for Australians.9 The most common vector, the mosquito Aedes aegypti, is found in northern and central Queensland; although local transmission of Zika virus has not been reported, returning travellers with Zika viraemia could infect local mosquitoes and thereby cause a local outbreak. A. aegypti was once present in other Australian states and territories, and there is concern that the mosquito could become re-established outside Queensland.10
Because of the many travellers returning from Zika-affected countries and the potential for Zika virus transmission to become established in Australia, we report baseline data on the prevalence and characteristics of microcephaly in a geographically defined Australian population over a 35-year period (1980–2015).
Methods
Cases of microcephaly were identified in the Western Australian Register of Developmental Anomalies (WARDA), a population-based statutory register with high ascertainment of developmental anomalies (cerebral palsy and birth defects).3,11 Birth defects are defined as structural or functional abnormalities present from conception or before the end of pregnancy and ascertained after a live birth (diagnosed by 6 years of age), stillbirth (minimum 20 weeks’ gestation), or a pregnancy terminated because of detected fetal anomalies (regardless of gestational age). Each defect (up to ten per case) is coded according to the British Paediatric Association extension to the International Classification of Diseases, ninth revision (BPA–ICD9).12
WARDA defines microcephaly as an occipito-frontal head circumference below the third percentile or more than two standard deviations (SDs) below the mean sex- and age-appropriate distribution curve. Any known primary cause (eg, infection, clinical syndrome) is recorded, but the head circumference measurements are not recorded. All identified cases fulfilled the third percentile criterion; either the head circumference measurement was validated by WARDA staff, or the notifier (specialist, genetics services, neonatal units) confirmed applying this criterion. The definition and registration criteria have not changed since 1980.
We identified all cases of microcephaly (BPA–ICD9, 742.10) recorded during January 1980 – December 2015. Each case was reviewed and classified according to aetiology:
-
cause unknown;
-
microcephaly associated with a chromosomal defect;
-
monogenic disorder known to affect head size;
-
known environmental cause (eg, fetal alcohol spectrum disorder [FASD]);
-
congenital infection; or
-
other cause.
We also grouped cases according to whether microcephaly was the only defect (“isolated”), or further major birth defects were reported (“associated”). We examined the age at diagnosis and notification sources.
Microcephaly prevalence was defined as the total number of cases (in live births, stillbirths and terminations of pregnancy for fetal anomaly) divided by the number all births in WA, expressed as number per 10 000 births. Tabulated denominator data for all WA live and stillbirths of at least 20 weeks’ gestation during the study period were obtained from the statutory WA Midwives Notification System. The average annual change in prevalence was calculated by Poisson regression with an offset term. Birth prevalence rates were analysed according to sex, mother’s Aboriginal status, region of residence, known v unknown cause, and isolated v associated microcephaly. We examined associated defects by organ system in cases with known and unknown causes. The prevalence of microcephaly of known and unknown cause in Aboriginal births (5.7% of births during the study period) was compared with that in non-Aboriginal births as prevalence ratios (PRs) with 95% confidence intervals (CIs). Analyses were performed in SPSS 23 (IBM) and EpiBasic (Aarhus University, Denmark).
Ethics approval
Ethics approval was obtained from the Human Research Ethics Committee of the WA Health Department (reference, 2016/19).
Results
Among 963 126 births during 1980–2015, 478 cases of microcephaly were ascertained, a prevalence of 5.0 per 10 000 births (95% CI, 4.53–5.43). For births during 1980–2009 (ie, with at least 6 years’ follow-up and therefore with complete case ascertainment), 416 cases were identified, a prevalence of 5.5 per 10 000 births (95% CI, 4.95–6.02), or 1 in 1830 births.
Of the cases from 1980–2009, 389 (93.5%) involved live births; there were seven stillbirths (1.7%) and 20 terminations of pregnancy for fetal anomaly (4.8%). A cause of microcephaly was identified in 186 cases (45%), and more frequently for Aboriginal (64 cases, 70%) than non-Aboriginal births (122, 38%). The most frequent known cause in Aboriginal births was FASD (11 per 10 000 births; 95% CI, 8.2–14.6); in non-Aboriginal births the most frequent causes were monogenic disorders (0.68 per 10 000 births; 95% CI, 0.51–0.90) and chromosomal defects (0.59 per 10 000 births; 95% CI, 0.42–0.79) (Box 1).
The prevalence of microcephaly of unknown cause was higher among Aboriginal than non-Aboriginal births (6.1 v 2.8 per 10 000 births; PR, 2.2; 95% CI, 1.38–3.22); this was also true for each type of known cause, but was statistically significant only for known environmental (PR, 200; 95% CI, 73–756) and infectious causes (PR, 4.2; 95% CI, 1.40–10.6) (Box 1).
There was no significant temporal trend in microcephaly prevalence during 1980–2009 (Wald χ2 test, P = 0.23; Box 2). The prevalence of microcephaly of unknown cause declined from 3.4 per 10 000 births (95% CI, 2.7–4.2) during 1980–1989 to 2.6 per 10 000 births (95% CI, 2.0–3.2) during 2000–2009, a mean decline of 1.3% per year (95% CI, –2.4% to –0.2%; P = 0.02); that of microcephaly with a known cause increased by a mean 0.4% per year (95% CI, –1.3% to 2.0%; P = 0.67). The average annual increases in the prevalence of microcephaly associated with chromosomal defects (0.6%; 95% CI, –2.1% to 3.4%; P = 0.64), monogenic disorders (0.6%; 95% CI, –2.2% to 3.4%; P = 0.67), and environmental causes (2.6%; 95% CI, –0.3% to 5.4%; P = 0.08) were statistically non-significant. We found a significant 5.6% average annual decline in the prevalence of microcephaly associated with congenital infection (95% CI, –10.0% to –1.1%; P = 0.01); the change was evident for both Aboriginal (4.4% decline; 95% CI, –12.9% to 4.2%; P = 0.32) and non-Aboriginal births (6.0% decline; 95% CI, –10.6% to –1.5%; P = 0.008), but was statistically significant only for non-Aboriginal births.
The prevalence of microcephaly was similar for male and female children, but higher for Aboriginal than non-Aboriginal Australians (PR, 4.5; 95% CI, 3.55–5.73; Box 1). Prevalence was much higher in remote regions, particularly that of microcephaly of known cause (Box 3); this was influenced by the higher proportion of Aboriginal births (and FASD) in these areas (data not shown).
The 81 cases of isolated microcephaly (20% of all cases) were all of unknown cause. All 186 cases with a known cause were associated with other major birth defects, compared with 65% of the 230 cases without a known cause (Box 4).
The overall prevalence of isolated microcephaly declined by a mean 3.4% per year (95% CI, –5.3% to –1.4%; P = 0.001); there was no significant change in the prevalence of microcephaly with associated defects (P = 0.86) (Box 2). Temporal changes in the availability of folate supplements and the introduction of folic acid fortification of some foods were not associated with changes in the prevalence of microcephaly (data not shown).
Microcephaly was diagnosed after the age of 12 months in 27% of cases, increasing from 19% during the 1980s to 29% in the 1990s and 31% during 2000–2009 (Box 5). Isolated cases were more likely to be diagnosed later (35% after 12 months of age), as were cases with a known cause (30% after 12 months of age). For most cases with a known cause diagnosed after 12 months of age, the cause was FASD (52%).
The major notification sources were geneticists, paediatricians, and obstetric and paediatric hospitals. While paediatric and obstetric hospitals maintained steady notification rates, genetics services played an increasingly important role; they contributed more than one-quarter of reported cases during 2000–2009 (data not shown). Most cases were notified by more than one source (mean, 2.8 notifications per case [SD, 1.76]; median, 2 notifications per case [interquartile range, 1–4]).
Discussion
Our study, the first descriptive epidemiological investigation of microcephaly in Australia, provides baseline data on the prevalence of microcephaly in Western Australia over a 35-year period. Most cases of microcephaly were in live-born infants (93.5%), and the overall prevalence was 5.5 per 10 000 births, with annual rates ranging between 2.9 and 7.7 per 10 000 births.
There are few published epidemiological studies of microcephaly, and comparisons are complicated by differences in case definition, period of ascertainment, pregnancy outcomes included, underlying population differences, and environmental variables. These difficulties were illustrated by a recent report of important variations in the prevalence of microcephaly recorded by 16 European birth defects registries.13 In Australia, national estimates are difficult because of major differences between states in the scope of birth defects data collections.14 The most recent national data (for births during 2002–2003),2 which did not include data from the Northern Territory, found a lower prevalence of microcephaly (1.9 per 10 000 births) than we did. Our results, however, are similar to those reported by other registers using the same case definition and equivalent follow-up periods, including the Atlanta Congenital Defects Program1 and the South Australian Register4 (5.0–5.2 per 10 000 births).
Our prevalence estimates, and those reported by birth defects registries in other countries, are well below the rate of 230 cases per 10 000 births expected when a case definition of an occipito-frontal head circumference more than two SDs below the mean for age and sex is applied. This implies that specialists are moderating their notifications according to criteria other than head circumference; these may include notifying cases when they have clinical concern about the child, or when there is an association with a particular cause (eg, trisomy 18). This moderation probably operates in most surveillance systems, including our own. Although head circumference or percentile measures were checked before registering a case of microcephaly in the database, the measurements themselves are not recorded by WARDA. Adding these data to the collection is planned, facilitating assessment of case severity and comparisons with registries using different registration criteria.
We identified a cause for microcephaly in 45% of cases, and more frequently for births to Aboriginal (70%) than to non-Aboriginal mothers (38%). The figure for non-Aboriginal births was similar to those reported from Atlanta (40%)15 and by a German clinic-based study in which the most common cause was genetic in nature (29% of 680 cases;16 similar to the 28% of non-Aboriginal births in our study). We found an average annual decline in microcephaly cases of unknown cause of 1.3%; this may be attributable to improved genetic diagnostic technologies and increasing diagnosis of FASD, factors that may also account for the declining number of cases of isolated microcephaly.
Our results highlight the contribution of FASD to microcephaly in Aboriginal children, with a prevalence of FASD-associated microcephaly (11 per 10 000 births) 260 times that for non-Aboriginal births (0.04 per 10 000 births). FASD also contributed to higher prevalence rates in remote areas of WA. A recent study found that the prevalence of fetal alcohol syndrome in remote WA Aboriginal communities among 7–8-year-old children was 12%, and that 69% of these children had microcephaly;17 another study reported a twofold increase in FASD notifications to WARDA for both Aboriginal and non-Aboriginal births during 1980–2010, coinciding with increased state and national awareness of FASD.18 Nevertheless, FASD is still underdiagnosed, and this may partly explain the higher prevalence of microcephaly of unknown cause in Aboriginal children (6.1 v 2.8 per 10 000 non-Aboriginal births), and may also account for some cases of unknown cause in non-Aboriginal infants. The higher prevalence of microcephaly of unknown cause among Aboriginal Australians may also be related to the relative lack of access to or engagement with health care services and the paucity of genomic reference data for Aboriginal Australians.19 The release of the Australian guide for diagnosing FASD20 and the Partnership Grants (“Models and quality of genetic health services for Aboriginal and Torres Strait Islander people”) co-funded by the National Health and Medical Research Council and the Lowitja Institute may advance aetiological investigations. In addition, a major research program for investigating the diagnosis, prevention and management of FASD is underway in WA.21
In 27% of cases, microcephaly was diagnosed in children more than 12 months old. This large proportion would be missed were ascertainment periods shorter. This factor may be particularly important when differentiating cases of known and unknown cause, especially when microcephaly is associated with conditions (such as FASD and specific genetic anomalies) that are often diagnosed at a later age.18
Further major birth defects were associated with 80% of cases of microcephaly. The most frequent in cases of unknown cause were those affecting the nervous system (61% of associated defects), including neural tube defects (13%). The US National Birth Defects Prevention Network suggests excluding microcephaly associated with neural tube defects, holoprosencephaly, craniosynostosis, and conjoined twins.5 We favour broader inclusion criteria, especially in light of the evolving understanding of the full spectrum of defects that may be associated with congenital Zika infection. One in five definite or probable cases of congenital Zika syndrome in a large case series from Brazil were associated with brain abnormalities in infants without microcephaly, suggesting that surveillance should not focus on microcephaly alone.22 Other defects associated with Zika infection include intracranial calcifications, craniofacial malformations, severe arthrogryposis, and eye defects.23 WARDA includes each of these in its data collection.
Zika virus is the first mosquito-borne virus associated with human birth defects, and is also sexually transmissible. A recent editorial in the MJA24 highlighted the robust Australian systems that enable rapid responses to newly identified communicable diseases, but our capacity for monitoring birth defects was not discussed. Medical practitioners have been advised to ask pregnant women about their recent travel history and to offer testing to those who have visited Zika-affected areas. Birth defect registries that record the causes of birth defects are therefore likely to capture cases of microcephaly or other defects associated with Zika virus exposure in returned travellers. Our capacity to detect changes in the prevalence of microcephaly caused by local transmission of the virus is less clear, as infection is frequently asymptomatic, and the collection of data on birth defects in this country is not standardised, with wide variability between states in case ascertainment.14
As remote regions in Northern Australia either already harbour or are at risk of harbouring A. aegypti mosquitoes, enhanced monitoring of birth defects in these areas (and also of FASD) is important. The Australian Paediatric Surveillance Unit project for the surveillance of microcephaly in infants under 12 months of age is important for responding to the challenges of geographically equitable case ascertainment.25
Attempts to standardise state and territory birth defects data collections have been unsuccessful.26 In the absence of national data, our study provides a useful baseline for measuring changes in microcephaly prevalence, and highlights important matters for consideration by other jurisdictions reviewing their birth defects surveillance systems.
Box 1 –
Prevalence of microcephaly (per 10 000 births) by cause and Aboriginal status of the mother, Western Australia, 1980–2009
|
Cause |
All cases |
Aboriginal |
Non-Aboriginal |
Prevalence ratio (95% CI) |
|||||||||||
|
Number |
Prevalence (95% CI) |
Number |
Prevalence (95% CI) |
Number |
Prevalence (95% CI) |
||||||||||
|
|
|||||||||||||||
|
Total number of cases |
416 |
5.5(4.95–6.02) |
91 |
21(16.5–25.2) |
325 |
4.5(4.05–5.05) |
4.5(3.55–5.73) |
||||||||
|
Unknown cause |
230 (55%) |
3.0(2.64–3.44) |
27 |
6.1(4.01–8.86) |
203 |
2.8(2.46–3.25) |
2.2(1.38–3.22) |
||||||||
|
Known cause |
186 (45%) |
2.4(2.10–2.82) |
64 |
14(11.11–18.43) |
122 |
1.7(1.41–2.03) |
8.5(6.17–11.6) |
||||||||
|
Chromosomal |
47 (11%) |
0.62(0.45–0.82) |
5 |
1.1(0.37–2.63) |
42 |
0.59(0.42–0.79) |
1.9(0.59–4.86) |
||||||||
|
Monogenic |
54 (13%) |
0.71(0.53–0.93) |
5 |
1.1(0.37–2.63) |
49 |
0.68(0.51–0.90) |
1.6(0.51–4.12) |
||||||||
|
Environmental |
53 (13%) |
0.70(0.52–0.91) |
49* |
11(8.2–14.6) |
< 5 |
0.06(0.01–0.14) |
200(73–756) |
||||||||
|
Fetal alcohol spectrum disorder* |
52 |
0.68(0.51–0.90) |
49* |
11(8.2–14.6) |
< 5 |
0.04(0.01–0.12) |
260(85–1320) |
||||||||
|
Infectious |
29 (7%) |
0.38(0.26–0.55) |
6* |
1.4(0.50–2.94) |
23 |
0.32(0.20–0.48) |
4.2(1.40–10.6) |
||||||||
|
Cytomegalovirus* |
24 |
0.32(0.20–0.47) |
5* |
1.1(0.37–2.63) |
19 |
0.26(0.16–0.41) |
4.2(1.24–11.8) |
||||||||
|
Other infections |
5 |
0.07(0.02–0.15) |
< 5 |
0.22(0.01–1.26) |
< 5 |
0.06(0.01–0.14) |
4.0(0.08–40.8) |
||||||||
|
Other cause |
< 5 |
0.05(0.01–0.14) |
0 |
— |
< 5 |
0.06(0.01–0.14) |
— |
||||||||
|
|
|||||||||||||||
|
* One child was diagnosed with both cytomegalovirus infection and fetal alcohol spectrum disorder. |
|||||||||||||||
Box 2 –
Prevalence of microcephaly in Western Australia, 1980–2015: overall prevalence, and prevalence of cases with and without associated anomalies*
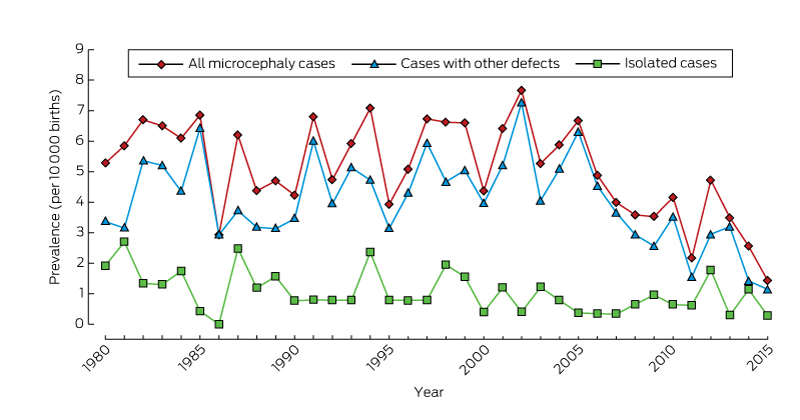
* From 2009, there is less than 6 years’ follow-up of births, so that ascertainment of cases will be incomplete.
Box 3 –
Prevalence (per 10 000 births) of microcephaly in Western Australia, 1980–2009
|
|
All cases |
Microcephaly of known cause |
Microcephaly of unknown Cause |
||||||||||||
|
Number |
Prevalence (95% CI) |
Number |
Prevalence (95% CI) |
Number |
Prevalence (95% CI) |
||||||||||
|
|
|||||||||||||||
|
All |
416 |
5.5 (4.95–6.02) |
186 |
2.4 (2.10–2.82) |
230 |
3.0 (2.64–3.44) |
|||||||||
|
Sex |
|
|
|
|
|
|
|||||||||
|
Male |
199 |
5.1 (4.41–5.85) |
85 |
2.2 (1.74–2.69) |
114 |
2.9 (2.41–3.51) |
|||||||||
|
Female |
216 |
5.8 (5.08–6.66) |
101 |
2.7 (2.22–3.31) |
115 |
3.1 (2.56–3.72) |
|||||||||
|
Missing data |
1 |
|
|
|
1 |
|
|||||||||
|
Aboriginal status of mother |
|
|
|
|
|
|
|||||||||
|
Aboriginal |
91 |
21 (16.52–25.2) |
64 |
14 (11.11–18.4) |
27 |
6.1 (4.01–8.86) |
|||||||||
|
Non-Aboriginal |
325 |
4.5 (4.05–5.05) |
122 |
1.7 (1.41–2.03) |
203 |
2.8 (2.46–3.25) |
|||||||||
|
Residential location* |
|
|
|
|
|
|
|||||||||
|
Metropolitan |
261 |
4.8 (4.24–5.42) |
103 |
1.9 (1.55–2.30) |
158 |
2.9 (2.47–3.40) |
|||||||||
|
Rural |
74 |
5.2 (4.12–6.50) |
31 |
2.2 (1.49–3.12) |
43 |
3.0 (2.21–4.10) |
|||||||||
|
Remote |
81 |
11 (8.56–13.4) |
52 |
6.9 (5.17–9.07) |
29 |
3.9 (2.59–5.54) |
|||||||||
|
|
|||||||||||||||
|
* According to the postcode of the mother as recorded by WARDA at the time of her child’s birth. The eight WA Department of Health residential location categories were grouped into three classes: metropolitan; rural (Great Southern, South-West, Wheatbelt, Midwest Murchison); and remote (Kimberley, Pilbara–Gascoyne, Goldfields–Southeast). |
|||||||||||||||
Box 4 –
Association of microcephaly (of known and unknown cause) with other congenital anomalies, Western Australia, 1980–2009
|
|
All cases |
Microcephaly of known cause |
Microcephaly of unknown Cause |
||||||||||||
|
|
|||||||||||||||
|
Total number of cases |
416 |
186 |
230 |
||||||||||||
|
Isolated microcephaly |
81 (20%) |
0 |
81 (35%) |
||||||||||||
|
Microcephaly associated with other defects |
335 (80%) |
186 (100%) |
149 (65%) |
||||||||||||
|
Associated defects by diagnostic category |
335 |
186 |
149 |
||||||||||||
|
Nervous system, apart from microcephaly |
141 (34%) |
50 (27%) |
91 (61%) |
||||||||||||
|
Neural tube defects |
25 (6%) |
6 (3%) |
19 (13%) |
||||||||||||
|
Chromosomal |
47 (11%) |
47 (25%) |
0 |
||||||||||||
|
Cardiovascular |
49 (12%) |
29 (16%) |
20 (13%) |
||||||||||||
|
Respiratory |
15 (4%) |
10 (5%) |
5 (3%) |
||||||||||||
|
Gastrointestinal |
48 (12%) |
20 (11%) |
28 (19%) |
||||||||||||
|
Musculoskeletal |
72 (17%) |
35 (19%) |
37 (25%) |
||||||||||||
|
Urogenital |
68 (16%) |
43 (23%) |
25 (17%) |
||||||||||||
|
Eye |
36 (9%) |
24 (13%) |
12 (8%) |
||||||||||||
|
Ear, face, neck |
8 (2%) |
3 (2%) |
5 (3%) |
||||||||||||
|
Integument |
4 (1%) |
2 (1%) |
2 (1%) |
||||||||||||
|
Other major diagnoses |
158 (38%) |
142 (76%) |
16 (11%) |
||||||||||||
|
Monogenic condition |
58 (14%) |
54 (29%) |
4 (3%) |
||||||||||||
|
Fetal alcohol spectrum disorder |
52 (12%) |
52 (28%) |
0 |
||||||||||||
|
|
|||||||||||||||
|
|
|||||||||||||||
Box 5 –
Number of cases of microcephaly in Western Australia, 1980–2015, by age at diagnosis
|
Age at diagnosis |
Follow-up period |
||||||||||||||
|
At least 6 years (416 cases) |
Less than 6 years (62 cases) |
||||||||||||||
|
1980–1989 |
1990–1999 |
2000–2009 |
2010–2015 |
||||||||||||
|
|
|||||||||||||||
|
Prenatal |
16 (12%) |
25 (17%) |
18 (13%) |
18 (29%) |
|||||||||||
|
Within first month of life |
47 (36%) |
49 (33%) |
40 (29%) |
16 (26%) |
|||||||||||
|
> 1 month to 1 year |
33 (26%) |
26 (18%) |
36 (26%) |
16 (26%) |
|||||||||||
|
> 1 year to 3 years |
16 (12%) |
24 (16%) |
27 (19%) |
7 (11%) |
|||||||||||
|
> 3 years to 6 years |
9 (7%) |
19 (13%) |
17 (12%) |
3 (5%) |
|||||||||||
|
Post mortem |
8 (6%) |
4 (3%) |
2 (1%) |
2 (3%) |
|||||||||||
|
|
|||||||||||||||
|
|
|||||||||||||||