×

Primary Health Networks and Aboriginal and Torres Strait Islander health

One of six priorities set by the Australian Government is for Primary Health Networks (PHNs) to focus on the health of Aboriginal and Torres Strait Islander peoples.1 Announced in the 2014–15 federal Budget, PHNs aim to coordinate primary health care provision especially for those at risk of poor health outcomes. There are 31 PHNs across Australia with several formed from consortia of Local Hospital Networks (LHNs). Operational and flexible funding of up to $842 million was committed for PHNs over 3 years from 2015–16.2 It is timely for PHNs to consider how they will improve health care coordination in partnership with Aboriginal and Torres Strait Islander communities in their respective regions.

Efforts to reduce the high hospitalisation rates of Aboriginal and Torres Strait Islander (hereafter referred to as Aboriginal) people will require PHNs to build formal participatory structures to support best practice service models. Comprehensive primary health care can then be shaped by the needs of the community rather than by ad hoc factors or reactions to financial incentives and health care funding arrangements.3,4 Collaborations with Aboriginal community controlled health services (ACCHSs) within PHN regions have been recommended.5,6

This article outlines how PHNs might support health services to systematically and strategically improve their responsiveness to Aboriginal people within their boundaries according to ten proposals. These best practice models and examples can assist PHNs to adapt their strategic plans to optimally respond to this priority.

1. Collaborate with ACCHSs

ACCHSs are authorities on comprehensive primary health care matters at the local level4,7 and do much more than just cure illness.8 As authentic representational advocates, they can guide PHN responsiveness to Aboriginal health issues and, with more than 150 services across Australia, there are ACCHSs within the regional boundaries of every PHN.

The predecessors of PHNs — the Medicare Locals — were expected to engage with ACCHSs for many Closing the Gap initiatives, such as the Indigenous Chronic Disease Package (ICDP), from 2008.9 Where meaningful partnerships between ACCHSs and Medicare Locals were established in the delivery of these programs, health outcomes for Aboriginal people substantially improved (Box 1).10

2. Establish an Aboriginal and Torres Strait Islander steering committee

PHNs can foster meaningful Aboriginal community engagement by establishing an Aboriginal and Torres Strait Islander steering committee (and Aboriginal representation on the PHN board) with membership led by ACCHSs representatives inclusive of other Aboriginal health service organisations. Similar partnership forums established between the ACCHS, general practice sectors, and state and territory governments have set Aboriginal health priorities at the jurisdictional and regional level for decades.11 The steering committee aims might be modelled on current partnerships between the LHN and ACCHSs (Appendix 1) to develop a strategic plan across the life course.

3. Establish formal agreements to support the strategic plan

PHNs should aim for partnerships to reorient health services from reactionary care to comprehensive primary health care. For example, in remote Western Australia, a partnership agreement between an ACCHS and state government health services was associated with a reversal of the increasing trend in hospital emergency department attendances among other substantial health improvements in only 6 years (Box 2).12

Partnership agreements between PHNs, ACCHSs and other agencies should support Aboriginal leadership, quality care, accountability and patient-centredness, and should be formalised from non-binding memoranda of understanding to binding contracts (Box 1 and Box 2) to support a long term vision for core activity that is flexible to local priorities.

4. Support health services to assess their systems of care

There are now health system assessment tools specifically adapted to optimise the primary health care of Indigenous Australians based on the Chronic Care Model.13 Over 200 Aboriginal primary health care services have used such tools (Appendix 2). Many ACCHSs self-audit their performance using clinical audit tools for chronic disease, maternal and child health and other health priorities, and undertake generic health systems assessment as part of continuous quality improvement (CQI).14

Health system assessment and audits of actual practice against best practice standards should be used to guide PHN (and LHN where there is conjoint responsibility) priorities to systematically enhance quality care within all primary care services in PHN boundaries. Barriers to and enablers for systems improvement, and gaps in health service responsiveness to Aboriginal health needs, will be clearer. These include improving systems for follow-up of patients, use of electronic registers and recalls, Aboriginal community engagement and leadership, the commitment of workforce and management, service infrastructure, and staff training and support.14,15

5. Embed quality assurance activity within primary health care services

A commitment to CQI is a key strategy for disease prevention (Appendix 3) and the prevention of avoidable hospitalisations (Appendix 4), and should be a universal feature of primary health care services providing care to Aboriginal and Torres Strait Islander peoples.15

A national Aboriginal and Torres Strait Islander CQI framework supported by the Australian Government will shortly be released to guide jurisdictions to assess and deliver better quality primary health care.16 PHNs should endorse and adapt this framework to coordinate efforts and develop CQI implementation plans. For example, most state and territory affiliates of the National Aboriginal Community Controlled Health Organisation provide support to ACCHSs for CQI activities; and in some jurisdictions (Queensland and the Northern Territory), CQI support programs are well developed.14

PHNs will need to engage with existing programs to identify strategies for and barriers to CQI. Supporting CQI within the network boundary will require regional facilitators, trained staff, the coordinated use of shared electronic medical records and use of local information management systems by all providers (including locums and visiting services), regular monitoring of CQI indicators, performance reporting, and agreements on data use, ownership and reporting.14

6. Expand primary health care performance reporting

All primary health care services within each PHN delivering care to Aboriginal people (and especially in receipt of financial grants or incentives specific to Indigenous Australians) should be required to undertake CQI, and to participate in regional or centralised performance reporting which can be disaggregated by Aboriginality. Primary health care performance should be a core responsibility of quality, safety and risk subcommittees of both PHNs and LHNs.3 Aggregated CQI data at PHN levels can identify health service gaps and areas that need to be improved.16

The Australian Government reporting framework for PHNs will include national, local and organisational performance indicators.17 National indicators for PHNs will include primary and community health indicators such as potentially preventable hospitalisations (these will be sourced from existing datasets such as the National Hospital Morbidity Database) not unlike what is currently reported for LHNs. Potentially preventable hospitalisations are an indirect measure of whether people are receiving adequate primary health care. The disproportionately high rate of illness affecting Aboriginal people and their poorer access to primary health care explains higher potentially preventable hospitalisation rates independent of age, sex and remoteness (Appendix 4). Age-standardised potentially preventable hospitalisation rates within PHN boundaries should be disaggregated by Aboriginality and incorporated as a performance indicator within PHN strategic plans.

The selection of local and organisational performance indicators by PHNs should be guided by the Aboriginal steering committee. Benchmarking PHN progress using Aboriginal and Torres Strait Islander national key performance indicators18 should be considered. National key performance indicators serve as both a CQI tool and performance measure in the provision of primary health care to Indigenous Australians. For example, ACCHSs are required to report on 19 key performance indicators through a standardised portal supported by the Australian Government.7 Organisational performance reporting of PHN activity should quantify the allocation of funds towards Aboriginal programs and contractors and identify whether these are ACCHSs or other services.

7. Align and endorse PHN and LHN strategic plans

Commitment to region-specific Aboriginal primary health care strategic plans should be the goal for both PHN and LHN boards so that actions are informed by both and integrated to avoid cross purposes.3 These linkages might be streamlined in regions where PHNs have been established by LHNs. However, it is unclear how many LHNs have established Aboriginal health subcommittees or effective and formalised Aboriginal community engagement mechanisms to facilitate endorsement of strategic plans.

All PHNs are expected to complete baseline needs assessment and strategies to respond to service gaps.19 If these submissions pertain to the Aboriginal and Torres Strait Islander population, they should be accompanied by evidence of endorsement by the Aboriginal representative bodies in their region.

8. Strengthen the primary health care service model

Many visiting health providers can overburden Aboriginal people in remote communities with overlapping and poorly explained services.20 A core priority for PHNs is to review the coordination of care and improve clinical pathways in all geographic regions. PHNs will need to review the efficiency of current services including generalist and specialist outreach if they are to avoid duplication, foster local or residential health services,21 and sustain local CQI systems.

Specialist outreach should complement local health services through a bottom-up approach integrated with primary health care. Specialist outreach services operating independently of existing primary health care services will need review. Service reforms might mean building hub-and-spoke models involving ACCHSs, supporting regional Aboriginal health networks (Box 1), using telehealth adapted for Aboriginal and Torres Strait Islander settings, renegotiating clinical pathways, empowering local outreach coordinators of hospitals to support primary health care models, substituting workforce tasks through nurse and Aboriginal and Torres Strait Islander health practitioners, rural generalists and physician assistants,22 and reorienting health services towards primary health care (Box 2, Appendix 5).

9. Enhance cultural competence of primary health care services

Strategies to merely increase the awareness of non-Indigenous health staff to Aboriginal cultural protocols are often recommended to reduce Aboriginal health disparities, but may not lead to cultural competence.23 Some staff still struggle with how to make services culturally responsive beyond the posting of Aboriginal artwork.20 The ICDP invested in cultural awareness training of over 6000 general practice staff but change in practice was not universally embraced.8,15

Enhancing the cultural competence of health services within PHN boundaries will require strategies best managed by the Aboriginal steering committee and may include subcontracting ACCHSs and expanding their outreach role, person-centred and family-oriented care, fostering a culturally identified workforce that reflects the patient population and health needs, staff training in cultural safety, performance measures for cultural competence, and future planning.

10. Transition primary health care services to Aboriginal community control

PHNs are to be the health “providers of last resort and their decision to directly provide services should require the approval of the Department of Health”.3 Agreement from local ACCHSs in the region should be required if a PHN opts to directly provide health services to Aboriginal communities rather than make purchasing arrangements with existing Aboriginal services (Box 1). ACCHSs should also be supported to choose their involvement in programs within the PHN boundary.

Coalitions of Aboriginal organisations have advised that future funding on Indigenous health programs be prioritised to ACCHSs being better placed to meet Aboriginal health needs with better returns on investment.24 For example, according to the ICDP evaluation, it was unclear whether Closing the Gap measures (such as financial incentives to general practices) increased the provision of services to Aboriginal people who are “hard to reach” or increased their access to primary health care.9,15 For PHNs, it makes sense to direct Aboriginal health strategies to health services with the desire and potential to provide quality care to Aboriginal patients, which is also more cost-effective.15

The Queensland and Northern Territory governments have commenced processes to transition certain health services in remote areas to Aboriginal community control.25,26 The aim is to reform remote area services from doctor-focused, illness-centred, acute hospital-based primary care services to community-engaged, comprehensive, preventive and responsive systems. Policy frameworks propose staged approaches and capacity building of existing ACCHSs. Strategic plans developed by PHNs should consider transitioning health services and responding to existing transition plans26 to ensure alignment with them.

Conclusion

These proposals offer policy makers and PHNs a framework for health service planning within newly established boundaries, and may inform PHN organisational performance reporting on efforts to close the gap in Aboriginal health disparity.

Australians report that our health system is not sufficiently patient focused. Primary care is reactive and episodic, funding structures support providers and not patients, and there is little accountability for health outcomes.4 Through existing and better targeted additional investments, PHNs can offer Aboriginal and Torres Strait Islander people some hope towards reforming access to and quality of primary health care in their localities, but only if programs and systems can better fit in with community needs. To close the gap, PHNs need to support Aboriginal communities towards greater participation in primary health care, ultimately through the expression of community control.

Box 1 –
Example: collaboration between Medicare Locals and Aboriginal community controlled health services

In 2008, to close the gap in Aboriginal health disparity, the Indigenous Chronic Disease Package funded the Care Coordination and Supplementary Services (CCSS) program. The program supports Aboriginal and Torres Strait Islander patients with complex care needs, by coordinating clinical care and providing supplementary funding for allied health, specialists, transport services and medical aids. Implementation required collaborations between Aboriginal and mainstream health services. In South-East Queensland, the Metro North Brisbane Medicare Local (MNBML) was funded to deliver the CCSS program on behalf of four other Medicare Locals in South-East Queensland. A consortium of ACCHSs — the Institute for Urban Indigenous Health (IUIH) — was subcontracted by the MNBML to implement the program in 2013–14. IUIH employed a manager to oversee the program delivered by 20.5 full-time equivalent care coordinators.

The IUIH reported that subcontracting delivered significantly more services to significantly more Indigenous Australians with complex chronic conditions than any other part of the country: “In 2013–14 IUIH and members [ACCHSs] delivered over 57 000 episodes of care via the CCSS Program. The delivery of intensive case management and access to a comprehensive range of specialist and allied health services and medical aides for this population has avoided costly hospital admissions for Government and significantly improved the health and wellbeing of some of our most vulnerable and unwell patients.”10

Box 2 –
Example: a partnership to reorient acute care to comprehensive primary health care

Clinic services in the very remote Fitzroy Valley in Western Australia are delivered by state government health services (Fitzroy Crossing Hospital and the Kimberley Population Health Unit for community health services). Non-clinical health services are delivered by the Aboriginal community controlled health service (Nindilingarri Cultural Health Services) to a population of 3500 (80% Aboriginal). These services comprise healthy lifestyle programs designed around Aboriginal culture. A formal agreement between the agencies was negotiated in 2006 to form a single governance structure to allocate funding, share an e-health record, and coordinate health promotion, cultural safety, acute inpatient care, primary care and specialist care, and population-based screening. Commonwealth funding supported the development of a shared e-health record for quality improvement and additional staff (through the Healthy for Life and Indigenous Chronic Disease programs), and provided Medicare rebates to patients for primary care services delivered at the hospital clinic (an exemption from section 19(2) of the National Health Insurance Act 1973). Medicare billings were reinvested to support this reorientation under the guidance of the partners.

This reorientation enhanced health promotion programs and was associated with a reversal of the increasing trend in emergency department attendances. In the primary care clinic, there was a substantial increase in the number of patients seen, the number of health checks, the detection of risk factors, the proportion of patients with diabetes having care plans, transport provision, cultural security and follow-up attendances in only 6 years.12

Improving health outcomes for linguistically diverse patients

Cardiovascular health for all in Australia requires language-sensitive health systems

Every day, most Australian clinicians treat patients whose first language is not English. Nearly four million Australians speak 350 non-English languages, and 17% rate their spoken English as poor.1 To date, there has been little large scale Australian research into the health impacts of not speaking the country’s dominant language.

Studies on the relationship between linguistic diversity and health outcomes are methodologically challenging. Many have been criticised for their failure to adjust for socio-economic status, education, or English language proficiency, or for using country of birth as a proxy for language spoken at home.2 The prospective cohort study by Juergens and his colleagues, published in this issue of the MJA,3 adds to research on cardiovascular disease and language by analysing mortality 6 months after discharge from hospital. The authors found that mortality was higher in patients whose first language was not English.

Two broad sets of explanations are offered when interpreting differences in health outcomes associated with language: explanations related to socio-epidemiological determinants in the affected population, and explanations related to failures of health service responsiveness.

Although Australia’s immigrant population is heterogeneous, the cardiovascular risk factors in some populations warrant intensive primary and secondary preventive care. The two leading source regions for immigrants to Australia at present — China and South Asia — face escalating epidemics of diabetes.4 So rapid is the increase in prevalence that many communities do not have established strategies for managing patients with diabetes.5 Although the smoking rates among people whose first language is not English are overall lower than those of other Australians, some subpopulations have markedly higher rates.6

Equally important is health literacy: the ability to obtain, read and understand health information. In the 2006 national health literacy survey, only 26% of those born in a non-English speaking country had adequate health literacy, compared with about 45% of those born in Australia or in an English-speaking country.7 Patients with low health literacy may struggle to read and interpret information on how and why to take their medications, the significance of new cardiovascular symptoms, and how to obtain emergency help when they need it. For patients who have experienced cardiovascular events, achieving parity in health literacy may require innovative methods of cardiovascular rehabilitation with language-competent health providers; for example, by employing remote technology, such as Skype, supported by written language information, such as that produced by the National Heart Foundation (http://heartfoundation.org.au/support/information-in-your-language).

Health literacy is the product of good communication between a clinician and their patient, and of health systems that are responsive to the needs of patients. Doctors frequently overestimate the language capacity of their patients,8 who may themselves incorrectly assess their capacity to understand. In the national health literacy survey, more than a quarter of patients with demonstrably poor health literacy rated their ability to read and write English as excellent.7

Despite being a largely migrant country, Australia is unusually monolingual. Four out of five of us can speak only English,1 making us the third most monolingual country in the world, after Brazil and Japan.9 There is as an urgent need to develop and sustain health systems that are responsive to the needs of non-English-speaking Australians. A language-sensitive health system would ensure that complex health information, such as that provided before discharge from hospital or when explaining health interventions, such as cardiac catheterisation, is delivered comprehensibly, using language support resources.

We are a long way from achieving this. So great is the linguistic diversity of Australia that even multilingual doctors rarely find themselves sharing the language of their non-English-speaking patients. Hospitals cannot rely upon on-site interpreters to meet all the language needs of their patients. The Translating and Interpreting Service offers the most extensive telephone interpreting system in the world, providing doctors and pharmacists with rapid, 24-hour access to interpreters; this service does not, however, include Indigenous languages. Further, it is used in less than 1% of consultations by private practitioners with patients with limited English proficiency.10 We should also be able to reliably assess whether or not family members have the competence to adequately interpret for their relatives, when desired.

The challenge of meeting the needs of non-English speakers is a permanent one for Australia. The proportion of people over 65 years who have limited English proficiency increases at each census,1 reflecting the phenomenon of second language attrition as we age.11 The age group at greatest risk of cardiovascular disease is thus the one that may be struggling with diminishing English competence. Effective solutions will require us to develop culturally sensitive health promotion programs for cardiovascular disease, with a particular focus on diabetes as a comorbidity, and whole-of-system approaches which ensure that Australians who do not speak English as their first language can communicate clearly and confidently with their health care providers.

Alcohol and tax — time for real reform

Alcohol tax reform would reduce harm and costs — and could fund major prevention and treatment programs

Australia’s first comprehensive report on drugs was entitled Drug problems in Australia — an intoxicated society? This 1977 report from the Senate Standing Committee on Social Welfare noted that alcohol “now constitutes a problem of epidemic proportions”. The Committee concluded that, given the extent of the problem, “any failure by governments or individuals to acknowledge that a major problem — and potential national disaster — is upon us would constitute gross irresponsibility”.1

Many of the report’s recommendations are as valid now as they were four decades ago, particularly in relation to alcohol advertising (including the “appeal to sportsmen and sportswomen throughout Australia not to lend their names and prestige to the promotion of alcoholic beverages”), effective controls on availability of alcohol, and use of pricing mechanisms to reduce alcohol use and harm.

It has become increasingly clear that in dealing with harm from alcohol, price matters. There is now an overwhelming consensus from leading Australian and international health authorities and researchers that alcohol taxation is one of the most effective policy interventions to reduce problems related to alcohol.2 The World Health Organization has identified alcohol tax increases as a “best buy” intervention in reducing harmful alcohol use.3 Even small increases in the price of alcohol can have a significant impact on consumption and harm at the population level. However, alcohol taxation and other pricing strategies have been underused in Australia as a component of the comprehensive approach required to reduce harm from alcohol.

At a time when tax reform is high on the political agenda, there is near-universal agreement that the current approach to alcohol taxation in Australia is complex and that change is long overdue. The Henry Tax Review described the alcohol tax system as “incoherent” and the Wine Equalisation Tax (WET) in particular as “not well suited to reducing social harm”.4 Others have described the system less flatteringly. Some 16 different excise categories apply, depending on the type and volume of alcohol and container size. Taxes on spirit products are at the upper end of the scale; draught beer taxes are at the lower end. Wine is treated differently; the WET is based on the wholesale price of wine, not its alcohol content. The WET is why cask wine can be promoted and sold for as little as 18 cents per standard drink, or $1.80 per litre — cheaper than many bottled waters — contributing only 5 cents per standard drink in tax. The system is further complicated by producer rebates and concessions, some of which are no longer appropriate, such as the WET rebate. The WET is effectively a subsidy, propping up the production of low-value wines.

Health groups are in broad agreement about the key principles that should guide tax reform if the alcohol tax system is to play a more effective role in reducing harm and promoting a lower-risk drinking culture. Approaches to alcohol tax and price should reflect that alcohol is no ordinary commodity and is associated with substantial health and social costs. A volumetric approach that applies to all alcohol products should be central to reform, with tax increasing for products with higher alcohol volumes.5 A tiered system that includes stepped increases in tax rates would provide economic incentives for the production and consumption of lower-strength alcohol products and help ensure that the prices of some other products do not drop substantially.6

A minimum floor price set at an appropriate level would support and complement a volumetric approach, in particular by targeting the heaviest drinkers who consume the most. A minimum price would restrict the ability of alcohol retailers to heavily discount products, thus undermining the tax strategy, and has been strongly supported by groups concerned about alcohol-related problems in Aboriginal communities.7

Other important principles include: there should be an overall increase in alcohol tax collected; the real price of alcohol should increase over time; and changes to the tax system should not decrease the price of alcohol products, other than for low-alcohol products.

In contrast to the consensus among health groups, the alcohol industry is deeply divided on the best approach to alcohol taxation. Arising from the existing variation in excise levels between product categories, the commercial interests of the wine, beer and spirits industries do not necessarily align in relation to tax reform. There is even division within specific industry groups; for example, between premium wine producers and high-volume, low-value wine producers. In its submission responding to the government’s March 2015 Tax discussion paper, the Winemakers’ Federation of Australia (WFA) noted that “Consultation with industry has confirmed mixed views on the optimal tax platform for the Australian wine sector … As such, WFA does not hold a position on the preferred structure for wine tax”.8 WFA did, however, affirm that the industry agreed on its opposition to both increasing the level of wine tax revenue and reforms driven by social policy objectives. The divisions between and within industry groups are expected to add to the challenges for government in navigating the range of interests and objectives associated with alcohol tax reform.

Alcohol consumption patterns in Australia are very different now to those in earlier decades, when beer was king, Australian-owned companies dominated and hotels were the drinking venues of choice. Now, beer is in decline (in 2013–14, beer contributed 41.3% of the total alcohol available for consumption, wine 37.5%, spirits 12.6% and ready-to-drink pre-mixed beverages 6.3%),9 most of the major alcohol companies are overseas-owned, and some 80% of alcohol is sold from retail outlets, primarily chain stores.

There are some encouraging trends, particularly among adolescents10 — but alcohol remains pre-eminent as a cause of preventable social and community harm. While the tragedies arising from city-centre violence and road crashes attract regular media coverage, there is also increasing community understanding of alcohol’s many hidden and longer-term harms: from domestic violence to cancers, from fetal alcohol spectrum disorder to damage to the developing brains of young drinkers.

As ever in public health, there are no simple, short-term solutions. As is so often the case when profitable products are involved, there is strong, well funded and often misleading resistance to effective action. There is, however, good evidence to support implementation of a comprehensive approach — with carefully implemented tax reform at the forefront.6

One additional reform to the alcohol tax system could bring profound benefits to the community. Around the country, alcohol treatment and support services are stretched, funding for prevention is barely visible, and the latest Australian Institute of Health and Welfare expenditure report shows that in the 2013–14 financial year, all public health attracted $2.22 billion — an almost derisory 1.5% of total health funding.11

The federal government derives over $8 billion annually from the taxes and excise duties levied on alcohol.5 In addition to health and social harm, the annual costs of alcohol to the economy are estimated at upwards of $15 billion.12 Further, the government’s annual revenue includes more than $200 million from underage drinkers and almost $2 billion from drinkers under the age of 25 years.13

Historically, Treasuries are not keen on hypothecated taxes, but there are good precedents,14 notably for tobacco where, in the days of state tobacco licence fees, tax increases were successfully used to fund public education and to replace tobacco sponsorship of sport, as well as to provide governments with additional revenue for their general programs.

Many reports in recent decades have recommended additional funding for alcohol prevention and services, both for the community overall and for specific priority groups. A 2015 report commissioned by the Foundation for Alcohol Research and Education concluded that: “By removing the privileged treatment of wine, the government could receive increased revenues in the order of $1 billion each year”.15 Even half of this would enable the establishment of a dedicated National Alcohol Prevention, Treatment and Services Program that could make Australia a world leader in reducing alcohol harm, to match its record in tobacco control.

Such a program would enable the government to provide desperately needed funding for national and local services, to work with and support Aboriginal and other communities in their efforts, and to develop a comprehensive approach to prevention. The funding would enable establishment of a major research-based national public education program, along the lines of the successful 1990s National Tobacco Campaign, as well as better support for enforcing current legislation (including sales to minors), independent controls on alcohol marketing, development of research-based warning label messages, and a range of further national and local activities.

The arguments in favour of alcohol tax reform linked to increased funding for prevention and services are that this will reduce direct and indirect harm, will reduce costs to the health and law enforcement systems and to the community, and will bring special benefits for young people and disadvantaged communities.

The arguments against reform will come from the powerful and massively funded alcohol industry and its allies, which will support the continuation of ineffective policies and oppose anything that might have a serious impact on alcohol use — and hence on alcohol harm.

At a time when there is continuing community and political concern about the impacts of alcohol, broad election policies are being developed and tax reform is under discussion with assurances that “all options are on the table”,16 there is an opportunity for health groups to press for comprehensive policies that include a clear commitment to alcohol tax reform. This will require strong and consistent communication of the substantial evidence base for reforming alcohol tax to improve health, as well as appropriate responses to misinformation likely to come from vested interests.

Failure by governments to act will now, as 40 years ago, “constitute gross irresponsibility”.

Impact of HPV sample self-collection for underscreened women in the renewed Cervical Screening Program

Major changes will occur in the Australian National Cervical Screening Program (NCSP) from 2017, following an extensive review (“Renewal”).1 In addition to a re-designed mainstream program (5-yearly human papillomavirus [HPV]-based screening with partial genotyping; colposcopy referral for women testing positive for HPV16/18; liquid-based cytology [LBC] triage for other oncogenic HPV types), it was also recommended that HPV testing on self-collected cervico-vaginal samples (“self-collection”) be funded for unscreened and underscreened women.2 Self-collection must be facilitated by a clinician who also offers mainstream cervical screening, and is likely to be restricted to women aged 30–74 years who have never been screened or are overdue for cervical screening by 2 years or more.3

Offering self-collection has increased screening participation among unscreened and underscreened women in several settings,4 and is seen as a potentially useful strategy for extending cervical screening to previously hard to reach groups. It is being introduced for this purpose in several countries, including the Netherlands.57 Recent international reviews have reported that HPV testing on self-collected samples was somewhat less sensitive for high grade cervical abnormalities than testing on clinician-collected samples if signal-based tests are used; however, sensitivity was similar when using polymerase chain reaction (PCR)-based tests.8,9 These findings describe a range of possible test performances for self-collection, but they cannot be applied to specific technologies in the Australian context: here the performance measures and standards for HPV test platforms to be used as part of the population screening program will need to meet National Pathology Accreditation Advisory Council requirements.

Taking all of these factors into consideration, the aim of our study was to inform decision making by women offered self-collection in Australia by quantifying how different screening decisions affect the future risk of cervical cancer in previously unscreened women.

Methods

We used a dynamic model of HPV transmission and vaccination in conjunction with a cohort model of HPV natural history, cervical screening, diagnosis, treatment, and cancer survival. This model platform underpinned the Renewal review, and has been described in detail elsewhere.10 Dynamic models are considered the most comprehensive models of HPV epidemiology, as they incorporate the direct and indirect effects of HPV vaccination on the incidence of infection, and thus reflect its full impact on changes in risk. Model-predicted outputs have been extensively calibrated and validated against local cancer and pre-cancer outcomes by age and HPV type, resource use, and observed effects of HPV vaccination.10,11 Detailed clinical management pathways were informed by an expert advisory panel convened for the Renewal review.1,10

Model scenarios

We evaluated three choices that could be made by previously unscreened women:

  • a single round of HPV testing on a self-collected sample (“1 × self-collected”);

  • a single round of HPV testing on a clinician-collected sample (“1 × clinician-collected”); and

  • joining the mainstream screening program (5-yearly HPV-based screening with partial genotyping for HPV16/18 and LBC triage for other oncogenic HPV types; testing on clinician-collected samples) (“join the program”).

The comparator in all cases was choosing to remain unscreened. In the single screening round scenarios (the first two options), women were assumed to complete a single round of screening, but then to never re-attend for subsequently recommended rounds. We considered a round of screening to be completed if the women were HPV-negative on their primary screening test, or if they were HPV-positive but had subsequently undergone appropriate follow-up and had then been recommended to return to routine screening. The main analysis evaluated outcomes based on a decision taken at age 30 years, as this is the earliest age at which self-collection will be offered to most women, but we also considered the outcomes if the decision was deferred to age 40 or 50 years.

Since the intention was to provide information useful to women when making their decision, we assumed that those who elected to undergo screening would attend for all subsequently indicated tests and procedures, including LBC triage (an additional visit is required, as LBC cannot be performed on a self-collected sample), colposcopy, and treatment. In a sensitivity analysis, we examined imperfect compliance with the recommended follow-up (Appendix, section 3).

Test characteristics

The characteristics of HPV testing on self-collected samples (baseline and feasible range) were informed by a recent meta-analysis of performance relative to clinician-collected samples8 (Appendix, section 2.1). We took a conservative approach and considered a performance range based on international data relevant to various test technologies.7 In the baseline analysis, we assumed that self-collected samples would be tested for any oncogenic HPV type. In a sensitivity analysis, we evaluated the use of a clinical test with partial genotyping on these samples, allowing differential management of women who test positive for HPV16/18, consistent with the mainstream screening program and an Australian trial of self-collection.12 The characteristics of other tests used were informed by meta-analyses, and by colposcopy test data from Australia and England (Appendix, sections 2.2–2.4).

HPV vaccination

The baseline analysis estimated outcomes for women in the absence of HPV vaccination, which would be relevant for older women; however, in a secondary analysis we also considered outcomes for a cohort of women offered vaccination against HPV16/18 at age 12, as currently implemented in Australia. Estimates of the uptake of vaccination by these girls (72%) and by older females (included to capture the indirect effects of the catch-up program) were based on published data.13,14 National uptake data for males (included to capture the indirect effects of the program) were not yet available, so we assumed an age-specific uptake by those offered vaccination since 2013 equivalent to that achieved among females, based on initial state-based reports.15 Results for cohorts offered vaccination would be relevant to women in Australia who turn 30 years of age from around 2026 (who were offered HPV vaccination at age 12), but are also potentially useful for those who turn 30 from 2017 onwards (who were offered vaccination when aged 13–20 years; since some will have been exposed to HPV prior to vaccination, their absolute risks of developing cervical cancer will be slightly higher than for those offered vaccination at age 12).

Outcomes assessed

We estimated for a cohort of 100 000 previously unscreened women aged 30 years the cumulative numbers of incident cervical cancer diagnoses, cervical cancer deaths, and women ever treated for cervical pre-cancer to age 84 years. The number of women needing to be treated for cervical pre-cancer (NNT) to avert one cancer diagnosis (or one cancer death), compared with women who remained unscreened, was also calculated as a measure of the balance between the benefits and harms of screening.

Sensitivity analyses

In addition to those previously discussed, we also performed sensitivity analyses of several parameters that were previously found to be the most influential across a range of screening evaluations using our model, as well as of those parameters for which the value was most uncertain (Appendix, section 1).10,16 These included the accuracy of triage testing with LBC, the diagnostic accuracy of colposcopy, and the management of women who test positive for oncogenic HPV types other than 16/18 at the primary test and whose LBC triage test is low grade (“intermediate risk”; 12-month recall v colposcopy referral).

Ethics approval

This model-based study did not involve human participants, so ethics approval was not required. A number of de-identified datasets were used in the prior development and calibration of the model platform that was used for this evaluation. Ethics approval for the use and analyses of these datasets to inform the model was provided by the Cancer Council NSW Ethics Committee (references 232, 236) and by the University of New South Wales Human Research Ethics Committee (references HC13270, HC13349).

Results

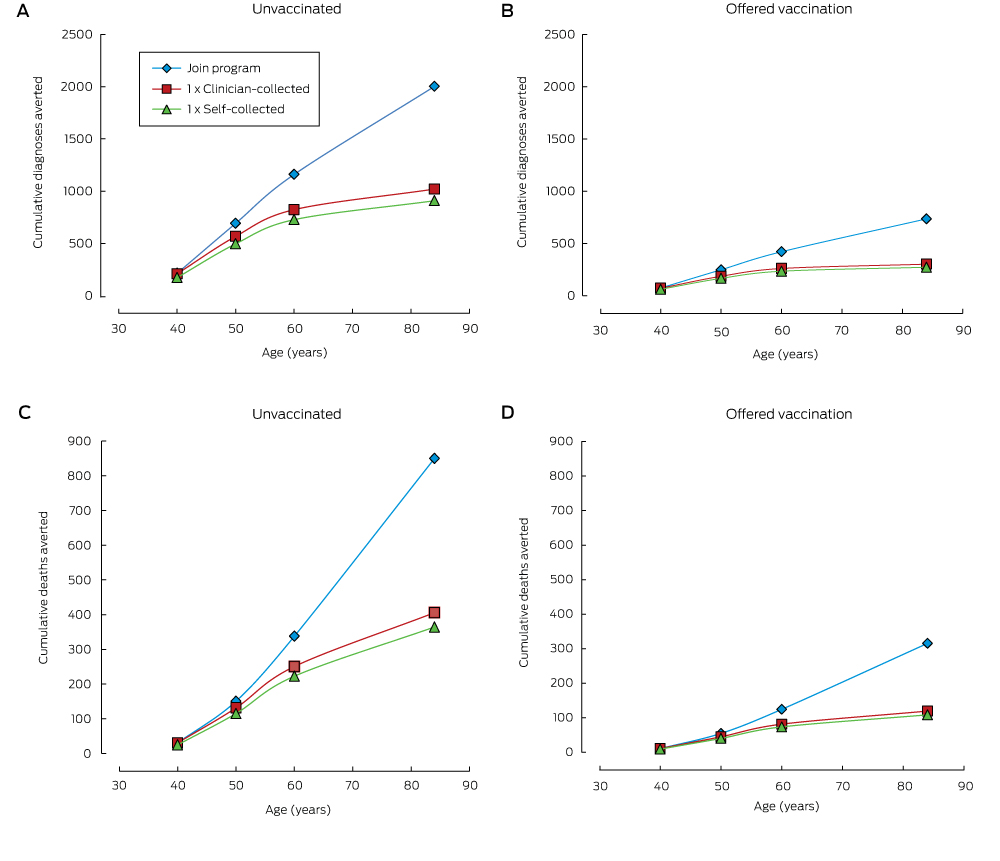
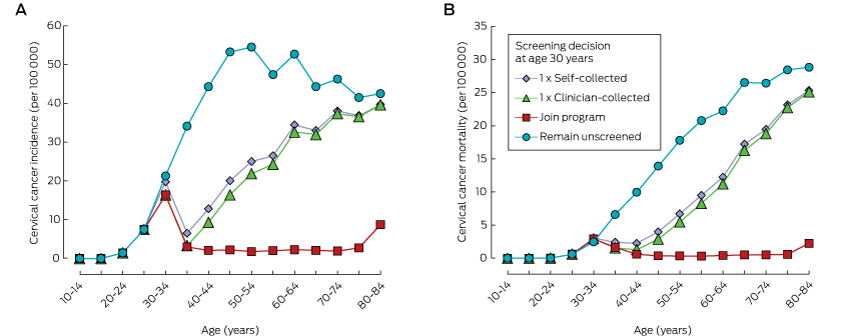
Compared with remaining unscreened, a single screening round at age 30 substantially reduced cancer incidence and mortality, and the number of cancer cases or deaths averted continued to increase over a woman’s life (Box 1, Box 2). One round of self-collected sample HPV screening in 100 000 women aged 30 years would avert 908 cancer diagnoses and 364 cancer deaths by age 84 (NNT, 5.8). Over a lifetime, the number of cancer cases or deaths averted by joining the mainstream program at age 30 years was about double that associated with a single screen at the same age. Underlying these findings is the fact that cancer incidence and mortality both start to increase again about 10 years after a single screen at age 30 years, whereas the lower incidence rate is maintained for most of a woman’s life if they join the program (Box 3). Joining the program was associated with the lowest NNT to avert each cancer case or death over a lifetime.

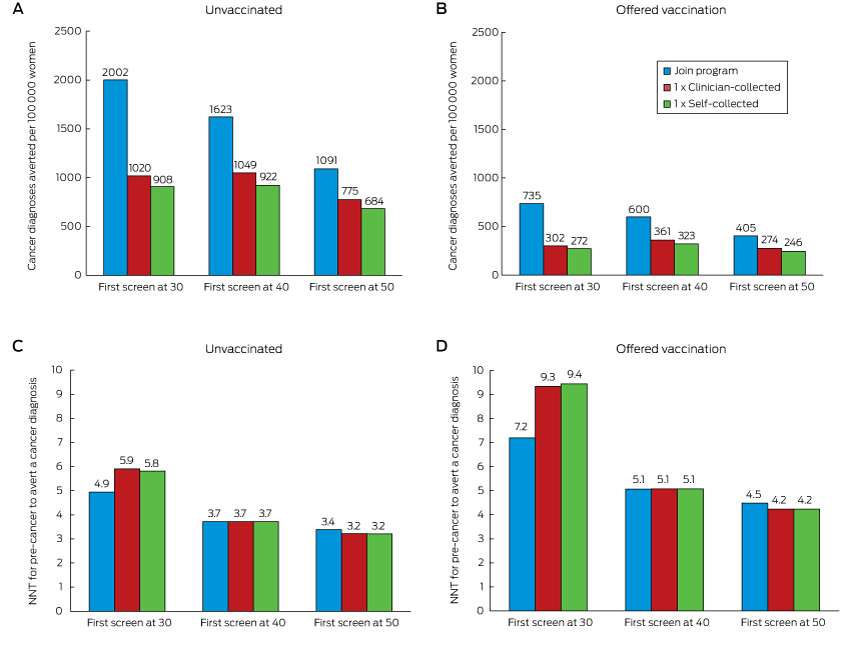
When the screening decision was deferred until age 40 or 50, the reduction in cancer diagnoses and deaths remained greatest when a woman joined the mainstream screening program; even doing so at age 50 averted more cases than a single screening round at age 30 or 40 (1091 fewer diagnoses and 583 fewer deaths [NNT, 3.4] by joining the program at age 50 v 908 or 922 fewer diagnoses and 364 or 426 fewer deaths [NNT, 5.8 or 3.7] for a single round of self-collection at ages 30 or 40 respectively). For each sample type, a single round of screening at age 40 prevented more cervical cancer cases and deaths than a single round at either age 30 or 50 (for self-collection, a single round of screening at ages 30, 40 or 50 years resulted in 908, 922 and 684 fewer diagnoses and 364, 426 and 385 fewer deaths respectively; for a clinician-collected sample, in 1020, 1049 and 775 fewer diagnoses, and 406, 480 and 437 fewer deaths respectively) (Box 4). While having a first screen at older ages often reduced the number of cases averted, the NNT to avert a cancer case was also lower.

Relative reductions in the numbers of cervical cancer diagnoses and deaths were similar for women in cohorts offered HPV vaccination and those who were not offered HPV vaccination. These reductions were substantial even when only one screening round was undertaken; however, the absolute numbers of diagnoses and deaths averted in those offered vaccination was smaller (by 63–70%) because of their lower underlying risk. In women offered vaccination, joining the program at age 30 averted more than twice as many cancer diagnoses and deaths as a single screen at the same age, and was also associated with a lower NNT to avert each cancer case (Box 2). Joining the program at age 50 remained more effective than a single screen at ages 30, 40 or 50 years (Box 4). At age 30, joining the mainstream program had the most favourable balance between benefits and harms; at older ages, the NNT was similar for all screening decisions. The NNT to avert a cancer diagnosis was 44–64% higher for women who had been offered vaccination than for those who were not (Box 4).

Sensitivity analyses

No feasible assumptions considered in sensitivity analysis altered the estimate of the number of diagnoses averted by more than 5%, or the NNT to avert a diagnosis by more than 8% (supplementary figures 3 and 4 in the Appendix). Results for self-collection were most sensitive to the accuracy of the HPV test and the availability of partial genotyping for HPV16/18. The effectiveness of joining the mainstream program was most sensitive to women’s compliance with the recommended tests, whereas the effect of this on single screening round scenarios was smaller (further discussion in the Appendix, section 5).

Discussion

This study provides valuable information that can inform decision making by women and clinicians. Even a single round of HPV screening on a self-collected sample can reduce the lifetime risk of a cervical cancer diagnosis, by around 41% if performed at age 30 or 40 years. A single round of HPV testing on a clinician-collected sample may offer superior results, but it is possible that the difference in outcomes may be smaller if a sufficiently accurate HPV test is used and if partial genotyping is performed on self-collected samples. However, our results also indicate that joining the mainstream program, even at an older age, offers substantially greater protection. Our findings also help to quantify the benefit for women of joining the program rather than being screened only once. For example, the benefit for women who continue to attend for recommended screening after a first screen at the age of 30 years is about double that of undergoing a single round of screening at 30. The balance of benefits and harms associated with joining the mainstream program was more favourable than or similar to that for a single screening round at all ages we considered in this analysis.

Self-collection was recommended during the Renewal review in the context of several factors in Australia. First, the 2-yearly cervical screening participation rate had remained relatively stable at around 60% for more than a decade, and the proportion of women remaining unscreened after 3 (almost 30%) or 5 years (about 17%) had also not decreased. Second, cervical cancers were mostly diagnosed in women who were unscreened or had not been screened in the previous 3.5 years (45% and 23% respectively of diagnosed invasive cancers in 2012).17 Third, there were persistent disparities in screening participation, with lower participation rates in lower socio-economic groups, among Aboriginal and Torres Strait Islanders, and in some migrant groups, and these participation disparities were reflected in the incidence of cervical cancer.1822 These factors suggested that infrequent or non-participation in screening was a major barrier to further reducing the incidence of cervical cancer (which had plateaued over the past decade), and was also driving some persistent inequalities in cervical cancer incidence. Consequently, ensuring that all Australian women have access to a program that is acceptable, as well as effective and efficient, was a fundamental aim of Renewal.11 Self-collection is specifically aimed at women who are unscreened or underscreened.2

Two recent studies in Victoria suggested that self-collection is likely to be acceptable among women who are not being screened regularly, although, as both involved a mail-out model, their findings are not directly comparable with the NCSP recommendations. The iPap trial compared participation by previously unscreened and underscreened women who were randomly assigned to receiving either a mailed-out self-collection kit or a screening reminder letter.12 Offering self-collection was more effective in increasing participation than a reminder; attendance for recommended follow-up tests was high among women who returned a self-collected sample in the iPap trial; and participants reported finding self-collection simpler, more comfortable and less embarrassing than their previous Pap test (personal communication, Dorota Gertig, Medical Director, Victorian Cervical Cytology Register, July 2015). Secondly, a telephone survey in which women were asked about the option of home-based self-collection found that almost two-thirds of women who were unscreened or underscreened preferred this option to clinician-collected samples.23 Time since the most recent cervical screening test was the only significant factor associated with a preference for self-collection, with women who were up to date with screening less likely to prefer self-collection (27%) than women who had never been screened (62%; odds ratio [OR], 4.16; P < 0.001) or had not been screened in the previous three years (65%; OR, 5.19; P < 0.001). Women who did not favour self-collection most commonly cited a preference for seeing a general practitioner and a lack of confidence in their ability to collect the sample properly. This suggests that the model proposed for the NCSP, where self-collection is facilitated by a practitioner who also performs mainstream screening, is appropriate, as women may be reassured about their ability to perform the test by the facilitating provider or elect to have their practitioner collect a sample. However, some of the women who are currently less likely to participate in screening, including Aboriginal and Torres Strait Islander women, migrants, and those from lower socio-economic groups, were under-represented in the survey.

One concern about self-collection is that women who currently attend the mainstream program may switch to self-collection, and this could lead to a less effective program overall. The proposed model of restricting self-collection through a screening provider to under- and unscreened women is designed to reduce this problem. The results from our study provide additional information for both the provider and the woman by quantifying both the benefit of self-collection for unscreened women and the additional benefit of remaining in the mainstream program. Findings from a recent modelling study in the Netherlands suggest that, to maintain the overall effectiveness of a program including targeted self-collection, it is crucial that women at the greatest risk are among those who adopt self-collection and that a sufficiently accurate test is used.24 Our results also underline the importance of using a sufficiently accurate test and partial genotyping for HPV16/18 for ensuring comparable long term cancer outcomes in self-collected and clinician-collected samples.

The strengths of this study include the use of a robust model that has been calibrated against a large number of program outputs, and that clinical management pathways incorporated detailed local expert input.10 Another strength is that it included estimates for women offered vaccination during early adolescence, meaning the results will remain informative into the future. When self-collection first becomes available for unscreened women aged 30–74 years in 2017, the youngest women eligible will have been 20 years old when the HPV vaccination program commenced. A sizeable proportion of these women will have been vaccinated (30–63% with three doses),14 although possibly with lower effectiveness than in the cohorts modelled here.25 The absolute benefit of screening in these intermediate cohorts will potentially be slightly higher than for those offered vaccination at age 12, but our results suggest that the relative reductions are similar in both unvaccinated cohorts and those offered vaccination. Our results for cohorts offered vaccination will be fully applicable to women turning 30 from 2026.

As our results are intended to provide guidance for women and clinicians when making decisions, a limitation to our study is that compliance with recommended follow-up tests and procedures was assumed to be perfect. This assumption means our results cannot be directly interpreted as population-wide results; this was beyond the scope of the current study. However, trial data support the strong benefits we found from even a single screening round (further discussion in the Appendix, section 7), and these benefits did not vary substantially across the range of compliance assumptions examined. Self-collection at regular intervals was not evaluated, given the greater uncertainties in the evidence concerning the use of self-collection for routine screening, and because self-collection is not intended as a regular replacement for clinician-collected samples.

Our results support offering self-collection to women who are unscreened and reluctant to join the mainstream screening program, including older women, for whom the balance between benefits and harms remains very favourable. However, the level of protection achieved by joining the mainstream program and thereafter undergoing regular screening, even at older ages, is far greater. Engaging women and redressing barriers to their participation in the mainstream program must remain a primary focus.

Box 1 –
Impact of screening decision at age 30 years on the future risk of cervical cancer diagnosis and death, and treatment for pre-cancer, for a cohort of 100 000 previously unscreened women aged 30 years (unvaccinated cohort)

Number of women affected by cervical cancer, by age:


40 years

50 years

60 years

Lifetime*


Cervical cancer diagnosis

Join program

99

120

139

205

1 × clinician-collected

104

245

476

1187

1 × self-collected

140

316

572

1299

Remain unscreened

312

811

1299

2207

Relative risk reduction compared with remaining unscreened, by age:


40 years

50 years

60 years

Lifetime*


Cervical cancer death

Join program

22

26

30

45

1 × clinician-collected

22

46

117

490

1 × self-collected

28

62

145

531

Remain unscreened

53

177

367

895

Died from other causes

488

1655

4195–4202

39 509–39 780

Cervical cancer diagnosis

Join program

68%

85%

89%

91%

1 × clinician-collected

67%

70%

63%

46%

1 × self-collected

55%

61%

56%

41%

Cervical cancer death

Join program

58%

85%

92%

95%

1 × clinician-collected

58%

74%

68%

45%

1 × self-collected

47%

65%

61%

41%

Women ever treated for cervical pre-cancer, by age:


40 years

50 years

60 years

Lifetime*


Join program

7373

8498

9143

9894

1 × clinician-collected

5973

6018

6019

6019

1 × self-collected

5235

5277

5278

5279


* Until (and including) 84 years of age. † Five-yearly human papilloma virus (HPV)-based screening with partial genotyping; colposcopy referral for women testing HPV16/18 positive; liquid-based cytology triage for other oncogenic HPV types.

Box 2 –
Cumulative numbers of cervical cancer diagnoses (A, B) and deaths (C, D) averted in women screened for human papillomavirus (HPV) at age 30 (compared with remaining unscreened), by attained age, in unvaccinated women (A, C) and women offered vaccination at age 12 (B, D)

Box 3 –
Cervical cancer incidence and mortality in women screened or unscreened for human papillomavirus (HPV), by attained age

Box 4 –
Cervical cancer diagnoses averted to age 84 by one screening round (A, B) and number needed to treat to avert a cancer diagnosis (NNT) (C, D), compared with remaining unscreened, in unvaccinated women (A, C) and women offered vaccination at 12 years of age (B, D)

“Good kid, mad system”: the role for health in reforming justice for vulnerable communities

Let’s invest in better services for high-risk communities rather than in more prisons

Australia’s prisoner population is expanding at an unsustainable rate. Incarceration rates are higher than at any time since federation, and substantially higher than those in most western European countries.13 Incarceration rates of Indigenous Australians match those of African Americans; these are the most intensely incarcerated subpopulations in the world.1 The over-representation of Indigenous Australians in all stages of the justice system is one of Australia’s most significant social justice issues. Australian governments are grappling with the costs of building new prisons and, more broadly, fulfilling “tough-on-crime” agendas.4 At the same time, human rights arguments for reducing overincarceration of Indigenous peoples are aligning with the economic imperatives to contain prison costs.5

It is time to redesign our criminal justice system to redress the over-reliance on incarceration as the means of achieving safer communities. In Australia, the Human Rights Law Centre has joined the call to tackle the causes of crime. Director of International Advocacy, Ben Schokman, said:

The evidence is clear that governments should be spending less money on prisons and investing more in tackling the causes of crime. Every dollar spent on prisons is one less dollar available to spend on education, health, support services for people with disability, training and employment programs, or providing adequate public housing. There are much smarter approaches that build stronger communities, reduce crime and save taxpayers millions of dollars by avoiding wasteful prison spending.6

A substantive reconfiguration of mental health, disability and substance misuse services is essential to provide comprehensive treatment rather than punishment for vulnerable people.

The health of prisoners

Ill health, social disadvantage and incarceration are deeply interconnected and mutually reinforcing. Those most at risk of incarceration are among the most vulnerable in society, with a complex array of health and social needs and multiple risk factors for ill health.5,7 Mental health problems, substance misuse, learning and cognitive difficulties, hearing loss and other physical health problems, including high rates of trauma and acquired brain injury, feature prominently. Prisoners have also experienced high levels of traumatic life experience, including family violence and sexual abuse in childhood and as adults (Box).9 The interactions between encounters with the justice system by, and human services provided for Aboriginal people — particularly those with mental and cognitive disabilities — have been well articulated. Their needs are particularly acute and are poorly serviced by past and current policies and programs.10

While Australia-wide studies indicate that many prisoners report improvements in their health while incarcerated,8 prison experience almost universally compounds their health and social disadvantage after release, and mortality rates are significantly higher for those who have been incarcerated and released. In a New South Wales data-linkage study, over an 8-year period after incarceration, men had 3.7 times the mortality rate of their age- and sex-matched peers, while for women it was 7.8 times greater.11

Mental health, traumatic stress and disability

Proper mental health, disability and substance misuse services are the cornerstone of an improved health service response for those at risk of offending.

Current mainstream mental health services — from primary through to tertiary level — are ill-equipped to respond systematically to the complexity of problems facing vulnerable clients.2 Provision of comprehensive trauma-informed services is grossly under-resourced and is only available to a select few. People experiencing crippling levels of traumatic stress and emotional distress, outrage and anger problems, cognitive impairment and substance misuse concerns — often co-occurring — are rarely supported adequately when they present to mental health services.10

There is no evidence that vulnerable clients with a history of involvement with the justice system pose additional risk to service providers, yet they are, at times, excluded from mental health and substance misuse services. Discriminatory practices categorising people as “mad, sad or bad” are simplistic and unhelpful. Too often, clients are inappropriately deemed dangerous or undeserving and, based on an assessment of risk to staff, may subsequently be denied access to care.

People with an intellectual disability, and particularly Aboriginal people, are even more compromised. Support systems can break down at every point in the system — from police assessment and gathering of evidence to advocacy during court and legal processes; from the lack of community alternatives to sentencing with the potential risk of further exploitation and recruitment into illegal behaviours to increased recidivism. Fetal alcohol spectrum disorder and acquired brain injury, as parts of the cognitive impairment spectrum, should be considered at every stage of the criminal justice system. Those with cognitive impairment and mental health or substance misuse problems — whose offences are predominantly non-violent — have among the highest rates of involvement with criminal justice services, and this involvement starts earlier in their lives and persists for longer. Those who are afforded support through disability services fare much better than those who do not receive such support.10

A better coordinated service system

Well designed service responses for those with the most complex needs have the potential to significantly reduce incarceration rates and to support vulnerable people to achieve satisfying, socially contributing lives. However, Australia’s prisons are overflowing with people who, throughout their lives, have been denied appropriate health and social services. Many vulnerable people, often with limited capacity to advocate for their own needs, fall through very wide gaps in service delivery and are, in effect, efficiently channelled into the justice system from an early age.

For change to occur, health services, social services and justice services must work collaboratively with improved information sharing and shared management plans. Currently, health services are not always aware if their clients are concurrently involved in the justice system. Those who are rarely confide such information for fear of discrimination, or because they are not asked. Similarly, magistrates and the police are not always adequately aware of health and social problems that may be influencing a person’s offending.

There are encouraging innovative models at the interface of health, social and legal services. Advocacy health alliances, such as the Health Justice Partnership project in Bendigo, Victoria, are providing legal services to patients within health care settings. The Neighbourhood Justice Centre in Collingwood, Victoria, employs therapeutic jurisprudence principles in a problem-solving court to link sentencing to community-based health and social support services, creating complete treatment, rehabilitation and social support for offenders with a broad range of health and substance misuse problems.12

It is time for a transformation. A dedicated focus by all levels of government, including the federal level, on reducing incarceration is needed, in proper partnership with Indigenous communities and organisations. This would acknowledge the connection between health and social interventions and justice outcomes so that services could be adequately resourced to tackle the health and social determinants of crime.

A new policy response — justice reinvestment

Imprisonment is expensive. Adult prison beds cost between $250 000 and $500 000 for infrastructure and around $100 000 to run each year.13 Youth justice beds cost around $200 000 per year.13 In the 2013–14 financial year, direct costs of imprisonment increased nationally by about $1million every day.13

An innovative policy idea that is gaining traction is justice reinvestment (JR). JR can be conceived as both a philosophy for justice reform and a set of strategies that examine spending on incarceration, so that funds that might be spent on incarceration are instead reinvested into health and social interventions that reduce offending in communities with the sociodemographic features that disproportionately contribute to prisoner populations. The idea springs from an understanding that overincarceration affects communities in ways that perpetuate cycles of crime. As a systems-based approach, JR encompasses a comprehensive range of areas such as health, housing, employment, justice, family support, mental health and substance misuse services. It impels policymakers to consider the implications of current punitive policies that result in more incarceration, particularly of Indigenous Australians, and instead fund initiatives that redress the health and social determinants of incarceration.14

In the United States, JR strategies have had some success in ameliorating health and social disadvantage associated with offending and, depending on the JR model implemented, have achieved reductions in offending and incarceration rates. For example, in Texas since 2007, investing in community-based drug and mental health treatment services and improved supervision has averted $US1.5 billion in prison construction costs, saving $US340 million in annual operating costs.15 Evidence from US initiatives suggests better outcomes are achieved when responses are data driven, evidence based and directed at those at highest risk.15

While JR policy has not yet been adopted by any Australian jurisdiction, so local evidence of its effectiveness is not yet available, preliminary work is being undertaken in several regional locations, including Bourke and Cowra in NSW, Ceduna in South Australia and Katherine in the Northern Territory. In 2014, the Australian Capital Territory Government announced a commitment to developing a JR strategy, using data-driven evidence to guide stakeholder consultations across health, human and justice services systems.

Proponents of JR do not claim it to be the solution in the Australian context, nor will it automatically solve problems of racial disparity. However, it has the potential to offer a shared framework for government, non-government organisations and other services to explore and commit to holistic community investment and solutions.4

Conclusions

Prisons exist as part of the comprehensive response to keep communities safe. However, when overused, prisons can break spirits and further alienate and disenfranchise many who would be capable of being engaged, contributing members of families and communities if they were supported rather than punished. Health care practitioners have an important role to play in understanding the many needs of clients at risk of engagement with the justice system and in advocating strongly for community-based service models that provide for these clients.

No matter how well health care in prisons is administered, incarcerating people does not constitute a cost-effective “opportunity” to invest in their health. Providing responsive, community-based health and social services attuned to the needs of those who are vulnerable to imprisonment represents a highly preferable allocation of resources. Achieving successful outcomes depends largely on increased interdisciplinary collaboration and the greater availability of safe, well designed and resourced community-based options within health and social services, in urban, regional and remote settings.

High-quality responses may appear costly and even politically elusive. But such a reinvestment of funds and redesign of the system would unquestionably deliver far greater individual and societal benefits — indeed, better justice — than our current inequitable, outdated and costly services.

Box –
The health of prisoners in Australia8

Health factors

Percentage affected


Mental health

Overall on admission

46%

Including substance misuse and personality disorder

Females, 90%; males, 75%

Traumatic stress

Females, 75%

Substance misuse

Alcohol, risky use

54%

Illicit drug use in the past 12 months

70%

Tobacco smoking

Currently smoking

Overall, 85%; Indigenous, 92%

Wanting to quit

46%

Disability

Intellectual disability (IQ, < 70)

10%

Borderline intellectual capacity or lower (IQ, < 80)

30%

History of traumatic brain injury

80%

Physical health

Chronic disease

32%

Hepatitis C

22%

Hearing loss

Northern Territory Indigenous people, 90%


A good nanny makes a difference

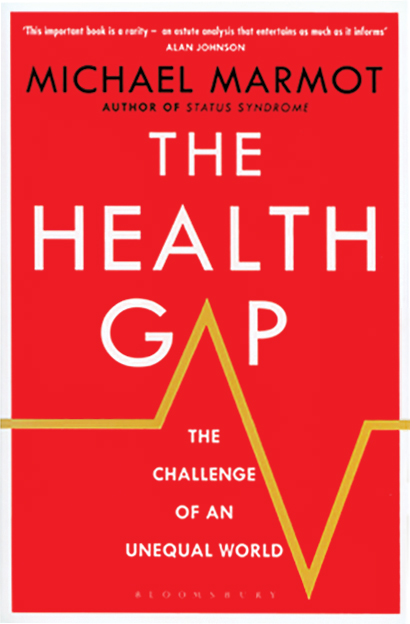
The health gap: the challenge of an unequal world. Michael Marmot. London: Bloomsbury Publishing, 2015 (400 pp, $35). ISBN 9781408857991.

Any person proposing interventions that change the lived environment, with the intention of improving health, will encounter the “nanny state” argument. This is the case be it John Snow removing the pump-handle from a cholera-infected water source in Victorian London or Nicola Roxon proposing plain packaging of cigarettes in modern Australia. Similarly, most general practitioners have experienced that sinking feeling on seeing the patient whose health issues arise from home or work environments over which the hapless GP has little sway. This book provides ammunition to defend the former and food for thought for responding to the latter. At the same time, Michael Marmot manages, in his inimitable style, to make his case both entertaining and accessible.

Marmot argues that empowerment is the key for reducing health inequalities and improving health across nations. But empowerment cannot be achieved by any magic bullet. One of the most revealing stories in the book is where Marmot, approached by a journalist — hard on the release of the World Health Organization Commission on Social Determinants of Health report, Closing the gap in a generation — is asked: “What’s the one thing you would recommend to the US President?” Marmot replies: “One thing? Read my report.” His point, made throughout the book, is that empowering a population requires broad societal change.

Empowerment is not simply equality of opportunity. Having the skills and capacity to grasp opportunity is essential. The child, who is read to less, talked to less and loved and valued less, is also much less able to exploit opportunity. Similarly, the parent educated in a poorly funded school and working a disempowering job for low pay is less able to provide a child-nurturing environment. The good news, from Marmot’s text, is that poverty and its consequences are not destiny. However, to break the link, societies do need to invest in some clear interventions: high-quality extended education, and taxes and social transfers to reduce child poverty. This book provides ample evidence that this works to improve not just the health and wellbeing of individuals but also builds wealth and prosperity in nations.

Factors contributing to frequent attendance to the emergency department of a remote Northern Territory hospital

Katherine Hospital services a very large (340 000 km2) and remote tropical region in northern Australia. The population of the region (20 000 people, 51% of whom are Aboriginal) is centred on the town of Katherine, 320 km southeast of Darwin.

As with all hospitals, frequent attenders (FAs) to the emergency department (ED) represent a significant proportion of the acute care workload. Local and international medical literature has defined FAs as patients who present to an ED between four and six times within a year;1,2 associations with homelessness, poverty, alcohol misuse and chronic illness have been documented.37 This literature, however, is predominantly focused on urban and non-tropical environments, and problems specific to northern Australian hospitals have not been investigated.

Severe and chronic homelessness is a major problem for Aboriginal people in the Northern Territory. It is closely coupled with social determinants of health and complicated by the harsh and remote environment. More than 7% of Aboriginal people in the region are considered homeless, a rate that is about 15 times the national average.8 Services for homeless people in the region are limited, in terms of both crisis and longer term accommodation, as well as with regard to access to food and hygiene facilities.

There is evidence that ED-based social interventions for FAs and homeless people, including providing housing and case management, reduce the number of presentations to EDs.911 Australian research suggests that providing specific non-emergency interventions targeted at FAs can reduce the burden of overcrowding for EDs.12

We aimed to identify factors, unrelated to chronic health problems, that contribute to frequent presentation to Katherine Hospital, which serves a young Aboriginal population with very high rates of homelessness, significant burdens of disease associated with poverty and poor housing, and limited access to services that provide safe housing.

Methods

Study design and setting

We performed a non-matched case–control study that included all adult patients who presented to Katherine Hospital ED between 1 January and 31 December 2012. During this period, a total of 8340 people were seen in 14 895 separate ED presentations. Ethics approval for the study was granted by the Human Research Ethics Committee of the Menzies School of Health Research (reference, 2013-2096).

Selection of cases and controls

The required case sample size for the study was calculated as being 137 patients; this was adequate to detect an effect size yielding an odds ratio (OR) of at least 2.0 with α = 0.05 and a power of 0.8.

The electronic patient database (Caresys) was used to identify all patients presenting to the ED during 2012. Cases were defined as those with six or more presentations during that period. A single presentation episode was randomly selected from all the presentations by an FA, and clinical and non-clinical data were extracted from the hospital electronic records for that single presentation.

The study excluded those with chronic health problems associated with a predictable need for multiple presentations. Exclusion criteria included patients needing peritoneal or haemodialysis, ambulatory care (including wound dressings, follow-up of test results, medication administration, and device management), obstetric patients, and those with chronic severe health conditions resulting in end-stage renal, hepatic, cardiac, respiratory or endocrine dysfunction or active malignancy.

We restricted our sample to residents of the NT to reduce a possible bias in the control population (high frequency of tourists during the dry season). As our focus was the adult population, we also excluded patients under the age of 18 years.

Unmatched controls were randomly selected (1:1) from the 5376 individuals who presented to the Katherine Hospital ED only once during the study period and who did not meet the exclusion criteria. Controls were not matched to cases, as we aimed to compare all differences in environmental, demographic and social variables between the two groups.

Ascertainment of risk factors and exposures

Patient data collected included age, sex, Indigenous status, alcohol intake and violence relevant to the presentation, triage score, discharge destination (admitted to ward or discharged from ED), and medical diagnosis (International Statistical Classification of Diseases, 10th revision, Australian modification [ICD-10-AM] categories). Records were linked with hospital mortality data, which were available to January 2015.

Living arrangements were classified as residential, homeless, or out-of-town; the last category included people visiting Katherine, predominantly from remote communities in the region, but also visitors from other NT towns.

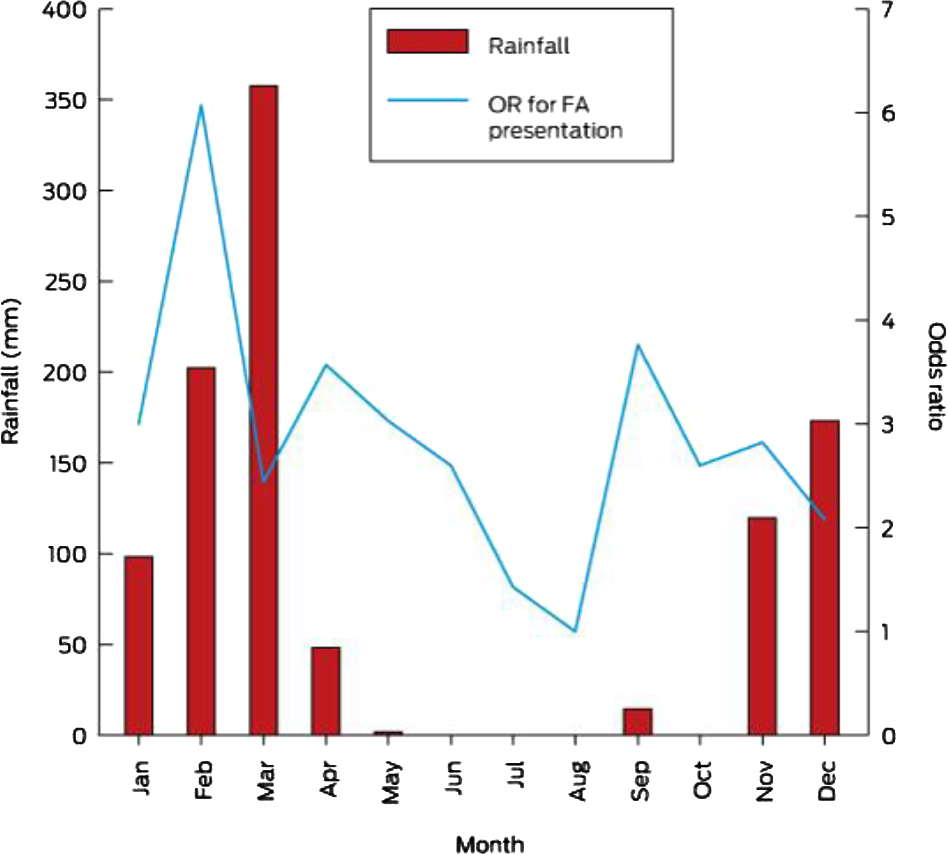
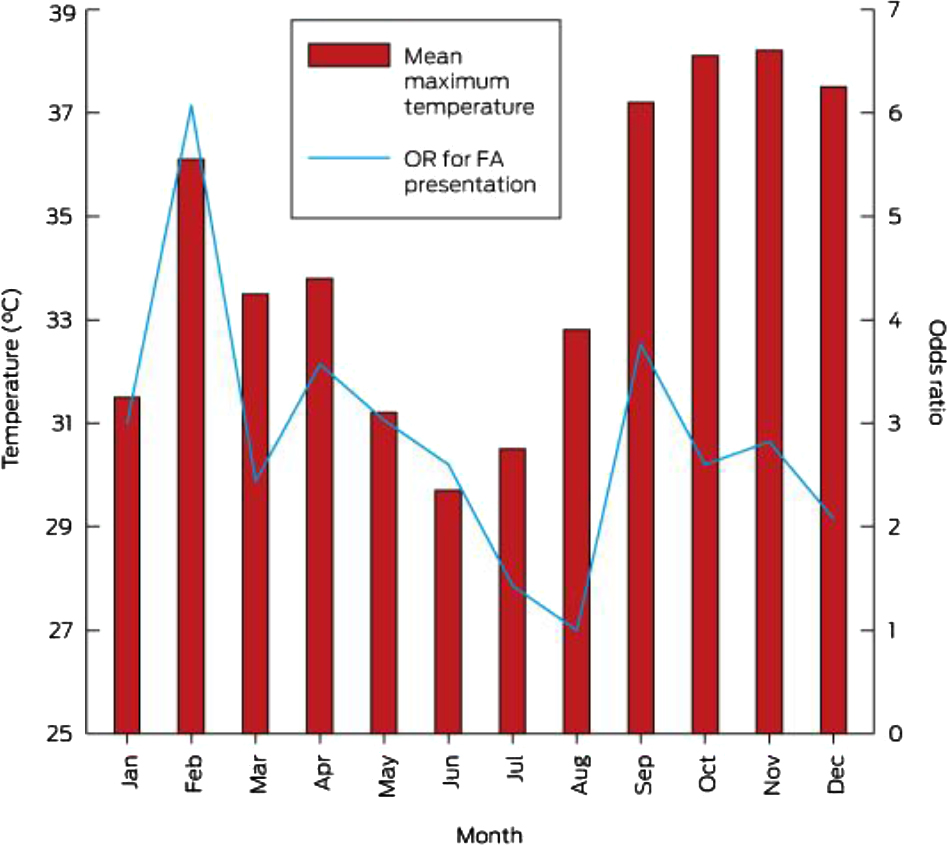
Historical weather data were obtained from the Australian Bureau of Meteorology: rainfall (mm) on the day of presentation, and during the preceding 7 and 30 days, and minimum and maximum temperatures on the day of presentation. For analysis, the data were coded as dichotomous variables: rainy day (yes v no), minimum temperature under 12°C (yes v no) and maximum temperature over 38°C (yes v no).

Analysis

We performed our analysis with Stata 13.0 (StataCorp). We used simple unpaired two-sided t tests (continuous data) and χ2 tests (categorical data) to compare differences in exposures for the case and control groups. Fisher exact tests were used to compare triage categorisation in the two groups. Statistical significance was defined as P < 0.05. We performed individual, unadjusted logistic regression analyses of each social and weather variable to assess the association between each exposure and subsequent admission to hospital and the likelihood of frequent presentation to the Katherine Hospital ED. Interactions between individual variables were tested by regression analysis.

A backwards stepwise logistic regression model was used to identify factors that predicted frequent presentation to the Katherine Hospital ED; the individual significance of each variable to be included in the model was set at P < 0.20.

Results

A total of 227 individuals were classified as FAs; they made 1948 ED presentations, or 13% of all ED presentations for the year. Ninety FAs met our exclusion criteria, leaving 137 cases for the study. The number of presentations by each FA during the 12 months ranged between six (47 patients) and 27 (1 patient), with the distribution skewed to the lower end of the distribution. A total of 137 FA cases and 136 controls were included in the study.

The age and sex characteristics of the FAs and controls were similar (Box 1). There was a statistically significant difference between groups in terms of homelessness (OR, 16.44; P < 0.001) and unstable living conditions (homeless or out-of-town) (OR, 3.02; P < 0.001). The proportion of individuals who identified as Aboriginal also differed between the two groups (OR, 2.16; P < 0.001), as did the proportion of presentations in which alcohol use was involved (OR, 2.77, P = 0.001). Although presentations by 15.3% of FAs involved violence, compared with 10.1% in the control group, this difference was not statistically significant (P = 0.189).

The type of clinical presentation as defined by the presenting complaint was somewhat heterogeneous, with different patterns for FAs and controls (Box 2). Triage classification was statistically different between the two groups (P = 0.004). While there were more category 1 presentations by controls (nine controls v one case), there were also more category 4 presentations (94 controls v 79 cases); there were more category 3 presentations by FA compared to controls (41 cases v 23 controls) (Box 1). Two-year mortality in the case group was 7.3% (ten deaths) and 2.8% (four deaths) in the control group; this difference was not statistically significant (P = 0.094).

FAs were more likely than controls to be admitted to hospital as a result of their presentation, although the difference was not statistically significant (OR, 1.63; P = 0.09). Aboriginal people (P = 0.004) and those who were homeless or had insecure housing (P = 0.04) were significantly more likely to be admitted. There was no association between admission status and cold weather, but patients in both groups were more likely to be admitted during hot weather (P = 0.007). There was no difference between groups with respect to temperature or rainfall on the day of attendance.

The results of unadjusted logistic regression analysis of social variables were consistent with these findings. Alcohol was more likely to be involved in presentations by FAs (OR, 2.84; P = 0.002); FAs were more likely to identify as Aboriginal (OR, 3.93; P < 0.001), and to be homeless (OR, 20.4; P < 0.001) or from out of town (OR, 1.95; P = 0.019). There were no statistically significant differences between cases and controls for age, sex or the involvement of violence. Unadjusted logistic regression analysis of annual weather variables (baseline: August, in the dry season) indicated that presentations by FAs were particularly frequent in February (OR, 6.07; P = 0.012). Frequent presentation was more likely during the hot and wet season and on rainy days, but neither association was statistically significant (Box 3, Box 4).

There were no statistically significant interactions between the number of rainy days, homelessness, Indigenous status, and alcohol involved in presentation with respect to frequent presentation. Compared with FAs who had secure housing, FAs who were homeless presented more frequently on a rainy day (OR, 31.7; P = 0.001) than did those who were from out of town (OR, 2.3; P = 0.009), although no statistically significant interaction between the two variables was identified. For FAs there were no statistically significant interactions between rainy day and Indigenous status, rainy day and alcohol contributing to presentation, Indigenous status and alcohol, or homelessness and alcohol.

Backwards stepwise logistic regression indicated that the following variables predicted frequent presentation: Aboriginal status, alcohol use as contributing factor, homelessness, and rainfall on the day of presentation (pseudo-R2 = 0.18; P < 0.001) (Box 5). When tested independently, alcohol use was positively associated with frequent presentation (OR, 2.84; P = 0.002); however, in the regression model this association was attenuated by the joint inclusion of alcohol and Aboriginal status (OR, 1.54; P = 0.238), joint inclusion of alcohol and homelessness (OR, 1.05; P = 0.92); the association was reversed when homelessness and Aboriginal status were both included (OR, 0.47; P = 0.155). None of these findings were statistically significant.

Discussion

This is the first robustly designed case–control study to have clearly defined a group of FAs to a hospital ED without a unifying clinical reason for their frequent presentations. For each FA, we randomly selected a single instance from their presentations over a 12-month period, and compared their clinical and non-clinical variables with those of a control group. This rigorous study design minimised the possibility of confounding and bias, and provided clear insights into reasons for frequent presentations to the hospital by certain individuals. It is also the first study to examine the problems associated with FAs in a tropical Australian region with a large Aboriginal population.

Our study identified a very strong association between frequent ED attendance and each of homelessness and Aboriginal identity, and also a strong association with alcohol (but not violence) as a contributor to the presentation. It is not surprising that being Aboriginal was predictive of frequent presentation, as this group is overwhelmingly affected by homelessness, an association clearly identified as a predictor of frequent attendance by previous studies.28

Our results also confirm that presentations by FAs are for genuine acute clinical reasons; although the pattern of triage categories differed between the case and control groups, diagnoses at presentation and rates of admission to hospital were similar. FAs present to ED with genuine clinical needs.

Alcohol is a significant contributor to morbidity and mortality among FAs. However, the effect of the role of alcohol in contributing to the presentation disappeared when both homelessness and Aboriginal status were included in the regression analysis model. This implies that FAs presenting to the ED who are neither Aboriginal nor homeless may have a higher burden of alcohol-related harm than Aboriginal or homeless FAs, who undoubtedly also suffer alcohol-related harm. Further statistical exploration of this phenomenon revealed that the change in the shape of association with frequent attendance was mainly explained by the interaction between alcohol use and homelessness.

The predictive value of weather is more complex. The tropical weather of the Top End of the NT is extreme: the build-up season from October to December, characterised by very hot and humid weather; monsoonal rains from January to March; and the dry season from April to September.

Logistic regression analysis indicated that the effect of the only weather variable predictive of frequent presentation (rain) was only weak. There was a statistically significant spike in presentations by FAs during February, a particularly hot and wet time of the year. It is possible that such weather leads to homeless people attending hospital for shelter, although studies from non-tropical areas have not found such an association.13 It is more likely, particularly given that admission rates for both cases and controls were higher during hotter months, that tropical weather contributes to acute illness that leads to presentation, consistent with local and international research in whole populations.14,15

FAs were responsible for 13% of all ED presentations to this hospital. As these presentations were for genuine emergency medical care, the reasons for an annual death rate among FAs not meeting the exclusion criteria for our study that was 6.8 times as high as the national average16 need to be understood. Although the difference between mortality rates for cases and controls in our small study did not achieve statistical significance, it is likely that FAs have higher age-adjusted mortality rates. Further research is needed to confirm this, and interventions that target the root causes of poor health outcomes for FAs should be offered and evaluated. This includes hospitals recognising the unmet needs of FAs, ensuring that treatable medical problems are diagnosed, and mitigating social and other risks during presentation to an ED.

As a result of our study, Katherine Hospital is instituting a targeted intervention for FAs. Patients presenting to the ED on more than five occasions in the past year will trigger a Frequent Presenter Pathway, with pre-discharge review by an FA team, in which social, medical, and drug and alcohol problems will be identified and addressed.

Limitations to our study include the fact that there were only small numbers of FAs at this hospital, limiting the capacity to detect statistically significant interactions between the analysed characteristics. This study also excluded FAs with chronic health conditions, whose clinical presentations and outcomes are probably different but no less valid than those of the patients in this study. This study did not examine all the variables likely to contribute to frequent attendance, including social and cultural variables (such as events causing remote residents to visit town), access to motor vehicles, financial influences (such as welfare and royalty payments), and environmental variables other than weather (such as bushfire smoke). Clinical data were collected from the patients’ electronic records, and these may not have been complete. True rates of homelessness have probably been under-estimated in this study, as our estimate is based on hospital data that do not include definitions of overcrowded housing and other factors contributing to accommodation instability.

Homelessness in the NT is often referred to as “long-grassing”. This term subtly implies that homelessness is a cultural or lifestyle choice, but there is really no choice involved in the situations in which these people find themselves. The term suggests that homelessness is a contemporary cultural norm for Aboriginal people in the NT. There are a core group of chronically homeless people in fringe-dwelling communities with poor access to services. Many remote Aboriginal people visiting town for social and other needs find themselves temporarily homeless. Adding to this complex situation in other parts of northern Australia is a push to defund and effectively close remote Aboriginal communities, actions that could acutely worsen the situation. The core problem is a lack of housing and accommodation options for rural and remote Aboriginal people.

For towns where homelessness and alcohol misuse are as pervasive as in the Katherine region, there is an ongoing need to redress the root problems by implementing evidence-based alcohol harm minimisation strategies,17 establishing innovative facilities for homeless people that deliver the necessary hygiene and basic environmental protection, and providing greater access to appropriate accommodation. Such measures could reduce the burden of acute presentations to local hospitals, and improve their dignity, so that homeless Aboriginal people may possibly begin to heal.

Box 1 –
Demographic and clinical characteristics of the cases (frequent presenters) and controls

Frequent attenders

Controls

P


Number of patients

137

136

Age, years

42.9 (SD, 15.2)

40.8 (SD, 16.7)

0.295

Sex (female)

57.7%

52.2%

0.272

Aboriginal

70.8%

53.0%

< 0.001

Living arrangements

Unstable (homeless or out-of-town)

48.1%

23.7%

< 0.001

Homeless

19.7%

1.4%

< 0.001

Alcohol as contributing factor

25.6%

10.8%

0.001

Violence as contributing factor

15.3%

10.1%

0.189

Triage category

1

1

9

0.004

2

7

7

3

41

23

4

79

94

5

9

3

Mortality at 2 years

7.3%

2.9%

0.094


SD = standard deviation.

Box 2 –
Presentation diagnoses for 137 frequent attenders and 136 controls

Presentation diagnosis

Frequent attenders

Controls


Cardiology (chest pain, arrhythmia)

9

9

Endocrinology (diabetes)

1

0

Ear/nose/throat and eye (eye injury or symptom, tonsillitis, otitis externa or interna)

7

10

Gastrointestinal (diarrhoea/vomiting, pancreatitis, gastrointestinal bleed, gastroenteritis, hepatitis)

7

5

Infection (undifferentiated infection, cellulitis)

10

8

Neurology (stroke, dizziness, headache, seizure: including in contact of alcohol)

10

7

Pain (as predominant complaint; diagnosis unclear)

30

39

Psychiatric (not including intoxication)

3

0

Respiratory (asthma, chest infection, shortness of breath)

19

12

Surgical (appendicitis, abscess, foreign body; not eye)

1

2

Trauma and assault

9

13

Urological or renal (urinary tract infection, pyelonephritis, renal calculi, retention)

2

5

Wound

12

5

Alcohol intoxication (as the sole reason for presentation)

7

4

Other (social reasons, medical certificates, other non-medical reasons)

10

17


Box 3 –
Odds ratio for presentation to the emergency department of Katherine Hospital by frequent attenders, by month, compared with monthly rainfall data*


* Reference month for odds ratios is August.

Box 4 –
Odds ratio for presentation to the emergency department of Katherine Hospital by frequent attenders, by month, compared with monthly temperature data*


* Reference month for odds ratios is August.

Box 5 –
Backwards stepwise logistic regression of frequent presenters to the emergency department of Katherine Hospital

Presentation characteristics

Odds ratio (95% CI)

P


Aboriginal

2.06 (1.41–2.84)

< 0.001

Alcohol involved in presentation

0.46 (0.16–1.34)

0.154

Homeless

14.17 (2.98–67.43)

0.001

Rain on day

1.55 (0.78–3.07)

0.212

Constant

0.37 (0.23–0.58)

0.001


Model: Frequent attender = 0.37 + 2.01(Aboriginal) + 0.46(alcohol) + 14.17(homeless) + 1.55(rain on day). Model statistics: likelihood ratio (χ2[4] = 50.51; overall probability, P < 0.001; pseudo-R2 = 0.18.

Improving health literacy in refugee populations

We must ensure that people of refugee background have the confidence, support and resources to manage their health

Health literacy is defined as the degree to which an individual can obtain, communicate, process and understand basic health information and health services to make appropriate decisions about their health.1 Low health literacy is inextricably linked to poor health outcomes. Individuals with limited health literacy have higher rates of illness and more hospitalisations.2 Acquiring good health is a process that requires access to health care and health knowledge to inform positive health behaviour coupled with ongoing access to necessary resources.

The refugee experience is often characterised by displacement with limited access to services and basic necessities. For resettled refugees, low health literacy can be expected as they navigate a new country, language and culture. The stressors of cultural and language differences, and securing housing and employment may exacerbate trauma, leading people to feel isolated and helpless, with attendant symptoms of sleeplessness, poor concentration and emotional issues. The psychological effects of trauma may be long term and experienced intergenerationally.3 Many may have had disrupted education owing to protracted time in precarious living situations, so it cannot be assumed that they have reading ability in their own language. Further, due to displacement and changes in family composition, traditional ways of sharing health information may be fragmented.

Such experiences have a profound impact on the way people engage with health information, health care services and preventive health activities.4 Being clear about the role of health services and health care providers, and explaining the purpose of appointments, benefits of preventive activities and recommended treatment regimens may assist. The situation is complex — a standard knowledge base cannot be assumed, precaution is necessary and the provision of information needs to be modified.5 Clinicians could mindfully adapt their skills to care for this population; however, we recognise that the provision of information is not necessarily straightforward. Our research found little consistency in the approach that maternity care providers take to providing health information.6 Afghan families reported that they mostly received brief verbal information, a few received written information in their own language, and some had seen pictorial information. Many sought information and advice from family members overseas, and several obtained information from the internet.

Providing the best possible standards of professional interpreting requires systems to facilitate access, training and practice.7 Enabling people to communicate freely in their own language supports the development of trust, respect, rapport, cultural safety and relationship-centred care.8 The role of interpreters is to provide a language service with strict parameters with no ongoing relationship. Bicultural workers, however, may assist people to navigate health services, get to appointments and negotiate expectations. They also act as an aid for clinicians to understand differing health beliefs and social circumstances that may affect decision making. Bicultural workers provide a bridge to reduce the social distance that often exists between health professionals and clients.

The health care setting offers a dynamic learning environment in which clinicians are in a key position to improve health literacy.9 A tool that encourages two-way participation is teach-back. Teach-back is an evidence-based communication strategy that requires health professionals to ask the individual to repeat back what they have explained but in their own words. It is not a test of the individual’s memory.10

Some health literacy advocates suggest that assessing health literacy is an important step in addressing health disparities.2 However, this has the potential to create shame and stigma. Many measurement tools do not inquire about the full scope of health literacy and are narrowly focused on reading, writing and numeracy deficits. If applied, assessments need to be completed in the context of relationship-centred care.8

The health system needs to support clinicians to adopt novel ways of responding to low health literacy.11 A health-literate organisation is defined as one that makes it easier for people to navigate, understand and use information and services to take care of their health.12 A health-literate organisation would recognise that refugees may have concerns that are perceived as more immediate than their personal health status.13 People of refugee background are often worried about finances, learning English and family members who remain in dangerous situations. To support clinicians working with diverse communities, health services need to develop stronger local service partnerships that broaden access to existing community and local resources.

We believe that improving health literacy in this population involves much more than access to information — it is about people having the confidence, support and resources to manage their health. Health literacy in refugee populations could be tackled by multifaceted, multidisciplinary interventions and policies that are responsive to these unique circumstances.14

Help! I have lost my blue tie

We were uniformed reminders of something of which the veterans did not want to be reminded

It is a strange sensation to have lived a lifetime in which, successively, Australia has fought against the Germans, the Italians, the Japanese, the Koreans, the Chinese, the Indonesians, the Vietnamese, and is now fighting against who we are not sure — it is difficult to know who the enemy is, but it seems very much like a rerun of the crusades. Only the Japanese have ever posed a direct threat of invasion; yet the bones of Australians lie across the world.

I have a faint memory of Americans in uniform in Melbourne. I was in the local milk bar when VJ Day was proclaimed. I knew nothing of war itself, except my father was periodically away in the Navy.

Armistice Day was my first memory of a city street completely still when the eleventh hour of the eleventh day of the eleventh month came. It was a time when every man took off his hat — as they did when funerals passed. The sole noise that day was the clacking of high heels as a woman walked by, seemingly oblivious of the one-minute silence.

At school, I remember that every Anzac Day there was a service and recitation of the dead who had been at the school and “laid down their life” for their country. As a young cadet, I remember a sodden day being part of the schoolboy honour guard — in slouch hat, Victorian era blue tunic, woollen khaki pants, gaiters and ill-fitting boots, but bearing a .303 rifle. We were lining the road leading to the Shrine where the veterans of two World Wars marched and a few survivors from the Boer War were being wheeled. There must have been some Korean War veterans but they merged with the World War II returned soldiers. They were all in mostly grey suits and ties, and most wore hats … marching under banners. Almost none were in uniform. Those who had anything to say to us were derogatory. We were uniformed reminders of something of which they did not want to be reminded — war. They just wanted to be with their mates, the survivors, to drink those memories away and play two-up.

The year I lined the route was the same year that Alan Seymour’s play One Day of the Year was produced, with the hostility it aroused by questioning the heroic basis of those vested with the raiment of “mateship”.

My first vacation job was in the old Repatriation Department, assembling the medical files of the warriors. I think I was on the cusp of my fourteenth birthday, but was somewhat surprised when most of the desks emptied at lunchtime. I was told that the public servants were enjoying a training run to the local pub, the Maori Chief, and would be back later — in time to clock off. This afternoon’s sojourn was a form of reparation, as most of these “runners” were ex-servicemen.

In between those two official days of commemoration, nobody talked much about the war, least of all those who had been involved. My father never did. As a doctor and lawyer, he spent much of his post-war years looking after damaged servicemen, defending their entitlements.

Now we are New Age pilgrims in all the areas where Australians lie buried, except North Korea. The Kokoda Trail has become a must-do if you are so inclined. April in Gallipoli is a must. France has a number of watering holes on the way to the war graves. Most of those returned soldiers who experienced combat when I was young are dead. Of those who remain, very few are under 90 years of age and I dare not interpret their deepest memories — especially when they see politicians, epitomes of solemness, at a drop of a blue tie, laying a wreath, stepping back to the safety of men in braid, bowing their heads as if in prayer.

One expert in grief reaction has written to me saying that the shifting of focus to those performing the ceremony/rituals rather than the players in the event can diminish the experience.

The process of learning to live with loss includes maintaining a relationship with that which/who was lost — as other relationships change over time so does one with a lost person. Grief is revisited as time passes, as we age, as we encounter new understandings. For example, the death of a child is re-grieved when the child would have turned 18 or when another relative’s child dies from a similar cause. The people who experienced the mayhem and incompetence of the First World War would have revisited their loss at each anniversary and understood it anew. The current revisiting of the First World War is a chance to understand and relive it anew — since grief is a social experience — we grieve lost relationships and we heal in our relationship with people who acknowledge our grief and our personhood. (P. Egan-Vine, personal communication, 16 Sep 2015).

We have reached the end of 2015 — we have another three years to run before we finish the World War I memento mori. There are 16 sites on the Melbourne Shrine wall that denote battles where our forefathers were embroiled in that war — and these are only those of us with Anglo-Celtic origin. Just imagine if we introduced multiculturalism into the mourning cycle.

There are a great many wreaths waiting to be laid. In fact, the laying of flowers has spread across the nation as the aftermath of death, especially of the young. The image of floral tribute is constantly reinforced in the media and when driving along the roads, where violence is often the companion of death.

It is symbolic that the First World War had very few great leaders, or even competent ones. Sir John Monash was the star in the Allied firmament, although the Americans would say “Black Jack” Pershing was not a bad leader. He famously said “A competent leader can get efficient service from poor troops, while on the contrary an incapable leader can demoralize the best of troops”.1

For much of the time in World War I the Allied Forces, under which so many Australians died, were led by incompetent men — perhaps a metaphor for what has been happening in this country, where the population has increasingly yearned for somebody to actually provide a presence — a sense of purpose — not one engaged in faux mourning and putting out the constant warrior metaphor to describe day-to-day political activity.

Politicians have bickered over their expenses and they constantly design tricks and strategems to make the country ungovernable, egged on by the demands of the 24-hour media cycle while, at the same time, teaching a new generation of political advisers-cum-politicians to perpetuate this dysfunctionality.

As we get older, we are prisoners of our reminiscences, but there is a certain clarity in knowing people of purpose — who wanted to get things done. I was around when Australia, 45+ years ago, endured that internal political destructiveness played out against a background of war, where young men were submitted to the ultimate “Powerball game”. It was a time when local warlords termed “premiers” were strutting their stuff in some of the states.

The man of purpose, Whitlam, came — he overreached, but he defined leadership that gave this country purpose if, along the way, the country suffered pain.

We have a Poppy Wall at the National War Memorial but out in the “dusty, dirty city” there is a culture designed to continually revile the tall poppies.

In Melbourne, we have a Shrine where, if we want to remember the past heroes, it is there to visit and contemplate. It was not constructed until well after the war. The greatest proponent for its construction was probably one of, if not the, greatest of Australians after Howard Florey — Sir John Monash. The greatest opponent of its construction was another great Australian, Sir Keith Murdoch.

But in a way, Murdoch had a point — building tombs to the dead has a long history of diverting a civilisation from its real task of constructing a society for the living.

We should not have to wait for Armistice Day 2018 for the obsession of wreath laying to end and for this country to get leaders genuinely willing to change their blue ties — but then it may not matter. It may be a woman who gets this country to move on from its state of faux mourning, somebody who understands that grief is something we all experience at some time, cherish the memory and, if the memory is worthwhile, continue with the tasks of the dead, both of which are never-ending.

In the interim, during the writing of this “reflection” Australia has changed its Prime Minister, but the challenge set out above remains.

The 8 goals RACS have announced to stamp out bullying

The Royal Australasian College of Surgeons has launched an Action Plan to turn around the reputation of their profession.

The intention of their plan is to ‘promote respect, counter discrimination, bullying and sexual harassment in the practice of surgery, and improve patient safety’.

The Action Plan is a response to a draft report and recommendations released by an Expert Advisory Group commissioned by RACS in response to reports of bullying behaviour in the surgical field.

The report found there is culture of bullying that is considered a ‘rite of passage’ within the College with the intent to prepare trainees for surgery.

There are 8 goals in the Action Plan with a set of actions for each one to help the college monitor its progress.

The goals are:

  1. Build a culture of respect and collaboration in surgical practice and education
  2. Respecting the rich history of the surgical profession, advance the culture of surgical practice so there is no place for discrimination, bullying and sexual harassment (DBSH)
  3. Build and foster relationships of trust, confidence and cooperation on DBSH issues with employers, governments and their agencies in all jurisdictions
  4. Embrace diversity and foster gender equity
  5. Increase transparency, independent scrutiny and external accountability in College activities
  6. Improve the capability of all surgeons involved in surgical education to provide effective surgical education based on the principles of respect, transparency and professionalism
  7. Train all Fellows, Trainees and International Medical Graduates to build and consolidate professionalism including: fostering respect and good behaviour,   understanding DBSH: legal obligations and liabilities, ‘calling it out’/not walking past bad behaviour  and resilience in maintaining professional behaviour
  8. Revise and strengthen RACS complaints management process, increasing external scrutiny and demonstrating best practice complaints management that is transparent, robust and fair

Read the full action plan on the RACS website.

So far, responses from doctors have been positive. Dr Ashleigh Witt, who gained prominence in the mainstream media earlier this year for her comments on being a female surgeon, tweeted ‘I’ve only skimmed but so far very impressed by this. Excellent work @

St Vincent’s Health tweeted ‘Congratulations @ on this important announcement. We stand ready to work with you on its implementation.’

Senior surgeon and author on gender equality Dr Gabrielle McMullin told ABC Radio that she wasn’t sure it would change anything: “The problem is getting people, trainees, to believe that a complaint will not adversely affect their progression in their career and getting a job. That is the major reason why trainees don’t complain about harassment and bullying, is because you lose your career if you complain.”

Tells us what you think on our Facebook page.

Latest news: