×

Why don’t we speak openly about doctor suicides?

Why don’t we speak openly about doctor suicides?


Just over a week ago, I read an obituary in a medical publication about a young talented and clearly lovely junior doctor. Her life and achievements were celebrated, but no mention was made of the cause of her untimely death. Some colleagues and I surmised it was suicide, but then we wondered why it was it was not mentioned in the obituary.  Subsequently, suicide was confirmed, but at the time it felt as though there was an embargo on talking about doctor suicide. There is a shame about discussing it in public, and if this is the case, how can we possibly learn about the things that lead to suicide in our colleagues? We discuss medical cases openly so that we might learn, but why not of our colleagues who reach a point of no return?

It is well known that doctors do have a higher rate of suicide than the general public. These results have been reported as being up to 5.7 times higher than the general public. Female doctors are at the greatest risk with rates 2.27 – 5.7 times higher.

These results are staggering, but the fact that we have suicide at all in the profession is indicative of a deep dis-ease in our profession.

How is it that we can have people who are caring by nature, who choose to do medicine to care for people, but ending up so despairing that they take their own life?

And worse, that their colleagues and medical friends do not notice their decline to that point and are often completely surprised to hear of the death of a colleague in such a fashion?

These suicide statistics have been known for some time, yet until now, no true action has been undertaken.

In response to recent matters, last month the NSW Health Minister Brad Hazzard, instructed his staff that they have one month to come up with a plan for the doctor suicide crisis. It is great to see urgency brought to this matter, but is one month really enough and will it really get to the root of the cause?

What we are looking at here are ingrained issues, where for so long suicide has been accepted as a “sad yet inevitable”, or an “occupational hazard”. I was taught the statistics as though it was an inevitability that could not be altered. But is this really the case, and is this the way we would or ought to approach other health issues?

As doctors, we care about the health of people in medicine, yet we do not appear to be taking the same care and attention to the health of people in our own medical community.

Doctor suicide occurs within the context of the health care system and culture

Increasingly the culture of medicine is being revealed as replete with bullying and harassment. Far from caring for health care professionals, the culture of medicine is that of judgement, critique, condemnation, blaming and shaming. There is no true care and attention brought to the health and well-being of doctors and we are not trained in any suitable way how to deal with the emotional demands of the job, nor are we taught how to look after our own health and well-being.

Medicine is not a culture of peer support, but rather of peer competition and judgement. Any sign of human vulnerability and feelings is seen as a sign of failure. Medicine teaches you to be a “doctor” and not who you are as a human being. You are taught to “toughen up”. You learn that only the tough survive. There is stigma for those with mental health issues. People become isolated, hiding what they are going through. There are definitely some cultural factors that need addressing.

I have heard it said more than once that medicine is more stressful than being in the army or in a war zone, and that there is more compassion for your well-being when you are a soldier. In such a harsh environment, does it really surprise us that people do not survive?

As health care experts, why are doctors ‘surviving’ and not thriving?

Doctor suicide is the end of a long line of health issues for doctors, who are well known to have worse mental health than the general population on a number of counts. For every doctor who actually dies by suicide there are many who make an attempt but survive. Statistics show that  40-55% of the profession are burnt out with all of the personal health issues that entails such as higher rates of cardiovascular disease, anxiety, depression, diabetes, musculoskeletal disorders and suicidal thoughts. 25% of the profession have thought about killing themselves.

Doctor suicide exists in a longstanding culture that is well established to be uncaring and, at times, frankly abusive towards its own professionals. Suicide is an absolute tragedy but the day-to-day ill health of the medical profession is also a serious issue that needs to be recognised.

If we are serious about dealing with doctor suicide, we need to address the entire medical culture and system including the educational, medico-legal and regulatory aspects as well as personal factors at play. We need to be willing to make the needed changes. But we cannot do that until we are completely open about it and willing to examine the issue in absolute fullness.

Given the long association of suicide with the medical profession, there is clearly something amiss and thus something that can potentially be rectified. Let’s not look for short term solutions. Let’s aim to truly address the situation in full and get to the roots of the matter. Lives depend on it.

Dr Maxine Szramka is a Sydney-based rheumatologist and Clinical Senior Lecturer at the University of Wollongong. She blogs regularly at Dr Maxine Speaks.

Doctorportal hosts a dedicated doctors’ health service providing support and information about suicide prevention in the medical community.

For support and information about suicide prevention, call Lifeline on 13 11 14

Factors associated with quality of care for patients with pancreatic cancer in Australia

The known Treating patients with pancreatic cancer is challenging, and socio-demographic factors influence whether patients receive specific treatment forms, such as surgery and chemotherapy. 

The new Our composite quality of care score was lower for patients from rural or socially disadvantaged areas; it was higher for patients who first presented to a hospital with a high pancreatic case volume. A higher score was significantly associated with improved survival. 

The implications Strategies should be developed which ensure that all patients with pancreatic cancer have the opportunity to receive optimal care from or in conjunction with high pancreatic case volume centres. 

In Australia, pancreatic cancer is the tenth most common cancer, and the fourth leading cause of cancer-related death.1 One-year survival is 20%, 5-year survival 6%.2 Treating pancreatic cancer presents distinctive challenges, and requires highly specialised care to achieve optimal outcomes.3 Studies in Australia and overseas have shown that fewer patients receive the recommended treatment than expected,4,5 that receiving recommended care is inconsistent,6,7 and that socio-demographic factors influence the treatment of patients with pancreatic cancer.7,8 Treating patients in non-specialised centres appears to at least partly explain these findings.9,10

Previous studies have tended to focus on individual types of treatment, such as surgery or chemotherapy. We took a more holistic approach and calculated an overall quality of care score for Australian patients diagnosed with pancreatic cancer. We examined variations in the score associated with patient and health service-related factors, and analysed the relationship between quality of care and survival.

Methods

This analysis was nested within a population-based study of patterns of care for patients in Australia with pancreatic cancer. Eligible patients were residents of Queensland and New South Wales diagnosed with pancreatic cancer between July 2009 and June 2011. Patients with histological confirmation of pancreatic adenocarcinoma were included, as were patients with presumed pancreatic cancer but without histological or cytological confirmation. Trained research nurses collected information about patient treatment from medical records in public and private facilities.4 Patients were excluded from this analysis if they died within one month of diagnosis or clinical staging data were unavailable.

We calculated a quality of care score based on the results of our previously reported Delphi process.11 Briefly, clinicians from a range of specialties involved in care for patients with pancreatic cancer were asked “What is important in the care of patients with pancreatic cancer?” A list of statements was prepared on the basis of a thematic analysis of the responses. The clinicians were asked to score each statement on a scale of 0 (“disagree”, “not important”) to 10 (“strongly agree”, “very important”). The mean score and the coefficient of variation (CV) were calculated for each statement.

Calculating the quality of care score

We calculated quality of care scores on the basis of the mean Delphi process scores, selecting statements about which there had been reasonable consensus in the Delphi process (CV ≤ 0.4) and when information for assessing whether the item of care had been delivered was available in our database. Eighteen items were included in the analysis (Box 1).

For each patient, we calculated a potential score by identifying the items that applied to their clinical situation and summing the mean scores from the Delphi survey for these items. For example, items related to surgical procedures were included only for patients who underwent attempted resection. We then identified items for which there was evidence that the specified care had been delivered and summed their mean Delphi scores as a score for care delivered. The proportional care score was calculated by dividing the care delivered score by the potential score, yielding a value between 0 and 1. The clinical information that determined eligibility and whether or not care specified by an item was delivered are shown in Box 1.

Measurement of potential determinants of care

Patient characteristics assessed included age, sex, Eastern Cooperative Oncology Group (ECOG) performance status, and Charlson comorbidity index.12 Based on their area of residence at diagnosis, each person was allocated a socio-economic index for areas (SEIFA)13 score and Accessibility/Remoteness Index of Australia (ARIA+)14 category. We grouped the SEIFA scores into quintiles, and collapsed the ARIA into three levels: major city, inner regional, and rural (which included the outer regional, remote and very remote categories).

Tumour-related factors included the stage of the tumour, categorised as potentially resectable or not, and as confined to the pancreas, locally advanced, or metastatic.

Health service-related factors included the type of specialist first seen, and the number of pancreatic cancer presentations (volume) for the facility to which the patient first presented.

Statistical analysis

The proportions of eligible patients who received each item of care were calculated; the statistical significance of differences between proportions according to socio-economic status and place of residence categories was assessed in χ2 tests.

We used linear regression analyses, with the proportional score as the outcome, to examine variation in the score attributable to patient-, tumour- and health service-related factors. Mean proportional scores for levels of each exposure variable were calculated and β coefficients reported (with 95% confidence intervals [CIs]). The β coefficients were interpreted as the difference between the mean score for patients in a particular category and that of patients in the reference category. Multivariable models included age, ECOG performance status, and comorbidity score as factors.

Survival time was calculated from the date of diagnosis until the death of the patient or the date of the final follow-up (February 2014). Patients were grouped in quartiles according to their proportional care scores; Kaplan–Meier graphs were generated and log-rank tests assessed differences in survival according to score quartile. We also performed the analysis with the proportional care score as a continuous variable; we report changes in survival associated with each 10 percentage point increase in score, using Cox proportional hazard models to adjust for patient-related factors and clinical stage. The association between the score and survival was further investigated by calculating adjusted hazard ratios for each care score item separately. Analyses were performed for the entire patient group and separately for patients with or without metastases identified at clinical staging. We used Stata 14 (StataCorp) for all analyses. P < 0.05 (two-sided) was deemed statistically significant.

Ethics approval

Access to medical records was approved under the Queensland Public Health Act and the NSW Privacy Act. Ethics approval was obtained from the QIMR Berghofer Medical Research Institute (reference, P1292), the Royal Brisbane and Women’s Hospital (on behalf of all public hospitals in Queensland; reference, HREC/10/QRBW/16), and the NSW Population and Health Services Research Ethics Committee (reference, HREC/10/CIPHS/45).

Results

A total of 1896 patients were eligible for inclusion in the patterns of care study. We were unable to locate medical records for 33 patients; 259 had died within one month of diagnosis, and staging information was not available for 33, so that 1571 patients (83%) were included in our analysis, including 867 men (55%). At clinical staging, 781 patients (49.7%) had non-metastatic disease and 790 (50.3%) metastatic disease. Most patients lived in major cities (1076, 68%); 338 (22%) lived in inner regional areas and 157 (10%) in rural areas. Almost three-quarters of patients (1151, 73%) died within one year of diagnosis. The median survival time was 6 months (11 months for patients without metastases; 4 months for those with metastases).

Younger patients and those with better ECOG performance status had higher care scores than older and less active patients with pancreatic cancer (Appendix 2). ARIA+ category, area level socio-economic status, age, ECOG performance status, institutional pancreatic cancer case volume, and specialist first seen were all factors that significantly influenced the care score (Box 2; Appendix 3). After adjusting for these factors, the care scores for patients living in rural areas were 11% lower (95% CI, 8–13%) than for those living in major cities. The care scores for patients living in more disadvantaged areas were up to 8% lower (95% CI, 6–11%) than for patients living in the least disadvantaged areas. Care score estimates for patients presenting to a low pancreatic cancer case volume hospital (fewer than ten presentations per year) were 13% lower (95% CI, 11–15%) than for those presenting to hospitals with more than 30 presentations annually. They were higher for patients for whom a hepatobiliary surgeon was the first specialist seen; scores for patients initially seeing a general surgeon were 10% lower (95% CI, 8–13%) (Box 2).

To further investigate the association between ARIA+ category and care score, models were then also adjusted for the pancreatic cancer case volume of the first hospital and specialist seen. The differences in the adjusted mean scores for major cities and rural areas (5% lower for rural patients; 95% CI, 3–8%) and between least and most disadvantaged areas (6% lower for most disadvantaged patients; 95% CI, 3–8%) were lower in this model.

For patients who had been clinically staged with non-metastatic disease, the factors most strongly associated with lower care scores were being seen initially by a general rather than a hepatobiliary surgeon (17% lower; 95% CI, 13–21%), living in a rural area rather than a major city (11% lower; 95% CI, 8–15%), and being at least 80 years of age (v aged less than 60 years: 16% lower; 95% CI, 13–20%). For patients diagnosed with metastatic disease, being seen at a lower volume facility (15% lower; 95% CI, 12–17%) and having a poorer ECOG performance status (11% lower; 95% CI, 7–15%) were the factors most strongly associated with quality of care.

Individual items of care were also examined. Less than one-third of patients received some items: 31% were presented to multidisciplinary teams (MDTs), received psychosocial support (19%), participated in clinical trials (7%), or were first seen by a hepatobiliary surgeon (19%). Most eligible patients were offered resection or received a valid reason why they were not (98%), had a tissue diagnosis (80%), saw a medical oncologist (86%), and were referred to palliative care (82%) (Box 1). There were significant differences for patients according to their ARIA+ category and area level socio-economic status; for example, 32 patients living in rural areas (41%) were referred to a hepatobiliary surgeon, compared with 53% of patients (290 of 548) in metropolitan areas (Appendix 4, Appendix 5).

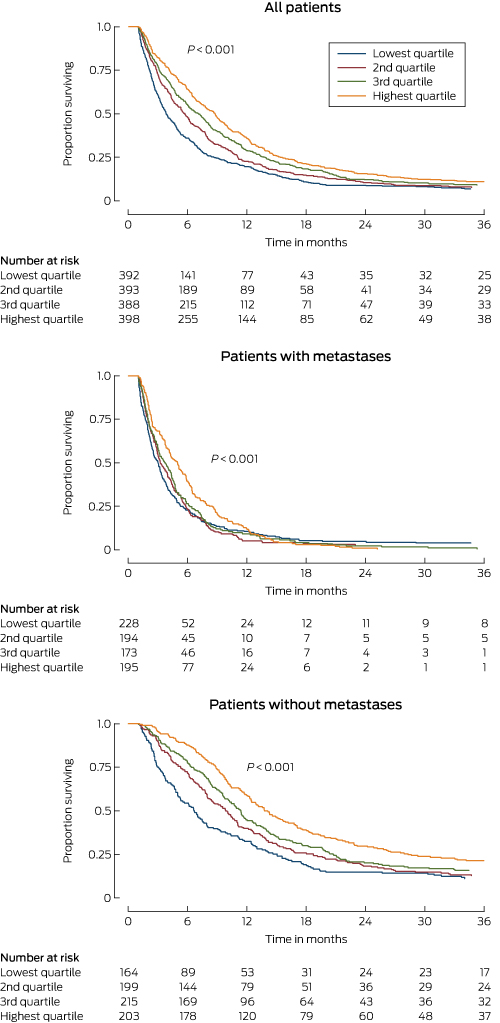
Patients with scores in the highest quartile of proportional care scores had an estimated median survival time of 8 months, double that for those with scores in the lowest quartile. Median survival time for patients with non-metastatic disease in the highest and lowest score quartiles was 14 and 7 months respectively; for those with metastatic disease, it was 5 and 3 months (Box 3).

After adjusting for age, ECOG performance status, comorbidities, and clinical stage of pancreatic disease, each 10 percentage point increase in proportional care score was associated with a statistically significant 6% reduction in the risk of dying (hazard ratio [HR], 0.94; 95% CI, 0.91–0.97; Box 4). The reduction was greater for patients who were diagnosed with non-metastatic disease (adjusted HR, 0.91; 95% CI, 0.87–0.95) than for those with metastatic disease (adjusted HR, 0.95; 95% CI, 0.91–0.99).

Individual care score items that were statistically significantly associated with survival included having a diagnostic tissue sample collected (HR, 0.66; 95% CI, 0.57–0.77), being offered adjuvant chemotherapy (HR, 0.43; 95% CI, 0.33–0.56), being referred to a hepatobiliary surgeon if potentially resectable (HR, 0.82; 95% CI, 0.69–0.96), being presented to an MDT (HR, 0.86; 95% CI, 0.77–0.96), being offered psychosocial support (HR, 1.24; 95% CI, 1.09–1.12), pancreatic enzyme replacement therapy (HR, 0.83; HR, 95% CI, 0.73–0.94), and, if diagnosed with metastatic disease, referral to palliative care (HR, 1.42; 95% CI, 1.17–1.74) (Appendix 6).

Discussion

We found that the quality of care for patients with pancreatic cancer varied according to their age, where they live, and the pancreatic cancer case volume of the hospital to which they first presented. We also found that higher quality of care was associated with improved survival. This association was strongest for patients clinically staged with non-metastatic pancreatic cancer, for whom there is more scope for treatment that can increase survival.

Earlier studies found that receiving surgery, chemotherapy and palliative care was influenced by the age, education, place of residence, ethnic background, and marital status of patients.5,7,15 By applying a composite measure of care that included a broad range of factors, we found that age and ECOG performance status influenced its overall quality. While this is unsurprising, it is important to recognise that age alone is not a barrier to high quality care. Our more worrying finding is that quality of care varied according to the geographic classification and the area level socio-economic status of the patient’s place of residence. This is at least partly explained by differences in access to specialists and care in high case volume centres, suggesting that interventions which ensure that all patients are managed by high volume teams could improve the quality of care.

Our analysis of individual care items found that the proportion of people receiving care from specialist teams, as recommended, was particularly small: fewer than one-third of patients had been referred to an MDT, only half of potentially resectable patients had been referred to a hepatobiliary surgeon, and referral to a clinical trial was only rarely considered, even though these factors have consistently been found to influence the quality of care.9,16,17 These aspects of care were particularly poorly delivered to patients living in more rural areas. Distance causes particular challenges in Australia,1820 but they should not be insurmountable; it has been reported, for example, that a multi-level approach (such as telemedicine MDTs and formalising referral relationships between regional and metropolitan centres) can improve outcomes.21

Survival for patients with lower care scores was poorer, consistent with previous reports.2224 This association was stronger for patients diagnosed with non-metastatic disease, for whom there is more scope for influencing survival by ensuring that staging is adequate, that surgery is undertaken in high case volume centres, and that patients have access to adjuvant chemotherapy. For patients with metastatic disease, a focus on quality-of-life indicators is arguably more important; this could be explored in further investigations of care quality.

Some care items were associated with a greater hazard of dying when the care was received, including statements that patients should be “offered psychosocial support”, that “patients with metastatic disease should be referred to palliative care”, and that “patients with technically resectable disease should be offered resection or a valid reason for no surgery”. Receiving psychosocial and palliative care is more likely as the expected survival time shortens, and this probably explains these findings (reverse causation). The care item regarding resection was classed as having been delivered if a valid reason for the resection not being offered had been recorded. This applied to 28% of patients eligible for resection; the reasons for not attempting surgery included older age, comorbidity, and poor ECOG performance status, each of which were associated with poor survival. When these three care items were all omitted from the care score, the risk of death was 2% lower for each 10 percentage point increase in care score (data not shown).

Our study was comprehensive, reasonably large, and population-based, and was also the first Australian investigation to assess the overall quality of care with a single score. Nevertheless, it had some limitations. Firstly, different weights for the care items may have been obtained if another mix of specialists had participated in the Delphi process. Secondly, the Delphi study highlighted the importance of communication between patients and clinicians. This factor cannot be adequately captured in a medical record review and could therefore not be incorporated into our score, but may have influenced decisions regarding care. Thirdly, some patients may have been incorrectly classified as having resectable tumours, which would have affected their eligibility for certain care items and thereby the delivery of appropriate care. Finally, although we controlled for age, ECOG performance status and comorbidities, we may not have completely accounted for confounding patient-related factors.

In conclusion, our population-based study provides evidence that the geographical location of their place of residence, among other factors, influences the quality of care received by Australian patients with pancreatic cancer, and that survival can be improved by delivering optimal care. Systems of care need to be implemented which ensure that equitable treatment is provided for all Australian patients with pancreatic cancer.

Box 1 –
Statements about care for patients with pancreatic cancer deemed to be most important in our Delphi process, patient eligibility criteria, and definition of care received

Care statement

Weight*

Eligible patients

Number eligible

Number who received care

Care received


All patients with potentially resectable disease should be referred to a hepatobiliary surgeon§

9.3

Non-metastatic

781

401 (51%)

Any referral or consultation with hepatobiliary surgeon

All patients with technically resectable disease should be offered resection or valid reason for not doing so

9.2

Potentially resectable

519

509 (98%)

Surgery attempted or valid reason for not doing so

Surgery should be performed by surgeons who perform more than five pancreatic resections per year

9.0

Resection attempted

366

158 (43%)

Surgeon performed more than five resections per year

Tumour resectability should be assessed by an MDT at a tertiary hospital

9.0

Non-metastatic

781

229 (29%)

MDT prior to attempted surgery, or within 40 days of diagnosis if no surgery

All patients should have a triple phase/pancreas protocol CT scan for staging

8.9

All patients

1571

674 (43%)

Evidence of pancreas protocol CT

Entry into a clinical trial should be considered for all patients

8.8

All patients

1571

103 (7%)

Clinical trial discussed, considered, offered or participated in a trial

Surgery should take place in tertiary institutions where more than 15 resections are performed annually**

8.6

Resection attempted

366

152 (42%)

Attempted resection performed at hospital with more than 11 resections each year**

Each patient should be assigned a care coordinator and an individualised treatment/clinical plan

8.5

All patients

1571

345 (22%)

Evidence of a navigator, care plan or nursing referral

Tissue diagnosis should be obtained where possible

8.3

All patients

1571

1251 (80%)

Histology or cytology analysis completed

All patients should be presented to an MDT

8.3

All patients

1571

494 (31%)

Evidence of presentation to an MDT

Biliary obstruction should routinely be managed endoscopically in non-resectable patients

8.2

Non-resectable with biliary obstruction

416

346 (83%)

Evidence of endoscopic biliary stent, not bypass surgery

All patients should be offered adjuvant therapy after surgery, assuming performance status is adequate

8.1

Resection attempted

366

244 (67%)

Evidence of any adjuvant chemo- or radiation therapy

All patients should be offered psychosocial support

8.0

All patients

1571

301 (19%)

Evidence of referral to or consultation with psychological services

Pancreatic enzyme replacement therapy should be considered for all patients

7.9

All patients

1571

345 (22%)

Evidence of pancreatic enzyme replacement

All patients should see a medical oncologist

7.9

All patients

1571

1353 (86%)

Seen by a medical oncologist or valid reason why not

A specialist hepatobiliary surgeon should be the initial/primary specialist unless the patient has obvious metastases

7.3

Non-metastatic

781

146 (19%)

Hepatobiliary surgeon was the first specialist seen

All patients should be referred to a dietitian soon after diagnosis

7.3

All patients

1571

1000 (64%)

Evidence of referral to or consultation with dietitian

Patients with confirmed metastatic disease should be referred to palliative care

6.0

Metastatic

790

646 (82%)

Any evidence of palliative care consultation or referral


CT = computerized tomography; MDT = multidisciplinary team meeting. * Final mean average score of importance from Delphi process. † Patients eligible for care according to classification by clinical staging. ‡ Number and percentage of eligible patients who received the item of care. § Hepatobiliary surgeon: defined as a surgeon who had undergone recognised specialist hepatobiliary surgery training or who was recognised by peers as an experienced hepatobiliary surgeon. ¶ Includes all inpatient records and consultations. ** Only three hospitals from the patterns of care study performed 15 resections each year; this high volume classification was therefore amended, on the basis of Australian data and literature reports, to hospitals where 11 or more resections were performed each year.

Box 2 –
Associations between patient, tumour and health service-related characteristics and proportional care scores for all patients, and for patients with or without evidence of metastases at clinical staging

Adjusted β coefficient (95% confidence interval)*


All patients

Patients without metastases

Patients with metastases


Number of patients

1571

781

790

Age group

< 60 years

Reference

Reference

Reference

60–69 years

0.01 (−0.01 to 0.03)

0.01 (−0.02 to 0.04)

0.00 (−0.03 to 0.04)

70–79 years

−0.05 (−0.08 to −0.03)

−0.05 (−0.08 to −0.02)

−0.06 (−0.09 to −0.03)

≥ 80 years

−0.13 (−0.15 to −0.10)

−0.16 (−0.20 to −0.13)

−0.10 (−0.13 to 0.06)

P (overall; trend)

< 0.001; < 0.001

< 0.001; < 0.001

< 0.001; < 0.001

Sex

Women

Reference

Reference

Reference

Men

−0.01 (−0.02 to 0.01)

0.01 (−0.01 to 0.03)

−0.03 (−0.05 to −0.00)

P (overall)

0.34

0.40

0.03

Charlson comorbidity score

0

Reference

Reference

Reference

1

−0.01 (−0.03 to 0.01)

−0.00 (−0.03 to 0.02)

−0.01 (−0.03 to 0.02)

2

−0.01 (−0.03 to 0.01)

−0.01 (−0.04 to 0.02)

−0.01 (−0.04 to 0.02)

P (overall; trend)

0.64; 0.38

0.88; 0.63

0.89; 0.66

ECOG performance status

0

Reference

Reference

Reference

1

−0.01 (−0.03 to 0.01)

−0.01 (−0.04 to 0.02)

−0.01 (−0.04 to 0.02)

≥ 2

−0.06 (−0.08 to −0.03)

−0.06 (−0.09 to −0.03)

−0.05 (−0.08 to −0.02)

Not stated

−0.09 (−0.12 to −0.06)

−0.07 (−0.11 to −0.03)

−0.11 (−0.15 to −0.07)

P (overall; trend)

< 0.001; < 0.001

< 0.001; < 0.001

< 0.001; < 0.001

Residence (ARIA+ classification)

Major city

Reference

Reference

Reference

Inner regional

−0.06 (−0.08 to −0.04)

−0.03 (−0.06 to −0.00)

−0.08 (−0.11 to −0.05)

Rural

−0.11 (−0.13 to −0.08)

−0.11 (−0.15 to −0.08)

−0.09 (−0.13 to −0.06)

P (overall; trend)

< 0.001; < 0.001

< 0.001; < 0.001

< 0.001; < 0.001

Socio-economic status (quintiles)

1 (least disadvantaged)

Reference

Reference

Reference

2

−0.03 (−0.06 to −0.01)

−0.04 (−0.07 to −0.00)

−0.03 (−0.07 to 0.01)

3

−0.07 (−0.10 to −0.04)

−0.08 (−0.12 to −0.05)

−0.06 (−0.10 to −0.02)

4

−0.08 (−0.11 to −0.05)

−0.08 (−0.12 to −0.05)

−0.08 (−0.12 to −0.04)

5 (most disadvantaged)

−0.08 (−0.11 to −0.06)

−0.07 (−0.10 to −0.03)

−0.10 (−0.13 to −0.06)

P (overall; trend)

< 0.001; < 0.001

< 0.001; < 0.001

< 0.001; < 0.001

Clinical stage of disease

Confined to pancreas

Reference

NA

NA

Locally advanced

−0.02 (−0.04 to 0.01)

Metastatic

−0.02 (−0.04 to 0.00)

P (overall; trend)

0.26; 0.14

Pancreatic cancer case volume of first facility seen

> 30 per year

Reference

Reference

Reference

10–29 per year

−0.06 (−0.08 to −0.04)

−0.07 (−0.10 to −0.05)

−0.04 (−0.07 to −0.02)

< 10 per year

−0.13 (−0.15 to −0.11)

−0.10 (−0.13 to −0.07)

−0.15 (−0.17 to −0.12)

P (overall; trend)

< 0.001; < 0.001

< 0.001; < 0.001

< 0.001; < 0.001

First specialist seen

Hepatobiliary surgeon

Reference

Reference

Reference

Gastroenterologist

−0.09 (−0.11 to −0.06)

−0.12 (−0.15 to −0.09)

−0.03 (−0.07 to 0.01)

General surgeon

−0.10 (−0.13 to −0.08)

−0.13 (−0.16 to −0.10)

−0.05 (−0.09 to −0.01)

Other

−0.14 (−0.16 to −0.11)

−0.17 (−0.21 to −0.13)

−0.10 (−0.14 to −0.06)

P (overall)

< 0.001

< 0.001

< 0.001


ECOG = Eastern Cooperative Oncology Group; NA = not applicable. * Adjusted for age group at diagnosis (< 60, 60–69, 70–79, ≥ 80 years), ECOG performance status (0, 1, ≥ 2, not stated), and Charlson comorbidity index score (0, 1, ≥ 2). † Includes patients in outer regional, remote and very remote areas.

Box 3 –
Kaplan–Meier survival curves for all patients, patients with non-metastatic disease and patients with metastatic disease on clinical staging, by proportional care score (quartiles)


* Log-rank test of equality of survivor functions across proportional care score quartiles.

Box 4 –
Association between total care score and survival according to stage of pancreatic cancer at diagnosis

Number of patients

Hazard ratio (95% CI)*


Unadjusted

P

Adjusted

P


All patients

1571

0.90 (0.87–0.93)

< 0.001

0.94 (0.91–0.97)

< 0.001

Non-metastatic disease

781

0.87 (0.83–0.91)

< 0.001

0.91 (0.87–0.95)

< 0.001

Metastatic disease

790

0.95 (0.91–0.98)

0.006

0.95 (0.91–0.99)

0.013


* Reduction in the risk of dying associated with a 10 percentage point increase in care score. † Adjusted for age group, Eastern Cooperative Oncology Group performance status, Charlson comorbidity score, and clinical stage.

High quality data are the key to understanding inequalities in cancer outcomes for Aboriginal and Torres Strait Islander Australians

A comprehensive evidence base for informing efforts to improve services requires linked national data

The study by Condon and colleagues in this issue of the MJA confirms past reports of the uncertain validity of reported cancer data for Aboriginal and Torres Strait Islander people resulting from poor recording of Indigenous Australian status in source databases.1,2 To improve the evidence base, the Australian Institute of Health and Welfare has limited analyses of cancer incidence among Aboriginal and Torres Strait Islander Australians to four Australian states and territories — the Northern Territory, Queensland, New South Wales and Western Australia — as their data are regarded as being of better quality.2

This study by Condon et al analysed high quality, validated data on Aboriginal and Torres Strait Islander status from the NT Cancer Registry.1 Their results confirm earlier findings that age-standardised all-cancer incidence rates are slightly lower for Indigenous Australians than for other Australians2,3 — although more recent data suggest negligible differences between the two groups4 — but poorer survival in Indigenous Australians, and substantially elevated cancer mortality.2,46

The study published in this issue confirms the relatively low incidence among Aboriginal and Torres Strait Islander Australians of cancers of the breast, colon–rectum, prostate and skin (melanoma) — cancers usually associated with average or above average survival — and, conversely, the elevated incidence of cancers of the cervix, and also of the lung, head and neck, other tobacco-related sites, and liver — cancers generally associated with average or below average survival.3,5

The study by Condon et al also confirms findings from another investigation that analysed data on survival trends from a single registry, the Queensland Cancer Registry.6 Survival trends data from a single registry source may be less vulnerable to methodological bias than data from multiple sources. Condon and his colleagues found that age-standardised incidence rates for female breast, colorectal and prostate cancers among Aboriginal and Torres Strait Islander people had increased between 1991 and 2012, possibly reflecting changing social and economic circumstances.1 These are leading incidence cancers among Australians overall, and the reported increases probably reflect the increasing adoption by Indigenous people of lifestyles similar to those of other Australians, replacing their traditional practices.1,7 These trends have important implications for planning services, including the priorities to be given to screening, other early detection measures, and primary prevention.

Conversely, the incidence of cervical cancer among Aboriginal and Torres Strait Islander women, while still relatively high, has decreased following increased participation in screening programs.7,8 It is encouraging to see the increases in survival from most common cancers for Indigenous Australian patients, despite overlapping confidence limits due to small case numbers.

While the results of this study are directly relevant to the NT, their representativeness for other Aboriginal and Torres Strait Islander populations is less clear.3,9 The estimated 13% of Australia’s Indigenous population who live in the NT are, in some respects, atypical. A disproportionately high proportion of these people live in geographically remote and lower socio-economic areas, and the fraction following traditional lifestyles may have significant effects on cancer risks and outcomes.1,7,10 This may lead to lower risks of cancers that are more common in the general Australian population, such as those of the female breast, prostate, and colon–rectum.1,2,5

Confirming lower cancer-specific survival for NT Aboriginal and Torres Strait Islander patients is important, but without data on disease stage at diagnosis, other prognostic factors, comorbidities and treatment, the underlying reasons for the differences are difficult to determine. Self-reported data are also needed for assessing perceptions of the value of treatment, the cultural appropriateness of services, and barriers to treatment.

Cancer Australia is promoting the increased availability of data for national cancer control indicators across Australia, including data on stage, treatment, and recurrence.11 Collecting patient-reported experiences would also be desirable. Australian researchers have already shown the value for population health and health system surveillance of linking data from cancer registries, inpatient statistics, and radiotherapy centres in New South Wales, Queensland, and some other jurisdictions.12 Australia urgently needs an organised, linked data network of this type, complemented by clinical quality registries, to identify service gaps for all Australians, but especially for Aboriginal and Torres Strait Islander people and other priority groups.12 Linked national data, with improved recording of Indigenous status, is necessary for producing a comprehensive evidence base for informing efforts to improve services.

High quality data and research, exemplified by the NT study reported in this issue of the MJA, will continue to play a central role in confirming broader national data and providing more comprehensive local evidence. By identifying Aboriginal and Torres Strait Islander and other priority groups in special need, the nature of their needs, and self-reported barriers to accessing services, the evidence for crafting appropriate health service responses will be strengthened.

After-hours medical deputising services for older people

Older people need GPs who know them well

Medical deputising services are invaluable, responding to large numbers of after-hours calls, particularly for older people at home and in residential aged care (RAC). Without these services, emergency departments and ambulance services would be much busier than they are now. The article in this issue of the MJA by Joe and colleagues1 reviews 357 112 bookings logged by one such service, the Melbourne Medical Deputising Service (MMDS), over a 5-year period (2008–2012).

The proportion of general practitioners using deputising services increased from 38% in 2005–06 to 48% in 2014–15.2 The data presented by Joe et al show a concomitant increase in the number of home and nursing home visits by the MMDS for those over 70 years of age, with the booking rate rising over the 5-year period from 33 to 40 per 1000 people over 70 years of age for home visits, and from 121 to 168 per 1000 people for RAC visits.

The reasons for this increase are undoubtedly complex, and require further examination. They include the increase in the size of the population of older people, and government initiatives that encourage GPs to provide after-hours services, either directly or through deputising services. The annual collection of data on 100 000 GP consultations in Australia known as BEACH has revealed a GP workforce that is “more feminised, older … and worked fewer hours per week”.3 Other factors might include the dangers of after-hours visiting, stretched GP workforces, and a trend among GPs toward a better work–life balance.

Deputising services differ from ordinary general practice. There is no requirement for their doctors to have a college fellowship, and only about half of the doctors in the MMDS do so.4 There is little continuity of care. Older people have high rates of dementia and may not be able to fully communicate their history. It takes time to trawl through medical notes in RAC facilities. This potentially reduces the quality of service compared with attendance by the patient’s own GP, who knows them and their medical history well. On the other hand, the deputising service keeps track of their locum service doctors, and should know whether something has gone amiss.

The article by Joe et al notes that over 80% of calls were from or on behalf of patients in RAC. These patients represent less than 5% of the older population, and they present with levels of complexity and disability that have qualified them for entry to RAC on the basis of the ACAT (Aged Care Assessment Team) criteria. The authors of the study ask why there are so few community call-outs, but it might also be interesting to consider why there are so many RAC call-outs.

Only 48% of the BEACH GP sample in 2014–15 had visited an RAC facility in the previous month.3 Barriers to GP visits include the poor level of GP remuneration, increased time seeing the patients,5 difficulty in finding staff (or indeed the patient), and staff with training below the levels of registered or enrolled nurse who are unable to hand over the patient history in a manner that makes medical sense.6 Handover comments such as “Mrs Smith is a bit behavioural today” are very difficult to interpret clinically.

Nurses with the ability to attend to complex needs are currently few in number in RAC, particularly at night. Nurses with lower levels of training may follow protocols that require at least a phone call to a medical practitioner if certain parameters are exceeded (eg, blood pressure). This call is even more likely in some areas, where hospitals require a medical practitioner review before receiving an ambulance patient from RAC.

RAC providers argue that changes in the Aged Care Funding Instrument, which funds RAC, will result in a decrease of 11% in income, with over 50% of survey respondents stating they would be likely to reduce the number of nursing staff.7 The New South Wales Nurses and Midwives’ Association has called for an approach that also takes the patient’s needs into account:8

We should be looking to establish a needs-based system to determine staffing ratios, consistent with those found in public hospitals to ensure our health care system is equitable, and does not discriminate on the basis of age.

When a patient’s usual GP is unavailable, the deputising service may be called, resulting in the large number of visits found by Joe and her colleagues. The service doctors are not equipped to care for these complex elderly patients in an optimal manner; they do not necessarily have a postgraduate qualification, they do not know the patient, and they are not supported by staff who are well trained and familiar with the medical conditions of each patient. We need to examine the reasons for calls to medical deputising services, and whether they are associated with excess morbidity and mortality. It is a problem that might be partly ameliorated by systems such as Hospital in the Home.9 Urgent change is needed if we believe that our elders should receive at least the same quality of medical care as the rest of our community.

Vulvoplasty in New South Wales, 2001–2013: a population-based record linkage study

The known The number of vulvoplasty procedures in NSW has been rising over the past decade. 

The new One in 23 women who had vulvoplasty had repeat procedures; one in ten had had, or will have, other cosmetic surgery. One in 14 procedures resulted in serious adverse events. The caesarean delivery rate for primiparous women was about 30% higher among those who had had vulvoplasty. Vulvoplasty had no effect on perineal outcomes of a subsequent vaginal first birth. 

The implications Our population-based study provides important information that can inform pre-surgery counselling. 

Vulvoplasty refers to surgery performed on the external female genitals, generally reducing the size or correcting the asymmetry of the labia minora.1 Increasing demand for this procedure has been reported over the past two decades, with the number of procedures rising in high income countries, including Australia,1 the United Kingdom2 and the United States.3

In Australia, the number of Medical Benefits Schedule (MBS) rebates linked with item number 35533 for vulvoplasty procedures doubled from 744 during 2003–04 to 1588 in 2012–13.1 This MBS item was specifically intended to cover medically indicated vulvoplasty procedures performed in or out of hospital in private care. However, as no guidance or objective measures for assessing medical necessity were available to clinicians, concern was raised that the increasing number of rebates claimed might reflect demand for vulvoplasty as a cosmetic service.1

A review of vulvoplasty services was consequently undertaken by the federal Department of Health,1 and changes to the MBS were made. The former Medicare item number 35533 (vulvoplasty) was replaced in November 2014 by two item numbers: 35533 (surgical repair of female genital mutilation and major congenital anomalies) and 35534 (surgical repair for localised gigantism causing significant functional impairment).4 Rebates were no longer available for out-of-hospital services, and were available for item 35534 only when there was documented evidence of a clinical need.4

The Department of Health review incorporated both Medicare data and information from the National Hospital Morbidity Database (NHMD). The NHMD contains data for vulvoplasty procedures in public and private hospitals and in day-stay units, with or without a medical indication, and provides additional information about the hospital stay. The review also reported the associated principal diagnoses and age profiles of patients at the time of vulvoplasty. However, as data were for procedures and not for individual women, analysis of re-admissions and repeat procedures was not possible. Apart from age, neither the characteristics of women undergoing vulvoplasty nor rates of adverse outcomes were reported. No other studies have had the capacity to investigate outcomes at the population level.

The increased number of vulvoplasty procedures has attracted discussion and debate in both the medical community and the popular media.5,6 Commentators have explored possible reasons for the rise,1,7,8 as well as the ethics of cosmetic surgery marketing.7,911 The low level of evidence for the reported short and long term outcomes, including adverse events, has been criticised.1,8,9,11,12 Studies have relied on surgeon-initiated questionnaires9,13 or anecdotal and case reports.11,13 Further, no studies of the effects of vulvoplasty on subsequent childbirth have been undertaken.13,14

The aims of our study were to compare the characteristics of women undergoing vulvoplasty with those of other women of reproductive age; to quantify serious short term adverse events; and to determine the effect of vulvoplasty on subsequent outcomes for women giving birth. We hypothesised that vulvoplasty might have an impact on perineal trauma and decisions about the mode of delivery.

Methods

The study population consisted of all women of reproductive age (15–54 years) who had had a vulvoplasty in a New South Wales hospital during 2001–2013. To explore the relationship between vulvoplasty and subsequent birth outcomes (birth type and perineal status), we also analysed a subpopulation that included women who had undergone vulvoplasty and subsequently given birth for the first time during 2001–2012.

Data were obtained from two routinely collected population-based data collections: the NSW Admitted Patients Data Collection (APDC, “hospital data”) for 2001–2013, and the NSW Perinatal Data Collection (PDC, “birth data”) for 1994–2012. The APDC, an administrative data collection, is a census of discharges from all public and private hospitals and day procedure centres. As well as demographic data, it includes clinical diagnoses coded according to the International Classification of Diseases, tenth revision, Australian modification (ICD-10-AM), and procedures coded according to the Australian Classification of Health Interventions (ACHI; based on the MBS).15 The NSW PDC is a statutory dataset with information for all births in NSW of at least 20 weeks’ gestation or in which the birthweight was at least 400 g. It contains demographic, medical and obstetric information, as well as details about labour, birth and infant condition. Longitudinal linkage of the hospital records and birth records was undertaken by the Centre for Health Record Linkage, enabling admissions, re-admissions, serious adverse outcomes and birth outcomes for individual women to be analysed. The linkage rate between hospital and birth data for mothers has previously been reported as 98.1%.16 De-identified records were provided to the investigators.

Vulvoplasty was identified by ACHI procedure code 35533-00 in the hospital data. The principal diagnosis at the time of each vulvoplasty was identified by ICD-10-AM diagnostic codes.

Factors potentially associated with vulvoplasty and available in hospital records for analysis included age, marital status, smoking history, country of birth and socio-economic status (residential postcode was used to classify each woman according to the Socio-Economic Indexes for Areas [SEIFA] Index of Relative Socio-Economic Disadvantage17). Data on cosmetic breast augmentation (for women without prior mastectomy or breast cancer), liposuction, and face or brow lifting were also included in the analysis if the procedures had been undertaken during the study period.

Information about the vulvoplasty procedure and health service factors included hospital location, whether the woman had received public or private care, how many nights she had spent in hospital, the use of general anaesthesia, and whether she had been re-admitted to hospital within 14 days of the vulvoplasty surgery. Serious adverse events and complications ascertained from hospital records included haemorrhage, infection, and adverse urinary tract events, all of which have previously been reported in smaller, non-population studies.7 Information ascertained from the birth data included birth mode (non-instrumental vaginal, forceps, vacuum, and intrapartum or pre-labour caesarean delivery), episiotomy, and degree of perineal trauma.

The total number of vulvoplasties and the change in number over time were calculated for public and private hospitals, with the overall annual change estimated by Poisson regression. The characteristics of women with a first record of a vulvoplasty were described, and compared with 2011 NSW reference populations of all women aged 15–54 years (N = 1 982 710), including Australian census data for age and marital status18 and Australian migration data for country of birth.19 Data from the NSW Population Health Survey for women aged 15–54 years (N = 3258) were used as reference population data for smoking status.20 Rates of other cosmetic procedures were determined for all women of reproductive age who had no record of vulvoplasty and had been admitted to hospital for any other reason during the study period (N = 2 053 760), and compared with those for women who had undergone vulvoplasty. The characteristics of the vulvoplasty procedures and associated health service factors are described.

Women with a primiparous birth after a vulvoplasty were identified, and their birth characteristics compared with primiparous women without prior vulvoplasty by χ2 analysis. Primiparous women were chosen for this analysis to minimise any obstetric history effect on birth outcomes.

Ethics approval

Ethics approval for the study was obtained from the NSW Population Health and Health Services Research Ethics Committee (reference, 2012-12-430).

Results

During 2001–2013, 4592 vulvoplasty procedures were performed on 4381 women in NSW hospitals and day-stay centres; 1198 were performed in public hospitals, 3394 in private hospitals. The number performed in public hospitals peaked in 2006 (122 procedures), while the number performed in private hospitals was still rising in 2013 (345 procedures) (Box 1). Of the 4381 women, 4193 (95.7%) had had only one vulvoplasty, 170 (3.9%) a total of two vulvoplasties, and 18 (0.4%) three or more. The total number of procedures rose from 256 in 2001 to 421 in 2013, a total increase of 64.5% and an annual increase of 3.3% (95% CI, 2.5–4.2%).

The two most frequent principal diagnoses linked with vulvoplasty were “hypertrophy of vulva” (26.1% of procedures in private hospitals, 23.1% in public hospitals) and “non-inflammatory disorders of vulva or perineum” (19.7% in private hospitals, 21.2% in public hospitals). “Plastic surgery for unacceptable cosmetic appearance” was the third most frequently cited indication in private hospitals (8.1%), and 23rd for procedures in public hospitals (0.7%).

Compared with the general population of NSW women aged 15–54 years, more women undergoing a first vulvoplasty were born in Australia (74.6% v 67.6%) and were 25–34 years of age (32.6% v 25.2%); fewer were married or in de facto relationships (42.5% v 55.4%) or aged 45–54 years (16.3% v 25.5%). A higher proportion lived in areas of higher socio-economic status, and six times as many had other cosmetic procedures performed during the study period (Box 2).

Most vulvoplasty procedures were performed in private hospitals in Sydney (59.4%); 13.9% were performed in public hospitals in Sydney, 14.5% in private hospitals outside Sydney, and 12.2% in public hospitals outside Sydney (Box 3). Most women (68.9%) had a day-only admission. Of the 679 women (14.8%) who were in hospital for two nights or more, 365 (53.7%) had gynaecological surgery other than vulvoplasty recorded as the principal procedure, including repair of uterine prolapse, pelvic floor or enterocoele (156 women), and vaginal hysterectomy (101 women).

Serious adverse events at the time of the vulvoplasty admission or during re-admission within 2 weeks of the initial admission were associated with 332 procedures (7.2%). For vulvoplasties with concomitant gynaecological surgery, the serious adverse event rate was 12.7%; for other vulvoplasties it was 5.0%. The most common events were urinary tract problems and complications (54.5% of complications; Box 3). One hundred and twenty-one women (2.6%) were re-admitted to hospital within 2 weeks of the procedure, with haemorrhage or haematoma complicating a procedure (30 women) and a variety of diagnoses related to wound complications or infection (29 women) being the most frequent principal diagnoses. A total of 4.3% of women had repeat vulvoplasties, with seven having a repeat procedure within 2 weeks of the first.

Of all vulvoplasty procedures, 3157 (68.7%) were for women who had not previously given birth in NSW. Women with one prior birth accounted for 694 of all vulvoplasties (15.1%), women with two prior births for 494 (10.8%), and women with three prior births for 247 procedures (5.4%).

Two hundred and fifty-seven women with a history of vulvoplasty subsequently gave birth for the first time during 2001–2012. The proportion of these women who had a caesarean delivery (40.0%) was significantly greater than for the 454 027 primiparous women with no history of vulvoplasty (30.3%; χ2 test, P < 0.001). This difference was evident for births in both private hospitals (56% v 39.7%; χ2 test, P = 0.004) and public hospitals (33% v 27.0%; χ2 test, P = 0.04). A higher proportion of women with prior vulvoplasty had a pre-labour caesarean delivery than other women (20% v 11.0%), while the rates of intrapartum caesarean delivery were similar (20% v 19.3%). For vaginal births, there were no significant differences in the episiotomy rates or in perineal trauma for primiparous women with and without previous vulvoplasty (Box 4).

Discussion

The annual number of vulvoplasties performed in NSW hospitals on women aged 15–54 years increased by 64.5% between 2001 and 2013. However, the majority of Australian providers who advertise vulvoplasty surgery services indicate that these procedures are performed on an outpatient basis under local anaesthetic.1 During the same period, Medicare rebate data for NSW (which also captured clinically indicated, out-of-hospital procedures) indicated a 142% increase in the number of procedures, suggesting marked increases in the numbers of vulvoplasty procedures both in and out of hospital.21 Following changes to the MBS in 2014, restrictions of the eligibility for Medicare rebates for these procedures were tightened. The number of vulvoplasties recorded by Medicare subsequently declined, with 240 rebates paid in NSW in 2015, compared with 448 in 2013.4 Data have never been available for cosmetic out-of-hospital procedures (ie, those that are not clinically indicated), so that the total number of vulvoplasty procedures performed cannot be determined.

It is unlikely that a rise in the incidence of vulval pathology is driving the increase in surgery, and we cannot determine whether any vulvoplasties undertaken in NSW hospitals were for reversal of female genital mutilation. Dissatisfaction with physical aspects (such as chafing and discomfort), the appearance of their genitalia or with sexual activity, and feeling abnormal are reported as motives for women requesting surgery.13,22 However, there is a great deal of variability in normal vulval anatomy; in view of concerns that providers of surgery may exploit vulnerable women, there is a growing call from professional bodies to improve education and counselling.23,24 Our study found that six times as many women who have had a vulvoplasty have had other cosmetic procedures as have other women, which suggests that they have a lower tolerance for perceived physical imperfections. A similar difference was reported by a small UK study, in which 10 of 55 women who had undergone vulvoplasty were also diagnosed with body dysmorphic disorder (compared with none of the control group of 70 women).22 The authors recommended further studies for exploring this relationship, and others have called for more psychological screening of women who request vulvoplasty.23,25

The quality of evidence in studies of women’s satisfaction after vulvoplasty has been criticised in terms of the follow-up and the measures employed.9 Most studies have been undertaken by the surgeons who performed vulvoplasties, reporting data based on questionnaires sent to their own patients.9,13 Impaired sexual function caused by scarring and nerve damage has been mentioned as a potential problem after genital surgery.9,23 Satisfaction and long term outcomes warrant further investigation, especially as the number of women having the procedure outside hospitals is unknown.

In our study, one in 14 procedures was associated with a serious short term adverse event or complication within 2 weeks of surgery. Urinary tract problems were the most common, but these are rarely mentioned in the literature; wound dehiscence has instead been reported as the most frequent short term adverse event.1 The serious complication rate in our study (7.2%) was slightly higher than reported by small, surgeon-led studies (2.7–6.0%).7 However, other studies have also included longer term complications (eg, dyspareunia and delayed local pain) that would not be recorded in the population data upon which we based our study. By analysing hospital data, we could only detect complications or adverse events sufficiently serious to warrant a diagnosis or hospital admission, so we may have underestimated the overall complication rate. Women who experienced more pain than they anticipated, were unhappy with the aesthetic results of the procedure, or felt dissatisfied in other ways would not be definitively captured. About one in 23 women had a repeat procedure, perhaps reflecting wound healing problems after being discharged from hospital, or longer term dissatisfaction with the results of the procedure.

The relationship between vulvoplasty and subsequent birth outcomes has not previously been explored. For vaginal births, perineal outcomes were similar for women with and without vulvoplasty, so that women who have had a vulvoplasty can be reassured about their prospects for a vaginal birth. However, the caesarean delivery rate was 30% higher for women who had had vulvoplasty; the increase was predominantly in pre-labour caesarean deliveries, suggesting a higher rate of planned birth interventions. Vulvoplasty may have influenced decisions about birth plans; surgeons or the women themselves may have been worried that a vaginal birth might disturb the results achieved by vulvoplasty.

As routine data about procedures performed outside hospitals are not available, the overall frequency of vulvoplasty in NSW could not be determined, and women who had vulvoplasties performed outside NSW (including overseas) were not captured by our study. Nevertheless, our investigation was the first population-based study of vulvoplasty. It thereby avoided sampling bias, and analysed routinely collected data to provide a snapshot of the current situation in NSW hospitals. Further, it provides information about serious complications that can be useful for pre-surgery counselling of women considering the procedure.

Box 1 –
Numbers of vulvoplasties performed in New South Wales private and public hospitals, 2001–2013

Box 2 –
Characteristics of 4381 women at their first record of vulvoplasty in New South Wales hospitals, 2001–2013, compared with a reference population of NSW women1720

Women undergoing first vulvoplasty

Reference population of NSW women


Country of birth

Australia

3269 (74.6%)

67.6%

Elsewhere/unknown

1112 (25.4%)

32.4%

Previous cosmetic procedures

Any cosmetic procedure, including:

444 (10.1%)

1.7%

Breast augmentation

236 (5.4%)

0.9%

Liposuction

230 (5.3%)

0.8%

Face/brow lift

44 (1.0%)

0.2%

Age

15–24 years

1109 (25.3%)

23.1%

25–34 years

1427 (32.6%)

25.2%

35–44 years

1132 (25.8%)

26.3%

45–54 years

713 (16.3%)

25.5%

Marital status

Never married

1884 (43.0%)

33.1%

Married/de facto

1861 (42.5%)

55.4%

Widowed/divorced/separated

439 (10.0%)

11.6%

Unknown

197 (4.5%)

Smoking status

Smoker

691 (15.8%)

14.2%

Socio-economic status (SEIFA score quintile)

1 (most disadvantaged)

643 (14.7%)

20.0%

2

633 (14.5%)

20.0%

3

779 (17.8%)

20.0%

4

800 (18.3%)

20.0%

5 (least disadvantaged)

1363 (31.1%)

20.0%

Unknown (residence outside NSW)

163 (3.4%)


SEIFA = Socio-Economic Indexes for Areas. * Based on postcode of residence at time of the procedure.

Box 3 –
Characteristics of vulvoplasty procedures performed in New South Wales hospitals, 2001–2013

Vulvoplasty procedures, 2001–2013


Total number of procedures

4592

Hospital

Public: Sydney

638 (13.9%)

Private: Sydney

2729 (59.4%)

Public: outside Sydney

560 (12.2%)

Private: outside Sydney

665 (14.5%)

Hospital stay

Day only

3165 (68.9%)

1 night

748 (16.3%)

2 nights

299 (6.5%)

> 2 nights

380 (8.3%)

General anaesthesia

4363 (95.0%)

Any serious adverse event*

332 (7.2%)

Haemorrhage

82 (1.8%)

Infection

14 (0.3%)

Urinary tract

181 (3.9%)

Other

73 (1.6%)

Re-admission within 2 weeks of procedure

121 (2.6%)


* Serious adverse event occurring during procedure admission or re-admission within 2 weeks (some women had more than one serious adverse event). † Includes disruption of operation wound and other complications.

Box 4 –
Birth outcomes for primiparous women in New South Wales, 2001–2012, according to vulvoplasty history

Women with previous vulvoplasty


Women without previous vulvoplasty


P*

Number

Percentage (95% CI)

Number

Percentage (95% CI)


Number of women

257

454 027

Hospital

0.33

Public

182

70.8% (65.0–76.0)

333 618

73.5% (73.3–73.6)

Private

75

29.2% (24.0–35.0)

120 409

26.5% (26.4–26.7)

Birth mode

< 0.001

Non-instrumental vaginal

118

45.9% (39.9–52.0)

225 042

49.6% (49.4–49.7)

Forceps

10

3.9% (2.1–7.0)

33 008

7.3% (7.2–7.3)

Vacuum

26

10.1% (7.0–14.4)

57 971

12.8% (12.7–12.9)

Intrapartum caesarean delivery

52

20.2% (15.8–25.6)

87 650

19.3% (19.2–19.4)

Pre-labour caesarean delivery

51

19.8% (15.4–25.1)

50 134

11.0% (10.9–11.1)

Missing data

0

0

222

< 0.05%

Episiotomy (vaginal births)

0.20

Yes

37

24.0% (18.0–31.4)

90 550

28.7% (28.5–28.8)

No

117

76.0% (69.6–82.0)

225 471

71.3% (71.2–71.5)

Perineal spontaneous tearing (vaginal births)

0.87

Intact/first degree tear

66

42.9% (35.3–50.8)

118 028

37.3% (37.2–37.5)

Second degree tear

46

29.9% (23.2–37.5)

90 690

28.7% (28.5–28.9)

Third/fourth degree tear

5

3.2% (1.4–7.4)

12 681

4.0% (3.9–4.1)

Other

30

19.5% (14.7–27.6)

58 042

18.4% (18.2–18.5)


* χ2 test. † Numbers do not sum to 100% as episiotomy and perineal tearing categories were not mutually exclusive until 2007.

Maternal mortality trends in Australia

Maternal death is low and decreasing in Australia, but continuing surveillance is important

The death of a mother or a baby has significant short and long term impacts for the surviving family members and for the community and health workers who cared for them. The World Health Organization estimates that 303 000 women died in pregnancy and childbirth in 2015, with 99% of these deaths occurring in low income countries.1

In Australia, a series of reports regarding maternal deaths has been published over the past five decades; the first in the series covered the 1964–1966 triennium.2 These reports examine the deaths that occurred during pregnancy or within 42 days of the end of pregnancy. They are compilations of data sourced from multidisciplinary state maternal mortality review committees that undertake detailed reviews of each case.

The incidence of maternal death is expressed as a maternal mortality ratio (MMR). The MMR is the number of deaths due to complications of the pregnancy (direct deaths) or aggravation of existing disease processes by the pregnancy (indirect deaths) per 100 000 women giving birth. The calculation does not include deaths from unrelated causes that occur in pregnancy or the puerperium (incidental deaths) and deaths that occur more than 42 days after the end of a pregnancy.

The MMR in Australia is low; it has decreased from 41.2 in the 1964–1966 period to 7.1 in the years 2008–2012.3 The comparable figures are 14.7 for the period 2010–2012 in New Zealand4 and 9.0 for the period 2011–2013 in the United Kingdom.5

Until now, publications in the Maternal deaths in Australia series have been irregular. The Australian Institute of Health and Welfare (AIHW) established the National Maternity Data Development Project (NMDDP) in response to the recommendations in the 2008 Maternity Services Review from the Commonwealth and the subsequent 2010–2015 National Maternity Services Plan.6 A recent report regarding the progress of the NMDDP notes that sustainable data collection on national maternal mortality will be established to facilitate “consistent and regular national reporting” of maternal mortality in the future.6

The genesis of the almost sixfold reduction in maternal death rates in Australia is multifactorial, including the improved general health of the population and the availability of better health care options, such as the availability of antibiotics, blood transfusion, safer anaesthesia and effective diagnostic ultrasound. Advanced maternal age, maternal obesity and caesarean deliveries3,5 are all associated with an increase in the risk of maternal death, and any future growth in their incidence will threaten the efforts to further reduce the maternal mortality rate.

In the list of most common causes of death, infection, abortion and pre-eclampsia have been replaced by maternal cardiovascular disease and psychosocial health problems, while obstetric haemorrhage and thromboembolism remain prominent. The current method of classifying maternal deaths into direct, indirect and incidental deaths was first used in the report on the 1973–1975 triennium.7 Between that first 1973–1975 report and the most recent one for 2008–2012, 944 direct and indirect maternal deaths have been reported in Australia. Over that 48-year period, cardiovascular disease (MMR, 1.5), sepsis (MMR, 1.3) and obstetric haemorrhage (MMR, 1.1) have been the most prominent causes of death.

Aboriginal and Torres Strait Islander women are twice as likely to die in association with pregnancy and childbirth as other Australian women. In 2008–2012, the Aboriginal and Torres Strait Islander MMR was 13.8 compared with 6.6 for non-Indigenous Australian women who gave birth.3 The differential between the MMRs is decreasing and caution should be exercised in drawing conclusions due to the small numbers analysed. The leading causes of maternal deaths among Aboriginal and Torres Strait Islander women were cardiovascular conditions, sepsis and psychosocial conditions.

Women aged 35 years or over were more than twice as likely as their younger counterparts to die in association with pregnancy and childbirth, and those aged 40 years or more were over three times more likely to die in association with pregnancy and childbirth.3

Of the six most prominent causes of maternal death between 1973 and 2012, psychosocial death is the only group where the MMR is rising; the incidence of maternal death due to cardiovascular disease, obstetric haemorrhage, thromboembolism, hypertensive disorders and sepsis are all decreasing. Most of the deaths classified as psychosocial deaths are due to suicide, although some are related to fatal complications of substance misuse and homicide in domestic situations. While some of that apparent rise may be due to changes in the ascertainment of maternal deaths in general and to problems reporting both maternal suicide and deaths due to substance misuse in particular, it is clear that more needs to be done in this sphere. There is a growing belief that a significant portion of late maternal deaths are related to suicide; however, without a clear review of the cases by multidisciplinary committees, the relationship between pregnancy and suicide more than 42 days after the end of pregnancy remains speculative.

It is not clear whether the incidence of suicide in association with pregnancy is more or less common than in comparable non-pregnant women. This comparison is fraught, as the true denominator for pregnancy is not known due to lack of information regarding pregnancies lost as a result of miscarriage and termination. Given that caveat, the overall suicide rate in the 15- to 45-year-old Australian female population in 2006–2010 was 6.0 per 100 000 women,8 while the maternal mortality rate due to psychosocial issues in the same period was 0.9 per 100 000 women giving birth. A similar finding has recently been noted in the United States.9 Nevertheless, the apparently increasing incidence of psychosocial maternal death is a matter of concern, given that pregnant women are among the most medically supervised members of the population.

Screening during pregnancy for mental health, substance misuse and domestic violence problems is recommended,10 but it is not universally undertaken. All maternity care providers should commit to making these items a standard part of their care delivery. The follow-up of identified concerns by the relevant specialist services must be a priority and should continue for a significant period after the end of pregnancy. Similar screening attention is needed for women who had miscarriages and pregnancy terminations.

In many cases, an autopsy is necessary to understand the true cause of a maternal death. A number of causes of maternal death, such as amniotic fluid embolism and pulmonary thromboembolism, may be easily confused clinically. In the case of amniotic fluid embolism, for example, the diagnosis can only be confirmed by autopsy. The question of an autopsy should be pursued with the family by a senior clinician, and the presumption of a diagnosis that has been made in an intensive care unit or similar setting should not be an excuse to not request this critical form of investigation.

Maternal death is one of the few defined core sentinel events in health care; however, it is disturbing to find that a significant portion of these deaths have not been subjected to a root cause analysis or similar review. The application of a systematic review to identify gaps in hospital systems and health care processes, which are not immediately apparent and may have contributed to the occurrence of an event, should be applied to all maternal deaths, whether occurring in the public or private health systems.

The question of the presence or absence of contributory factors is now being actively pursued by some state and territory maternal mortality review committees, and similar questions are also being raised internationally. A consolidation of such information is yet to be published in an Australia-wide context. Experience with such review in New Zealand11 has shown that more than 50% of maternal deaths were associated with contributory factors, and 35% of the deaths were potentially avoidable.

The Victorian Consultative Council on Obstetric and Paediatric Mortality and Morbidity model12 appears to be of value, and examines two questions:

  • Were suboptimal care factors identified?

  • What was the relevance of any suboptimal care factors identified?

Suboptimal care factors may be classified as factors related to the woman, her family and social situation, factors related to access to care and factors related to professional care. Moreover, these factors may be classified as identified but unlikely to have contributed to the outcome (insignificant), identified and might have contributed to the outcome (possible), or identified and likely to have contributed to the outcome (significant).

It is critical to maintain a continuing intensive surveillance of maternal death — with particular reference to recognised risk factors — and to examine the contributory factors. Health departments must require that all direct and indirect maternal deaths are subjected to a systematic review. At present, data on late maternal deaths — occurring more than 42 days after the end of pregnancy — are not collected in all states and territories and are not reported nationally. Reviews of late maternal deaths and of severe maternal morbidity are future necessities, but the resources and methodologies are not yet available at a national level.

The economic benefits of eliminating Indigenous health inequality in the Northern Territory

The known Although there are estimates of Indigenous health expenditure, little information is available regarding the total economic burden of Indigenous health inequality. 

The new Indigenous health inequality is a substantial economic deadweight, costing the Northern Territory an estimated $16.7 billion between 2009 and 2013 (43% from lost life-years, 35% from lost productivity, 22% from higher direct health costs), equivalent to 19% of the NT gross state product. 

The implications Closing the Indigenous gap will have far-reaching potential benefits for the economic future of the NT. 

The Northern Territory covers one-sixth of the Australian landmass, but includes only 1% of its population. Aboriginal and Torres Strait Islander (Indigenous) people constitute about 27% of the NT population (compared with 2.5% nationally) (Box 1).1 Compared with the rest of the population, Indigenous Australians have disproportionate levels of social isolation, poverty, unemployment, lack of education, and inadequate access to health care.2 They also suffer poorer health; for Indigenous people in the NT born between 2010 and 2012, life expectancy at birth was 63 (men) and 69 years (women),3 17 and 14 years less than for non-Indigenous Territorians.

There is consensus that closing the health gap between Indigenous and non-Indigenous Australians requires concerted efforts by all sections of society. In 2009, Australian governments announced a vision for eliminating this gap within a generation: that is, by 2031 (“Closing the Gap”).4 The main focus was on broad consultations with Indigenous people about a range of measures, including health, childcare, schooling and economic participation.4

In this regard, two important questions were asked but remained largely unexplored:

  • How much does the Indigenous health gap cost society?

  • What are the potential economic benefits if the gap were to be eliminated?

The purpose of our study was to provide basic information on the potential economic benefits of reducing the Indigenous health gap, by quantifying the magnitude of the economic burden associated with Indigenous health inequality in the NT on the basis of standard cost-of-illness methodology and using the most recent data.57

Methods

Life expectancy was calculated using population and death data for 2009–2013. Indigenous and non-Indigenous resident population and death registration data were gathered from the Australian Bureau of Statistics and the Australian Coordinating Registry.8 The cost-of-illness approach was adopted for estimating the costs associated with the Indigenous health gap from a societal perspective; that is, all costs were included, regardless of who paid or received the payment: individuals, health care providers, Indigenous and non-Indigenous populations, or a government.7 This approach casts light on the overall magnitude and distribution of the economic costs of illness. All values were expressed in 2011 Australian dollars to account for inflation.

The total monetary value of the Indigenous health gap was estimated by calculating cost differences between the Indigenous and non-Indigenous populations in three categories: direct health costs (hospital, primary care, and other health services, including public health);9 indirect costs associated with lost productivity (missed income, welfare payments, and missed tax revenue, assuming equal opportunity for employment for Indigenous and non-Indigenous people);7 and intangible costs associated with premature deaths (based on years of life lost, YLL).7

Direct health costs were derived from data on overall health expenditure for Australia and expenditure for Indigenous people specifically;9,10 expenditure for non-Indigenous people was calculated by subtracting Indigenous expenditure from total expenditure. The cost differential (excess cost) for Indigenous health care was estimated by calculating the difference between actual expenditure on Indigenous health care and the estimated expenditure if the per capita costs were the same as for non-Indigenous NT residents.

A workforce supply and demand framework was used to assess the indirect costs caused by lost productivity, based on census data and other sources for employment, taxation and welfare payment data (Box 2).1,7,11 Indirect costs (productivity loss) encompassed excess welfare payments by governments, missed tax revenue, and lost efficiencies for the economy related to inadequate human capital development and human resources utilisation. The estimation of indirect costs is described in the Appendix.

The intangible costs attributable to the higher burden of disease were estimated by multiplying the excess YLLs by the value of a statistical life-year (VSLY).12 The YLLs were calculated using NT death data linked with the age-specific life expectancies from the Australian Burden of Disease (BOD) study.13 Following the BOD methodology, YLLs were not discounted for future years, and were costed at $120 000 per life-year, based on the review by Access Economics.12 Sensitivity analysis was undertaken with VSLY assumed to be $50 000, $100 000 or $140 000 per YLL. General inflation rates were applied to pricing the VSLY between 2009 and 2013.

Ethics approval

This study was endorsed by the Human Research Ethics Committee of the NT Department of Health and the Menzies School of Health Research (reference, HREC-2015-2400).

Results

Between 1 January 2009 and 31 December 2013, 9867 deaths of NT residents were registered; 62% were males, and 47% were Indigenous Australians (mean age at death, 51 years v 67 years for non-Indigenous deaths). Life expectancy at birth for Indigenous men and women was 64 and 69 years respectively, each 15 years lower than for non-Indigenous residents (79 and 84 years respectively).

Over the 5-year study period, direct health costs totalled $9.3 billion (2011 dollars), of which 58% were incurred by Indigenous patients (Box 3), more than double their proportion of the NT population. Per capita expenditure for Indigenous patients was 3.2 times that for non-Indigenous patients (based on total 5-year estimated resident population numbers: Indigenous, 345 968; non-Indigenous, 819 551). This ratio was slightly higher for hospital (3.5) than for primary care and other services (each 3.1). The total excess direct health costs were estimated at $3.7 billion during the 5 years, equivalent to about 40% of total expenditure (Box 3).

The indirect costs arising from lost productivity were estimated by matching the Indigenous supply–demand balance (equilibrium) with that of the non-Indigenous workforce (Box 2). The excess costs associated with lost productivity attributable to the Indigenous health gap were estimated to be $1.17 billion in 2011, of which $359 million (31%) were excess welfare payments, $293 million (25%) foregone tax revenue, and $515 million (44%) lost efficiencies (Appendix). The total costs of lost productivity attributed to Indigenous health inequality totalled $5.8 billion during 2009–2013 (Box 4). Wage responsiveness (elasticity) of demand was 1.8, and responsiveness of supply of the Indigenous workforce was 1.5, indicating that the demand and supply for the Indigenous workforce were respectively 80% and 50% higher than those for the non-Indigenous workforce (each 1.0 for demand and supply; Box 2). Based on Box 2, about 20 000 extra jobs at the average wage level would be required to close the gap, equivalent to a 14% expansion of the NT economy.

The intangible cost (burden of disease) estimates were based on excess YLLs. Over the 5-year period, there were 153 458 YLLs in the NT, 87 439 of which (57%) were attributable to Indigenous people, a rate that was 3.1 times that for the non-Indigenous population. The excess 59 571 Indigenous YLLs was equivalent to a total cost of $7.2 billion between 2009 and 2013 (Box 4). Intangible costs comprised the largest category of excess costs in the NT (43%), substantially higher than either direct health costs (22%) or indirect costs caused by lost productivity (35%) (Box 4).

The total costs resulting from Indigenous health inequality in the NT during 2009–2013 were estimated to be about $16.7 billion, equivalent to nearly one-fifth of the NT gross state product (GSP) for this period (Box 4).14 This result suggests that eliminating the Indigenous health gap could potentially save $745 million each year in direct health costs alone. In the medium and long term, closing the gap would save $13 billion in indirect and intangible costs over 5 years; savings in direct health costs would be less than one-quarter of the total long term financial benefit of closing the gap.

The results of our sensitivity analysis are included in the Appendix.

Discussion

We present evidence that Indigenous health inequality in the NT is both substantial and costly. The total costs attributable to Indigenous health inequality between 2009 and 2013 amounted to $16.7 billion, equivalent to 19% of GSP, a measure of the size of the NT economy. As a comparison, the costs of health inequalities for African, Asian and Hispanic Americans in the United States were estimated to be US$1.24 trillion during 2003–2006, corresponding to 2.4% of the American gross domestic product (GDP).5 The life expectancy gap between black and white Americans was only 4 years in 2010,15 as opposed to the 15 years between the Indigenous and non-Indigenous populations in the NT. A European Union study showed that the cost associated with socio-economic health inequalities was equivalent to 9.4% of GDP.6 Using the general equilibrium what-if analysis, an earlier Deloitte Access Economics study reported that the Indigenous employment gap imposed a cost of close to 10% of GSP in the NT.2 Our study found that 40% of direct health costs in the NT were associated with Indigenous health inequality, higher than the corresponding figures in the US (30%) and EU studies (20%).5,6

Our findings suggest that there would be enormous financial benefits for the NT in the longer term should closing the gap become a reality. The evidence we have presented implies that the total potential long term benefits would be $3.3 billion annually in real terms, and a boost of nearly 20% of GSP in relative terms (Box 4), double the projection by the Deloitte study (9% over 20 years).2 A possible explanation for this difference may be the different focuses of the studies: the Deloitte analysis concentrated on employment, whereas we assessed much broader benefits from a societal perspective. Closing the gap is feasible: between 1994 and 2008, Indigenous employment in Australia increased by 55–70%.16

There are many contributors to health inequality in the NT. Poverty is a cause and consequence of ill health, and the Indigenous population is particularly vulnerable to poverty, especially in remote areas. For example, the NT market basket survey of food and drink prices found that in 2014 they were 54% higher in remote than in urban areas.17 After adjusting for these higher prices, the real income of the average Indigenous person living in a remote community was only 29% of the overall NT average. Thirty per cent of NT Indigenous people are located 50 kilometres or more from a primary school and 100 kilometres or more from a health clinic. Remote areas lack economies of scale; 87% of NT Indigenous communities have populations of less than 100 people. Strategies for redressing health disparities should consider how the impact of remoteness might be ameliorated. Solutions may include ensuring access to essential government services for people residing in remote areas, and facilitating resettlement for those who wish to move to larger population centres.18 Overcoming the effects of remoteness, improving public housing, and raising living standards are necessary prerequisites for closing the gap,19 and will also allow economies of scale and a larger population base, which mean that education and health services can be provided more efficiently. This, in turn, will facilitate better access to labour markets for Indigenous people.

Economic growth in Indigenous communities is fundamental to improving Indigenous health and saving Indigenous human resources in the longer term.11 Closing the Indigenous health gap must therefore be seen more broadly as being dependent on closing gaps in both education and employment. We found that the income responsiveness of demand and supply (elasticity) for the Indigenous workforce was much greater than for the non-Indigenous population (80% and 50% higher respectively). This remarkable finding is consistent with other studies which have found that the response to improving education and employment opportunities is greater for remote Indigenous than for non-remote non-Indigenous populations.20 That poor Indigenous health can be improved by reducing poverty is a testable hypothesis, as it focuses on tackling the root cause of ill health, and contributes to economic growth and prosperity.

Several technical health economic innovations were explored in our analysis. We adopted the cost-of-illness approach for assessing health inequality, a technique successfully applied in a recent US study.5 We incorporated BOD data into our analysis; this is the first study to use such data to estimate the costs of health inequality. We developed a supply and demand model of the NT workforce, using empirical data to determine the indirect costs of lost productivity attributable to the Indigenous health gap.

There were several potential limitations to our study. First, we acknowledge that our cost estimates of health inequality may not be precise. The indirect and intangible cost estimates were based on economic modelling and a pre-specified VSLY; however, it is likely that the assumed VSLY was conservative.12 Second, we made no allowance for a definite timeframe for closing the gap, primarily because this depends on the implementation of the Closing the Gap policy. Third, our costings may be incomplete, as we did not include transport, capital, informal care and crime-related costs. Finally, there was no in depth discussion of possible solutions for health-related inequality. Genetic factors play only a limited role in Indigenous health inequality21 when compared with more important and interconnected political and socio-economic factors, such as lower living standards, income and employment, lack of access to education2,21 and primary health care,22 and social isolation.18

Notwithstanding these limitations, our study indicates that, should the aspirations of the Closing the Gap initiative be realised, savings will be far greater in terms of improved productivity and saved human life-years than in direct health care service costs. The complete benefits of closing the gap will flow from economic development.

Our study shows that Indigenous health inequality is a costly economic deadweight in terms of lost life-years, lost productivity, and higher expenditure on health and social security. Our analysis provides a strong economic case for making investments to close the Indigenous health gap. The cost estimates highlight the enormous opportunity costs caused by this gap, and the potential cost savings to be made by closing it, not to mention the non-pecuniary benefits of a more just society.

Box 1 –
Baseline demographic and socio-economic data for Indigenous and non-Indigenous people in the Northern Territory, 2011*

Indigenous residents

Non-Indigenous residents


Population

56 778 (26.8%)

155 165 (73.2%)

Completed year 12

9%

42%

Employed

22%

62%

Weekly personal income, mean

$398

$991

Residing in remote area

63%

6%


* Source: Australian Bureau of Statistics 2011 Census.1

Box 2 –
Estimated supply and demand curves in the Indigenous and non-Indigenous labour markets, Northern Territory, 2011


Data sources: Australian Bureau of Statistics 2011 Census, Basic Community Profile and Indigenous Profile, Northern Territory.1 At the minimum wage, approximately 85% of the Indigenous working-age population (point A) would be willing to supply labour, compared with a demand for Indigenous labour at this level of only 22% (point B).

Box 3 –
Direct health costs for Indigenous and non-Indigenous people in the Northern Territory, 2009–2013, by area of expenditure ($ million, 2011)

Year

Total expenditure

Indigenous


Non-Indigenous


Excess cost*


Hospital

Primary care

Other

Hospital

Primary care

Other

Hospital

Primary care

Other

Total


2009

1580

340

427

147

231

323

111

241

289

100

630 (39.8%)

2010

1696

365

454

162

248

344

122

260

309

110

679 (40.0%)

2011

1967

411

514

212

280

389

160

293

349

144

786 (40.0%)

2012

2084

439

528

238

299

399

180

313

360

162

835 (40.1%)

2013

1966

455

483

201

310

365

152

327

331

138

796 (40.5%)

2009–2013

9293

2011

2406

961

1369

1820

727

1433

1638

654

3725 (40.1%)


Sources: References and . * Difference between actual Indigenous expenditure and estimated expenditure were the per capita costs the same as for non-Indigenous NT residents. † Proportion of total expenditure in parentheses.

Box 4 –
Cost estimates of Indigenous health inequality in the Northern Territory, 2009–2013 ($ million, 2011)

Direct health costs

Indirect costs

Intangible costs

Total excess costs

GSP

Total excess costs as proportion of GSP


2009

630

1100

1218

2947

15 887

18.6%

2010

679

1133

1260

3071

16 456

18.7%

2011

786

1167

1332

3284

16 870

19.5%

2012

835

1202

1936

3973

18 131

21.9%

2013

796

1238

1429

3463

19 463

17.8%

2009–2013

3725 (22.2%*)

5838 (34.9%*)

7175 (42.9%*)

16 739

86 806

19.3%


GSP = Gross state product. * Proportion of total excess costs.

When an elder is the abuser

Improving the recognition and management of domestic violence among elderly couples

Separate paradigms and services for elder abuse and domestic violence raise the concern that intimate partner violence in older couples is under-recognised (Box). These paradigms are associated with age-specific characteristics, with very different implications for management when compared with younger age groups. In addition, there is also a higher risk of death in older domestic violence victims compared with younger people and in incidents involving strangers.1

The neglect in this area can be attributed to two main reasons. First, our understanding of elder abuse does not easily accommodate a focus on physical violence perpetrated by elderly people against an intimate partner. The paradigm of elder abuse views the elder as vulnerable and frail, characteristics that are perceived to be intrinsic to advanced age. In most cases of elder abuse, the elder is prey to a younger aggressor — 60% of perpetrators are children and less than 10% are a spouse or partner.3 Neglect, psychological and financial abuse are more common and, therefore, tend to be emphasised over physical abuse by elder abuse information sites.4

Second, domestic violence guidelines have not highlighted the specific needs of older people. In contrast, there has been a focus on the additional challenges in accessing services faced by people who are Indigenous, from a culturally and linguistically diverse background, or experiencing a disability.2

Domestic violence perpetrated by an older person requires clinicians and families to consider a different narrative to that predominant in elder abuse, one where the elder is the aggressor and may have been so for decades. Indeed, Australian data have indicated that 14% of homicides involving victims aged 70 years or over, so-called eldercide, were committed by an intimate partner.5 We also believe it is important to recognise that over 40% of older victims of domestic violence-related assaults are men and that such violence can be perpetrated by women or be bidirectional.6

Probable under-reporting and under-detection

The true frequency of domestic violence perpetrated by older people is unknown, as research essentially excludes older age groups. For instance, the Australian Bureau of Statistics Personal Safety Survey7 grouped all older people who had experienced violence into one group aged 55 years and over, yet entry to aged care services starts at 65 years of age.

Data from the Personal Safety Survey showed that 0.4% of older women aged 55 years and over reported partner violence involving physical assault or threat, and sexual assault or threat. Yet, the rate of reporting of domestic assaults to New South Wales police between 2001 and 2010 was lowest in those aged 50 years and over, with only 28% of victims reporting the incident to police.8

Under-reporting may be even higher in women in their seventh and subsequent decades of life. This cohort of older women came of age at a time when attitudes to gender were vastly different, violence within a marriage did not carry the social opprobrium or the potential for criminal charges that it does now, and there were few resources available to support a woman who wished to leave a marriage. Factors specific to under-reporting by older women include being a grandmother and ageing, which seem to accentuate the reluctance to fracture family relations.9

Professionals face additional barriers to enquiry of domestic violence in older people. There may be a lower imperative to enquire about domestic violence owing to assumptions that an older partner lacks the ability to cause physical harm and because of the absence of dependent children at home. The physical signs of domestic violence may be all too easily explained in older people as the result of frailty or a fall.

In addition, there is an important group of older people for whom domestic violence is not usually recognised as such — those who develop behavioural and psychological symptoms associated with dementia.

Aggression exhibited by people with dementia has instead been viewed as intrinsic to neurodegeneration, and the perpetrator as lacking insight into their actions, particularly when there has been no premorbid history of interpersonal violence. While we do agree with this approach of not routinely classifying aggressive behaviours associated with dementia as a form of domestic violence, it is still important to consider the possibility of a history of violence earlier in the relationship. This highlights the need for a more nuanced approach that integrates an understanding of the longstanding characteristics of a perpetrator and the dynamics of a couple with later onset of neurodegeneration.

Clinical presentations

Most intimate partner violence in older couples is domestic violence “grown old”. The study of older couples by Lanzebatt and colleagues10 found that the mean duration of domestic violence was 39 years.

In many cases, physical violence may decline or cease as the couple grows older, only to be replaced by emotional abuse and threats of abandonment. It is usually the growing frailty of the victim that finally leads to the call for help. Another pattern that may be seen is a reversal of a longstanding victim–abuser relationship due to physical illness or cognitive impairment in the perpetrator. This change in dynamic may lead to the person who was once the victim of violence becoming the abuser. Along with a higher general level of aggression and controlling behaviour, alcohol misuse is one of the strongest risk factors for intimate partner physical violence11 and may persist into late life.

In contrast, late onset domestic violence tends to follow the development of cognitive impairment in a perpetrator, resulting in executive dysfunction with an inability to control impulsivity. It has been estimated that 24% of community-dwelling people with dementia demonstrate agitation or aggression, which is four times greater than for age-matched peers without dementia.12 Delusional jealousy, a conviction about the infidelity of one’s spouse, occurs in 9% of people with dementia and may be associated with aggression.13 This was the most common delusion in the 19% of older domestic homicide offenders with psychosis in NSW.14

Management suggestions

The first step is to understand that framing all abuse of older people as “elder abuse” fails to recognise that older people can be perpetrators, as well as victims, of domestic violence, and that a long history of violence and complex interpersonal dynamics may exist. Our primary concern is that such violence in an older couple runs the risk of straddling, yet is not fully encompassed by, elder abuse and general domestic violence services.

Health providers, in particular general practitioners, should be mindful of the ongoing risk of domestic violence in an elderly couple with a history of intimate partner violence, especially in the setting of alcohol misuse or dementia. Although routine screening of women aged 16 years and over for domestic violence is mandatory in most jurisdictions, its benefits remain controversial.15 The six-item Elder Abuse Suspicion Index may be used as a general screening tool (http://www.nicenet.ca/tools-easi-elder-abuse-suspicion-index), which may be supplemented by specific questions about intimate partner violence if such concerns arise.

When domestic violence is suspected in an elderly couple, the risk of serious harm to the victim should be assessed first. Assessment of the perpetrator should focus on excluding psychosis and cognitive impairment. Additional management measures will then depend on the specific characteristics of the perpetrator.

For late onset domestic violence associated with dementia or psychosis in the perpetrator, an initial referral to community old age psychiatry services for behavioural and pharmacological management is recommended. Under the relevant Mental Health Act or Guardianship Act, as appropriate to the individual jurisdiction, hospitalisation for acute treatment may be necessary in more urgent cases. In certain circumstances, another appropriate option is respite accommodation in a residential aged care facility; should the risk persist, permanent placement may be essential.

Longstanding cases, where the characteristics of the couple are no different from those in younger people, tend to be managed via standard pathways. This is problematic as there is a dearth of age-appropriate crisis and case management services. Shelters currently cater for the needs of younger women and their children, and would need to be modified for the physical and cognitive needs of older women or be purpose built.

In both cases, an important difference in managing domestic violence in this age group is that the perpetrator may be a carer. Here, separation of a couple will require a coordinated community response, involving social, health care and accommodation services to support the victim.

In conclusion, it is important to conduct a study specific to older male and female Australians’ experience of intimate partner violence. Elder abuse helplines need to highlight physical violence by an intimate partner as much as financial abuse or child neglect. Existing domestic violence helplines and services should train staff in the specific needs of older people to be able to triage and provide initial management to an older victim of domestic violence. First responders need to be aware that the elderly, like children, are particularly vulnerable to serious injury or death from violence, and that domestic violence in older people may occur in an age-specific context that is not criminal.

Box –
Definitions


Elder abuse: Acts of omission or commission that result in psychological, physical, financial or sexual harm to an older person, and is perpetrated by a person in a position of trust.1

Domestic violence: Acts of physical, sexual, and psychological abuse among people in current or previous intimate relationships.2


Disparities in acute in-hospital cardiovascular care for Aboriginal and non-Aboriginal South Australians

The known Disparities in the treatment of Aboriginal and non-Aboriginal patients hospitalised with acute coronary syndromes have been reported. 

The new After adjusting for age and other factors, Aboriginal status was independently associated with lower coronary angiography rates. Angiography was more likely if family members or Aboriginal liaison officers were present. Revascularisation rates and prescription of medical therapies were similar for Aboriginal and non-Aboriginal patients who had undergone angiography. 

The implications The reasons for lower angiography rates among Aboriginal patients are complex, but equality of treatment can be achieved. Improving the hospital experience for Aboriginal patients is needed to reduce disparities in treatment. 

Coronary heart disease (CHD) contributes significantly to the 10-year life expectancy gap between Aboriginal and non-Aboriginal Australians.13 CHD mortality is estimated to be twice as high among Aboriginal Australians,3 accounting for 14% of all deaths of Aboriginal people.4 A higher incidence of acute coronary syndromes (ACS), particularly of acute myocardial infarctions (AMI), among Aboriginal Australians is a major contributor to premature mortality in this population. In 2006, the Australian Institute of Health and Welfare identified major disparities in the management of Aboriginal and Torres Strait Islander patients hospitalised with ACS between 2002 and 2003, including a 40% lower rate of coronary angiography, a 40% lower rate of percutaneous coronary intervention (PCI), and a 20% lower rate of coronary artery bypass graft surgery (CABG).5

Given the extent of the inequalities related to cardiovascular disease, there is clearly a need to identify and overcome problems that contribute to these health disparities. To expand knowledge in this area, our study examined the in-hospital management of Aboriginal people with an ACS, focusing on explaining these disparities. Our aims were: (i) to assess differences in the rates of angiography and subsequent revascularisation for Aboriginal and non-Aboriginal South Australians presenting with an ACS, taking into account age and other factors; and (ii) to explore the reasons for any disparities by undertaking a detailed review of individual hospital admissions.

Methods

This was an observational study of Aboriginal and non-Aboriginal patients presenting with an ACS to any public tertiary hospital in South Australia between January 2007 and December 2012. We undertook a retrospective analysis of hospital administrative data and a chart review of all admissions of Aboriginal people with an ACS during this period (matched with a control cohort of non-Aboriginal patients).

Establishment of the expert working group

Following the release of Better hospital care for Aboriginal and Torres Strait Islander people experiencing heart attack,6 it was recognised that contemporary SA-specific data were required for evaluating disparities in care in this state. Consequently, the Heart Foundation in SA, in collaboration with the SA Health Cardiology Clinical Network, established a research team to provide the data. The project was overseen by an expert working group with representation from the research team and each SA Health local health service, as well as Aboriginal health professionals.

Administrative data

To investigate differences in diagnostic angiography and revascularisation (PCI/CABG) rates in Aboriginal and non-Aboriginal people, hospital admissions for ACS to all South Australian public tertiary facilities, with separations between 1 January 2007 and 31 December 2012, were obtained from the Integrated South Australian Activity Collection (ISAAC). ISAAC records are coded using International Statistical Classification of Diseases and Related Health Problems, 10th revision, Australian modification (ICD-10-AM) codes. All records were based on separations (episodes of care) rather than individual patients. Records were included in the analysis if the principal diagnosis was AMI (ICD-10-AM, I21.x) or unstable angina (I20.x) and the admission was recorded as an acute episode of care with casualty/emergency department as the source of referral. To avoid contamination of the dataset, records for interhospital transfers were excluded. Records in which Indigenous status was not stated or was inadequately described were also excluded.

Chart review

To further examine the in-hospital management of Aboriginal patients with an ACS, a chart review was undertaken, using 1:1 matching and a standardised case report form. The hospital medical records for each separation recorded in the administrative data of patients who were identified as Aboriginal or Torres Strait Islander were extracted. They were matched as closely as possible with the next admission to the same hospital of a non-Aboriginal patient of the same age (within 10 years) and sex, and with the same principal diagnosis. Documentation of the medical decision-making process about whether the patient received invasive management was also reviewed; influences on this process were categorised as clinical or non-clinical (ie, patient-related factors).7 Data quality for the chart review was ensured by using trained abstractors and record re-abstraction for 10% of cases. Training included a detailed data dictionary and coding instructions, a testing phase with training examples, and individual education sessions on site before and during data collection.

Statistical analysis

Administrative data

Age at admission (mean, standard deviation) for Aboriginal and non-Aboriginal patients was compared with the Student t test. Comparisons of categorical endpoints for Aboriginal and non-Aboriginal patients are presented as percentages, and were assessed by logistic regression. Unadjusted and age-adjusted comparisons are reported as odds ratios with 95% confidence intervals (CIs). The primary outcomes included receiving diagnostic coronary angiography and, for patients for whom angiography was performed, PCI and CABG rates. To explore the association between invasive management and Aboriginal status, logistic regression models were fitted for each outcome. Modelling commenced with fully saturated models that included Aboriginal status and all remaining predictors with P < 0.20 as factors; non-significant variables (P ≥ 0.05) were then systematically removed from the models.

Chart review

Clinical outcomes for Aboriginal and non-Aboriginal patients are presented as percentages and compared by logistic regression as described above. Symptom duration in minutes (median, interquartile range [IQR]) was compared with the Wilcoxon rank-sum test. The primary outcome in the chart review was the prevalence of clinical and non-clinical factors associated with non-invasive management; outcomes for the two groups were compared by logistic regression, with unadjusted and age-adjusted results reported.

All tests were two-tailed (α = 0.05). All analyses were performed in Stata/IC 11.2 for Mac.

Ethics approval

This study was approved by the SA Health Human Research Ethics Committee (reference, HREC-13-SAH-89; 461/07/2014) and the Aboriginal Health Research Ethics Committee (reference, 04-13-516).

Results

Administrative data

During January 2007 – December 2012, a total of 13 843 separations with a principal diagnosis of ACS were recorded. Aboriginal status was not stated or inadequately described in 722 records (5.6%), leaving 13 071 admissions records for analysis, of which 274 (2.1%) referred to Aboriginal patients. The mean age of the Aboriginal patients was about 16 years lower than for non-Aboriginal patients, and a higher proportion were women (Box 1). The age distribution by Aboriginal status and sex is summarised in Appendix 1. Most patients presented with an AMI; the figure was similar for the two groups (57%), despite the younger age profile of the Aboriginal patients. Evaluation of additional diagnosis codes found a higher prevalence among Aboriginal patients of several cardiovascular risk factors and comorbidities, including diabetes, smoking, dyslipidaemia and renal failure (Box 1).

Analysis of hospital procedure codes indicated that 6069 separations (46.4%) included a diagnostic coronary angiogram during the admission for an ACS (Box 2). The proportion was similar for Aboriginal and non-Aboriginal patients, but age-adjusted analyses identified that Aboriginal patients were significantly less likely to undergo the procedure (Box 2). Box 3 shows the prevalence of coronary angiography by age group, indicating a significant disparity for Aboriginal patients in the 45–54 years (P < 0.001) and 55–64 years (P = 0.001) age groups.

For the entire cohort, patients who underwent coronary angiography were significantly younger than those who did not (mean [SD], 64.0 years [12.9] v 73.8 years [13.8]; P < 0.001), and a greater proportion were men (72% v 58%; odds ratio [OR], 1.87; 95% CI, 1.74–2.01; P < 0.001). Multivariable logistic regression identified eight independent factors significantly associated with angiography: Aboriginal status (OR, 0.4; 95% CI, 0.3–0.5; P < 0.001); age (as a continuous variable: OR [for each one-year increase in age], 0.9; 95% CI, 0.9–1.0; P < 0.001); AMI as principal diagnosis (OR, 5.8; 95% CI, 5.3–6.3; P < 0.001); sex (OR [men v women], 1.3; 95% CI, 1.2–1.4; P < 0.001); major cities (OR [v outer regional/remote/very remote area residence], 2.9; 95% CI, 2.3–3.7; P < 0.001); renal failure (OR, 0.5; 95% CI, 0.4–0.6; P < 0.001); heart failure (OR, 0.5; 95% CI, 0.5–0.6); P < 0.01); and airway disease (OR, 0.6; 95% CI, 0.5–0.7; P < 0.001).

After adjustment for age, the odds of Aboriginal patients undergoing PCI were significantly lower than for non-Aboriginal patients (Box 2). The between-groups odds ratios for undergoing CABG were significant in neither the unadjusted nor the age-adjusted analyses. However, when the analysis of interventional procedures was restricted to patients who underwent coronary angiography, PCI rates for Aboriginal and non-Aboriginal patients were similar, as were those of CABG and revascularisation overall (Box 2). For admissions that included a coronary angiogram, multivariable models assessing independent predictors of revascularisation (PCI, CABG) did not find an association with Aboriginal status.

Chart review

We reviewed medical record abstracts for 274 Aboriginal and 274 non-Aboriginal patients. Aboriginal patients were matched for sex with non-Aboriginal patients (57% were men), but were significantly younger (mean age [SD], 53.1 years [10.5] v 59.0 [10.4] years; P < 0.001). The number who arrived at hospital by ambulance was similar for Aboriginal and non-Aboriginal patients (148 [61%] v 149 [60%]; age-adjusted OR, 1.3; 95% CI, 0.9–1.8; P = 0.24), as was symptom duration (median time before hospital presentation [IQR], 160 min [80–415 min] v 165 min [80–419 min]; P = 0.62). The angiography rate among Aboriginal patients was lower than for non-Aboriginal patients in both the unadjusted and age-adjusted analyses (141 [51%] v 169 [62%]; age-adjusted OR, 0.5; 95% CI, 0.4–0.7; P < 0.001). Stratification according to the National Heart Foundation/Cardiac Society of Australia and New Zealand ACS guidelines8 indicated a similar risk burden for the patient groups (Appendix 2). The proportion of Aboriginal patients who underwent angiography was lower in each risk group, but the difference was statistically significant only for patients with high risk non-ST-elevation acute coronary syndrome (NSTEACS; 49% [59 patients] v 60% [64 patients]; age-adjusted OR, 0.5; 95% CI, 0.3–0.9; P = 0.02) (Box 4). Aboriginal patients who received care facilitated by an Aboriginal liaison officer were significantly more likely to have an angiogram (28% [27 patients] v 9% [10 patients]; OR, 3.9; 95% CI, 1.8–8.6; P = 0.001), as were Aboriginal patients who arrived at the hospital with an escort (43% [32 patients] v 24% [25 patients]; OR, 2.4; 95% CI, 1.3–4.6; P = 0.01).

The documentation on the decision not to proceed with angiography for Aboriginal and non-Aboriginal patients is summarised in Box 5. Non-clinical factors were more frequently cited to explain managing an ACS without angiography in documentation for Aboriginal patients than for non-Aboriginal patients. For more than one third of Aboriginal patients, the reason for choosing conservative management was unclear, compared with 10% for non-Aboriginal patients (Box 5).

At discharge, the prescription of guideline-recommended therapies for AMI patients was similar for Aboriginal and non-Aboriginal patients (Box 6). Regardless of Aboriginal status, secondary prevention therapies, including aspirin, β-blockers and cardiac rehabilitation referral, were prescribed significantly less frequently for those who did not undergo coronary angiography than for patients who did (Appendix 3).

Discussion

In this evaluation of patients attending the major tertiary facilities in SA for the treatment of ACS, the mean age of Aboriginal patients was about 15 years lower than for non-Aboriginal patients. Despite their being younger, high risk features were worryingly common, including higher rates of background cardiovascular risk factors and comorbidities. Importantly, we identified that the major difference in the in-hospital treatment of Aboriginal patients with an ACS was the rate of coronary angiography: after correcting for the effects of age, sex, principal diagnosis, comorbidities and remoteness, Aboriginal patients with an ACS were significantly less likely to undergo this diagnostic procedure. However, we also found that revascularisation (PCI or CABG) rates following angiography were similar for Aboriginal and non-Aboriginal patients. Similar to findings in the Northern Territory,9 Aboriginal and non-Aboriginal patients who had undergone angiography were prescribed evidence-based therapies on discharge at comparable rates. These findings show that equivalent treatment for Aboriginal and non-Aboriginal patients is achievable.

The lower age-adjusted odds of Aboriginal patients undergoing diagnostic angiography is concerning, but consistent with previous reports of lower rates of cardiac intervention in national5 and state-based datasets.10 Similar rates of CABG, but not of PCI, among Aboriginal and non-Aboriginal patients have been described.10 We, however, found similar rates of PCI for the two population groups; the reasons for this difference are unclear, but may include advances in PCI technology11 that have expanded the range of Aboriginal patients who can be treated with this intervention. Unlike other studies, we also undertook a restricted analysis of revascularisation rates that included only admissions where a diagnostic angiogram had been performed, thereby differentiating different sources of disparity; this analysis indicated that the major difference involved the decision about diagnostic angiography. Research in the United States exploring racial disparities in treating CHD also found that the greatest disparity was the referral to angiography.12,13

To further examine the causes of the disparity in angiography rates, we undertook a medical record review of all Aboriginal ACS admissions in the hospital data, matched with data for a non-Aboriginal cohort. This information provided insight into the medical decision-making processes for Aboriginal ACS patients and confirmed that a negative hospital experience, bias based on complex comorbidities or presumed adherence to medications that favoured conservative management, and patient choice were implicated in the difference in angiography rates.6,14,15

In 56% of cases in which Aboriginal patients did not undergo angiography, the decision was attributed to patient-related factors or no clear justification was provided, compared with 17% for non-Aboriginal patients. The rate of discharge against medical advice was high among Aboriginal patients who did not receive angiography (10.5%). This raises concerns about barriers to quality care for Aboriginal people, including poor engagement and communication, a lack of coordinated care, and inadequate cultural competence of health care providers.16,17 All of these factors can result in isolation, fear and disengagement by the patient.9

The importance of shared discussions and cultural support structures is highlighted by our findings, as Aboriginal patients who arrived at the hospital with an escort (family member or friend) were more likely to undergo angiography. Encouraging shared decision making and enabling systems that support a companion during the hospital stay are crucial for improving Aboriginal health care.14 Our data also strongly support the involvement of Aboriginal liaison officers, as their presence was associated with an increased likelihood of angiography. Although we cannot presume a direct causative relationship, these interactions are understood to improve communication and coordination, and to assist in alleviating fear.17

It has previously been reported that Aboriginal people with symptoms suggestive of a heart attack may delay presenting to a hospital.9 However, our findings suggest this situation may be improving, as symptom duration at hospital presentation was similar for Aboriginal and non-Aboriginal patients. Strategies that target early response and action may now be having an impact, with a number of culturally appropriate health resources and education tools available to patients and health care providers.

The major limitations to our study were that the data were drawn from one Australian state, and that the assessed records were based on hospital separations rather than individual patients. Further, patients receiving care in non-tertiary facilities were not included in our analysis. An evaluation of these patients, with a particular focus on comparing patients who were subsequently transferred with those who remained in a non-catheterisation facility, would be desirable. Our investigation could thus be strengthened by broader population coverage and by using linked data.

Our study provides important insights into the in-hospital treatment of Aboriginal patients with an ACS. We found a significant health disparity in the rates of coronary angiography for Aboriginal and non-Aboriginal patients that is not explained by the frequency of complex comorbidities in these populations. Hospitalisation for acute cardiovascular care can be distressing, and for Aboriginal patients this problem is compounded by limited understanding by health care workers of factors influencing Aboriginal health, leading to miscommunication that may reinforce negative perceptions, patient disengagement, and fear. In our study, engagement with the patient’s family and care facilitated by Aboriginal liaison officers each had positive impacts. While there are other contributing factors to disparities in treatment, health care workers and systems that facilitate a constructive hospital experience will improve the ability to provide effective care for Aboriginal patients.

Box 1 –
Clinical characteristics of Aboriginal and non-Aboriginal patients presenting with an acute coronary syndrome to South Australian tertiary hospitals, 2007–2012

Aboriginal patients

Non-Aboriginal patients

Odds ratio for Aboriginal patients


Unadjusted (95% CI)

P

Age-adjusted (95% CI)

P


Total number of separations

274

12 797

Age at admission (years), mean (SD)

53.1 (10.5)

69.6 (14.1)

< 0.001

Sex (women)

117 (43%)

4460 (35%)

1.4 (1.1–1.8)

0.01

2.7 (2.1–3.5)

< 0.001

Location*

Major cities

203 (74%)

10 730 (84%)

0.6 (0.4–0.7)

< 0.001

0.8 (0.6–1.1)

0.19

Inner regional

12 (4.4%)

1615 (13%)

0.3 (0.2–0.6)

< 0.001

0.2 (0.1–0.4)

< 0.001

Outer regional

25 (9.2%)

310 (2.4%)

4.1 (2.6–6.2)

< 0.001

2.6 (1.7–4.0)

< 0.001

Remote/very remote

33 (12.1%)

128 (1.0%)

14 (9.1–20)

< 0.001

9.2 (5.9–14)

< 0.001

Principal diagnosis

Unstable angina

115 (42%)

5403 (42%)

0.9 (0.7–1.2)

0.93

0.9 (0.8–1.3)

0.51

Acute myocardial infarction (NSTEMI or STEMI)

155 (57%)

7241 (57%)

1.0 (0.8–1.3)

0.99

1.0 (0.8–1.3)

0.71

Unspecified acute myocardial infarction

4 (1%)

153 (1%)

1.2 (0.5–3.3)

0.69

2.3 (0.8–6.5)

0.11

Cardiovascular risk factors

Hypertension

162 (59%)

7745 (61%)

0.9 (0.7–1.2)

0.64

1.3 (1.0–1.7)

0.20

Diabetes

121 (44%)

2737 (21%)

2.9 (2.3–3.7)

< 0.001

3.0 (2.4–3.9)

< 0.001

Current smoker

129 (47%)

2610 (20%)

3.5 (2.7–4.4)

< 0.001

1.2 (0.9–1.6)

0.18

Dyslipidaemia

86 (31%)

3074 (24%)

1.4 (1.1–1.9)

0.01

1.1 (0.8–1.4)

0.56

Family history of ischaemic heart disease

15 (5.5%)

477 (3.7%)

1.5 (0.9–2.5)

0.14

0.6 (0.4–1.1)

0.09

Cardiovascular comorbidities

Cerebrovascular disease

2 (1%)

179 (1.4%)

0.5 (0.1–2.1)

0.36

1.2 (0.3–5.0)

0.79

Peripheral vascular disease

3 (1%)

311 (2.4%)

0.4 (0.1–1.4)

0.17

0.5 (0.2–1.6)

0.27

Cardiomyopathy

7 (3%)

169 (1.3%)

2.0 (0.9–4.2)

0.09

2.0 (0.9–4.3)

0.09

Valvular heart disease

11 (4.0)%

791 (6.2%)

0.6 (0.3–1.2)

0.14

1.4 (0.7–2.6)

0.30

Heart failure

23 (8.4%)

1766 (14%)

0.6 (0.4–0.9)

0.01

1.7 (1.1–2.7)

0.02

Cardiogenic shock

3 (1%)

240 (1.9%)

0.6 (0.2–1.8)

0.35

1.0 (0.3–3.1)

0.96

Non-cardiovascular comorbidities

Renal failure

41 (15%)

1546 (12%)

1.3 (0.9–1.8)

0.15

3.6 (2.5–5.1)

< 0.001

Malignancy

3 (1%)

214 (1.7%)

0.7 (0.2–2.0)

0.46

1.1 (0.4–3.6)

0.83

Airway disease/asthma

6 (2%)

534 (4.2%)

0.5 (0.2–1.2)

0.11

0.8 (0.4–1.9)

0.64

Liver disease

2 (1%)

59 (0.5%)

1.6 (0.4–6.5)

0.52

1.7 (0.4–7.2)

0.47


NSTEMI = non-ST-elevation myocardial infarction; STEMI = ST-elevation myocardial infarction. * Classified according to Australian Bureau of Statistics, Postcode 2012 to Remoteness Area 2011 concordance (released 31 Jan 2013: http://www.abs.gov.au/AUSSTATS/abs@.nsf/DetailsPage/1270.0.55.006July%202011?OpenDocument). ICD-10 codes for risk factors and comorbidities: hypertension (I10–I15); diabetes (E10–E14); current smoker (Z72); dyslipidaemia (E78); family history of ischaemic heart disease (Z824); cerebrovascular disease (I60–I69); peripheral vascular disease (I70–I74); cardiomyopathy (I42, I43); valvular heart disease (I05–I08, I33–I39); heart failure (I50); cardiogenic shock (R57); renal failure (N17, N18.3, N18.4, N18.5, N18.9, N19, R34); malignancy (C00–C97); asthma (J45–J46); airway disease (J40–J44, J47); liver disease (K70–K77). All percentages are column percentages after excluding missing values.

Box 2 –
Coronary angiography and revascularisation rates for Aboriginal and non-Aboriginal patients with an acute coronary syndrome, South Australia, 2007–2012

Aboriginal patients

Non-Aboriginal patients

Odds ratio for Aboriginal patients


Unadjusted (95% CI)

P

Age-adjusted (95% CI)

P


Total number of separations

274

12 797

Coronary angiography

135 (49%)

5934 (46%)

1.1 (0.9–1.4)

0.34

0.5 (0.4–0.6)

< 0.001

Interventions (proportion of patients in group)

Percutaneous coronary intervention (PCI)

87 (32%)

3831 (30%)

1.1 (0.8–1.4)

0.52

0.5 (0.4–0.6)

< 0.001

Coronary artery bypass grafting (CABG)

8 (3%)

308 (2.4%)

1.2 (0.6–2.5)

0.59

0.9 (0.5–1.9)

0.88

Total revascularisation (PCI or CABG)

95 (35%)

4124 (32%)*

1.1 (0.9–1.4)

0.39

0.5 (0.4–0.7)

< 0.001

Interventions following coronary angiography (proportion of patients in group who underwent coronary angiography)

PCI

82 (61%)

3512 (59%)

1.1 (0.8–1.5)

0.72

0.8 (0.5–1.1)

0.18

CABG

7 (5%)

225 (3.8%)

1.4 (0.6–3.0)

0.41

1.7 (0.7–3.7)

0.20

Total revascularisation (PCI or CABG)

89 (66%)

3725 (63%)*

1.1 (0.8–1.6)

0.45

0.9 (0.6–1.2)

0.42


All percentages are column percentages after excluding missing values. * Some non-Aboriginal patients underwent both PCI and CABG, but are counted only once in the revascularisation total, so that the sum of the numbers for PCI and CABG exceeds that for total revascularisation interventions.

Box 3 –
Unadjusted proportions of Aboriginal and non-Aboriginal patients presenting to South Australian public hospitals with an acute coronary syndrome who underwent coronary angiography, 2007–2012, by age group


Aboriginal v non-Aboriginal patients: * P = 0.001; **P < 0.001 (logistic regression).

Box 4 –
Age-adjusted comparison of Aboriginal and non-Aboriginal patients with acute coronary syndromes who underwent coronary angiography, based on chart review data, according to guideline risk stratification


STEMI = ST-elevation myocardial infarction; NSTEACS = non-ST-elevation acute coronary syndrome. Aboriginal v non-Aboriginal patients: * P = 0.02 (logistic regression).

Box 5 –
Documentation of clinical and non-clinical factors in treating Aboriginal and non-Aboriginal patients with acute coronary syndromes without coronary angiography, chart review data

Aboriginal patients

Non-Aboriginal patients

Odds ratio for Aboriginal patients undergoing coronary angiography


Unadjusted (95% CI)

P

Age-adjusted (95% CI)

P


Number of patients

274

274

Coronary angiography not undertaken

139 (51%)

118 (43%)

1.4 (1.0–1.9)

0.07

1.6 (1.1–2.3)

0.01

Reason for not undertaking angiography

Patient-related factors

28 (20%)

8 (7%)

3.5 (1.5–8.4)

0.01

3.4 (1.4–8.2)

0.01

Patient decision

10

5

Discharge against medical advice

15

3

Known medication non-adherence

3

0

Clinical/medical factors

61 (44%)

98 (83%)

0.2 (0.1–0.3)

< 0.001

0.1 (0.1–0.3)

< 0.001

Angiography booked

7

10

Non-invasive test for ischaemia

11

41

Symptoms deemed non-ischaemic

22

15

Comorbidities/palliative care

7

14

Known anatomy, medical management

14

18

Unclear

50 (36%)

12 (10%)

5.3 (2.5–11)

< 0.001

5.7 (2.7–12.3)

< 0.001


Box 6 –
Guideline-recommended therapies at discharge for Aboriginal and non-Aboriginal patients with an acute myocardial infarction, chart review data

Discharge therapy

Aboriginal patients

Non-Aboriginal patients

Odds ratio for Aboriginal patients


Unadjusted (95% CI)

P

Age-adjusted (95% CI)

P


Number of patients*

134

150

Aspirin

119 (90%)

144 (95%)

0.5 (0.2–1.2)

0.12

0.5 (0.2–1.2)

0.11

Statin

118 (89%)

130 (93%)

0.6 (0.3–1.5)

0.32

0.6 (0.2–1.4)

0.24

β-Blocker

71 (54%)

67 (48%)

1.3 (0.8–2.1)

0.30

1.3 (0.8–2.0)

0.34

Angiotensin converting enzyme inhibitor or angiotensin receptor blocker

99 (76%)

113 (82%)

0.7 (0.4–1.2)

0.17

0.7 (0.4–1.3)

0.22

Cardiac rehabilitation referral

52 (50%)

54 (46%)

1.2 (0.7–2.0)

0.57

0.9 (0.5–1.6)

0.79

Ejection fraction assessed

66 (50%)

65 (44%)

1.3 (0.8–2.0)

0.33

1.2 (0.7–1.9)

0.57


The inequitable burden of group A streptococcal diseases in Indigenous Australians

We need to fill evidence gaps and make clinical advances to reduce these diseases of disadvantage

Group A streptococcal (GAS) infections contribute to the excess burden of ill-health in Indigenous Australians, causing superficial infection, invasive disease, and the autoimmune sequelae of acute rheumatic fever (ARF) and acute post-streptococcal glomerulonephritis (APSGN) (Box 1).16 GAS diseases declined in the broader Australian population during the 20th century, largely as a result of improved living conditions,7 but this is not the case in Indigenous Australians. GAS infections and their sequelae persist at unacceptably high rates in remote Australia, on par with or higher than those in low income settings internationally.8 GAS infections globally represent social disadvantage.5,8 Poverty, household overcrowding and distance from health care services are the main drivers.9

GAS impetigo

In remote Australian communities, impetigo, predominantly caused by GAS infection,2,10,11 affects a median of 45% of Indigenous children at any one time.3 This high prevalence is testament to the poor environmental conditions9 and household overcrowding in Indigenous communities.10,12 A high burden of circulating group A streptococcus strains13 and scabies are contributory factors.2 Further, skin infections are also “normalised”, which contributes to the burden as it is not seen as a significant problem — affecting both health care-seeking behaviour14 and the response by clinicians when patients present with other complaints.15 Despite being under-recognised, GAS impetigo is of public health importance. Untreated, it can lead to APSGN, with resultant acute cardiac morbidity from hypertension.1 Although acute case fatality rates are low (< 2%),1 APSGN in childhood increases the risk of chronic kidney disease later in life in Indigenous Australians.16

Precursor to rheumatic fever

ARF and subsequent rheumatic heart disease (RHD) are the most severe and life-threatening post-streptococcal diseases. Mortality rates from RHD in Indigenous Australians are the highest reported in the world.1 Traditionally, GAS pharyngitis has been considered the lone antecedent to ARF.17 Yet, in remote tropical Australia, GAS pharyngitis is uncommonly reported and GAS skin infections are hyper-endemic.12 Thus, impetigo, rather than pharyngitis, may be the driver. The findings of studies to clarify this dilemma have not been definitive.6,12 Recently, a New Zealand molecular epidemiological study using M-protein (emm) cluster typing found that 49% of ARF-associated GAS strains from isolates were emm pattern D (skin pattern) types.18 Further studies examining the causal link between GAS impetigo and RHD remain a priority if we are to make further progress towards the primary prevention of RHD.12

Current approaches to GAS infection control

Community and primary health programs

For decades, the focus in the Northern Territory has been on control of skin disease,10,11,19 although treatment for sore throat is also promoted.20 Community skin days and mass drug administration with permethrin11 have been successful, but their impact is not sustained. More recently, a better tolerated treatment regimen for impetigo was reported, with oral co-trimoxazole proven to be non-inferior to intramuscular penicillin;10 and mass drug administration with oral ivermectin shown to be an effective population approach to reducing scabies and impetigo.19 However, to date, no approach in Australia has achieved a sustained reduction in GAS impetigo. Overcrowding and population mobility are among the contributing factors and, more recently, the contribution of community members with crusted scabies as core transmitters of the scabies mite has been recognised.19 New approaches to management of crusted scabies in the NT include surveillance under public health legislation21 and coordinated case management.22 However, there remains a need to target the other contributing factors, particularly overcrowding, before sustained reductions can be achieved.

Policy and legislation

The only GAS diseases that have any jurisdiction-level policies or strategies are skin infections, APSGN, ARF and RHD. The NT has well established, evidence-based guidelines for community-level skin sore and scabies control, and an APSGN outbreak response.23 Other jurisdictions have adopted the APSGN guidelines when needed, but do not have legislation requiring notification of the disease. Through the national Rheumatic Fever Strategy, the Australian Government has funded the development and maintenance of register-based RHD control programs for monitoring the RHD burden and coordination of care, with a focus on secondary prophylaxis, in the NT, Queensland, Western Australia and South Australia, as well as the establishment of the National Coordination Unit.24,25 New South Wales established a statewide register in 2015.26 Centralised coordination of secondary prophylaxis, the only cost-effective method proven for RHD control,27 through electronic registers is advantageous for mobile populations if the systems are shared and accessible to all health service providers. Given that RHD has the highest differential mortality between Indigenous and non-Indigenous Australians of any preventable condition,28 continuation of Rheumatic Fever Strategy funding is essential if Australia is to achieve its Closing the Gap targets.

Areas for future focus to close the gap in GAS infection outcomes

Heightened surveillance

Currently, no GAS diseases are nationally notifiable,29 but a number are notifiable in different jurisdictions (Box 2). Passive surveillance via notifiable disease reporting would be the cheapest and least resource-intensive method30 for monitoring GAS diseases and their sequelae in remote Australia. ARF, scarlet fever, and puerperal fever were all nationally notifiable in Australia before 1990.31 All three are no longer nationally notifiable.

Surveillance programs for APSGN, ARF and invasive GAS infection in the NT or for RHD in WA, SA and NSW could be replicated elsewhere. In New Zealand, diseases that disproportionately affect Maori and Pacific Islander peoples are prioritised; national notification of ARF is legislated,32 and there are well resourced school screening programs for sore throat and skin infection.33 Legislating for notification of GAS diseases that disproportionately affect Australian Indigenous people would facilitate accurate disease monitoring and directed public health response, and provide advocacy tools for Indigenous health campaigners to demand action.

Primary prevention

Future approaches to comprehensive skin disease control programs will incorporate sustainable community-wide approaches, acceptable clinical treatments, appropriate contact management, evidence-based prevention and community control initiatives that are embedded in primary health care. Earlier skin disease control programs were effective initially,11 but were unsustainable due to the cost of using a largely external workforce. Combining streamlined treatment guidelines for impetigo, scabies and crusted scabies into training, health promotion and environmental health activities that are culturally secure will be critical. The role of skin disease control in ARF prevention is unclear, and requires a better understanding of the relationship between GAS impetigo and ARF. Monitoring the impact of sustained impetigo control measures on the incidence of ARF could be included in skin control programs to help us understand the potential role for impetigo control as a primary prevention strategy for ARF.

Research and development of new technologies

Development of a GAS vaccine

A vaccine against group A streptococcus would be a major advance in reducing the excess burden of GAS disease in Indigenous Australians, particularly in the current absence of a cost-effective primary prevention strategy for ARF. Several M-protein-based vaccines have progressed to human clinical trials,34 but none have yet moved beyond phase II trials. The need to cover multiple diverse strains and a standardised immunoassay for efficacy and immunogenicity monitoring are current barriers to vaccine development.35 The Coalition to Accelerate New Vaccines for group A Streptococcus (CANVAS), a joint initiative between the Australian and New Zealand governments, is tackling these barriers to advance GAS vaccine research.18

Long-acting penicillins for secondary prevention of ARF

The mainstay of secondary prevention of ARF remains intramuscular injections of benzathine penicillin every 28 days for a minimum of 10 years.36 A longer-acting, less painful way of administering penicillin would overcome some of the avoidance and acceptability issues with the current formulation.37 Key questions remain before a better alternative can be delivered, but progress is underway36 through studies examining the pharmacokinetics, patient preferences and the rationale behind the current formulation.

Primordial prevention

Although there is progress towards a potential vaccine and longer-acting antibiotics, these remain distant possibilities. Moreover, the large reductions in ARF and APSGN occurred in the wider population without these technologies.7 Indigenous people have not benefited from improvements in the social determinants of health that resulted in the virtual elimination of these conditions in the non-Indigenous population. As a contribution to improving socio-economic disadvantage, clinicians can provide health data to help quantify the disadvantage that exists. Capacity building through support and training of Indigenous clinicians is a necessity for providing accessible primary health care. Further capacity building will see Indigenous health practitioners become leaders in policy and research to facilitate Indigenous community control over health programs and funding. Empowering the community to vanquish the effects of more than two centuries of colonisation, racism and oppression should be at the forefront of policy development if we are to achieve equity in the social determinants of health and reduce the prevalence of diseases that represent disadvantage, including GAS infections and their sequelae.

Conclusions

Given the ongoing mortality and morbidity from chronic kidney and heart disease due to GAS infection in Indigenous Australians, we must address more effectively the treatment and prevention of the precursors, GAS impetigo and pharyngitis. An essential step in improved prevention and control is effective surveillance of GAS conditions. Quality surveillance data would quantify the disease burden at both a jurisdictional and national level, providing important information to guide resource allocation. Effective, sustainable skin disease control programs embedded within the activities of the existing workforce are another priority. New prevention initiatives in GAS vaccines and longer-acting penicillin therapy are progressing. However, despite these clinical advances, the top priority remains the need to improve the quality of housing and access to health care that continue to disadvantage remotely living Indigenous Australians — these are the underlying reasons for the inequity in GAS outcomes that continue today.

Box 1 –
The global and local burden of group A streptococcal (GAS) skin infections and pharyngitis and their sequelae


* Indigenous Australian children have the highest reported burden in the world.3,5 † Incidence in Indigenous children surpasses that in non-Indigenous children.1,5

Box 2 –
Diseases caused by group A streptococcal infections that are notifiable under state and territory public health legislation in each state or territory of Australia29

Notifiable group A streptococcus-related condition

Australian state or territory


ACT

NSW

NT

Qld

SA

Tas

Vic

WA


Acute post-streptococcal glomerulonephritis

Yes

Acute rheumatic fever

Yes

Yes

Yes

Yes

Yes

Invasive group A streptococcal infection

Yes

Yes

Rheumatic heart disease

Yes*

Yes

Yes

Scarlet fever

Yes


ACT = Australian Capital Territory. NSW = New South Wales. NT = Northern Territory. Qld = Queensland. SA = South Australia. Tas = Tasmania. Vic = Victoria. WA = Western Australia. * Notifiable in people aged under 35 years.