×

Challenges of chronic kidney disease prevention

The growing global health burden of chronic kidney disease is best tackled through effective prevention

He who cures a disease may be the skillfullest, but he who prevents it is the safest physician — Thomas Fuller (1654–1734)

The prevalence of chronic kidney disease (CKD) has been increasing at an alarming rate over the past two decades as a result of the ageing population and the growing prevalence of diabetes, hypertension and obesity. In Australia, there are about 1.7 million adults over the age of 18 years who have indicators of CKD, such as reduced glomerular filtration rate (GFR) or proteinuria.14 A small proportion of these patients will progress to end-stage kidney disease (ESKD), requiring renal replacement therapy. Over the past decade, the number of Australians with ESKD has doubled and is currently over 20 000.5 Providing renal replacement therapy is costly and accounts for 3% of total health expenditure; a significant portion is spent on dialysis.5 It is estimated that the cumulative cost of providing treatment to new and existing patients with ESKD in Australia from 2009 to 2020 will reach $12 billion.5 This places a great burden on society. Although there has been considerable effort to expand the use of less expensive home-based dialysis treatment as well as transplantation, the optimal and most cost-effective treatments for ESKD6, there are substantial barriers to applying these strategies to meet increasing demand. Therefore, a shift in focus is needed from treating CKD to more purposeful prevention.

The burden of CKD not only relates to the health care requirements of patients with ESKD; it also relates to broader public health through its close association with cardiovascular disease. CKD is regarded as an independent risk factor for cardiovascular disease within the general population and among patients at high cardiovascular risk. Therefore, prevention of CKD not only diminishes the burden of ESKD but also reduces the associated cardiovascular morbidity and mortality.

Implementing a successful CKD prevention program poses challenges, some of which may be confronted directly by health care professionals. Other challenges may require the joint effort of other entities such as government bodies, not-for-profit organisations and industry.

Awareness of CKD

The first challenge in implementing a successful CKD prevention program is the low awareness of CKD in the general public and among primary health care professionals.

CKD is a silent disease that can remain asymptomatic until it reaches an advanced stage, therefore most people with CKD are unaware they have the condition.2 Among the 1.7 million adults over the age of 18 years who have indicators of CKD, 1.5 million are unaware that they have the disease.13 Among patients who reach ESKD requiring dialysis, a quarter present to nephrologists late and require dialysis within 90 days,2,7 thereby having missed opportunities for timely intervention and prevention of further disease progression.

Primary care professionals are not always fully aware of the guidelines for the screening and management of CKD. The proportion of people with CKD remaining undiagnosed by primary care physicians has been reported to be as high as 50%, despite the use of automated reporting of estimated GFR, which was introduced to improve early detection of CKD.8 According to the AusHEART study, only 18% of patients with abnormal kidney function were correctly identified as having CKD by primary care physicians, and proteinuria screening was performed in less than 60% of patients with reduced GFR.9 There is also considerable deficiency in the management of CKD. In a study involving 1312 patients with reduced GFR, more than half were not receiving antihypertensive medication when indicated, and blood pressure targets were achieved in only 60% of those receiving treatment.9 Given that most patients with early-stage CKD are managed by primary care physicians, education and training to improve physicians’ awareness and knowledge of CKD is of vital importance if prevention programs are to be successful.

In recognising these issues, there has been considerable effort by organisations such as Kidney Health Australia in recent years to educate and raise awareness of the public and health care providers about CKD. Kidney Health Australia has implemented initiatives such as its health professional education program, developed guidelines for CKD management in general practice, and launched awareness campaigns such as Kidney Health Week, all of which have been well received.10 However, there is still a long way to go and success in this area requires joint effort between health care professionals, not-for-profit organisations and government bodies.

Current screening programs

The second challenge in CKD prevention relates to the imperfections of current screening methods. Current CKD screening programs are based on measurement of both proteinuria and GFR. Proteinuria can be affected by factors such as physical activity, posture and timing of urine collection. There can also be sizable variation in laboratory measurements of creatinine and urinary protein. GFR is estimated from creatinine-based formulas, which can lead to significant variability in estimated values. The CKD Epidemiology Collaboration formula is currently used widely in Australia to estimate GFR. Compared with the Modification of Diet in Renal Disease formula, the CKD Epidemiology Collaboration formula has less bias at higher GFRs and is superior with regard to prognostic classification in the Australian population.3 However, neither of these equations takes into account ethnicities other than black and white, risking misclassification within other populations. The Kidney Disease: Improving Global Outcomes guidelines recommend also that serum cystatin C concentration be used to estimate GFR in patients with reduced estimated GFR but without albuminuria, to reduce diagnostic inaccuracy.11 However, cystatin C measurement is much more expensive and less available than creatinine testing. Given the inaccuracy of current screening methods and the expensive nature of the more accurate markers, research needs to focus on development of new biomarkers and equations that provide accurate results across all levels of GFR and in all populations. Novel markers are needed to better identify individuals at risk of developing CKD and predict the propensity for progression.

Indigenous Australians

The third challenge in prevention of CKD stems from the fact that among Indigenous Australians, the burden of CKD is much higher and prevention is more difficult because of socioeconomic disadvantage. For example, the prevalence of CKD and ESKD and the hospitalisation and mortality rates from CKD are much higher among Indigenous Australians compared with non-Indigenous Australians.12 In 2012–13, Indigenous Australians were twice as likely to have signs of CKD and more than four times as likely to have advanced disease (ie, Stage 4–5).13

In this context, it is important to consider that Indigenous Australians have higher rates of traditional risk factors associated with CKD such as hypertension, diabetes and obesity.11 In addition, the higher risk of developing CKD also stems from other risk factors such as low birth weight, streptococcal infections and recurrent urinary tract infections, all of which are more common in Indigenous Australians.14 Many of these risk factors are attributable to socioeconomic disadvantage, leading to domestic crowding, inadequate sanitation, poor diet, low levels of education and income, and limited access to medical care.14 Addressing these is a fundamental component of CKD prevention programs in Indigenous populations and requires substantial government resources.

The difficulties of CKD prevention in Indigenous populations are compounded by the fact that screening may need to commence much earlier to effectively prevent progression of CKD. In a study comparing Indigenous adults with the participants in the AusDiab study, it was found that Indigenous adults aged 25–34 years were three times as likely to have one of proteinuria, diabetes or hypertension, and ten times more likely to have more than one of these conditions.15 Reflecting this, guidelines have suggested screening for CKD risk factors in Indigenous populations from the age of 18 years.16 However, earlier screening will be limited by resource availability.

Conclusions

Given the huge and increasing burden of CKD and associated cardiovascular disease on the already stressed public health system and society in general, it is necessary to refocus CKD management from treatment to purposeful prevention. Preventing CKD is challenging. Although raising awareness levels and developing accurate screening methods may allow more timely diagnosis, the relevant programs and necessary research are constrained by limited resources. It is therefore imperative that existing resources are used efficiently and that the benefit of the investment is apparent to resource providers. In addition, as prevention is especially challenging and pressing in Indigenous populations, largely owing to socioeconomic disadvantage, it is likely that in some instances, resources may be better used in overcoming socioeconomic disadvantage and other identifiable factors that lead to CKD and associated cardiovascular disease risk. The success of such a shift in focus will require health care professionals to show leadership by driving these initiatives, managing patients with CKD holistically and lobbying providers for adequate resources.

Global inequality in kidney care

From screening to renal replacement therapy, gross inequity exists between affluent and disadvantaged populations

Global inequity in the distribution of both the burden and management of kidney disease is behind the theme of World Kidney Day, 12 March 2015, “Kidney Health for All”.1 It will be observed in Australia later in March.2 Disadvantaged populations experience greater risk, prevalence and progression of chronic kidney disease (CKD); less access to, and worse outcomes from, both dialysis and transplantation; and higher incidence and decreased recovery after acute kidney injury.

Worldwide prevalence of adult CKD is about 10%, reaching up to 50% in high-risk populations, including the Australian Aboriginal and Torres Strait Islander community, for whom CKD prevalence is twice the national average. The prevalence of advanced (stage 4 and 5) CKD is four times higher among Indigenous peoples than among non-Indigenous Australians, and up to 20 times as high among remote and very remote populations. This excess is driven partially by higher prevalences of diabetes mellitus, infectious diseases and poor nutrition;2 and disadvantaged populations have more unrecognised and more untreated CKD.3

One fifth of the world’s population lives in extreme poverty and is subject to increasing rates of CKD and end-stage kidney disease driven by poor health literacy and behaviour, limited health care access, and biological influences such as poor nutrition and genetic factors. These drivers are amplified by pollutants, communicable diseases, unclean water and poor sanitation.4 Agricultural workers in Central America and South Asia are uniquely exposed to nephrotoxic agrichemicals, herbal medicines and contaminated waste. Poor countries in upward economic transition experience higher rates of diabetes, hypertension and obesity.1 From 1990 to 2010 the CKD death rate rose by over 80%, third behind HIV/AIDS and diabetes. A lack of health care resources, including nephrologists, drives a vicious cycle of worse CKD outcomes and heightened cardiovascular risk.3

Recognition of the close association of kidney disease with other non-communicable diseases (NCDs) is growing slowly. CKD is yet to receive the attention given to other NCDs within the World Health Organization and the NCD Alliance.5 Thus, opportunities are lost to link with locally relevant, implementable and cost-effective prevention programs dealing with multiple NCDs. Once detected, CKD requires relatively inexpensive interventions that can substantially slow disease progression. Multifaceted programs have reduced CKD incidence and prevalence in Chile, Cuba, Mexico, Taiwan, the United Kingdom and Uruguay.3

Global inequality of access is even greater when it comes to renal replacement therapy. In 2010, 2.62 million people were receiving renal replacement therapy, 2.05 million dialysis and the remainder transplantation, meeting 25%–50% of global need. Regional renal replacement therapy rates varied from 1840 per million population in North America to 80 per million in Africa; and among individual countries, rates varied from almost 2400 per million to zero.6 Eighty per cent of all renal replacement therapy is provided in North America, Europe and Japan, to less than 20% of the world’s population.7 Unmet need for renal replacement therapy is negligible in the United States, Taiwan, South Korea and Singapore, but huge in mid- and east-African countries. In countries without universal access to health care, dialysis costs can be catastrophic or prohibitive for the individual and family. Often, renal replacement therapy falls apart once no money is left. The need for more affordable renal replacement therapy technologies is urgent.

National prevalence of transplantation also depends on wealth. Renal transplantation is now practised in more than 80 countries but meets only 10% of global need.8 Transplantation outcomes are generally worse among disadvantaged populations, although a small minority of centres in these countries are exceptionally good. National organ donation frameworks, clinical training and cheaper immunosuppressant agents enable increased rates and success of transplantation.

Acute kidney injury follows a similar path. Each year, 85% of about 13.3 million kidney injuries occur in low- and middle-income countries, with about 1.4 million deaths.9 Acute kidney injury predominantly affects the young, due to diarrhoeal diseases, tropical and other infections, nephrotoxins, snakebite and obstetric catastrophes.10 An initiative of the International Society of Nephrology, 0 by 25, aims for no deaths from acute kidney injury globally by 2025. Inexpensive, easy and accurate measurement of serum creatinine, training in assessment of urinary sediment and volume status, and the availability of affordable, usually peritoneal, dialysis will be needed to achieve this goal.

Reduction in the global burden of acute kidney injury, CKD and end-stage kidney disease and greatly improved worldwide access to renal replacement therapy should be achieved within decades, especially as new, low-cost technologies become available. A more informed medical profession and community can lead the way with advocacy and innovation in achieving better — and more equitable — kidney health for all citizens.

Survival of Indigenous Australians receiving renal replacement therapy: closing the gap?

Aboriginal and Torres Strait Islander people (respectfully referred to hereafter as Indigenous Australians) have a higher incidence of end-stage kidney disease requiring renal replacement therapy (RRT) than non-Indigenous Australians.1,2 A high proportion of Indigenous patients come from rural and remote areas,3 which are associated with markers of poorer socioeconomic status.4 They are more likely to receive haemodialysis and much less likely to receive a kidney transplant than non-Indigenous Australians.1,5

In the past 10 years, there have been concerted efforts across Australia to provide dialysis services in more remote areas.6 While providing support for self-care home haemodialysis and peritoneal dialysis in remote Australia has been challenging,79 haemodialysis units supported by nurses have been established in small towns and communities. The impact of remoteness on quality of life for Indigenous RRT patients has been well described,10 but its effect on survival has not. We do know that there is a small increase in the risk of death associated with increasing remoteness for non-Indigenous people receiving RRT.11

Emerging evidence in reports on the outcomes of RRT for Indigenous Australians suggests that there has been a significant gap in survival between Indigenous and non-Indigenous Australians in the past,12,13 but that this may have been narrowing.14 Past studies have predated service delivery changes, concentrated on specific regions only12,15 or examined dialysis modalities and transplant survival separately1618 rather than consider the outcome from the start of treatment for all patients regardless of their initial or subsequent RRT modality.

In this registry-based study, we sought to describe all-cause mortality for Indigenous Australians commencing RRT over time, taking remoteness into account, and to compare this with all-cause mortality for non-Indigenous Australians commencing RRT.

Methods

Study population

The Australia and New Zealand Dialysis and Transplant Registry (ANZDATA) collects observational data on all patients receiving chronic RRT in Australia and New Zealand; these data are submitted by treating renal units. This study included all patients aged 15 years or more who commenced RRT between 1 January 1995 and 31 December 2009 and who were maintained on RRT for more than 90 days to create three equal 5-year period-inception cohorts (1995–1999, 2000–2004, 2005–2009, inclusive). Patients were followed until 31 December 2011. We compared Indigenous Australians (those who self-identify as being of Aboriginal or Torres Strait Islander origin) with non-Indigenous Australians (including those of any other ethnicity who commenced RRT in Australia).

Data collection

Comorbid conditions reported at commencement of RRT included coronary artery disease, peripheral vascular disease, cerebrovascular disease, chronic lung disease and diabetes. Comorbid conditions were recorded in three categories: no, yes or suspected. For this analysis, “no” and “suspected” were combined. Body mass index (BMI) was calculated from height and weight data at commencement of RRT. Late referral was defined as commencing RRT within 3 months of being referred to a nephrologist and data were collected from 1 April 1995.

Postcode data at commencement of RRT were collected from 1 April 1995. An Australian Bureau of Statistics correspondence file19 was used to map postcodes onto the Accessibility and Remoteness Index of Australia (ARIA+), a system based on the physical distance by road from each location point to the nearest town or service centre. This creates a five-category classification of remoteness: major cities, inner regional, outer regional, remote and very remote areas.

Statistical analyses

The outcome for the study was all-cause mortality. Patient data were censored at 5 years after commencement of RRT, at the date of recovery of renal function or at the date of last known follow-up if they had not died previously.

The probability of survival to 5 years after the commencement of RRT was assessed by calculating Kaplan–Meier failure curves20 with groups compared by the log-rank test.

Using the Cox proportional hazards (PH) model, analysis of the hazard of death was performed using interaction terms between Indigenous status and cohort, and Indigenous status and remoteness category. Variables were added to this model to determine which contributed most to the outcome of the final model. Explanatory variables included cohort, Indigenous status, age, sex, comorbid conditions, BMI categories, late referral and remoteness category. Interactions between variables thought likely based on knowledge of the literature were modelled; the difference in calculated effect on the hazard ratio was less than 20% for all those assessed. For all Cox PH models, the Efron method was used for resolving ties and the PH assumption was assessed by two different graphical means.21 Sensitivity analysis was conducted considering only confirmed comorbid conditions compared with both confirmed and suspected comorbid conditions combined on the outcome of the full Cox PH model.

All analyses were conducted using Stata/MP4 12.1 (StataCorp). Approval for the study was granted by the combined Human Research Ethics Committee of the Northern Territory Department of Health & Menzies School of Health Research (HREC-2011-1634); this process included an assessment by an Aboriginal ethics subcommittee with veto powers.

Results

Appendix 1 shows a flow chart of the study population and how the cohort of 27 488 patients available for study was derived. Baseline characteristics of the population available for study are outlined in Box 1, separated by cohort and Indigenous status. Data were censored for 78 patients at the date of recovery of renal function, and for 43 patients at the date of last known follow-up.

Indigenous patients commencing RRT were 10–12 years younger and more likely to be female and to have diabetes than non-Indigenous patients. Indigenous patients were more likely to have lower levels of endogenous kidney function at commencement of RRT, to be “late referred”, and to come from outer regional, remote or very remote regions than non-Indigenous patients. Far fewer Indigenous patients received kidney transplants in the first 5 years of treatment.

There were also important differences between cohorts for both Indigenous and non-Indigenous patients. Compared with the earliest cohort, patients in later cohorts were older, more likely to be male and more likely to have diabetes or coronary artery disease. Later cohorts also had a higher proportion of overweight and a lower proportion of underweight patients, and mean endogenous kidney function was higher. Of particular note, the rise in age for non-Indigenous patients was greater than that for Indigenous patients.

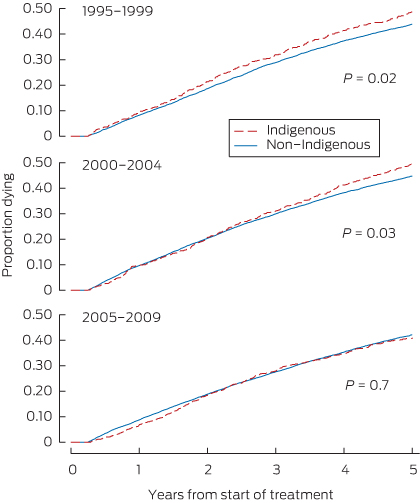
Years of follow-up, the number of deaths and the death rate for each cohort and patient group are shown in Box 2, and Kaplan–Meier failure curves are shown in Box 3. The log-rank test confirmed a significant difference in the risk of death between Indigenous and non-Indigenous patients for 1995–1999 (P = 0.02) and 2000–2004 (P = 0.03) but not for 2005–2009 (P = 0.7).

A Cox PH model including only the main effects and interaction term between cohort and Indigenous status showed a small increase in the hazard ratio for death for Indigenous compared with non-Indigenous patients in earlier cohorts but no difference in the 2005–2009 cohort (Appendix 2). A dramatically different picture emerged once age was added to the model, with a greatly increased hazard ratio for Indigenous patients in all cohorts (Appendix 2). This second model also shows higher mortality rates for earlier cohorts compared with the 2005–2009 cohort of non-Indigenous patients.

This difference in mortality rates was attenuated but still clear in the fully adjusted Cox PH model that included all other comorbidity, late referral and remoteness terms (Box 4). There was no evidence of interaction by age or diabetes status or late referral on the relationship between Indigenous status and mortality (data not shown). However, different categories of remoteness interacted with the relationship between Indigenous status and mortality to varying degrees.

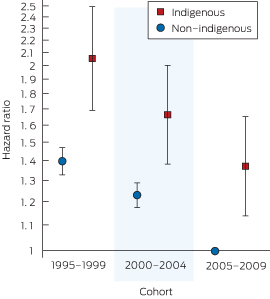
Box 5 shows the impact of the Indigenous–cohort interaction on the mortality hazard. Adjusting for all other variables, the mortality risk improved for both non-Indigenous and Indigenous patients over time. However, the risk was higher in all cohorts for Indigenous compared with non-Indigenous patients in each remoteness category (Box 4): the cohort interaction terms were not statistically significant (χ2 = 1.14; df = 2; P = 0.6).

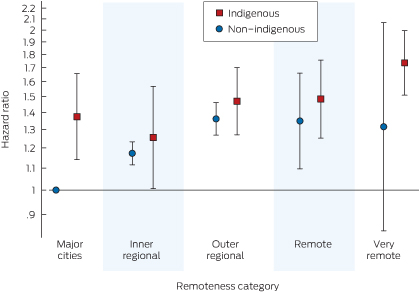
The Indigenous–remoteness interaction terms are highlighted in Box 6. Although non-Indigenous patients from major capital cities had a lower hazard than non-Indigenous patients from other regions, this was not the case for Indigenous patients (Box 4); however, the remoteness category interaction terms were not significant overall (χ2 = 6.17; df = 4; P = 0.2).

Discussion

In this analysis of all people commencing RRT in Australia from 1995 to 2009, we found that there was a survival difference between Indigenous and non-Indigenous patients in the past that appears to have closed more recently when assessed by methods without adjustment for the substantial differences in the patient populations.

With adjustment (particularly for age and diabetes), it became apparent that survival for both Indigenous and non-Indigenous patients has indeed improved over time despite an increasing burden of comorbid conditions. However, the gap in survival between Indigenous and non-Indigenous patients has not narrowed.

The use of interaction terms allowed us to incorporate into one model factors of interest that may affect Indigenous and non-Indigenous patients differently. While increasing the complexity of the analysis, this enabled us to explore how any disparity between Indigenous and non-Indigenous patients varies over time and remoteness categories. By doing so, we have shown not only that a difference in adjusted risk of death continues between Indigenous and non-Indigenous patients, but also that this difference has been maintained over the past 15 years in the face of improvements in both non-Indigenous and Indigenous survival.

In addition, we have shown that that the relationship between remoteness category and mortality is different for Indigenous and non-Indigenous patients. For all cohorts, an Indigenous patient from a major capital city had a greater risk of death than a similar non-Indigenous patient; differences for other regions are less apparent. The variation in the risk of death by remoteness for non-Indigenous patients remains similar to previously published findings.11 Despite efforts to provide dialysis treatments closer to home in recent years, the risk of death for Indigenous patients from very remote areas remains higher than for those in major cities (Box 6).

When interpreting the results of the fully adjusted Cox PH model, it is important to remember that the Indigenous and non-Indigenous patient populations remain quite different, and that they both have changed over the period studied. For example, while the hazard ratio for diabetes applies equally to both groups, up to 79.4% of Indigenous patients have diabetes compared with rates half that or less for non-Indigenous patients. Similar differences exist for many other measured variables, particularly late referral (which remains more likely for Indigenous patients despite recent improvements) and age (which has become increasingly older in the non-Indigenous population over the period of the study) (Box 1).

There are clear differences between Indigenous and non-Indigenous patients in their likelihood of being treated with different RRT modalities, particularly kidney transplantation. The difference between Indigenous and non-Indigenous survival is smaller if transplantation is considered separately (data not shown), suggesting that the lower transplant rate for Indigenous patients may be contributing to their higher risk of death after starting RRT, poorer outcomes notwithstanding.16,17 Since fewer Indigenous patients receive transplants, it is reasonable to assume that those few who do are carefully selected and that those Indigenous patients remaining on dialysis will include a number who may well have had a transplant if they were non-Indigenous. This latter group may have a better prognosis than other patients being treated by dialysis. To avoid this susceptibility bias, for our initial analysis, we assessed survival by pooling all patients together regardless of their initial or subsequent treatment modality, as was done in previous studies.22,23 Treatment modalities were not included as a term in any Cox PH models for the same reason. As a result, this study adds to previous work1218 more recent data that are national in scope and encompasses all RRT modalities.

The increased hazard for death for Indigenous patients receiving RRT, once other baseline variables recorded within ANZDATA are taken into consideration, requires explanation. Of note, similar studies from overseas examining survival differences for people starting RRT have shown better adjusted survival rates for those from minority groups,23,24 or at least equal survival in the case of aboriginal patients from the Prairie Provinces of Canada.22 Many Indigenous Australians receiving RRT come from more remote settings than these overseas minority groups, but this does not explain the persistent increased hazard of death for Indigenous Australians from major capital cities. There may be different patterns of referral for RRT in different countries, although in all those quoted, the costs of RRT are covered by some form of national health insurance. The much lower likelihood of Indigenous Australian patients receiving a kidney transplant compared with non-Indigenous Australians accounts for only some of the difference between the two groups.

There are limitations inherent in this study. Data on characteristics such as social and economic circumstances that may confound Indigenous status are not collected within ANZDATA and are challenging to tease out even with existing Australian Bureau of Statistics Census area data.25 It is possible that the recorded postcode of residence for Indigenous people is inaccurate.3 Comorbidity data captured in ANZDATA are imperfect, in part because they are based on the opinion of the treating physician rather than objectively defined criteria. There is also no information on the severity of comorbid conditions. The analysis examined baseline characteristics only, rather than changes in comorbidity over time. This approach was taken to provide useful information to clinicians discussing prognosis with patients considering RRT.

The improving underlying probability of survival for both Indigenous and non-Indigenous patients starting RRT, once recorded factors are considered, makes the use of these data for predicting survival patterns challenging. Nevertheless, it is sobering to consider that the risk of death after starting RRT still outstrips that for many other diseases, including many cancers (Box 3). As a result, the highest priority must be to prevent as many people as possible (both Indigenous and non-Indigenous) from developing end-stage kidney disease in the first place.

1 Characteristics of the whole population of 27 488 patients at first treatment, by time period and Indigenous status


1995–1999 (n = 6925)


2000–2004 (n = 9059)


2005–2009 (n = 11 504)


Characteristic

Non-Indigenous (n = 6321)

Indigenous (n = 604)

Non-Indigenous (n = 8232)

Indigenous (n = 827)

Non-Indigenous (n = 10 417)

Indigenous (n = 1087)


Male

3712 (58.7%)

254 (42.1%)

4983 (60.5%)

371 (44.9%)

6491 (62.3%)

481 (44.3%)

Mean (median) age

57.1 (60.4) years

48.5 (48.4) years

60.3 (63.6) years

50.9 (51.1) years

61.8 (64.5) years

51.0 (51.5 ) years

Median estimated glomerular filtration rate

5.3 mL/min/1.73m2

4.3 mL/min/1.73m2

5.8 mL/min/1.73m2

4.7 mL/min/1.73m2

7.1 mL/min/1.73m2

5.7 mL/min/1.73m2

Late referral

1338 (21.2%)

212 (35.1%)

1967 (23.9%)

303 (36.6%)

2217 (21.3%)

313 (28.8%)

Comorbid conditions


Diabetes

1696 (26.8%)

423 (70.0%)

2664 (32.4%)

643 (77.8%)

4177 (40.1%)

863 (79.4%)

Coronary

1826 (28.9%)

125 (20.7%)

2573 (31.3%)

225 (27.2%)

3627 (34.8%)

365 (33.6%)

Cerebrovascular

643 (10.1%)

37 (6.1%)

876 (10.6%)

84 (10.2%)

1309 (12.6%)

103 (9.5%)

Peripheral vascular

1204 (19.0%)

78 (12.9%)

1504 (18.3%)

189 (22.9%)

1966 (18.9%)

212 (19.5%)

Lung

666 (10.5%)

64 (10.6%)

922 (11.2%)

97 (11.7%)

1307 (12.5%)

134 (12.3%)

Body mass index (BMI)


Mean BMI

25.3 kg/m2

26.8 kg/m2

26.4 kg/m2

26.9 kg/m2

27.6 kg/m2

28.8 kg/m2

BMI < 18.5 kg/m2 (underweight)

340 (5.4%)

37 (6.1%)

346 (4.2%)

45 (5.4%)

350 (3.3%)

41 (3.8%)

BMI 18.5–30 kg/m2

5011 (79.3%)

410 (67.9%)

6101 (74.1%)

564 (68.2%)

7080 (68.0%)

636 (58.5%)

BMI > 30 kg/m2 (obese)

970 (15.3%)

157 (26.0%)

1785 (21.7%)

218 (26.4%)

2987 (28.7%)

410 (37.7%)

Remoteness classification


Major city

4572 (72.3%)

99 (16.4%)

5981 (72.7%)

108 (13.1%)

7428 (71.3%)

158 (14.5%)

Inner regional

1146 (18.1%)

60 (9.9%)

1560 (18.9%)

68 (8.2%)

2019 (19.4%)

101 (9.3%)

Outer regional

534 (8.5%)

186 (30.8%)

605 (7.4%)

268 (32.4%)

858 (8.2%)

277 (25.5%)

Remote

57 (0.9%)

97 (16.1%)

69 (0.8%)

172 (20.8%)

85 (0.8%)

199 (18.3%)

Very remote

12 (0.2%)

162 (26.8%)

17 (0.2%)

211 (25.5%)

27 (0.3%)

352 (32.4%)

Renal replacement therapy at start of treatment


Haemodialysis

4506 (71.3%)

501 (83.0%)

5904 (71.7%)

695 (84.0%)

7439 (71.4%)

887 (81.6%)

Peritoneal dialysis

1704 (27.0%)

102 (16.9%)

2090 (25.4%)

131 (15.8%)

2574 (24.7%)

198 (18.2%)

Transplant

111 (1.8%)

1 (0.2%)

238 (2.9%)

1 (0.1%)

404 (3.9%)

2 (0.2%)

Transplant by 5 years

1681 (26.6%)

84 (13.9%)

1941 (23.6%)

62 (7.5%)

2235 (21.5%)*

66 (6.1%)*


* Follow-up to 5 years not complete for the 2005–2009 cohort.

2 Years of follow-up, number of deaths and mortality rate for the whole cohort of 27 488 patients


1995–1999 (n = 6925)


2000–2004 (n = 9059)


2005–2009 (n = 11 504)


Variable

Non-Indigenous (n = 6321)

Indigenous (n = 604)

Non-Indigenous (n = 8232)

Indigenous (n = 827)

Non-Indigenous (n = 10 417)

Indigenous (n = 1087)


Cumulative years of follow-up (excluding first 90 days)

22 818.5

2103.6

29 201.4

2895.1

31 394.4

3348.2

Number of deaths

2772

294

3678

409

3660

381

Mortality rate (per 100 patient-years)

12.15

13.98

12.59

14.13

11.66

11.38

3 Kaplan–Meier failure curves of Indigenous versus non-Indigenous patients in the three cohorts receiving renal replacement therapy*


* No censoring for transplantation.

4 Hazard ratios from fully adjusted Cox proportional hazards models for death by 5 years after starting renal replacement therapy

Variable

Hazard ratio (95% CI)


Cohort*


1995–1999 (Indigenous:non-Indigenous)

1.47 (1.21–1.79)

2000–2004 (Indigenous:non-Indigenous)

1.35 (1.12–1.63)

2005–2009 (Indigenous:non-Indigenous)

1.37 (1.14–1.66)

Age (per year increase)

1.047 (1.045–1.049)

Sex (male:female)

0.89 (0.86–0.93)

Diabetes (yes:no)

1.44 (1.38–1.50)

Peripheral vascular disease (yes:no)

1.43 (1.37–1.50)

Cerebrovascular disease (yes:no)

1.26 (1.20–1.33)

Lung disease (yes:no)

1.36 (1.29–1.43)

Coronary artery disease (yes:no)

1.34 (1.29–1.40)

Body mass index < 18.5 kg/m2 (:18.5–30 kg/m2)

1.54 (1.42–1.69)

Body mass index > 30 kg/m2 (:18.5–30 kg/m2)

0.96 (0.92–1.01)

Late referral (yes:no)

1.27 (1.22–1.32)

Remoteness classification


Major city (Indigenous:non-Indigenous)

1.37 (1.14–1.66)

Inner regional (Indigenous:non-Indigenous)

1.07 (0.86–1.34)

Outer regional (Indigenous:non-Indigenous)

1.08 (0.92–1.26)

Remote (Indigenous:non-Indigenous)

1.10 (0.84–1.43)

Very remote (Indigenous:non-Indigenous)

1.33 (0.82–2.11)


* The hazard ratio for each cohort for Indigenous compared with non-Indigenous patients is calculated as Indigenous status × cohort × Indigenous/cohort interaction term × Indigenous/remoteness interaction term for major capital cities (Figure 2).

† The hazard ratio for each remoteness area for Indigenous compared with non-Indigenous patients is calculated as Indigenous status × remoteness classification × Indigenous/remoteness interaction term × Indigenous/cohort interaction term for 2005–2009 (Figure 3).


5 Adjusted risk of death* for patients in the three cohorts living in major capital cities, by Indigenous status


* Adjusted for age, sex, late referral and comorbid conditions (diabetes, coronary artery disease, peripheral vascular disease, cerebrovascular disease, lung disease) and body mass index < 18.5 kg/m2 and > 30 kg/m2.

6 Adjusted risk of death* for remoteness areas for the 2005–2009 cohort, by Indigenous status


* Adjusted for age, sex, late referral and comorbid conditions (diabetes, coronary artery disease, peripheral vascular disease, cerebrovascular disease, lung disease) and body mass index < 18.5 kg/m2 and > 30 kg/m2,

Renal replacement therapy associated with lithium nephrotoxicity in Australia

To the Editor: Adam1 contends that Roxanas and colleagues2 have overemphasised the risk of renal replacement therapy (RRT) associated with lithium treatment. I disagree.

Lithium nephrotoxicity appears to require about a decade of treatment to develop3 and a further 10–20 years before RRT is necessary.3,4 Adam inappropriately divides the number of incident cases of RRT attributed to lithium use by the number of patients currently taking lithium. Rather, cumulative incidence estimates for RRT derived from cohort studies are required.5

Adam calculates that the risk of RRT due to lithium use is lower in Australia than in Sweden, but he uses prevalent cases from Sweden and incident cases from Australia. I calculate that, over a 5-year period, the average annual incident rate of RRT attributed to lithium use per million population is 0.82 in Sweden (95% CI, 0.41–1.47)3 compared with 0.78 in Australia (95% CI, 0.67–0.90).2 The current prevalence of lithium prescribing is also similar — 1150 per million in Australia2 and 1255 in Sweden3 — although, given the lags involved, historical comparisons would be of interest.

Renal replacement therapy associated with lithium nephrotoxicity in Australia

To the Editor: The article by Roxanas and colleagues1 is a welcome addition to the body of literature that clearly demonstrates a causal relationship between lithium use and chronic renal failure. The recommendation to monitor renal function 6-monthly and be hypervigilant to deteriorating renal function is sound clinical advice.

However, I question the recommendation that clinicians should consider stopping lithium and using other suitable mood stabilisers (eg, sodium valproate) if two consecutive readings suggest decrease in renal function, or if the estimated glomerular filtration rate is < 45 mL/min/1.73 m2.

I believe it is more clinically prudent to refer patients who have deteriorating renal function to a nephrologist, who can determine the cause.

I do this routinely and two trends have emerged. The first is that most but not all individuals who are taking lithium and who have deteriorating renal function have interstitial fibrosis, the putative renal abnormality caused by lithium.

When individuals with interstitial fibrosis are switched from lithium to other mood stabilisers, many have a stormy clinical course and never achieve the mood stability they had previously experienced with lithium.

Renal replacement therapy associated with lithium nephrotoxicity in Australia

In reply: We welcome valuable comments in response to our article on lithium and end-stage renal disease (ESRD).1 This is an area that warrants further discussion and additional data. Our study, the first comprehensive epidemiological analysis of the link between lithium nephropathy and ESRD in any country, indicated a progressive increase in the problem in Australia between 1991 and 2011.

We have had difficulty determining whether this increase was due to increased lithium use, given that ESRD is usually associated with prolonged exposure (typically 20 years or more) and that complete data on lithium use in Australia are only readily available since 1995.

We accept that lithium is often an effective mood stabiliser that only sometimes causes toxicity. However, we believe that prescription of a drug that can propel people toward permanent dialysis or transplantation requires caution. We therefore applaud Saboisky’s practice as a psychiatrist of conjointly managing patients with a nephrologist. We do similarly.

We also endorse the call for more accurate diagnosis of renal disease, especially as bipolar disorder is often associated with risk factors such as smoking, obesity and poor diet. Our study showed that few patients with suspected lithium-induced kidney disease undergo renal biopsy, and we suggest that nephrologists could consider modifying this deficiency.

Spiralling into the nephrotic syndrome

Clinical record

A 35-year-old white woman presented to a peripheral hospital emergency department 18 days after giving birth to her second child at 33 weeks and 3 days of gestation. She had significant weight gain and increasing peripheral oedema that had started 12 days after the birth. She had no history of breathlessness, rash, ulcers, photosensitivity, arthralgia, recent travel, use of non-steroidal anti-inflammatory drugs or use of recreational drugs. Both of her pregnancies had been complicated by hypertension, without proteinuria, and gestational diabetes, which had resolved spontaneously after each birth. Results of tests performed during the second trimester of her second pregnancy are shown in Box 1. Her past medical history included Raynaud phenomenon and adult attention deficit disorder, which was well controlled with dexamphetamine. She was a non-smoker and non-drinker and in a stable long-term relationship. She was referred by the peripheral hospital to the renal clinic of a large metropolitan hospital with suspected nephrotic syndrome.

The patient was reviewed in the renal clinic 21 days after the birth. On physical examination, her weight was 73 kg and both of her legs had marked pitting oedema. No rashes, lymphadenopathy or joint swelling were evident. Tests confirmed the nephrotic syndrome with a serum albumin level of 22 g/L (reference interval [RI], 35–50 g/L) and heavy proteinuria (urinary protein-to-creatinine ratio, 1060 mg/mmol [RI, < 13 mg/mmol]). There was no haematuria and her renal function was normal (serum creatinine level, 53 µmol/L [RI, 45–90 µmol/L]; estimated glomerular filtration rate, > 90 mL/min/1.73 m2 [RI, > 60 mL/min/1.73 m2]). She was started on oral frusemide 80 mg twice daily and ramipril 1.25 mg once daily. On review 3 days later, her physical examination findings were unchanged. Results of further tests are shown in Box 1. Results of serological tests for antibodies directed against M-type phospholipase A2 receptors and serological tests for lupus were negative. As her condition had not improved, a renal biopsy was performed.

Light microscopy showed subtle glomerular changes in the biopsy specimen, including a minor increase in mesangial matrix, subtle thickening of the capillary loops, inflammatory cells in the capillary loops and a suggestion of subepithelial deposits plus background vascular changes associated with hypertension (Box 2, A). Immunofluorescence microscopy showed moderate granular staining for IgG (Box 2, B) and C1q (Box 2, C) in capillary loops but minimal staining for C3. A definitive diagnosis could not be made on the basis of these results, so the sample was analysed by electron microscopy. This revealed subepithelial deposits (Box 2, D), which, coupled with the distribution of IgG on immunofluorescence microscopy, favoured a diagnosis of membranous glomerulonephritis.

The presence of C1q and inflammatory cells in capillary loops is uncommon in primary membranous glomerulonephritis, so a secondary cause was suspected and the patient underwent further testing. She had a significantly elevated rapid plasma reagin (RPR) titre of 1 : 256 and the diagnosis of active treponemal infection was confirmed by the presence of Treponema pallidum IgM and a positive T. pallidum particle agglutination test result (a reading of 4+). She was given 1.8 g (2.4 million units) of benzathine penicillin by intramuscular injection and was screened for other sexually transmitted infections, for which results were all negative. Her baby was urgently assessed for congenital syphilis and found to be unaffected clinically. On further questioning, it was determined that the patient was likely to have acquired the disease 2 months before giving birth (during the second trimester) from her partner, who had noted a generalised rash and genital lesions at that time.

At 2-month follow-up, the patient’s oedema had completely resolved, her weight had decreased to 63 kg and her proteinuria had lessened (urinary protein-to-creatinine ratio, 70 mg/mmol). Frusemide and ramipril therapy were therefore withdrawn. She had a RPR titre of 1 : 32; this fourfold reduction is consistent with adequate treatment of the infection. At 7-month follow-up, her proteinuria had completely resolved (urinary protein-to-creatinine ratio, 5 mg/mmol) and her RPR titre was 1 : 8.

Syphilis is caused by the spirochaete bacterium Treponema pallidum. It is a re-emerging infection in the Western world.1 In Australia, there has been a marked increase in primary and secondary syphilis infections among non-Indigenous Australians over the past decade, particularly in men from metropolitan areas who are aged 20 years or older. During the same period, incidence rates for Indigenous people have fallen dramatically as a result of screening and preventive strategies.2

Syphilis is known as “the great mimic” owing to the wide range of clinical presentations. Primary syphilis usually presents as a highly contagious ulcerated lesion (chancre) that appears 2–6 weeks after infection. Secondary syphilis manifests after haematogenous and lymphatic dissemination; symptoms include a non-itchy generalised rash, lymphadenopathy, fever and malaise and, less commonly, hepatitis, iritis, neurological symptoms and nephritis. Tertiary syphilis affecting the cardiovascular system or brain is a late manifestation and occurs after an incubation period of up to 15 years. Congenital syphilis remains a significant cause of stillbirth, preterm labour and neonatal disease.3 When syphilis is detected early, treatment with benzathine penicillin can prevent long-term complications.

Renal manifestations of syphilis have been recognised since the 18th century.4 Proteinuria is the most common renal manifestation and occurs in up to 8% of patients with secondary syphilis.5 In addition to membranous nephropathy (MN) (eg, membranous glomerulonephritis), a variety of other renal conditions have been reported, including mesangioproliferative glomerulonephritis, rapidly progressive crescentic glomerulonephritis, and minimal change disease.5

MN is the most common cause of nephrotic syndrome in middle-aged white people and is characterised by formation of immune complexes on the subepithelial side of the glomerular capillaries. Although MN is usually primary (idiopathic), secondary causes should be considered if atypical histological features are found (as in our patient’s case).6 Secondary causes of MN include drugs (non-steroidal anti-inflammatory drugs, auranofin [a gold-containing compound] and captopril), autoimmune disease (systemic lupus erythematosus), infections (hepatitis B, hepatitis C and syphilis) and malignancies (particularly lung, stomach, colon, breast, prostate and kidney).7 About 70% of primary MN is caused by autoantibodies directed against the M-type antiphospholipase A2 receptor — a protein present on glomerular podocytes. Deposition of this antibody and the formation of subepithelial immune complexes results in complement-mediated podocyte injury and proteinuria.6,8

The initial management of MN includes salt and fluid restriction, treatment with diuretics, and renin–angiotensin–aldosterone system inhibition to reduce oedema and minimise proteinuria. Prophylactic anticoagulation is recommended in patients with serum albumin levels of less than 20 g/L. Immunosuppression may be indicated to control disease in patients with primary MN who have progressive renal impairment and persisting nephrotic range proteinuria, but secondary MN often resolves after elimination of the underlying cause.

With the worldwide resurgence of sexually transmitted diseases, and the increase in treponemal infections occurring in Australia, clinicians should remain vigilant of the different clinical manifestations of syphilis.

Lessons from practice

  • Syphilis is a re-emerging sexually transmitted disease in non-Indigenous Australians and clinicians should be vigilant of the various clinical manifestations.
  • Syphilis should be considered in the differential diagnosis of membranous nephropathy.
  • Proteinuria is the commonest renal manifestation of syphilis.
  • When syphilis is detected early, treatment with benzathine penicillin can prevent long-term complications.

1 Results of tests done during and after pregnancy


2nd trimester


24 days after birth


Blood and urine tests

Result

Reference interval

Result

Reference interval


Haemoglobin level (whole blood)

115 g/L

115–160 g/L

112 g/L

115–160 g/L

Platelet count (whole blood)

325 × 109/L

150–400 × 109/L

518 × 109/L

150–400 × 109/L

Serum albumin level

26g/L g/L

35–50 g/L

2-hour blood glucose level during oral glucose tolerance test

8.9 mmol/L

≥ 8.0 mmol/L consistent with gestational diabetes mellitus

Urinary protein*

Trace

Negative

+++

Negative

Serum creatinine level

68 µmol/L

45–90 µmol/L

70 µmol/L

45–90 µmol/L

Erythrocyte sedimentation rate

127 mm/h

1–20 mm/h

Urinary protein-to-creatinine ratio

577 mg/mmol

< 13 mg/mmol

Hepatitis B surface antigen

Not detected

na

Not detected

na

Hepatitis C antibodies

Not detected

na

Not detected

na

HIV antibodies

Not detected

na

Not detected

na

Varicella–zoster virus antibodies

Not detected

na

Rubella IgG

63 IU/mL

≥ 10.0 IU/mL presumed immune

Syphilis antibodies

Not detected

na

Thyroid-stimulating hormone

2.5 mU/L

0.4–4.0 mU/L

Antinuclear antibodies

4 IU/mL

< 7 IU/mL

Anti-Sjögren syndrome antigen A antibodies

Not detected

na

Anti-double-stranded DNA antibodies

Not detected

na

C3

1.35 g/L

0.78–1.50 g/L

C4

0.30 g/L

0.16–0.52 g/L

Antiphospholipase A2 receptor antibodies

Not detected

na


na = not applicable. * Measured by dipstick testing. † Measured by Treponema pallidum haemagglutination assay.

2 Results of histopathological analysis of renal biopsy specimen


A: Light microscopy showed a minor increase in the glomerular mesangial matrix and subtle thickening of the capillary loops (Masson trichrome stain; original magnification, × 400). B: Immunofluorescence microscopy showed moderate granular staining for IgG in capillary loops (original magnification, × 400). C: Immunofluorescence microscopy showed moderate staining for C1q in capillary loops (original magnification, × 400). D: Electron microscopy showed frequent and variously sized subepithelial electron-dense deposits (arrows) (original magnification, × 4000).

The power of systems thinking in medicine

The convergence of seemingly small events accruing over time can have severe consequences. This is
a central message of many aircraft accident investigations. For instance, an attempt to streamline maintenance procedures for an engine mount created the conditions for the United States’ deadliest aeroplane crash
in 1979 (http://www.airdisaster.com/reports/ntsb/AAR79-17.pdf). The investigation found a constellation of interacting factors — design deficiencies, faulty maintenance practice, failures of regulatory oversight and flawed aviation industry economics. As noted in relation
to a later aeroplane crash (http://www.theatlantic.com/magazine/archive/1998/03/the-lessons-of-valujet-592/306534), it was a “system accident”. The complexity of aviation systems creates conditions for small changes to interact with other system elements across technical, organisational and cultural domains to produce significant outcomes that are hard to predict and control.

All clinicians recognise the complexity of health care delivery. The system accident idea has been adopted enthusiastically by some exponents of ways to improve clinical safety, despite more recent reservations about its applicability (Health Serv Res 2006; 41: 1654-1676). Nevertheless, the assessment of clinical mishaps and adverse events requires a systems approach (not only technical, but also organisational, social and cultural).

As a starting point, registries are powerful tools for systematically detecting and monitoring clinical problems and adverse events, and for informing interventions. The study by Roxanas and colleagues of Australia and New Zealand Dialysis and Transplant Registry data (doi: 10.5694/mja13.10435) shows that the incidence of end-stage renal failure due to lithium therapy, although small, is growing. They express concern that accepted doses of lithium over a long time may result in irreversible renal impairment and end-stage disease, reinforcing the need for regular and frequent monitoring of renal function. Registry data analysis is the monitoring system providing the backbone for reducing risks for those receiving lithium therapy.

There is also a need for systems to oversee and analyse incidents in whole areas of health care. Cunningham
and colleagues (doi: 10.5694/mja13.11347) point out that, in the case of chiropractic practice, there is little in place for monitoring
for adverse incidents. Without such a system, proper investigation of incidents in chiropractic care cannot occur.

Significantly greater challenges exist in assessing
health impacts of activities with complex influences from societal and cultural practices in the community. Clenbuterol — a β2-adrenergic agonist with anabolic as well as bronchodilating properties, registered only for veterinary use and banned in sport — is now illicitly used in the community to aid bodybuilding and weight loss. Brett and colleagues (doi: 10.5694/mja13.10982) report a case series of clenbuterol toxicity reported to the NSW Poisons Information Centre. Details of cases suggest that it is also being used for deliberate self-harm,
and that accidental ingestion has occurred. While the authors acknowledge that the study presents an incomplete picture
of actual use in the community, would a deeper engagement with ideas from complexity science help in understanding the complexity of substance misuse? What additional systems need to be put in place for us to know and perhaps anticipate changing patterns of use?

No matter how complex the health problem, data registries will always have a central role in disease and health care monitoring and practice. Presently, patients often need to explicitly consent to their information being added to a registry. Olver (doi: 10.5694/mja13.10695) examines the ethical dimensions of opt-out consent, where patient data are automatically added unless consent is expressly refused. He argues that this approach is acceptable in the context of low-risk research and for improving clinical quality. Although not called a registry, the concept has been used for decades in civil aviation for mandatorily collecting flight data and operational feedback from aviation personnel. Only relatively recently have similar approaches taken hold across a broad range of health care activities.

Decades of research and application of safety assurance and improvement systems in aviation and other industries have resulted in a critical respect for the complexity of many human endeavours — the importance of monitoring outcomes and processes, understanding why and how incidents happen, and appreciating the multifaceted nature of the solutions. There are certainly limitations to mapping approaches to aviation safety to health care systems. But the analogy provides a useful starting point and source of ideas. Preventing adverse health outcomes and health care incidents matters enormously to the community. Just as a systems approach has led to civil aviation being appreciably safer, it should also be pursued by those wanting well founded solutions to complex, multidimensional problems in health.

Age, CKD and other kidney messages

Chronic kidney disease in the elderly is common, potentially harmful and amenable to nuanced management

Every March for the past 8 years, the International Society of Nephrology (ISN) and the International Federation of Kidney Foundations have jointly organised World Kidney Day (WKD; http://www.worldkidneyday.org). The purpose of WKD is to increase the awareness of kidney disease among politicians, the general public, general practitioners, physicians, nephrologists and other health care workers. WKD has been taken up with gusto in an increasing number of countries around the world, including Australia, and it is evident that the messages are being heard and to some extent have influenced policy. This year’s WKD will be held on 13 March, around the theme of “Chronic kidney disease (CKD) and aging”. Is this a message as substantive as those of previous WKDs?

Previous messages have been standouts. In 2007, the message was that kidney disease is common (affecting 10% of adults worldwide), harmful (not only from complications of CKD and end-stage kidney disease [ESKD], but also from a substantially increased risk of premature death, especially from cardiovascular causes) and treatable.1 In 2009 and 2010, the nexus between kidney disease and hypertension and diabetes, respectively, was stressed. Hypertension is a major risk factor for CKD and a key therapeutic target.2 The prediction that there will be 1.5 billion hypertensive people on our planet by 20252 is indeed a sobering one! Diabetes, especially type 2, is now the commonest cause of CKD and ESKD in most countries3 — and things are only going to get worse before they get better. By 2025, there will be almost 400 million people worldwide with type 2 diabetes3 and a similar number with impaired glucose tolerance, many of whom will go on to develop CKD. CKD, especially in the presence of proteinuria, is a principal risk factor for cardiovascular disease.4 Cardiovascular risk rises proportionally as kidney function declines; for example, Stage 3 CKD independently carries an almost 50% increased risk of cardiac death, a risk greater than that of diabetes or previous cardiovascular disease. Considering all stages of CKD together, there is a 100-fold greater chance of premature death (especially cardiovascular) than of developing ESKD. Importantly, interventions designed to slow CKD progression and reduce proteinuria appear also to reduce cardiovascular risk.

What began as a risky experiment about 50 years ago has now become routine practice in more than 80 countries around the world; there is no doubt at all that renal transplantation is the best way to replace kidney function in patients with ESKD.5 But, currently, only 10% of global need for kidney transplantation is met, restricted by economic considerations, insufficient donors, too small a trained workforce, immunological barriers and ethical considerations.5 Last year’s WKD focused on acute kidney failure (AKF). The prevalence of AKF is increasing worldwide and most cases are preventable,6 yet prevention and dialytic support during AKF are pipedreams for many countries. In response, the ISN has launched an ambitious program called “0 by 25” with the lofty aim that by 2025 no one should die of untreated AKF in the poorest parts of Africa, Asia and South America.

So is 2014’s WKD message as weighty as its antecedents (Box)? The latest message concerns CKD and ageing.7 Just like the body that surrounds them, kidneys age; a contemporary question is whether this ageing represents progressive CKD. Another key question is whether the automatic reporting of estimated glomerular filtration rate (eGFR) has spawned an epidemic of worried but well elderly people. The answer to the second question is yes and no. Otherwise healthy elderly people with a mild reduction in eGFR are likely to see out their years without any increased risk. However, whatever the cause of impaired eGFR, especially in the presence of proteinuria and with a rate of decline more rapid than expected for age alone, there will be increased risk.8 Despite their age, elderly patients with CKD will benefit from therapies aimed at slowing disease progression, better controlling metabolic derangements, reducing cardiovascular complications and allowing informed choices about ESKD therapy. That greater life expectancy does not necessarily equate with increased years of good health probably applies more to patients with CKD than any other ageing population. But treatment of selected older patients can increase survival, whether that treatment is conservative, dialytic or by transplantation. Older patients have less chance of undergoing transplantation, usually because of their comorbidities, but they can respond well, and various strategies (such as use of marginal and older donors) have increased the donor pool. Older patients with limited comorbidities can do well on dialysis, with improved survival; yet those with comorbidities may do better with non-dialytic, conservative therapy. So messages about CKD are just as important for older patients, and their wise application among older patients may do more for global health than among younger age groups.

What should developed countries be doing to lessen the global burden of kidney disease? Many developed countries must focus on their own groups at high risk of kidney disease, such as the Aboriginal population in Australia. In addition, they can play a key role in helping low-to-middle income countries tackle their kidney disease burden. The ISN directs a large proportion of its budget and efforts towards transformational capacity-building programs, including its Fellowship,9 Sister Renal Centre and other programs.10,11 By an increasing contribution to these programs, Australia can play a key role in the global response to kidney disease.

Important global messages* about kidney disease

2007

CKD is common, harmful and treatable

2009

Hypertension is a major risk factor for CKD

2010

Diabetes is a major risk factor for CKD

2011

CKD is a principal risk factor for cardiovascular disease

2012

Transplantation is the best therapy for ESKD, but is in short supply

2013

AKF is common and preventable

2014

CKD in the elderly is common, and amenable to discerning management


* Messages of World Kidney Day. CKD = chronic kidney disease.
ESKD = end-stage kidney disease. AKF = acute kidney failure.