×

Ensuring access to invasive care for all patients with acute coronary syndromes: beyond our reach?

We need to ensure that those who need care most receive it

Coronary artery disease (CAD) remains the leading cause of death and disability in Australia, with suspected acute coronary syndromes (ACS) being the most common reason for acute presentation to hospital.1 A substantial body of evidence supports the early use of invasive care — coronary angiography and, if appropriate, revascularisation (either by percutaneous coronary intervention [PCI] or coronary artery bypass grafting [CABG]) — in patients presenting with ST-elevation myocardial infarction to reduce mortality and re-infarction rates.2 Evidence and expert opinion also favour invasive management of patients with high risk, troponin-positive non-ST-elevation ACS (NSTEACS).3,4 In patients with stable CAD, there is no evidence for any benefit from invasive care if optimal medical therapy is administered.5 Access to invasive care should be in accordance with clinical need, and this is likely to be greater in populations with a higher prevalence of CAD, CAD-related deaths, and coronary risk factors.

In this issue of the MJA, a large ecological study encompassing the entire population of 61 (former) Medicare Locals and using information from several databases identified associations between socio-economic, geographic and chronic cardiovascular disease factors and ACS incidence and mortality rates.6 Chew and colleagues also examined whether rates of invasive care (coronary angiography being the key measure) were correlated with indicators of disease burden, access to care, and clinician practice.

The study had some limitations. Data were analysed and associations between different variables (presumed to be linear) defined at the population rather than at the individual level; data on private hospital admissions were missing for three of eight state or territory jurisdictions; rates of ACS, invasive care and CAD-related deaths were only adjusted for age and sex, not for other risk factors or measures of disease severity; the likelihood of a patient with suspected ACS receiving coronary angiography was based on a relatively small national snapshot audit (n = 4398) from 8 years ago;7 the timing of invasive care after the ACS event was not provided; and rates of non-invasive co-interventions for ACS were not included in the analysis.

Despite these limitations, some of the key findings are interesting. Rates of angiography and of ACS were only weakly correlated, with no correlation between ACS and PCI rates; these trends were most evident in non-metropolitan areas where CAD mortality was highest. While ACS rates varied 3.7-fold between Medicare Locals, angiography rates varied 5.3-fold. The strongest predictor of angiography being undertaken was admission as a cardiac patient to a private hospital (71 additional angiograms per 1000 admissions), despite lower rates of ACS among private patients, suggesting that many procedures were for non-ACS indications. Coronary revascularisation rates as a proportion of angiography rates varied between 17% and 61%; higher angiograms rates were associated with reduced likelihood that revascularisation followed. There was a reasonably strong positive association between rates of ACS and CABG, suggesting that less invasive PCI is more vulnerable to unwarranted use. Depressingly, the study also reconfirmed the higher ACS rates in non-metropolitan locations where the prevalence of smoking, obesity and chronic cardiovascular disease is higher.

The disparity between rates of invasive care and those of ACS and overall CAD burden probably means that some patients are receiving interventions they do not need, while, more worryingly, patients who have real need for them are missing out. Without data on clinical indications and criteria of appropriateness for individual patients, overuse cannot be distinguished from underuse. Nevertheless, such variations in invasive care, seemingly unexplained by variations in clinical indications, are of concern, especially as they have been documented since 2005.711

So why is universal access to invasive care according to need seemingly beyond our reach? It is not for want of trying on the part of national professional bodies that develop, disseminate and promote evidence-based recommendations and implementation frameworks.12 The answer lies with front line health care delivery systems. Cardiology service networks at the state level should collect data on ACS incidence and rates of invasive care in public and private facilities, identify locations where the mismatch is greatest, and seek to understand and mitigate the relevant factors. Networked, hub-and-spoke support systems of rapid diagnostic, referral and transfer procedures are needed, whereby patients with ACS presenting to any emergency centre have rapid access to invasive care in angiography-capable facilities, in accordance with clinical indications and socio-cultural context, and without logistical barriers.13,14 Hospitals should report on their provision of appropriate ACS care according to agreed care standards and data collection methods, for benchmarking against peers and sharing improvement strategies.15

Invasive care prevents about 10% of all CAD-related deaths, whereas medical treatments and reducing risk factors account for at least 80% of saved lives.16 As Chew and colleagues report, a higher probability of undergoing coronary angiography was associated with only a modest reduction in ACS mortality rates (three fewer deaths per 100 000 population for each 10 percentage point increase in likelihood of angiography). The maximal gain in lives saved after ACS onset will require optimisation of all care modalities along the entire patient trajectory. However, while non-invasive care is not consistently employed across Australia,710 differences in the use of invasive care are more marked and cannot be allowed to persist into the next decade.

[Correspondence] Everolimus in ileum neuroendocrine tumours – Authors’ reply

We thank Thomas Walter and Catherine Lombard-Bohas for their interest in our findings from the RADIANT-4 study.1 Eligible patients in our study had lung or gastrointestinal neuroendocrine tumours with radiological disease progression within 6 months before randomisation.1 Progression was determined by radiology report or by tumour measurements. Most patients (252 [83%] of 302) had disease progression within 3 months before randomisation, with a median time since progression of 1·6 months (unpublished).

More resources, faster internet the key for rural health

Rural doctors have overwhelmingly identified the need for improved public hospital funding and better internet access as the most important solutions for rural health care.

In the first AMA survey of rural doctors since 2007, GPs, other specialists, salaried doctors and doctors in training were asked to rank in importance 20 proposed solutions to improve the health of rural Australians.

Almost 600 doctors took part in the 2016 AMA Rural Health Issues Survey in April.

And, as they did in 2007, they nominated “provide extra funding and resources to support improved staffing levels, including core visiting medical officers, to allow workable rosters” as their top priority.

In a sign of the growing use of internet-based communications and data, access to high-speed broadband was not a survey option nine years ago, but was ranked as second-most important in this year’s survey.

Ensuring that rural hospitals have modern facilities and equipment rose one space to third, and encouraging medical colleges to include rotations for trainees to rural areas rose from sixth to fourth.

Related: Rural doctors want support

AMA President Dr Michael Gannon said the survey results showed that rural Australia needs more resources to recruit and retain doctors and other health professionals.

“We have record numbers of medical school places and, with sufficient numbers of medical graduates coming through, the focus must now be in how we can get them to work in the places they are needed the most,” Dr Gannon said.

As one respondent said: “I cannot stress enough the importance of rotating specialist/vocational trainees into rural posts. The RACS and RACP have done so for years with great exposure and training of prospective doctors for a rural practice. Other colleges must follow suit, especially psychiatry, radiology, pathology, O&G, and emergency medicine, to name a few key deficiencies in rural placement or training.”

The survey found that rural doctors enjoy their careers but struggle with the workload and lack of support.

Related: MJA – Providing a lifeline for rural doctors

“It’s very hard to find locum support to take holidays/attend conferences, and as the only specialist in my field in all rural WA, extra support to maintain CPD and be able to go on holidays would be nice,” one respondent said.

But the response from the community makes the job rewarding, doctors said.

“Small towns often appreciate what little I could do for them,” one doctor said.

The survey results build on the AMA’s Plan for Better Health Care for Regional, Remote, and Rural Australia, released in May.

The Plan proposes a focus on four key areas – rebuilding country hospital infrastructure; supporting recruitment and retention of doctors; encouraging more young doctors to work in rural areas; and supporting rural practices.

“Addressing and investing in these measures will make a long-term difference to the health of Australians living in rural communities,” Dr Gannon said.

Maria Hawthorne

Photo credit: Nils Versemann / Shutterstock.com

Latest news:

Family doctors: invaluable to health

As the new Chair of the AMA Council of General Practice, I am honoured to follow on from my predecessor, Dr Brian Morton, and wish to acknowledge him for his six years of leadership and service to the Council and to general practitioners.

It is certain that as a profession we will have some interesting times ahead of us as the dust from the Federal Election settles. If there is one thing we know for sure from the last few weeks, it is that putting health on the backburner is risky business. The Government must be in no doubt now that health is a priority, and that it will have to do more than it has to date to ensure vulnerable patients do not have to worry about whether or not they can afford to see their GP when required, and to have pathology and radiology investigations when requested.

Next week we will be celebrating general practice and the primary role played by Australia’s GPs, our family doctors, as frontline and holistic health care providers. Throughout Family Doctor Week (24-30 July), the AMA will be highlighting how invaluable the family doctor is to patient health, and to the health system more broadly.

We know from international comparisons that countries with a strong GP-led primary care system have lower rates of ill health, better access to care, reduced rates of hospital admissions, fewer referrals to other specialists, less use of emergency services, and better detection of adverse effects of medication.

The comprehensive care provided by our nation’s family doctors needs to be seen by Government as an investment rather than as an expense. With only 6 per cent of Australia’s total health expenditure on general practice, our family doctors have proven the value of their care. Ending the freeze on Medicare rebates, raising the rebates and lifting rates of indexation to cover the true costs of care must be at the top of the Government’s to-do list.

For most patients, our general practices are their medical home. If appropriately funded, rather than struggling for viability, we know we can do more to help our patients live the healthiest life they can. We can do this though appropriate health screening and life-stage assessments, through structured care that is patient-centred and planned, through greater use of innovative technology that not only empowers patients in managing their conditions, but enables us to monitor their progress, through better use of medicines, and through care that is streamlined and coordinated within our multidisciplinary health care team.

Family Doctor Week will highlight that, properly funded, the medical home has the potential to both improve the care patients receive, and to save on more costly downstream health costs.

Supporting general practices to bring non-dispensing pharmacists into the health care team is but one way Government can invest to deliver better patient outcomes and minimise avoidable hospital admissions. The AMA’s Pharmacist in General Practice Program would deliver $1.56 in savings for every $1 invested by ensuring the quality use of medicines, medication optimisation and increased medication compliance, reducing adverse drug events and hospitalisations as a result.

In rural and remote areas, Government needs to assist general practices with appropriately designed and implemented infrastructure grants to expand their facilities to better meet the complex health needs of people in these communities.

You can support us in supporting you by visiting the website family-doctor-week-2016 and downloading and displaying the poster and your Family Doctor Logo, and by using #amafdw16 if tweeting or sharing FDW content on social media.

Stroke in a young man with untreated HIV infection and neurosyphilis

Clinical record

A 33-year-old man presented to an emergency department with acute dysphasia and a dense right hemiparesis. His National Institute Health Stroke Scale score was 12, indicating a moderate severity stroke (score range 0–42, with increasing values indicating increasing severity). His computed tomography (CT) brain scan was normal. A CT angiogram showed a filling defect in the left intracranial internal carotid artery. Intravenous thrombolysis was commenced 2.5 hours after stroke onset and completed during urgent transit to our hospital for endovascular thrombectomy. Combined stent retrieval and suction thrombectomy of the left internal carotid occlusion restored flow 4.5 hours after stroke onset. A small dissection in the left intracranial internal carotid artery was the source of the thrombotic occlusion (Figure). A magnetic resonance imaging scan of the brain showed small scattered infarctions in the left middle cerebral arterial territory.

The patient was later found to have a human immunodeficiency virus (HIV) infection that had been diagnosed 5 years earlier but for which he had not sought or received treatment. There was no history of screening for syphilis. He had a remote and brief history of recreational use of methamphetamines and cocaine (more than 12 months previously). He had no other vascular risk factors (non-smoker, normal fasting lipid and blood glucose levels, negative autoimmune serology). His CD4 cell count was 220 × 106 cells/L (reference interval [RI], ≥ 360 × 106 cells/L) and serum quantitative HIV RNA testing revealed 77 400 copies/mL. Hepatitis serology results were negative. Syphilis serology results were positive: reactive rapid plasmin reagin (RPR) with a titre of 1:256; reactive Treponema pallidum particle agglutination (TPPA) assay; and positive syphilis antibody enzyme immunoassay. His cerebrospinal fluid (CSF) protein level was 1.17 g (RI, < 0.45 g/L) and his white cell count was elevated at 62 μ/L (RI, < 5 μ/L), predominantly due to monocytosis (84%). CSF syphilis serology was positive, with reactive results from the venereal disease research laboratory, TPPA and fluorescent treponemal absorption antibody tests, confirming neurosyphilis. There were no other clinical or radiological features of tertiary syphilis. CSF polymerase chain reaction test results were negative for other pathogens including varicella-zoster virus, John Cunningham virus and tuberculosis. Cryptococcal antigen test results were negative. Other stroke investigations, including transoesophageal echocardiogram, returned negative results.

A 15-day course of intravenous benzylpenicillin (1.8 g, 4-hourly) with prednisone cover (three doses of 20 mg twice daily to prevent Jarisch–Herxheimer reaction) was completed as treatment for neurosyphilis. He received counselling and was commenced on antiretroviral therapy including abacavir–dolutegravir–lamivudine. Contact tracing was performed. The 3-month outcome was excellent, with only minor persistent dysphasic speech errors and a modified Rankin scale score of 1 (range 0–6, with increasing values indicating worse deficit and 6 for death). Progress serum RPR titres were significantly reduced (1:64), indicating a serological treatment response. A recent progress CD4 cell count was 630 × 106/L and quantitative HIV RNA testing revealed < 20 copies/mL.

Studies indicate that HIV infection increases the risk of ischaemic stroke, particularly in young patients (≤ 45 years) with low CD4 cell counts (< 350 × 106 cells/L).1,2 It is important for clinicians to recognise the various mechanisms by which HIV infection predisposes to stroke. These include a direct HIV-induced vasculopathy, and an indirect opportunistic co-infection-related arteritis with organisms such as tuberculosis, syphilis and varicella-zoster virus.2 HIV vasculopathy has been reported in the extracranial and intracranial cerebral circulations and may cause aneurysmal fusiform or saccular dilatation of vessels or a non-aneurysmal vasculopathy manifest by stenosis, occlusion or vasculitis.24 Additional factors contributing to stroke risk in HIV include a more frequent smoking history, coagulopathy, increased homocysteine levels and metabolic syndromes associated with antiretroviral therapies, which may result in accelerated atherosclerosis.1,3 Descriptions of intracranial arterial dissection in patients with HIV infection are limited to rare case reports.5 We postulate that HIV and syphilis co-infection in our patient may have caused a vasculopathy-associated intracranial arterial dissection.

The role and safety of intravenous thrombolysis in patients with HIV infection is not established.2,4 Thrombolysis could be theoretically harmful in patients with HIV vasculopathy or co-infection-related arteritis owing to a potential increased bleeding risk from abnormal vessel wall integrity.4 Despite this, intravenous thrombolysis has been used successfully in patients with untreated HIV infection to treat myocardial infarction and, in our patient, to treat acute ischaemic stroke without adverse outcomes.2,4 Clinicians should be aware that endovascular thrombectomy of proximal anterior cerebral circulation clots after intravenous thrombolysis is now evidence-based treatment for acute ischaemic stroke.6 Our case illustrates the “drip, ship and retrieve” concept of acute stroke management; with intravenous thrombolysis (“drip”) commenced at an initial hospital and completed while the patient was transferred (“shipped”) to another hospital for endovascular thrombectomy (clot “retrieval”). At present, only a limited number of stroke centres provide an endovascular thrombectomy service. Reorganisation of existing systems is required to allow rapid access to endovascular thrombectomy for all appropriate patients in Australia.6

This case presents an important reminder that HIV infection is a risk factor for stroke and that HIV testing should be performed in all young stroke patients. A lumbar puncture is recommended for diagnosis or exclusion of co-existing infections including tuberculosis, syphilis and varicella-zoster, which are all associated with vasculopathy in patients with HIV infection.

Lessons from practice

  • HIV infection is an important risk factor for stroke and HIV testing should be performed in all young stroke patients.

  • Patients with HIV infection and stroke should have a lumbar puncture to examine for co-existing opportunistic infections.

  • A diagnosis of neurosyphilis requires a cerebrospinal fluid (CSF) cell count and protein measurement and serological testing on serum and CSF.

  • There is evidence that the “drip, ship and retrieve” management approach to managing acute ischaemic stroke is effective. However, in patients with known HIV infection, acute stroke should be managed on a case-by-case basis.

Figure


Digital subtraction angiography: A: Pre-clot retrieval showing left internal carotid occlusion (arrow). B: Post-clot retrieval showing dissection (arrow) and restoration of flow.

Radiologists abandon campaign on promise of Govt review

The Coalition has convinced the diagnostic imaging industry to drop its campaign against cuts to bulk billing incentives in exchange for a review of the commercial pressures the sector is working under.

After last month striking a peace deal with pathologists to end a damaging campaign over the axing of bulk billing incentives for pathology services, the Government has headed off similar action by the nation’s radiology providers.

Health Minister Sussan Ley announced on 5 June that the Coalition, if re-elected, would commission an “independent evaluation…of the commercial pressures facing diagnostic imaging providers”.

Ms Ley said the evaluation would also be used to help identify ways to make Government spending more targeted and efficient.

“Advancing technology in many areas of the health system creates a much more efficient and automated service, leading to decreased costs,” the Minister said. “However, this is not the case for most diagnostic imaging services, which need specialist doctors to supervise the examination and analyse the results, not machines.

“This independent evaluation will ensure we can work together with the diagnostic imaging sector to pinpoint exactly where possible improvements can be made in the broader system, and ensure this significant additional investment is targeted where it will have the most benefit for patients.”

Ms Ley up to $50 million a year could be saved through greater efficiencies in Government spending.

The Minister’s announcement came just days before the Australian Diagnostic Imaging Association planned to launch a public campaign warning that cuts to bulk billing incentives, coming on top of an 18-year freeze on patient rebates, would force the cost of crucial of crucial diagnostic and treatment services beyond the reach of many patients, including those with cancer.

The Association had said that average out-of-pocket costs for x-rays, ultrasounds, CTs and MRIs had reached $100, and practices were “extremely concerned” that the freeze on rebates would “continue to drive more patients away from essential diagnosis and treatment”.

But, following Ms Ley’s announcement, Association Chief Executive Officer Pattie Beerens said she was confident the Coalition’s plan, which includes maintaining the bulk billing incentive for concession card holders and children, a three-year moratorium on changes to Diagnostic Imaging Services Table and a resumption of rebate indexation in 2020, would “show a path” to adequate Medicare rebates.

“We had to fight the case for patients and we are really pleased that our advocacy has resulted in the diagnostic imaging sector and the Government working constructively to achieve a positive outcome for patients, providers and taxpayers,” Ms Beerens said.

Adrian Rollins

Estimating eligibility for lung cancer screening in an Australian cohort, including the effect of spirometry

Lung cancer causes more deaths than any other cancer, and is a leading cause of disease-related burden in Australia.1 The United States National Lung Screening Trial (NLST) showed that screening high risk current and former smokers for lung cancer with low dose chest computed tomography (LDCT) can significantly reduce lung cancer mortality.2 LDCT lung cancer screening is recommended in the US for eligible individuals.3

Unlike other cancer screening programs that select participants according to the risk factors of age and sex, eligibility for lung cancer screening is more complex. The current US screening criteria, as defined by the US Preventive Service Task Force (USPSTF), are that current or former smokers are eligible if they are aged 55–80 years, have a smoking history of at least 30 pack-years, and, if a former smoker, have quit less than 15 years ago.3 However, this approach is not necessarily the most efficient for identifying those who may benefit from screening.4 Using probabilistic multivariate lung cancer risk prediction models to select individuals for screening may improve overall efficiency and cost-effectiveness, and are recommended by international organisations.57

The PLCOm2012 lung cancer risk model was developed during the US Prostate, Lung, Colorectal, Ovarian Screening (PLCO) Trial, and has been validated in the NLST cohort.8 This model uses data on age, smoking status, duration and intensity, family history, body mass index (BMI), and comorbidities (including self-reported chronic obstructive pulmonary disease [COPD], chronic bronchitis and emphysema) to estimate an individual’s risk of developing lung cancer within 6 years.8 A PLCOm2012 lung cancer risk of greater than 1.5% has been proposed as an alternative lung cancer screening eligibility criterion.9

COPD is an independent risk factor for the development of lung cancer, and self-reported, doctor-diagnosed COPD and chronic bronchitis or emphysema are included in the PLCOm2012 risk prediction model (but not in the USPSTF eligibility criteria).8 There are, however, significant differences in the proportions of individuals who report a diagnosis of COPD, who have symptoms consistent with COPD, or who have airflow obstruction detectable by spirometry.10 Including airflow obstruction improves the accuracy of a lung cancer risk prediction that does not incorporate self-reported COPD.11 Incorporating spirometry results into eligibility assessment for lung cancer screening has been suggested, but the impact of adding spirometry-defined COPD to the existing eligibility criteria of self-reported COPD or symptoms consistent with COPD is not known.12

In Australia, about 2.2 million people aged 55–75 years are current or former smokers, but the proportion of those eligible for lung cancer screening, using either USPSTF or PLCOm2012 criteria, is unknown.13 Estimating the proportion of people eligible for lung cancer screening will both aid policy makers when planning future capacity and assessing infrastructure requirements, and help estimate screening participation rates.

The aims of this study were to estimate the proportion of an Australian cohort that is eligible for lung cancer screening, and to examine the utility of including spirometry-defined COPD as part of screening eligibility assessment.

Methods

The Busselton Healthy Ageing Study (BHAS) is a cross-sectional study of adults born between 1946 and 1964 who live in the Busselton Shire of Western Australia.14 Participants were recruited sequentially at random between 2010 and 2013 from the electoral roll; the participation rate was greater than 80% of contacted individuals. Participants completed a self-administered questionnaire and physical assessments, including spirometry. The upper age limit of participants included in our study (68 years) was determined by the BHAS design.

Smoking status, duration and intensity were self-reported. Ever-smokers responded positively to “Have you ever smoked cigarettes?” Current smokers responded positively to “Do you currently smoke manufactured or hand-rolled cigarettes?”, and former smokers responded negatively. Pack-years of smoking were determined by multiplying the duration of smoking in years by the number of 20-cigarette packs smoked each day. Personal history of any cancer other than non-melanomatotic skin cancer, family history of lung cancer, and other demographic information were self-reported.

BMI was calculated from the measured height and weight. Pre- and post-bronchodilator forced expiratory volume in one second (FEV1) and forced vital capacity (FVC) were measured using an EasyOne spirometer (NDD Medical Technologies) before and after administration of 200 μg of inhaled salbutamol with a metered dose inhaler and spacer. Participants were asked to withhold any bronchodilator medication, if possible, for 12 hours before testing.

Individuals were excluded from the analysis if they had a history of lung cancer, if BMI or demographic data were missing, or there was insufficient data on smoking duration or intensity to calculate the number of pack-years.

Lung cancer risk was calculated with the PLCOm2012 6-year lung cancer risk prediction model.8 For the purposes of this model, COPD was defined in three ways:

  • self-reported, doctor-diagnosed COPD, defined as a positive response to “Has your doctor ever told you that you had COPD?”;

  • symptoms consistent with COPD, defined as a positive response to “Do you cough on most days for as much as 3 months each year?” or “Do you bring up phlegm from your chest on most days for as much as 3 months each year?” or “Has your chest made a wheezing or whistling sound in the last 12 months?”; and

  • spirometry-defined COPD, defined by the presence of post-bronchodilator airflow obstruction (FEV1/FVC ratio < 0.7), excluding those with more than 12% improvement in FEV1 or FVC after bronchodilator medication.

Eligibility for lung cancer screening was based on two criteria: the current USPSTF recommendation3 and a PLCOm2012 6-year lung cancer risk of > 1.5%, as recommended by Tammemägi and colleagues.8 To estimate the proportion of the Australian population who are eligible for screening, an estimate of 2.2 million Australians aged 55–75 years who are current or former smokers13 was multiplied by our estimate of the proportion of potentially eligible ever-smokers in the Busselton population according to USPSTF criteria.

Statistical analyses were performed in SPSS 22 (IBM); 95% confidence intervals for proportions were calculated using continuity adjustment. Comparisons of the proportions of independent and dependent samples were performed with χ2 and McNemar tests respectively. Independent sample t tests compared the means of independent samples. Statistical significance was defined as P < 0.05.

Ethics approval

The BHAS and the reported study received human research ethics approval from the University of Western Australia Human Research Ethics Committee (references RA/4/A/2203, RA/4/1/7891).

Results

Of all 3586 BHAS participants aged 50–68 years, 1903 (53.1%) were current or former smokers. Of these ever-smokers, 36 were excluded (16 had incomplete smoking information, 15 reported smoking less than one cigarette per day, one had prior lung cancer, and demographic or BMI data were missing for four), leaving 1867 participants for the analysis. In the 55–68-year-old age group, 1260 (49.9%) were ever-smokers (including 240 [6.7%] current smokers), 1241 (49.2%) were never-smokers, and 22 (0.9%) had incomplete smoking data.

The demographic details of all BHAS ever-smokers in two age groups, 50–68 years and 55–68 years, are summarised in Box 1. The 55–68-year-old age group was selected as corresponding to the age cohort currently eligible for lung cancer screening in the US.

Eligibility for lung cancer screening

Of ever-smokers aged 55–68 years, 254 (20.1%; 95% CI, 17.9–22.3%) would be eligible for screening according to USPSTF criteria. Using the PLCOm2012 criteria with self-reported COPD, fewer people (225, 17.9%) would be eligible (95% CI, 15.8–20.0%; P = 0.004).

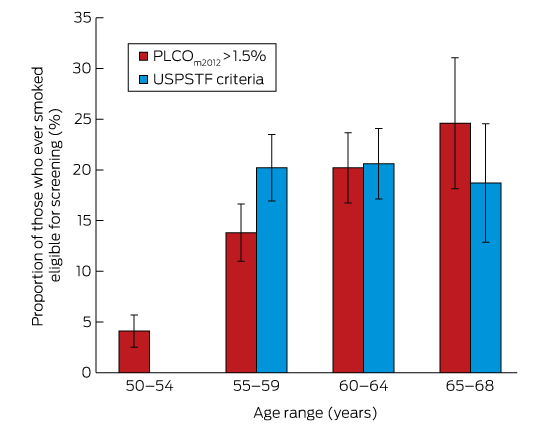
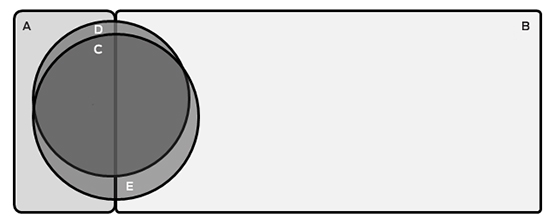
The proportion of ever-smokers eligible for screening increased with age in the PLCOm2012 model, but was stable when using USPSTF criteria (Box 2). Of the entire age-defined cohort, 2.6% would be eligible using PLCOm2012 criteria but not according to USPSTF criteria, and 4.9% would be eligible using USPSTF criteria but not PLCOm2012 criteria; 15.2% would be eligible according to both criteria sets (Box 3). This suggests that about 450 000 individuals in Australia may be eligible for lung cancer screening.

Effect of COPD definition on lung cancer risk and eligibility

Of the ever-smokers in the BHAS population, 1191 had concurrent spirometry, of whom 782 were aged 55–68 years. Using the PLCOm2012 criteria, the proportion eligible for screening was 16.4% (using self-reported COPD), 18.8% (symptoms consistent with COPD), or 17.5% (airflow obstruction on spirometry) (Box 4). Fewer people were eligible for screening using self-reported than spirometry-defined COPD (P < 0.01); there was no statistical difference between the proportions of eligible participants when spirometry-defined or symptom-defined COPD was used (P = 0.06). When spirometry-defined COPD was added to symptom-defined COPD to determine PLCOm2012 risk, an additional seven participants (0.9%) would have been eligible for screening. If normal spirometry was used to exclude COPD in those who reported symptoms of COPD, 17 participants (2.1%) would be deemed ineligible for screening.

Of the 409 ever-smokers aged 50–55 years (and therefore ineligible for screening according to current criteria) with spirometry data, 18 (4.4%; 95% CI, 2.8–6.9%), 36 (8.8%; 95% CI, 6.4–11.9%) or 25 (6.1%; 95% CI, 4.2–8.9%) would have been eligible based on a PLCOm2012 risk greater than 1.5% when COPD was defined by doctor diagnosis, symptoms, or spirometry respectively.

Discussion

Our study suggests that 17.9% (PLCOm2012) to 20.1% (USPSTF criteria) of current or former smokers aged 55–68 years in Busselton would be eligible for lung cancer screening, corresponding to 8.9% (PLCOm2012) and 10% (USPSTF) of all those in the BHAS cohort aged 55–68 years. This is the first time that the proportion of ever-smokers eligible for lung cancer screening has been estimated in an Australian population. While small studies have shown the feasibility of lung cancer screening in Australia, significant hurdles remain before screening is endorsed locally.1518

Our finding that the USPSTF criteria identified a higher proportion of eligible individuals than the PLCOm2012 criteria is consistent with previous reports.9 Our study could not validate the predictive performance of each criterion because mature lung cancer outcomes were not available. Retrospective studies suggest that the PLCOm2012 model performs better than the USPSTF criteria in identifying high risk individuals, but prospective impact analyses in screening cohorts are required to determine which eligibility criteria should be preferred in the Australian context.

There have been four previous estimates of the proportion of the US population who would be eligible for screening (Box 5).9,1921 Three of these studies estimated that 18.8–24.4% of ever-smokers and 10.5–14.3% of all individuals in the respective age cohorts were eligible for screening according to USPSTF criteria.1921 These estimates are broadly comparable with our estimates of the proportion of eligible individuals in the BHAS. On the other hand, fewer BHAS ever-smokers would be eligible for screening than estimated for the PLCO intervention arm ever-smokers (17.9% v 34.6%; P < 0.001).9 This observation may partly be explained by differences in tobacco exposure between the cohorts; the proportion of current and former smokers were similar, but BHAS participants reported lower smoking intensity (mean pack-years, BHAS v PLCO: current smokers, 32.1 v 40.8, P < 0.001; former smokers, 17.8 v 25.8; P < 0.001).22

There are two possible explanations for the lower smoking intensity in the BHAS cohort. The first relates to historical trends in smoking. Enrolment for the PLCO trial occurred between 1993 and 2001, whereas BHAS enrolment commenced in 2010.14,23 Smoking consumption in Australia declined significantly between 2001 and 2010 among both men and women.24 The second explanation is a potential healthy community effect after repeated cross-sectional health surveys in the Busselton community since 1966.14

The current study has highlighted the known challenges in defining and diagnosing COPD. Only 1% of 55–68-year-old BHAS ever-smokers reported being diagnosed with COPD, whereas 13.8% met the spirometric definition of COPD and 35.0% reported symptoms consistent with the disease. A similar discrepancy was previously described in a larger Australian study.10 Airflow obstruction on spirometry is not only crucial to diagnosing COPD, but is an independent predictor of increased lung cancer incidence in screening studies, and may predict overdiagnosis.12 Incorporating spirometry into screening eligibility assessment has been suggested, but this would require direct patient contact.12 Our results suggest that performing spirometry is unlikely to meaningfully improve the identification of eligible individuals, with just one additional individual from every 100 ever-smokers assessed becoming eligible. We therefore contend that, in the absence of more epidemiological data comparing the relative lung cancer risks associated with airflow obstruction and with symptoms or self-reported COPD, defining COPD on the basis of symptoms is an appropriate surrogate measure for spirometry.

Policy makers in jurisdictions that recommend population-based cancer screening, such as Australia, are faced by significant implementation challenges.15,25 No state or federal database contains the necessary data for directly identifying the estimated 10% of the age-defined population eligible for screening. Population-based recruitment strategies for lung cancer screening must therefore currently engage with and assess the eligibility of a broader population of ever-smokers, the majority of whom will be ineligible. The feasibility and unintentional impact of this recruitment approach is not known.

Smoking cessation in one lung cancer screening study reduced all-cause mortality by up to 43%.26 Almost half of BHAS current smokers (42.9%; 103 of 240 current smokers) were ineligible for screening, regardless of the criteria used. Providing smoking cessation support without LDCT screening to ineligible current smokers who engage with a screening program may be a pragmatic way to combine primary prevention and early detection of lung cancer.

Of the BHAS ever-smokers aged 50–55 years, 4.4–8.8% had PLCOm2012 lung cancer risk sufficient to potentially benefit from screening, depending on the definition of COPD used. This may represent an additional population at risk who may benefit from lung cancer screening at a lower age threshold than currently recommended, although internationally there is little prospect of such a change.27

There are several potential limitations to this study. The upper age limit of our BHAS participants was 68 years, younger than the maximum recommended screening age of 80 years.3 This study may therefore have underestimated the proportion of the population potentially eligible for screening, as PLCOm2012 risk increases with age.21 Ethnic background has an impact on lung cancer risk, and the BHAS participants were almost exclusively European in origin, which is not representative of the broader Australian population, although the Busselton population age distribution and smoking demographic can be broadly generalised to the wider Australian population. Other lung cancer risk prediction models are being used to select individuals for lung cancer screening studies, but it was not possible to assess them, as they include variables (such as asbestos exposure) not recorded by the BHAS.6 The definition of COPD in the PLCOm2012 model is self-reported COPD, chronic bronchitis or emphysema, more inclusive than the definition used in the BHAS. We were unable to validate the PLCOm2012 model, as 6-year lung cancer outcomes are not available.

In conclusion, we estimate that between 17.9% and 20.1% of all current or former smokers aged 55–68 years in the BHAS population would be eligible for lung cancer screening, depending on the criteria applied. Symptom-defined COPD may be an appropriate surrogate measure for spirometric testing for determining the presence of COPD as part of the assessment of lung cancer screening eligibility.

Box 1 –
Demographic characteristics of ever-smokers in the Busselton Healthy Ageing Study

50–68 years old

55–68 years old


Number

1867

1260

Age (years), mean ± SD

58.0 ± 4.8

60.7 ± 3.4

Sex (women)

927 (49.7%)

603 (47.9%)

Ethnic background

European

1848 (99.0%)

1249 (99.1%)

Asian

12 (0.6%)

5 (0.4%)

Aboriginal and/or Torres Strait Islander

6 (0.3%)

5 (0.4%)

Māori or Pacific Islander

1 (0.1%)

1 (0.1%)

Body mass index (kg/m2), mean ± SD

28.46 ± 4.90

28.70 ± 4.95

Smoking status

Current

368 (19.7%)

240 (19.0%)

Former

1499 (80.3%)

1020 (81.0%)

Total pack-years, mean ± SD

Ever-smokers

19.2 ± 19.6

20.5 ± 20.7

Current smokers

31.5 ± 20.0

32.1 ± 19.3

Former smokers

16.2 ± 18.4

17.8 ± 20.1

Highest education level obtained

Did not complete high school

36 (1.9%)

27 (2.1%)

High school

1000 (53.6%)

702 (55.7%)

TAFE or other college

555 (29.7%)

352 (27.9%)

University

276 (14.8%)

179 (14.2%)

Previous cancer (excluding non-melanomatotic skin cancer)

155 (8.3%)

122 (9.7%)

Family history of lung cancer

146 (7.8%)

106 (8.4%)

Chronic obstructive pulmonary disease (COPD)

Self-reported COPD

16 (0.9%)

13 (1.0%)

Symptoms consistent with COPD

617 (33.0%)

441 (35.0%)

Spirometry-defined COPD

179/1191 (15.0%)

108/782 (13.8%)


TAFE = Technical and Further Education.

Box 2 –
Eligibility for lung cancer screening of 1260 55–68-year-old ever-smokers in Busselton, according to USPSTF and PLCOm2012 criteria*


PLCO = Prostate, Lung, Colorectal, Ovarian Screening Trial; USPSTF = US Preventive Service Task Force. * Calculated using doctor-diagnosed chronic obstructive pulmonary disease, with 95% confidence intervals.

Box 3 –
Schematic representation of the proportion of current and former smokers eligible for screening


A = Ineligible current smokers (n = 103; 8.2%); B = Ineligible former smokers (n = 870; 69.0%); C = Individuals eligible on both USPSTF and PLCOm2012 criteria (n = 192; 15.2%); D = Individuals eligible only on PLCOm2012 criteria (n = 33; 2.6%); E = Individuals eligible only on USPSTF criteria (n = 62; 4.9%). The areas of the components of this figure are approximately proportional.

Box 4 –
Proportions of 782 ever-smokers aged 55–68 years eligible for screening based on PLCOm2012 criteria, using different definitions of chronic obstructive pulmonary disease (COPD)

COPD definition for estimating PLCOm2012 lung cancer risk

PLCOm2012 risk > 1.5%

P*


Self-reported COPD

128 (16.4%; 95% CI, 13.8–19.0%)

< 0.01

Symptom-defined COPD

147 (18.8%; 95% CI, 16.1–24.5%)

0.06

Spirometry-defined COPD

137 (17.5%; 95% CI, 14.8–20.2%)


* v spirometry-defined COPD (McNemar test).

Box 5 –
Summary of studies reporting proportions of the population aged 55 years or more who are eligible for lung cancer screening

BHAS

PLCO intervention arm9,22

US Health and Retirement Study19

US National Health Interview Survey20

US National Health and Nutrition Examination Survey18


Sample size

2523

77 445

16 901

7138

2562

Recruitment period

2010–2013

1993–2001

2012

2011

2007–2012

Age range, years

55–68

55–74

55–80

55–74

55–77

Smoking status

Never

49.2%

45.1%

42.5%

NR

NR

Current

9.5%

10.4%

14.4%

NR

NR

Former

40.4%

42.0%

39.6%

NR

NR

Missing or incomplete

0.9%

2.5%

3.5%

NR

NR

Eligible individuals as proportion of entire cohort

USPSTF criteria

10.0%

19.6%

10.5%

14.3%

NR

PLCOm2012 > 1.5%

8.9%

17.9%

NR

NR

NR

Eligible individuals as proportion of cohort of all ever-smokers

USPSTF criteria

20.1%

38.0%

18.8%

NR

24.4%

PLCOm2012 > 1.5%

17.9%

34.6%

NR

NR

9–35%, depending on ethnicity*


BHAS = Busselton Healthy Ageing Study; NR = not reported; PLCO = Prostate, Lung, Colorectal and Ovarian Trial; USPSTF = United States Preventive Services Task Force. * Extrapolated from figure 1 in reference .

Medibank actions ‘unconscionable’: ACCC

The consumer watchdog is taking the nation’s largest health insurer to court alleging it engaged in misleading and unconscionable conduct after it reduced benefits without informing policyholders.

In damning accusations that reflect widespread public discontent over the conduct of private health funds, the Australian Competition and Consumer Commission has launched legal action against Medibank Private claiming it deliberately withheld information about a cut in benefits for in-hospital radiology and pathology services to make money and avoid hurting its image ahead of its public float.

“We think these are very serious allegations, and we think the behaviour we’re alleging should change right across the industry,” ACCC Chairman Rod Sims told The Australian.

In a strongly-worded statement, the ACCC claimed Medibank made a calculated decision to keep communications about the change “contained and reactive” for fear that if it was disclosed members might leave the fund, and the bad publicity could damage its reputation and “have a negative impact on its planned initial public offering of securities”.

The issue arose when, in September 2014, Medibank terminated and phased out agreements with pathology and radiology providers to pay the gap for in-hospital services. As a result, the ACCC said, policyholders were left with average out-of-pocket expenses of $151 for pathology services, and $83 for radiology services.

The ACCC alleges Medibank failed to give members with advance notice of the changes despite previously committing to do so, and that representations it made that members would not face out-of-pocket expenses for in-hospital pathology and pathology services were, from 1 September 2014, false and misleading.

“Consumers are entitled to expect that they will be informed in advance of important changes to their private health insurance cover, as these changes can have significant financial consequences at a time when consumers may be vulnerable,” Mr Sims said. “Private health insurers must ensure their disclosure practices comply with the Australian Consumer Law.”

Medibank has rejected the ACCC’s allegations.

“Medibank take sits obligations under the Australian Consumer Law seriously, and has appropriate processes in place to ensure compliance,” a spokesman for the health fund said. “We have been working cooperatively with the ACCC throughout its investigation.”

AMA President Dr Michael Gannon welcomed the ACCC’s action.

Dr Gannon said the AMA has long been highly critical of the actions of insurers making changes to their health cover without informing policy holders, and it was pleasing to see that at least one was now being held to account.

“It has become a distressingly common experience for patients to think they are covered for the cost of medical treatment, only to find that they are lumbered with unexpected out-of-pocket costs,” Dr Gannon said.

“It is completely unacceptable for insurers to make changes to the cover they provide without informing policyholders, and it is very important that this type of behaviour is now being called out.”

The ACCC’s action follows the release earlier this year of the AMA Private Health Insurance Report Card, which showed that many policies offered by health insurers were no better than junk, while others did not provide the cover expected.

The AMA’s analysis of the 40,000 policies offered by the nation’s 33 private health funds has found that Medibank Private, NIB, HCF, HBF, which together account for more than 55 per cent of the health insurance market, are marketing products that, because of multiple exclusions, provide barely more cover than Medicare or, in many instances, provide no additional entitlement at all.

The ACCC last year launched a report highly critical of the quality and accuracy of information provided by the health funds, which the watchdog said served to confuse consumers about what they were covered for and hampered their ability to make informed choices.

Health Minister Sussan Ley has commissioned a review of the private health insurance industry amid widespread discontent about rising premiums and shrinking cover, and the Coalition has promised that if it is re-elected it will institute a rating system for health cover and “weed out” junk policies by mandating a minimum level of cover.

Dr Gannon said it was time insurers were held accountable for their actions, which often caused great financial and emotional distress for patients caught unaware by surprise out-of-pocket expenses.

“Policyholders need to know exactly what they are covered for and are entitled to, rather than being hit with shock bills when they are ill or at their most vulnerable,” he said.

The AMA Private Health Insurance Report Card 2016 is at ama-private-health-insurance-report-card-2016

Adrian Rollins


Don’t shoot the messenger


The Turnbull Government, led by Health Minister Sussan Ley, has recently made a habit of launching attacks on health professionals to justify its health policy decisions, especially the cuts to funding and services and the cost shifting.

It has not just been doctors in the firing line, although the Government has made a habit of demonising GPs, surgeons, radiologists, pathologists, and anaesthetists on a regular basis.

If not through direct attack, it has been via friendly journalists on the drip, or under cover of disenchanted private health insurers desperate to avoid the spotlight as their own sector is under forensic review.

Dentists have been copping it lately, joining the growing queue of health professionals being blamed for the Government’s health policy mistakes and misadventures. Pharmacists and nurses have also come under attack, and they are not amused, and do not take these attacks lightly.

None of the health professions appreciate being criticised publicly in the media, especially when these attacks do not reflect what is discussed in private meetings.

The public – voters – do not like it, either.

Every poll of the professions in living memory has doctors, nurses, and pharmacists rated as the most trusted professions in the community. People trust their doctors and other health professionals. They do not like the ugly spectacle of politicians and some in the media attacking the integrity of health professionals. Needless to say, politicians rate very low on the trusted profession scale.

So, what is behind the misguided strategy of demonising doctors and other health professionals so close to an election? There can’t be any votes in it.

You would think that an incumbent Government would want to win the hearts and minds of health sector leaders in the months ahead of a Federal Election, and on the eve of the Federal Budget, which will shape the direction of the Coalition’s election health policies.

But this is not the case.

Doctors, pharmacists, nurses, Aboriginal health services, and even medical receptionists, have in the past week been blamed for rorts and waste in the system, with incorrect and inaccurate statistics being used to push these mischievous claims.

This is all subterfuge to keep the public focus off the main game – the fact that the Government’s health policies, in the main, are all about making savings to the Budget, not improving access to quality affordable health care for all Australians.

The Government’s ongoing justification for its extreme health savings measures, including cuts to public hospital funding, has been that Australia’s health spending is unsustainable. This is simply not true.

The most recent comparative figures reported by the OECD show Australia’s health expenditure as a proportion of GDP was below the OECD average and lower than 18 other OECD countries.

Australia’s health costs (8.8 per cent), as assessed by the OECD, were just over half the corresponding proportion for the USA (16.4 per cent). Australia achieves better health outcomes for its significantly lower proportional spend than the USA and many other countries, with the second highest life expectancy in the world, with the exception of Indigenous Australians.

Moreover, the Commonwealth Government’s total health expenditure is reducing as a percentage of the total Commonwealth Budget. In the 2014-15 Commonwealth Budget, health was 16.13 per cent of the total, down from 18.09 per cent in 2006-07. It reduced further in the 2015-16 Budget, representing only 15.97 per cent of the total Commonwealth Budget.

Clearly, total health spending is not out of control. Nor is spending on medical services.

The reality is that today we are not spending any more on medical services as a proportion of total health spending than we were a decade ago.

The proportion today is 18.2 per cent, compared with 18.5 per cent a decade ago. While we are spending more on health in total, we are spending less on medical services.

Today, 86 per cent of privately insured medical services are charged at no gap by the doctor – which means that the doctor accepts the fee level set by the patient’s private health insurer.

A further 6.4 per cent are charged under ‘known’ gap arrangements. This means that less than 8 per cent of privately insured patients may be charged fees exceeding private health insurance levels, including known gap amounts.

The number of doctors charging ‘excessive’ fees is in the absolute minority, and the AMA continues to work with the relevant specialist colleges, associations and societies to address this.

Nor are doctors’ fees contributing to Budget woes, with specialist fees in many cases not being indexed for up to a decade.

Contrary to the line being pushed by the Government and the private health insurers, medical services are not an issue for the insurers or for patients.

Some insurers have been only too eager to vilify doctors even though the publicly listed PHIs have posted record profits, their executives are paid multimillion dollar salaries, and when doctors charge above the PHI schedule, i.e. a gap, the PHI contribution falls to 25 per cent of the scheduled fee.

During the December 2015 quarter, insurers paid $3,542 million in hospital treatment benefits. This was broken down into 70 per cent on hospital services such as accommodation and nursing, approximately 15 per cent on medical services, and 14 per cent on prostheses.

General practice, too, has demonstrated a real willingness to work with the Government to deliver high quality reforms, particularly in relation to the treatment of patients with complex and chronic disease.

The 2016 Budget provided the Government with a real opportunity to steer a new course and a new strategy of health policy and health sector engagement, but they passed on this opportunity. We can only hope the Government is saving some health largesse to be announced ahead of the election.

Doctors and the other health professions are restless and demanding better health policy, better consultation, and greater respect in public conversations and pronouncements. We need a mature and honest exchanges of views, not sneaky media leaks and cheap attacks on our integrity and professionalism.

Doctors see millions of Australians face-to-face every day. Multiply that number when you count radiology and pathology centres, pharmacies, and other health professionals.

Some groups have already commenced campaigns against Government health policies. More will join them if there is not a change in policy direction and a change in the Government’s public relationship with the health sector.

* An edited version of this column first appeared in the Australian Financial Review on 4 May 2016.


Turnbull’s hospital pass

Prime Minister Malcolm Turnbull has indicated financial relief for the nation’s beleaguered public hospitals will depend on finding additional sources of revenue, delivering a blow to hopes of averting a multi-billion dollar funding crisis set to hit the system from next year.

Mr Turnbull told a meeting of the AMA Federal Council that hospital funding was “a big issue”, and he fuelled speculation of a pre-election spending boost after revealing he was “in discussions” with premiers and chief ministers on the matter.

But the Prime Minister gave no sign his Government was contemplating a major change in the policy course set by the Coalition in 2014 when it announced funding changes that would rip $57 billion out of the public hospital system between 2017 and 2025.

Instead, he reinforced the need for more effective health spending, signalling there would be no let-up in the pressure on doctors, nurses and other health professionals to deliver greater efficiencies.

“Hospital funding is a big issue,” Mr Turnbull said. “It is something I am in discussions with chief ministers and state premiers [about], and we have COAG before not very long, where we will seek to take that issue forward.”

“[But], the big issue is where additional funding will come from.”

Several premiers, most notably Mike Baird in NSW and Jay Weatherill in South Australia, had proposed an increase in the GST – partially offset by other tax changes – to increase the health budget, but the Prime Minister reiterated his Government would not contemplate an increase in tax revenue.

“We have to recognise that Australians already pay high taxes,” Mr Turnbull said. “This is not a low-tax country, so getting better value [for health spending] is vital.”

Instead, while praising advances in the quality and effectiveness of health care, he exhorted health service providers to greater efficiency.

The Prime Minister said rising health expenditure was “often seen as an admission of failure, [but] the reality is that we are getting a lot more for it”, in terms of longer and healthier lives.

However, funding constraints meant that “the pressure is to get better and more effective outcomes” for the same outlay.

Q&A at AMA House

Following one-on-one talks with AMA President Professor Brian Owler, Mr Turnbull was joined by Health Minister Sussan Ley in meeting with AMA Federal Councillors, who grilled the pair on significant aspects of Federal Government health policy including public hospital funding, the Medicare rebate freeze, pathology and diagnostic imaging bulk billing incentives, medical workforce training and emergency department performance targets.

Several AMA Federal Councillors including Dr Tim Greenaway, Dr Saxon Smith and Dr David Mountain challenged the PM and Health Minister on the scale of the Federal Government’s cuts to hospital funding, pointing out the sharp growth in demand for hospital services occurring around the country.

Mr Turnbull questioned why there was a sharp rise in the number of patients showing up at hospital emergency departments, speculating that some of it may be due to a failure in primary care.

But Dr Mountain and Dr Smith explained that as people lived longer, they developed multiple health problems that could compound one another and quickly escalate, requiring expensive and complex emergency care.

Questioned on the Medicare rebate freeze, Ms Ley said on-going Budget deficits meant the Government was not in a position to restore rebate indexation, and was instead examining new models of primary care arising out of the recent review.

Addressing the cut to bulk billing incentives, the Health Minister said it was “not healthy” that the pathology sector was dominated by two providers, and said the major issue raised by pathologists she consulted with was not the incentive cut, but rents charged to co-locate with medical practices.

Ms Ley added that bulk billing incentives for concession card radiology patients had not been touched, supporting their access to care.

On medical training, Ms Ley said she was concerned to find ways to get more “generalist” practitioners into rural areas. The Minister said she did not believe in using Medicare provider numbers and other methods to bond doctors to work in particular areas, but the problem of luring more doctors into rural practice was one that “we do have to collectively solve”.

The Minister said the Government understood concerns around the establishment of a third medical school in Perth, but expressed doubts that the decision could be “unravelled”.

Adrian Rollins