×

Tracking the impact of climate change on health

The World Health Organisation (WHO) has launched the second round of its Climate and Health Country profiles – providing updated national level evidence on health risks and opportunities, and tracking progress.

The WHO UNFCCC Climate and Health Country Profile Project aims to provide country-specific, evidence-based snapshots of the climate hazards and health risks facing countries.

The project has strengthened the linkages between climate and health communities; promoted innovative research on national climate hazard and health impact modelling; and engaged an inter-ministerial network of climate and health focal points to develop, advance and disseminate the findings.

Climate change undermines access to safe water, adequate food, and clean air, exacerbating the approximately 12.6 million deaths each year that are caused by avoidable environmental risk factors.

Between 2030 and 2050, climate change is expected to cause approximately 250 000 additional deaths per year, from malnutrition, malaria, diarrhoea and heat stress, and billions of dollars in direct damage costs to health.

WHO works with countries across the world to protect the most vulnerable populations from the health effects of extreme weather events, and to increase their resilience to long-term climate change.

At the same time, the policy decisions and polluting energy sources that are causing climate change are also causing direct health impacts, most notably contributing to the 6.5 million deaths each year from air pollution.

Through the 2015 Paris Agreement on climate change, countries have made commitments to cut carbon pollution, for example through promoting cleaner energy sources, and more sustainable urban transport systems, that will also protect and improve the health of their own populations. WHO is supporting countries to assess the expected health gains from their Paris commitments, and to promote policy choices that bring the greatest benefits both to health, and the environment.

The Lancet has called climate change: “The biggest global health threat of the 21st century.”

The Lancet’s report Managing the Health Effects of Climate Change, states that the effects of climate change on health will affect most populations in the next decades and put the lives and wellbeing of billions of people at increased risk. 

The next series of WHO’s climate and health country profiles will be released in 2019.

The just released list can be found at: http://www.who.int/globalchange/resources/countries/en/

The AMA’s Position Statement on Climate Change and Human Health can be viewed at: position-statement/ama-position-statement-climate-change-and-human-health-2004-revised-2015

MEREDITH HORNE

[Correspondence] New mercury pollution threats: a global health caution

The Minamata Convention—a global agreement to tackle mercury—will enter into force on Aug 16, 2017, as the required 50th of the 128 signatory countries recently ratified the treaty, marking a long-awaited moment for the advancement of public health. However, while this achievement is celebrated, questions about whether governments are prepared to tackle complex issues surrounding implementation of the Convention remain rife. The Trump Administration has been actively working to revoke a host of environmental and health regulations, including restrictions on mercury discharges from coal-fired power plants, despite legal challenges by civil society groups.

Yemen cholera outbreak claims one life every hour

The rising number of suspected cases of cholera resulting from a severe outbreak in Yemen has passed 100,000, the World Health Organization (WHO) reports.

Cholera is affecting the most vulnerable. Children under the age of 15 years account for 46 per cent of cases, and those aged over 60 years represent 33 per cent of fatalities.

Cholera, an acute enteric infection, is caused by the ingestion of food or water contaminated with the bacterium Vibrio cholera. It can kill children within just a few hours. Cholera should be an easily treatable disease when there is access to functioning medical services. 

WHO believes that cholera is primarily linked to insufficient access to safe water and proper sanitation and its impact can be even more dramatic in areas where basic environmental infrastructures are disrupted or have been destroyed.

Humanitarian partners have been responding to the cholera outbreak since October 2016.  However, Yemen’s health, water and sanitation systems are collapsing after two years of war. The risk of the epidemic spreading further and affecting thousands more is real as the water hygiene systems are unable to cope.

The UN Office for the Co-ordinatior of Humanitarian Affairs (OCHA) Jamie McGoldrick said the fast spreading epidemic in Yemen was “of an unprecedented scale”.

Mr Goldrick also fears that hundreds of thousands of people are at a greater risk of dying as they face the “triple threat” of conflict, starvation and cholera. He believes the cause is clear.

“Malnutrition and cholera are interconnected; weakened and hungry people are more likely to contract cholera and cholera is more likely to flourish in places where malnutrition exists,” Mr Goldrick said. 

More than half of Yemen’s health facilities are no longer functioning, with almost 300 having been damaged or destroyed in the fighting.

Systems that are central to help treat and prevent outbreaks of the disease have failing in Yemen. Fifty per cent of medical facilities no longer function. Some have been bombed and others have ground to a halt because there is no funding.

The International Committee of the Red Cross (ICRC) Director of Operations Dominik Stillhart said: “Hospitals are understaffed and cannot accommodate the influx of patients – with up to four people seeking treatment per bed. There are people in the garden, and some even in their cars with the IV drip hanging from the window.”

Local health workers, including doctors and nurses have not been paid for eight months; only 30 per cent of required medical supplies are being imported into the country; rubbish collection in the cities is irregular; and more than eight million people lack access to safe drinking water and proper sanitation.

UNICEF is reported to have flown in over 40 tonnes of medicines, rehydration salts, intravenous fluids and other life-saving supplies to treat approximately 50,000 patients in Yemen.

Meredith Horne

Paradigm shift in monitoring and improving brain health

The world’s most prestigious gathering of medical practitioners in functional medicine and integrative care hosted a symposium in Los Angeles recently, featuring today’s greatest revolutionaries in changing how we view and treat brain health.

The Annual International Conference of the Institute for Functional Medicine chose scientifically-disruptive and broadly-acclaimed neuroscientist Dr Michael Merzenich to address its plenary session.

Dr Merzenich unveiled a revolutionary approach to monitoring, maintaining and improving brain health. The system uses apps and digital therapies.

Dr Merzenich is the Chief Scientific Officer of Posit Science, maker of BrainHQ brain exercises and assessments.

He joined Alzheimer’s experts Dr Dale Bredesen (of UCLA and the Buck institute) and Dr Rudolph Tanzi (of Harvard and Massachusetts General Hospital) for a discussion of the application of neuroplasticity to dementia.

The theme of the conference was The Dynamic Brain: Revealing the Potential of Neuroplasticity to reverse Neurodegeneration

Dr Merzenich discussed research supporting the idea that we can systematically harness brain plasticity and drive positive changes in brain systems through plasticity-based training.

“Breakthroughs in technology and science will permit people to monitor their brain health on a daily basis and take appropriate action to maintain their brain health using a device they already carry in their pockets,” he said.

“A phone with apps to assess current condition, to suggest holistic interventions, and to deliver the right brain exercises. This technology already exists, and all the pieces are coming together.”

Dr Merzenich believes we are in the midst of a paradigm shift regarding how we view and treat most aspects of brain health.

“We don’t have a magic pill to prevent or cure heart disease, and instead look to behavioural changes to reduce risk and early interventions to address symptoms,” he said.

“There is a rapidly growing consensus among thought leaders that we need a similar approach to cognitive disorders and improvement. This approach will include nutrition, physical exercise and environmental factors – but the single most important elements will be lifelong monitoring of brain health and appropriate plasticity-based brain exercises.”

Dr Merzenich is professor emeritus at University of California San Francisco, where he maintained a research lab for three decades. He ran the seminal experiments that led to the discovery of lifelong plasticity – the ability of the brain to change chemically, structurally and functionally based on sensory and other inputs. He pioneered harnessing the power of plasticity in the co-invention of the cochlear implant, which has restored hearing to 100,000s of people living with deafness. 

Dr Merzenich also pioneered the application of plasticity in the development of plasticity-based computerised brain exercises, which have helped millions of people.

Chris Johnson

[Correspondence] Exposure to lead in petrol and increased incidence of dementia – Authors’ reply

We appreciate the comments by Esme Fuller-Thomson and Sydney A Jopling, and Mark A S Laidlaw and colleagues on our cohort study,1 in which we investigated the association between living close to busy roadways and the incidence of dementia, Parkinson’s disease, and multiple sclerosis in Ontario, Canada. Both letters hypothesised that past exposure to leaded petrol might explain, at least partly, our observed association between living near roadways and higher incidence of dementia. Their proposition is an important reminder of the potentially long-lasting negative effects of many environmental factors on human health, even decades after exposures are dramatically reduced.

Air pollution linked with heart damage

A new report presented by the European Society of Cardiology says that there is strong evidence that particulate matter (PM) emitted mainly from diesel road vehicles is associated with increased risk of heart attack, heart failure, and death.

The lead author Dr Nay Aung, a cardiologist and Wellcome Trust research fellow at the William Harvey Research Institute, Queen Mary University of London, UK, said the cause for the heart damage “appears to be driven by an inflammatory response – inhalation of fine particulate matter (PM2.5) causes localised inflammation of the lungs followed by a more systemic inflammation affecting the whole body.”

Regarding how pollution might have these negative effects on the heart, Dr Aung said PM2.5 causes systemic inflammation, vasoconstriction and raised blood pressure. The combination of these factors can increase the pressure in the heart, which enlarges to cope with the overload. The heart chamber enlargement reduces the contractile efficiency leading to reduction in ejection fraction.

The researchers said they found evidence of harmful effects even when levels of pollution associated with diesel vehicles were less than half the safety limit set by the European Union.

Dr Aung said: “We found that the average exposure to PM2.5 in the UK is about 10 µg/m3 in our study. This is way below the European target of less than 25 µg/m3 and yet we are still seeing these harmful effects. This suggests that the current target level is not safe and should be lowered.”

In the UK, where the study was conducted, the Government recently produced its third attempt at a plan to bring air pollution to within levels considered safe under European Union legislation after judges ruled the previous versions were not effective enough to comply with the law.

Dr Penny Woods, chief executive of the British Lung Foundation, said: “Air pollution (in the UK) is a public health crisis hitting our most vulnerable the hardest – our children, people with a lung condition and the elderly.” 

Dr Woods added that, while progress was being made in high-income countries to reduce deaths from cardiovascular disease and cancer, those caused by lung disease had “remained tragically constant”. 

The World Health Organisation (WHO) estimates that some 3 million deaths a year are linked to exposure to outdoor air pollution. WHO also believes that indoor air pollution can be just as deadly. In 2012, an estimated 6.5 million deaths (11.6 per cent of all global deaths) were associated with indoor and outdoor air pollution together.

Only one in ten people breathe safe air according to WHO guidelines and over 80 per cent of the world’s cities have air pollution levels over what these guidelines deem safe.

The Australian Medical Association has developed a Position Statement on Climate Change and Human Health that acknowledges air pollution is the world’s single largest environmental health risk.

Meredith Horne

Is the prevalence of mental illness increasing in Australia? Evidence from national health surveys and administrative data, 2001–2014

The known The rising cost of mental disorders has been interpreted as indicating that the prevalence of mental health problems is increasing. 

The new The prevalence of probable common mental disorders in Australia was fairly stable between 2001 and 2014. Over this same period, however, the number of working age individuals receiving disability support pensions for psychiatric conditions increased by about 50%. 

The implications While the costs and level of disability associated with mental disorders is rising, there has been no corresponding change in the prevalence of probable common mental disorders in Australia. 

It is popularly believed that we are in the midst of an epidemic of mental health problems.1 The most recent Global Burden of Diseases study found that the number of disability-adjusted life years (DALYs) attributed to mental disorders increased by 37% between 1990 and 2010, with depression becoming the fourth highest cause of disability in Australia.2 Studies in the United States, the United Kingdom and Australia have found that rates of antidepressant prescribing have more than doubled in recent decades.35 At the same time, a worldwide trend of mental disorders displacing musculoskeletal conditions as the predominant reason for illness-related absences and work incapacity has been noted.6,7 While these changes in rank represent, to some extent, a reduction in the burden of many somatic illnesses, the expense associated with mental illness has continued to rise, with the annual cost of depression in Australia now estimated to be $12.6 billion.8

The increasing societal and economic costs of common mental disorders (CMDs) have provoked the question of whether their underlying rates have actually increased, particularly in the working age population.9 Despite various indirect measures which indicate that the disability burden associated with CMDs has increased, studies of trends in CMD prevalence over recent decades have yielded mixed results; some have found rising rates of depression,10 for instance, while others have not.11,12 This inconsistency of findings might be explained by methodological differences. The main diagnostic tool for research studies, the Diagnostic and Statistical Manual of Mental Disorders (DSM), has been revised several times in recent decades. As a result, many sequential cross-sectional surveys have applied different diagnostic instruments or criteria for defining and diagnosing CMDs during individual survey periods,11,12 so that the prevalence rates at different time points may not be directly comparable. A second problem is that earlier studies analysed data for only two time points, often many years apart, making it difficult to draw definitive conclusions about trends in CMD prevalence. Finally, a number of published studies have used different sampling techniques at each time point, or have had significant differences in response rates, again making direct comparisons of prevalence at different time points very difficult.

In our study, we used data from multiple waves of the National and Australian Health Surveys, conducted by the Australian Bureau of Statistics (ABS), to assess changes in the prevalence of probable CMDs in Australia between 2001 and 2014. The data from these surveys are a unique resource for overcoming key limitations of previous studies. We also examined changes over the same period in the rates of disability support pensions (DSPs) granted for psychiatric disorders, allowing comparisons of changes in measures of the burden of CMDs with changes in CMD prevalence.

Methods

National health surveys

The National Health Survey (NHS) and Australian Health Survey (AHS) are household-based surveys undertaken at 3-year intervals to monitor health trends over time. Their methodologies have been described in detail.13 Trained ABS interviewers conducted face-to-face interviews over an 11-month period in each of 2001, 2004, and 2007 for the NHS and during 2011 and 2014 for the AHS. We analysed responses from adults aged 18–65 years.

Household and person weights were assigned to adjust for the probability of sample selection. Further adjustments were made for seasonality and non-response, and the data were then calibrated to the population benchmarks. Calibration ensures that the estimates are representative of population distributions and helps compensate for the over- or under-representation of particular categories of persons or households.

Assessment of common mental disorders

CMDs were assessed using the 10-item Kessler Psychological Distress Scale (K10). This scale, designed to assess non-specific psychological distress (predominantly symptoms of anxiety and depression), has been validated in various settings14 and found to have sound psychometric properties.15 K10 scores have been grouped into four categories: low (10–15), moderate (16–21), high (22–29) and very high (≥ 30) distress. Although there are no established cut-off standards for CMD caseness according to K10 scores, very high levels of psychological distress have been associated with a risk for meeting diagnostic criteria for anxiety or depression ten times greater than the overall population risk.14 We therefore defined two groups of probable CMD:

  • probable CMD (very high symptom level): respondents with K10 scores of 30 or more, reflecting the cut-off level adopted by the Australian National Survey of Mental Health and Wellbeing (NSMHWB);16 and

  • probable CMD (high symptom level): respondents with a K10 score of 22 or more.

Disability support pensions

We retrieved national data on the numbers of people receiving DSPs for psychological or psychiatric primary medical conditions17 between 2001 and 2014 from the website of the Department of Families, Housing, Community Services and Indigenous Affairs (now: Department of Social Services), and compared changes in their rates with trends in CMD prevalence. The proportion of the Australian working age population receiving a DSP for a mental illness was calculated by dividing the number of DSP recipients by the working age population (aged 16–64 years) for each year (ABS data).

Data analysis

All statistical analyses were performed in Stata 12.0 (StataCorp). Time trends in CMD prevalence and the proportion of the population receiving DSPs for psychiatric conditions were assessed in Cochran–Armitage trend tests. When not stratified by age, data were directly age-standardised against the estimated resident population of Australia at 30 June 2001.

Ethics approval

As is all data collection by the ABS, the gathering of data analysed in this study was covered by the Census and Statistics Act 1905, and the analyses were approved by both the Australian Parliament and the Privacy Commissioner.

Results

In 2001, 19 408 dwellings were selected for survey, of which 15 792 households provided full or adequate responses, a response rate of 81%. In 2004, 2007, 2011 and 2014, the numbers of participating households were 19 501, 15 792, 15 475 and 14 723 respectively (response rates, 82–91%). For all five survey periods, the study sample included a higher proportion of women than men. The age distributions for the five waves of data collection were similar, with the highest participation rates among those aged 25–64 years (data not shown).

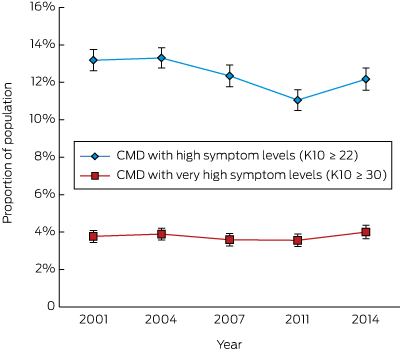
The prevalence rate in the Australian working age population of probable CMD with very high symptom levels did not vary significantly between 2001 and 2014 (for trend, P = 0.92). There was, however, a slight but statistically significant decrease in the estimated prevalence of CMD with high symptom levels, from 13.3% (95% confidence interval [CI], 12.7–13.8) in 2001 to 12.2% (95% CI, 11.6–12.8) in 2014 (for trend, P < 0.001), with a low point of 11.0% (95% CI, 10.5–11.6) in 2011 (Box 1). The estimated prevalence of probable CMD with high level symptoms exhibited a similarly small but statistically significant decline among those aged 25–34 (P = 0.002) or 35–44 years (P = 0.007); the decline for those aged 18–24 years was not statistically significant (P = 0.052) (Box 2).

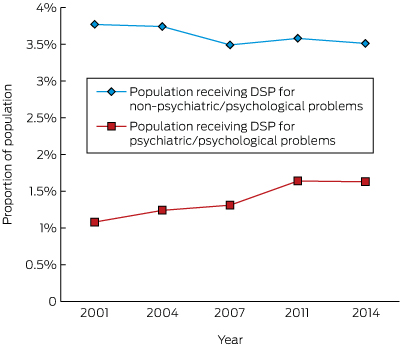
Although there was a significant decrease in the proportion of working age people receiving DSPs during the same time period (18.9%; for trend, P < 0.001; data not shown), there was a 51% increase in the proportion receiving DSPs for psychiatric conditions between 2001 and 2014 (for trend, P < 0.001), equivalent to one additional DSP for mental ill health for every 182 working age Australians (Box 3). Despite this increase, the proportion of people receiving DSPs remained substantially lower than the prevalence estimates for even the most severe probable CMD, suggesting that most people with depression or anxiety continued to work in some capacity. The proportion of DSPs granted for psychological and psychiatric conditions rose from 23% in 2001 to 32% in 2014.

Discussion

The data from repeated, nationally representative health surveys indicate that the prevalence of probable CMD among working age Australians has remained stable or even declined slightly between 2001 and 2014. This finding is contrary to the popular narrative of an increasing prevalence of mental health problems. Over the same period, we found that the proportion of working age people receiving DSPs for mental health problems had increased by about 50%. Although the costs and level of disability associated with mental disorders are rising in Australia, the increases do not appear to be linked with an increase in the underlying prevalence of common mental health problems.

Previous analyses of trends in the prevalence of mental disorders have often been hampered by changes in sampling methodology or diagnostic criteria at different time points. The main strength of our study is that the sampling methods and measuring instrument were consistent across the five survey periods, enabling direct comparison of prevalence rates. The response rates were high for all surveys (at least 81%), reducing potential inaccuracies in estimates caused by non-response bias.18

Limitations include the fact that caseness of probable CMD was defined by K10 scores. Using a measure of symptom severity rather than a diagnostic scale allowed us to avoid problems arising from changes in diagnostic classification, but high levels of self-reported symptoms are not the same as a diagnosed disorder, and the potential bias inherent to self-reports can lead to misclassification; this bias, however, should be stable over time. Further, the K10 is designed to detect only symptoms of depression and anxiety, but DSPs are awarded for the full spectrum of mental disorders. People with psychoses have very low rates of employment, although data from repeat rounds of the Australian Survey of High Impact Psychosis (SHIP) indicated that these rates have not changed over recent decades,19 suggesting that psychoses are unlikely to account for the rising rate of DSPs for mental disorders. Further, substance misuse problems included in some definitions of CMD are not captured by the K10; however, other data sources, such as the National Drug Strategy Household Survey, suggest that overall rates of substance misuse did not increase in Australia during the period of our study.20 Our assessment of DSP rates was based on administrative data, and relied on the recorded primary diagnosis. Receiving a disability pension may often depend on a combination of factors, and we had no information about non-primary diagnoses. Finally, we used the number of Australians aged 16–64 years as the denominator for calculating DSP rates, but the age pension eligibility age for women varied slightly during the study period; further, a very small proportion of DSP recipients remained on this benefit after turning 65. However, the numbers of people involved would have been very small, and should not have affected our results significantly.

We found no increase in psychological distress and probable CMD in Australia over the past decade, a result consistent with findings from large national surveys conducted in the USA,11 the UK,21 and the Netherlands.12 Interestingly, our findings conflict with two earlier studies of the prevalence of CMDs in Australia. Goldney and colleagues10 reported that the prevalence of major depression increased significantly between 1998 and 2008, although their study examined a South Australian population that may have had different demographic features from ours. In contrast, the NSMHWB found that CMD prevalence decreased by 20% between 1997 and 2007;16 the decline might, however, be explained by the use of different versions of diagnostic tools across the survey periods.

Despite the constant prevalence of probable CMD over the past ten years, we observed a significant increase in the proportion of people receiving DSPs for psychological or psychiatric medical conditions, consistent with findings in other developed countries.6,22 We propose four possible explanations for the conundrum of an increasing discrepancy between rates of mental health symptoms and the level of work disability attributed to mental illness.

Firstly, there could have been a change in labelling the causes of disability; practitioners may now be more inclined to apply the diagnostic labels of psychiatric disorders, or to identify the main cause of disability as a mental disorder when it is comorbid with physical disorders. The corresponding decrease in the proportion of disability benefits for some other common comorbid conditions, such as musculoskeletal problems, indirectly supports this possibility.22 That is, the apparent rise in the rates of disability attributed to mental disorders may reflect a correction of their historically being under-reported.

Secondly, the apparent rise in disability attributed to mental illness may reflect policy changes. Australians may receive any of a range of different income support payments, according to their personal or family circumstances and to whether they are temporarily unemployed or are deemed unfit for work because of a disability or impairment. In spite of the notional separation between different support types, it has been reported that many people with mental illnesses receive income support payments other than a DSP.23 A range of policy initiatives in Australia have attempted to promote greater connection between those on income support and potential work opportunities, an unintended consequence of which may have been to transfer people with mental health problems from more work-focused income support payments to schemes such as the DSP.23

Thirdly, it is possible that workplaces in Australia are becoming less tolerant of CMDs because of the changing nature and demands of contemporary work or because of social stigmas, forcing more people with CMDs to leave the workforce.

The final possibility is that the incidence of CMDs may be increasing, but this has been offset by the increased use of treatments that effectively control symptoms without having a substantial effect on functional outcomes. It has been reported, for instance, that pharmacological and non-pharmacological interventions significantly reduced the symptoms of depression, although their impact on the patient’s capacity to work was relatively small.24

Our findings are reassuring in that they provide robust evidence that the popular perception of an epidemic of CMDs in Australia is mistaken. However, the fact that functional impairment associated with mental health problems nevertheless continues to rise is a paradox. While the increase may reflect better recognition of and greater willingness to diagnose mental disorders in working Australians, it also means that greater emphasis on and more research into improving occupational outcomes for people with mental illness are needed.

Box 1 –
Age-standardised prevalence of probable common mental disorders (CMDs) in the Australian working age population, 2001–2014

Box 2 –
Prevalence of probable common mental disorders (CMDs)* in different age bands of the Australian working age population, 2001–2014

Age group (years)

Prevalence of probable common mental disorders (95% CI)


2001

2004

2007

2011

2014

P


18–24

16.3% (14.5–18.1)

15.5% (13.8–17.2)

11.8% (10.1–13.5)

11.8% (10.0–13.6)

15.4% (13.3–17.5)

0.052

25–34

13.2% (12.1–14.3)

11.8% (10.7–12.9)

12.3% (11.1–13.6)

10.9% (9.7–12.1)

10.9% (9.7–12.1)

0.002

35–44

12.9% (11.9–13.9)

14.0% (12.9–15.1)

11.5% (10.4–12.6)

10.9% (9.8–12.0)

11.9% (10.7–13.1)

0.007

45–54

12.7% (11.6–13.9)

13.5% (12.4–14.6)

13.2% (12.0–14.4)

11.4% (10.2–12.6)

12.4% (11.1–13.7)

0.12

55–64

11.7% (10.4–13.0)

12.2% (11.0–13.4)

13.2% (11.9–14.5)

10.4% (9.2–11.6)

11% (9.8–12.3)

0.08

Total (18–64 years)

13.3% (12.7–13.8)

13.4% (12.8–13.9)

12.4% (11.9–13.0)

11.1% (10.5–11.6)

12.2% (11.6–12.8)

< 0.001


* K10 score ≥ 22. † Cochran–Armitage trend test.

Box 3 –
Proportion of working age Australians receiving disability support pensions (DSPs), 2001–2014; age-standardised

[Editorial] Progress in environmental litigation

Ahead of June 5, which marks World Environment Day, the UN Environment and Colombia Law School’s Sabin Center issued a 40-page report, The Status of Climate Change Litigation—a Global Review, released on May 23, which brings together environmental cases of litigation to date. Effective solutions to combat the effects of climate change have been slow to arise. One of the main barriers to implementation is that holding one government or organisation accountable for a global issue is misaligned with the scale of the problem.

The sugar content of soft drinks in Australia, Europe and the United States

Despite recommendations by the World Health Organization and the National Health and Medical Research Council to limit the drinking of sugar-sweetened beverages (SSBs), Australians are particularly high consumers of such products.1 In the report of the Australian Health Survey, 39% of males and 29% of females over 2 years of age had consumed SSBs on the day prior to the interview in 2011–2012,1 and these drinks were the largest sources of sugar in the Australian diet.2

Soft drinks in Australia are chiefly sweetened with sugar cane-derived sucrose (online Appendix), a disaccharide of 50% glucose and 50% fructose; overseas, they are predominantly sweetened with high fructose corn syrup (United States) or sucrose-rich sugar beet (Europe). The sucrose, fructose and glucose content of soft drinks therefore varies between regions.

Glucose (but not fructose) rapidly elevates plasma glucose and insulin levels; fructose intake increases triglyceride production in the liver. Sucrose elicits a moderately rapid rise in blood glucose and insulin levels, as it must first be metabolised to free glucose and fructose. Variations in soft drink formulation will therefore have a biological impact because of differences in the final concentrations of glucose and fructose.3 As differences in the sugar content of soft drinks have not been systematically examined, we compared the final glucose and fructose content of popular soft drinks available in different regions.

The concentrations of sugars in five samples each of soft drinks marketed under the trade names Fanta, Sprite, Coca-Cola and Pepsi in the three regions Australia, Europe and the US (that is, 60 samples in total) were analysed by an independent, certified laboratory (National Measurement Institute, Australia) with high performance liquid chromatography. European samples of Fanta, Sprite, and Coca-Cola manufactured by the Coca-Cola Hellenic Bottling Company (HBC) Italia were representative of the corresponding soft drinks available in 28 European countries; samples of Pepsi manufactured by PepsiCo Beverages Italia were representative of the beverage available in 18 European countries. Each soft drink sample was derived from a different production batch; none contained intense sweeteners, such as aspartame or stevia. Total fructose and glucose concentrations (calculated final monosaccharide concentrations), allowing for contributions from sucrose, were calculated for each drink. Concentrations in each drink brand were compared in one-way analyses of variance (ANOVA) and, where appropriate, individual means were compared in post hoc least significant difference tests.

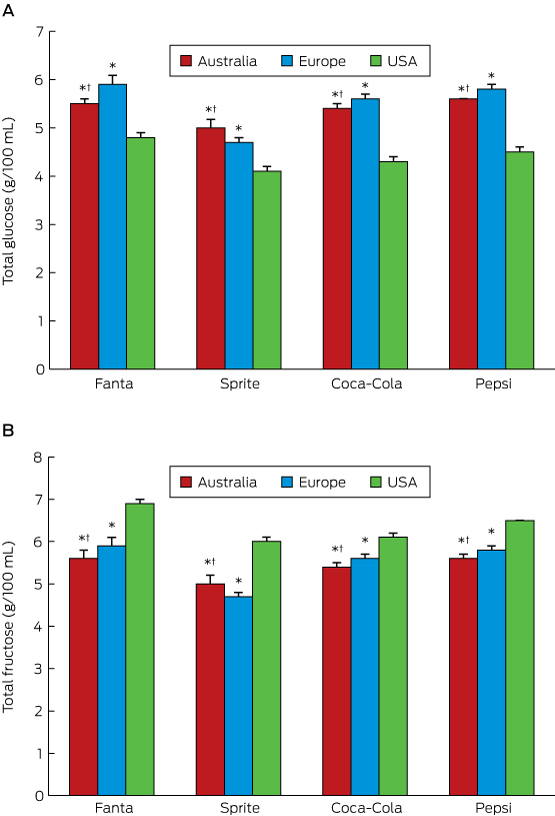
The mean total glucose concentration of Australian soft drinks was 0.96 g/100 mL (SD, 0.22) higher than for the corresponding US drinks, a mean 22% (SD, 6%) difference (P < 0.05; Box). Most glucose in Australian formulations was attributable to sucrose (online Appendix). The total glucose concentration of European soft drinks was generally similar to that of Australian formulations (1.04 g/100 mL [SD, 0.34] higher than US formulations, or 23% [SD, 8%] greater; P < 0.05; Box). The total fructose concentration was lower in Australian (mean difference, 0.97 g/100 mL; SD, 0.28) and European formulations (0.89 g/100 mL; SD, 0.35) than in corresponding US formulations (P < 0.05; Box). The concentration of total sugars was, consequently, similar for corresponding drinks from the three regions.

The potential health implications of regional differences in soft drink sugar content have not previously been examined, despite the differing metabolic effects of glucose and fructose.4 While the potential adverse effects of fructose overconsumption, particularly lipid accumulation, have been widely reported,4,5 those of Australian soft drinks containing high glucose concentrations have not been investigated.

Our short report should motivate specific examination of the health effects of Australian soft drink formulations.

Box –
Mean concentrations of total glucose (A) and total fructose (B) in popular soft drinks in Australia, Europe and the United States


Five samples of each soft drink from each region were analysed. * P < 0.05 v US concentration; † P < 0.05 v European concentration. The full data for the concentrations of glucose, fructose, and sucrose, and of total glucose and total fructose in each drink is included in the online Appendix.

Reducing cardiovascular disease risk in diabetes: a randomised controlled trial of a quality improvement initiative

The known Managing risk factors for cardiovascular disease (CVD) in patients with diabetes improves their outcomes, but many are not prescribed the recommended treatments. Electronic decision support is a scalable strategy for improving guideline implementation. 

The new The implementation of recommended management of CVD risk factors in people with diabetes is incomplete, but better than for patients without diabetes. An electronic decision support tool achieved modest improvements in CVD risk factor screening and treatment escalation in patients with diabetes. 

The implications While computerised tools may play an important enabling role, broader strategies are needed to close evidence–practice gaps. 

By 2030, diabetes may affect more than 300 million people worldwide.1 Cardiovascular disease (CVD) is the primary cause of mortality and morbidity in patients with type 2 diabetes,2 and large studies have found that managing risk factors for CVD in patients with diabetes reduces both.3,4 According to risk management guidelines, decisions about the need for and the intensity of intervention should be based on the estimated absolute risk.5

A number of guidelines for managing CVD risk in people with diabetes have been published, but studies in Australia6,7 and overseas810 have consistently found that these strategies have been only incompletely implemented. Most Australian studies, however, predate a number of targeted quality improvement (QI) programs, including the National Divisions Diabetes, Australian Primary Care Collaboratives, and National Integrated Diabetes Programs, as well as the introduction of targeted incentive payments to general practitioners and practices, and may therefore not accurately reflect current practice. Whether any of these initiatives improved quality of care is unknown.

In this article we describe the contemporary primary care management in Australia of patients with diabetes participating in a study of CVD risk management in primary health care. Our primary objectives were to assess adherence to CVD risk screening and management guidelines, and to determine the effectiveness of a new QI intervention for improving risk management. The main results of the QI study have been published elsewhere;11 we report here a subgroup analysis comparing the outcomes for patients with and without diabetes.

Methods

The Treatment of Cardiovascular Risk in Primary care using Electronic Decision Support (TORPEDO) study was a parallel arm, cluster randomised, controlled trial involving 60 Australian primary health care services (40 general practices and 20 Aboriginal Community Controlled Health Services [ACCHSs]). It assessed whether a QI intervention combining point-of-care electronic decision support with audit and feedback tools improved CVD risk management. The TORPEDO study methods have been described in detail elsewhere.11

Practice eligibility criteria

Health services were eligible to participate if they exclusively used either of the two most common electronic health record systems in Australia for recording risk factor information, pathology test results and prescribed medications. General practices from the Sydney region were recruited between September 2011 and May 2012 through primary health care networks (previously: Medicare Locals), and ACCHSs through two state representative bodies in New South Wales and Queensland.

Patient eligibility criteria

Eligible patients were Aboriginal and Torres Strait Islander people at least 35 years old and non-Indigenous people at least 45 years old (age ranges based on national CVD risk guidelines5) who had attended a participating service at least three times during the preceding 24 months and at least once during the past 6 months. The presence or absence of diabetes was established by a recorded diagnosis of diabetes (type not specified) or a glycosylated haemoglobin (HbA1c) measurement at baseline of more than 53 mmol/mol. This threshold was chosen as a conservative estimate during the transition period in Australian diagnostic criteria for diabetes, which now recommend a threshold of 48 mmol/mol.

Randomisation

Services were randomised (1:1) to intervention or control groups, stratified at three levels: ACCHSs v mainstream general practices; service size (less than 500 v 500 or more eligible patients); and current participation in a national or state QI program. Permuted block randomisation was performed centrally; outcome analyses were blinded to allocation.

Intervention

Full details of the intervention have been published previously.12 In brief, a screening and management algorithm was developed and validated, based on a synthesis of recommendations from several guidelines (online Appendix 1).13 The algorithm incorporated CVD risk assessment, as well as recommendations for managing CVD, chronic kidney disease, blood pressure (BP) and cholesterol, but not for blood glucose management.

Five-year risk of a cardiovascular event was estimated with the Australian risk calculator, based on the 1991 Anderson Framingham equation.14 High CVD risk is defined in Australian guidelines5 as a calculated 5-year CVD risk of greater than 15%; the presence of diabetes in a person over 60 years old, diabetes together with albuminuria, estimated glomerular filtration rate (eGFR) below 45 mL/min/1.73 m2, systolic BP greater than 180 mmHg, diastolic BP greater than 110 mmHg, or total blood cholesterol level over 7.5 mmol/L; or the presence of CVD, defined as a recorded diagnosis of coronary heart disease, cerebrovascular disease (ischaemic stroke or transient ischaemic attack), or peripheral vascular disease. Risk was based on the most recent available results, whether or not the participant was being treated for that risk factor.

The algorithm interfaced directly with the two eligible electronic records systems. Data from the patient record were automatically prepopulated in the tool, and used to generate point-of-care CVD risk management recommendations. A data extraction tool provided site-specific audits, and feedback performance reports were generated. Clinical staff were trained in the application of the tool and had access to a support desk and bi-monthly webinars. The intervention lasted a minimum of 12 months.

Data collection

De-identified data for all patients who met the eligibility criteria were extracted from the clinical database of each health service with a validated data extraction tool.15 The extracts were uploaded to the study database together with an encrypted identifier code.

Outcomes

The primary outcomes for the randomised trial11 were:

  • The proportion of eligible patients who received appropriate screening for CVD risk factors by the end of the study. This was defined as data for all relevant risk factors having been recorded or updated (smoking status, BP in the past 12 months, total blood cholesterol and high-density lipoprotein (HDL)-cholesterol levels in the past 24 months).

  • The proportion of patients at high CVD risk at baseline who were receiving recommended medication prescriptions at the end of the study (prescription of at least one BP-lowering drug and a statin for people at high risk without CVD; reduction of CVD risk to below 15% by the end of study; prescription of at least one BP-lowering drug together with a statin and an antiplatelet agent for people with established CVD, unless contraindicated by oral anticoagulant use).

Secondary outcomes included:

  • the primary outcomes for individuals at high risk who were undertreated at baseline;

  • measurements of individual CVD risk factors (smoking status, BP, blood lipid levels, body mass index [BMI], eGFR, albuminuria);

  • escalation of drug prescription for patients at high risk of CVD (either newly prescribed or additional antiplatelet, BP-lowering and lipid-lowering agents); and

  • BP and serum lipid levels in people at high risk of CVD.

Sample size

Randomisation of 60 services (30 per arm) would provide 90% power to detect an absolute higher occurrence of 10% for each primary study outcome in the intervention arm, assuming a 10% absolute improvement in the control arm, an average cluster size of 750 patients (30% of whom were at high risk of CVD), baseline risk factor measurement and prescribing rates of 50%, α = 0.05 (two-sided), and an intraclass correlation coefficient of 0.05.

Statistical analysis

Post hoc descriptive analyses of baseline data from the TORPEDO study and of data for the cohort of participants present at both baseline and study end were undertaken. Data are presented as means with standard deviations, medians with interquartile ranges, or proportions. Baseline differences between patients with and without diabetes were tested in generalised estimating equations (GEEs) with an exchangeable correlation structure to account for clustering of patients in services.

To determine the predictors of suboptimal drug therapy at baseline, cross-sectional analyses were conducted in a GEE model with logit link function, including both patient level characteristics and service level data. Associations between risk factors and drug therapy were expressed as unadjusted odds ratios (with 95% confidence intervals [CIs]) for binary outcomes.

Intervention effects were analysed by log-binomial GEE regression. The rate ratios of intervention effect were calculated for the individual outcomes at the end of the study. The effects of the intervention in the subgroup of undertreated participants at baseline were analysed in the same model, stratified by diabetes status. An interaction term was included in all models to assess heterogeneity of effects by diabetes status.

Statistical analyses were conducted in SAS Enterprise Guide 5.1 (SAS Institute).

Ethics approval

The study was approved by the University of Sydney Human Research Ethics Committee (HREC) (reference, 2012/2183) and the Aboriginal Health and Medical Research Council of New South Wales HREC (reference, 778/11). Signed agreements with participating sites were obtained. Individual consent waiver was granted because data were collected from de-identified extracts from the electronic health record system.

Results

Recruitment

Sixty-four services were initially recruited; 31 were randomised to the intervention arm (but one withdrew shortly after randomisation) and 30 to usual care (online Appendix 2). Baseline data were extracted for 53 164 patients, including 8829 with diabetes; a cohort of 38 725 (6909 with diabetes) were followed up for outcome evaluation. The median follow-up time was 17 months.

Sample characteristics at baseline

Of the 8829 patients with diabetes at baseline, most had a recorded diagnosis of diabetes (97%); 3% were defined by HbA1c levels exceeding 53 mmol/mol. The mean age, and the proportions who were men, smokers or Indigenous Australians were higher for people who had diabetes than for those who did not. Their mean systolic BP and blood triglyceride levels were also higher, while their low-density lipoprotein (LDL)- and HDL-cholesterol levels were lower. Albuminuria, renal impairment and an established diagnosis of CVD were more common in people with diabetes (for all differences: P < 0.001; online Appendix 3).

Recording of risk factors and CVD risk at baseline for people with diabetes

Overall, appropriate measurement of CVD risk factors in people with diabetes was greater than for those without diabetes (62.0% v 39.5%; P < 0.001; online Appendix 3), a difference that remained after adjusting for age, sex, and Indigenous status (P < 0.001). BMI was recorded for 81% of people with diabetes, smoking status for 89%, HbA1c levels for 86%, systolic BP for 94%, albuminuria assessment for 59%, and eGFR for 87%. Recording rates for total, LDL- and HDL-cholesterol levels were 87%, 82% and 79% respectively.

More than one-quarter of patients with diabetes (26%) had established CVD; a further 12%, 4%, and 49% had an estimated 5-year CVD risk that was low (< 10%), medium (10–15%), or high (> 15% or clinically high risk condition present) respectively. There was insufficient information for 825 patients (9%) to categorise their risk (online Appendix 3).

Prescribing rates at baseline for people with diabetes at high risk of CVD

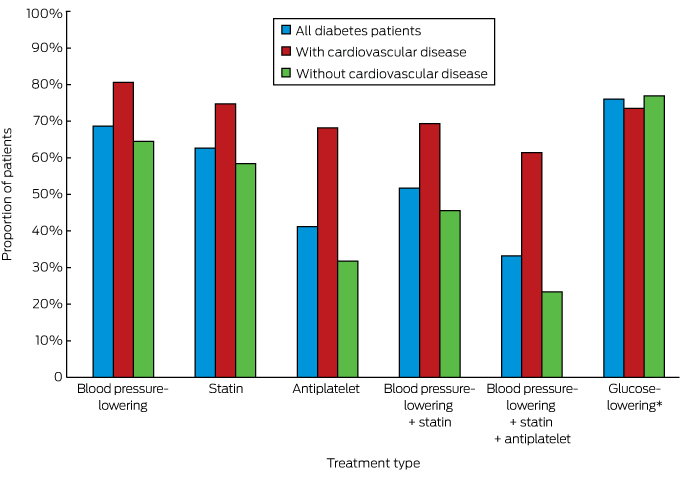
Appropriate prescribing of medications for those identified as being at high risk of CVD was greater among people with diabetes than for those without diabetes (55.5% v 39.6%, P < 0.001; online Appendix 3). Overall, 52.4% of people with diabetes at high risk of CVD but without established CVD and 61.4% of patients with diabetes and established CVD were prescribed recommended medications for averting CVD; the corresponding figures for people without diabetes were lower (22.0% and 49.3% respectively; for each comparison, P < 0.001) (online Appendix 3). The individual medication types prescribed for people with diabetes are shown in Box 1.

Risk factor targets

The HbA1c levels of 57.3% of patients with diabetes exceeded 53 mmol/mol; about one-quarter of these patients were not prescribed glucose-lowering therapy (Box 2). Similarly, the BP and lipid levels of large proportions of patients with diabetes exceeded recommended target levels (online Appendix 4); of the 61.9% of patients who did not meet the LDL-cholesterol target of 2.0 mmol/L, 44.3% were not prescribed a statin (Box 2).

Predictors of drug prescription

People with diabetes who were older (P < 0.001) or Indigenous (P = 0.030), or had a higher HbA1c level (P = 0.030), higher systolic BP (P < 0.001), or albuminuria (P < 0.001), were more likely to be prescribed the recommended combination treatment. Conversely, those with higher total cholesterol levels were less likely to receive optimal combination treatment (P < 0.001). Those who did not have a government-reimbursed health assessment (P = 0.012) or care plan (P < 0.001) were also less likely to be prescribed the recommended medications. Service type (general practice v ACCHS) did not influence drug prescription in univariable or multivariable analyses (online Appendix 5).

Effectiveness of the QI intervention

The baseline characteristics of the cohort used for outcome evaluation were similar for the intervention and control groups (online Appendix 3). The intervention was less effective in improving risk factor screening in patients with diabetes than in those without diabetes (P = 0.01). The intervention was only effective in improving rates of prescribing of recommended medications for undertreated individuals at high risk. and was not influenced by diabetes status (P = 0.28). The intervention was associated with intensification of existing antiplatelet, lipid-lowering, and BP-lowering therapy to a similar extent in people with and without diabetes. The intervention did not affect the prescription of glucose-lowering therapy (Box 3).

Discussion

People with diabetes in a contemporary Australian primary care population were more likely to be screened and prescribed the recommended medications for managing CVD risk factors than those without diabetes. The QI intervention was modestly effective in improving screening and treatment levels, but the evidence–practice gaps remained substantial.

Screening deficits were most marked with regard to cholesterol and albuminuria tests, consistent with both overseas16 and local17,18 reports. A recent French study16 found that only half of a group of patients with diabetes had been screened for proteinuria or albuminuria during the previous 12 months, suggesting that renal function is a poorly assessed CVD risk factor. Underprescribing of recommended treatments was striking when the patients with diabetes in our study were stratified by absolute risk: 39% of those with established CVD and 48% of those at high risk of CVD were not prescribed the recommended treatments; almost half of those with diabetes and LDL-cholesterol levels above 2.0 mmol/L were not receiving statin therapy. Similarly, BP targets were not met by half the patients with diabetes, of whom more than one-quarter were not prescribed antihypertensive therapy. These treatment deficits are consistent with international experience,810,16 and reflect modest improvements when compared with the findings of previous Australian studies of lipid6,7 and BP7,19 management.

About one-half of people with diabetes did not meet the recommended HbA1c goal of 53 mmol/mol or less, similar to the 57% figure in the 2003/2004 assessment of the United States National Health and Nutrition Examination Survey (NHANES) participants.20 It is worrying that about one-quarter of our patients with HbA1c levels over 69 mmol/mol were not prescribed glucose-lowering medication, a proportion substantially larger than the 3% of patients with HbA1c levels of 53 mmol/mol or more not treated in a recent Canadian study.10 Our findings may be partly explained by patient preference for non-pharmacological treatment, and by relaxed glycaemic targets in certain populations (older people, and people with frequent hypoglycaemia or hypoglycaemic unawareness).

Our findings suggest that undertreatment has diminished to some degree since 2002, which may reflect the effect of incentive schemes and quality of care initiatives. The deficits that remain may be explained by the proliferation of guidelines with differing perspectives, and time-pressured consultations with patients presenting with several complaints. Patients with diabetes who had a formal care plan, enabling coordination of their management with other health care providers, were more likely to be treated as recommended. However, causal inferences cannot be made, as numerous factors may confound this association.

The finding that CVD risk screening and management at baseline was better for those with diabetes than for people without diabetes is consistent with other reports,21,22 and may explain why the effect of the intervention was less marked in these patients. Although it was not effective in improving the overall level of new prescriptions for individuals at higher risk of CVD, the intervention was associated with improvements for people who were not receiving recommended treatments at baseline, regardless of their diabetes status. This is important in light of suggestions that therapeutic inertia may be a greater contributor to lost therapeutic benefit in patients with diabetes than lack of treatment.23

There is evidence that patient-directed interventions combined with physician-focused strategies may be more effective than the latter alone.24 Successful elements of collaborative care programs for improving chronic disease management include evidence-based guidelines, systematic screening and monitoring of risk factors, scheduled recall visits, new or adjusted roles for team members, information support for the clinician, enhanced self-management by the patient, effective communication between all members of the care team, and audit information for the practice.25 New policy proposals, such as “Health Care Homes”,26 and a renewed focus on initiatives such as “My Health Record” incorporate some of these elements.

Study limitations

Many of the sites in our study were teaching practices; this may explain why performance was higher than reported in previous studies. However, the recruited services were reasonably representative of Australian general practice with respect to the use of information technology.27 The ACCHSs recruited were geographically diverse and had similar service characteristics to the sector as a whole.28

The National Vascular Disease Prevention Alliance (NVDPA) guidelines5 recommend incorporating pre-treatment risk factor levels when assessing CVD risk. As pre-treatment data were not available, we analysed the patients’ most recent BP and lipid data, regardless of treatment status, and this may have led to underestimating risk for some individuals. However, as 72% of patients with diabetes were at high risk regardless of their risk score (online Appendix 3), this was probably not a major problem.

We regarded 2 years as an appropriate interval between lipid measurements, rather than varying the interval according to risk status as recommended by NVDPA guidelines. This may not have been appropriate for individuals at high risk, for whom more frequent testing is recommended. Conversely, the Royal Australian College of General Practitioners guidelines recommend 5-yearly lipid measurements for people at low risk;29 if doctors are adhering to these recommendations, the frequency of assessment may be adequate, but with a median follow-up period of 17 months we were not able to assess whether this was the case. If biases were introduced by using different lipid measurement intervals, we would expect them to be the same for the intervention and control arms.

Other limitations included the fact that that the type of diabetes was not specified, and that relying on electronic records data precluded assessing the role of clinical judgement in treatment decisions.

Conclusion

Although recommendations for managing CVD risk were more frequently implemented for people with diabetes than for those without diabetes, evidence–practice gaps remain. While the evaluated intervention was moderately effective in improving screening of risk factors, additional strategies are needed if Australia is to meet targets of reducing mortality for CVD and diabetes by 25% over the next 10 years.30

Box 1 –
Rates of prescribing of currently recommended cardiovascular disease risk-factor-specific medications for patients with diabetes


* For patients with HbA1c levels above 53 mmol/mol.

Box 2 –
Patients with diabetes with values above targets at baseline, and number who did not receive the corresponding recommended treatment

Patients with elevated level

Number not treated to reduce level


HbA1c level

> 53 mmol/mol

4329 of 7556 (57.3%)

1038 (24.0%)

> 69 mmol/mol

1822 of 7556 (24.1%)

450 (24.7%)

Blood pressure (BP)

Systolic BP > 130 mmHg or diastolic BP > 80 mmHg

4835 of 8329 (58.1%)

1354 (28.0%)

LDL-cholesterol level

> 2.0 mmol/L

4339 of 7007 (61.9%)

1922 (44.3%)

> 2.5 mmol/L

2769 of 7007 (39.5%)

1412 (51.0%)


HbA1c = glycated haemoglobin; LDL = low-density lipoprotein.

Box 3 –
Effects of the quality improvement intervention in patients with and without diabetes

Intervention

Usual care

Rate ratio

95% CI

P*


Receiving appropriate screening

12 164/19 385 (62.8%)

10 317/19 340 (53.4%)

1.25

(1.04–1.50)

0.01

With diabetes

2738/3617 (75.7%)

2323/3292 (70.6%)

1.14

(1.00–1.30)

Without diabetes

9426/15 768 (59.8%)

7994/16 048 (49.8%)

1.28

(1.04–1.58)

Receiving appropriate screening (undertreated at baseline)

3773/9276 (40.7%)

3532/10 782 (32.8%)

1.38

(1.10–1.73)

< 0.01

With diabetes

559/1160 (48.2%)

507/1151 (44.0%)

1.28

(1.00–1.63)

Without diabetes

3214/8116 (39.6%)

3025/9631 (31.4%)

1.40

(1.11–1.78)

Patients at high risk of cardiovascular disease

Receiving appropriate prescriptions

3030/5335 (56.8%)

2483/4846 (51.2%)

1.11

(0.97–1.27)

0.10

With diabetes

1700/2679 (63.5%)

1458/2495 (58.4%)

1.06

(0.93–1.21)

Without diabetes

1330/2656 (50.1%)

1025/2351 (43.6%)

1.18

(1.03–1.36)

Receiving appropriate prescriptions (undertreated at baseline)

1085/2827 (38.4%)

472/2263 (20.9%)

1.59

(1.19–2.13)

0.28

With diabetes

553/1269 (43.6%)

178/923 (19.3%)

1.63

(1.11–2.38)

Without diabetes

532/1558 (34.2%)

294/1340 (21.9%)

1.53

(1.16–2.01)

Increased antiplatelet therapy

470/2638 (17.8%)

65/2424 (2.7%)

4.79

(2.47–9.29)

0.08

With diabetes

210/908 (23.1%)

20/829 (2.4%)

7.28

(3.34–15.9)

Without diabetes

260/1730 (15.0%)

45/1595 (2.8%)

4.05

(2.03–8.08)

Increased lipid-lowering therapy

1026/5335 (19.2%)

226/4846 (4.7%)

3.22

(1.77–5.88)

0.84

With diabetes

608/2679 (22.7%)

130/2495 (5.2%)

3.32

(1.74–6.33)

Without diabetes

418/2656 (15.7%)

96/2351 (4.1%)

3.22

(1.77–5.86)

Increased blood pressure-lowering therapy

1243/5335 (23.3%)

586/4846 (12.1%)

1.89

(1.09–3.28)

0.54

With diabetes

729/2679 (27.2%)

316/2495 (12.7%)

1.91

(1.09–3.35)

Without diabetes

514/2656 (19.4%)

270/2351 (11.5%)

1.96

(1.10–3.47)

Patients with HbA1clevels > 53 mmol/mol at baseline

Appropriate glucose-lowering drug

1111/1269 (87.6%)

955/1118 (85.4%)

1.02

(0.95–1.11)

Increased glucose-lowering therapy

711/2679 (26.5%)

304/2495 (12.2%)

1.75

(0.95–3.22)


* Patients with diabetes v patients without diabetes. † For patients not meeting recommended targets for corresponding parameters (online Appendix 4).