×

Decreasing prevalence of Trichuris trichiura (whipworm) in the Northern Territory from 2002 to 2012

Trichuris trichiura (whipworm) is a soil-transmitted helminth (STH) endemic to areas with a tropical climate. Infection occurs after the soil-residing egg of T. trichiura is ingested.1 Eggs are expelled in the faeces of infected hosts and continue this cycle after a period of maturation in the soil.1 An estimated 600–800 million people are infected with T. trichiura worldwide and this infection is estimated to cause the loss of 1.6–6.4 million disability-adjusted life-years.1,2 T. trichiura is the most prevalent helminth in many countries surveyed.35 Heavy infections (> 10 000 eggs per gram of faeces) are associated with anaemia, malnutrition, the trichuris dysentery syndrome and rectal prolapse.68

The Northern Territory has a population of about 232 000 in a geographic area of 1 200 000 km2.9 Thirty per cent of the population is Indigenous and 80% of Indigenous residents live in remote locations.9 T. trichiura is one of three STHs that are endemic in the NT; the other two are Ancylostoma duodenale (hookworm) and Strongyloides stercoralis. A 1997 prevalence study found T. trichiura to be the commonest STH, with 25% of adults in a remote Indigenous community infected;10 no data on T. trichiura in the NT have been reported since. T. trichiura infection is difficult to treat and even more difficult to target within a deworming program. The Central Australian Rural Practitioners Association (CARPA) treatment manual currently recommends albendazole (400 mg) on 3 consecutive days for treatment of proven T. trichiura infection.11 This regimen has been correlated with a 50% cure rate.12 Since 2005, CARPA has recommended a single dose of albendazole (400 mg) for all children aged 6 months to 16 years as part of a community children’s deworming program. Empirical deworming is recommended before and after the wet season, or coinciding with child health assessments or school-age screening.11 Pregnant women are not targeted within this program. However, when pregnancy does occur within the target group, deworming with pyrantel is recommended.11

Under these deworming protocols, it has been reported that the prevalence of hookworm in the NT declined dramatically in the past 11 years and may be heading toward eradication.13 Our aim in this study was to describe the population at risk, disease associations and temporal trends of T. trichiura infections over the same 11 years.

Methods

In September 2013, we conducted a retrospective observational analysis of consecutive, microbiologically confirmed cases of T. trichiura infection in the NT between 1 January 2002 and 31 December 2012. Ethics approval for the study was obtained from the Human Research Ethics Committee of the NT Department of Health and Menzies School of Health Research (HREC-2013-1978).

Cases were identified from the NT Government pathology information system, Labtrak, which covers all NT Government health care facilities including five hospitals, two correctional centres and over 50 remote clinics. Previous STH studies13 have shown that the public NT laboratories identified 94% of all documented STHs, compared with 6% by other pathology service providers. Cases were diagnosed by examination of faeces specimens for T. trichiura eggs, other STHs and parasites by wet mount microscopy and a concentration method.14 Egg counts were not performed.

Infections were linked to NT Government electronic databases by means of medical record numbers to obtain data on age, sex, Indigenous status, place of residence, haemoglobin level and eosinophil count. Anaemia was defined as a haemoglobin level of ≤ 110 g/L and eosinophilia as an eosinophil count of ≥ 0.5 × 109/L.

Statistical analysis

Data were entered into a Microsoft Excel 2007 database (Microsoft Corporation) and analysed with Stata statistical software (version 13; Statacorp). Results are presented as medians and interquartile ranges (IQRs) for non-normally distributed parameters. The estimated prevalence rates in the NT for each year were expressed as cases per 100 000 Indigenous population per year with 95% confidence intervals. Indigenous population by age and percentage Indigenous population in the NT were obtained from Australian Bureau of Statistics data.15 Bivariate analyses were performed using the χ2 or Fisher exact test if expected frequencies were less than 5. For non-parametric data, the Mann–Whitney U test was used, with P values of < 0.05 considered significant.

Results

There were 417 episodes of T. trichiura infection diagnosed in 400 patients from a total 63 668 faecal samples tested between 1 January 2002 and 31 December 2012. About 85% of these were from hospital inpatients admitted to Royal Darwin Hospital, usually for reasons other than T. trichiura infection. Thirteen patients were screened as part of a prisoner health check, 11 patients were living in the community and the remainder were inpatients of an NT Government health care facility (Royal Darwin Hospital, Alice Springs Hospital, Katherine District Hospital, Tennant Creek Hospital or Gove District Hospital) at the time of T. trichiura detection. The preponderance of inpatient samples comes about because community clinics are likely to send samples to private rather than government laboratories, and transport of samples from remote communities can be problematic.

Patients were considered to have had a repeat episode of infection if T. trichiura was detected at least 6 months after the first diagnosed episode (median duration between infections, 23.7 months; range, 7.8–100.9 months). Thirteen patients (3%) had two infections and two patients (0.5%) had three infections. Forty-three episodes of repeat T. trichiura infections that were detected in 33 patients within 6 months of the initially detected infection were deemed to be the same episode of infection and were excluded.

The demographic and laboratory parameters of patients with T. trichiura infection are shown in Box 1. Most infections were in children aged under 17 years (239; 59.8%), with 175 (43.8%) in children younger than 5 years. The median age of those infected was 8 years (IQR, 3–36 years). The vast majority of infections were in Indigenous patients (381 [95.3%] compared with 10 [2.5%] in non-Indigenous patients). Ethnicity was unknown for nine patients. Boys were more likely to be infected than girls (P < 0.001) and women were more likely to be infected than men (P < 0.001).

Haemoglobin levels and eosinophil counts were available for 356 and 345 of the 400 patients, respectively; 143 (40.2%) patients had anaemia and 178 (51.6%) had eosinophilia. After excluding episodes of T. trichiura infection where patients had co-infection with another STH, 115 patients (39.2%) had anaemia and 139 (34.8%) had eosinophilia. There were 112 children (46.9%) and 48 adults (29.8%) who had co-infection with at least one other faecal parasite (P = 0.001).

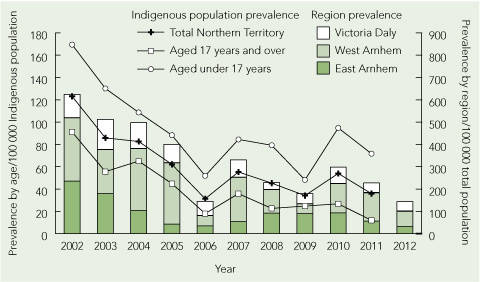
The period prevalence of T. trichiura infection (Box 2; and Appendix 1 (PDF)) decreased from 123.1 (95% CI, 94.8–151.3) cases per 100 000 Indigenous population in 2002 to 35.8 (95% CI, 21.8–49.9) cases per 100 000 Indigenous population in 2011. This downward trend was documented for both children and adults (Box 2). Most cases occurred in patients who had lived in one of three remote Top End NT locations, Victoria Daly, East Arnhem Land and West Arnhem Land (Appendix 2 (PDF)). The number of faecal microscopy samples tested each year was relatively constant, with a median of 5764 samples (range, 5276–6527 samples) per year. We were unable to obtain accurate data on numbers of doses of albendazole dispensed for the community children’s deworming program over our study period.

Discussion

Our study shows that T. trichiura in the NT predominantly affects Indigenous patients from remote Top End communities. Children had the highest prevalence of infection across all the years in our study period. Among children, boys had a statistically significant higher proportion of infections. Conversely, women had a statistically significant higher proportion of infections. It is likely that adult women have higher rates of infection because they care for and live in closer proximity to infected children who contaminate the nearby environment. The difference we observed between the prevalence in boys and girls may reflect greater soil exposure among boys.

We found a strong association between T. trichiura infection, anaemia and eosinophilia, and this association persisted when coinfection with other STHs was excluded. The precise contribution that T. trichiura makes towards anaemia is difficult to ascertain, as infection occurs in populations with a high level of intestinal parasite co-infection, socioeconomic disadvantage and nutritional deficiencies.6

Our data show a consistent reduction in microbiologically diagnosed T. trichiura infections in the NT over the 11 years from 2002 to 2012. Despite this reduction, a significant percentage of infections (59.8%) continued to be diagnosed within the community children’s deworming program target population of children less than 17 years of age. This finding is most likely explained by the reduced efficacy of single-dose albendazole in T. trichiura infection compared with other STHs12,16 and to the rapid reinfection rates seen with T. trichiura.4 Similar disparities in reduction of infection with hookworm and T. trichiura in response to mass deworming campaigns have been observed elsewhere.17 Despite these poor cure rates, egg reduction rates of over 80%12 do occur with single-dose albendazole and this may be sufficient to protect our population against the morbidity seen in high-intensity infections. Interventions to improve sanitation are very effective in reducing the prevalence of T. trichiura infections,18 and level of maternal education, access to latrines, household wealth indexes and remoteness are important risk factors for infection.19

Our retrospective study has several limitations. Systematic sampling from the community was not undertaken, so the true prevalence rates are undoubtedly much higher than the laboratory-diagnosed rates found in our study population. Notably, all but 24 patients were inpatients of a NT Government health facility, reflecting a selection bias towards patients with acute illness and comorbid conditions. Furthermore, without a control group, the association of T. trichiura infection with anaemia cannot be further analysed. T. trichiura egg counts were not performed, so anaemia and eosinophilia correlates with the intensity of infection could not be determined.

We have shown a reducing T. trichiura infection rate in the NT over the 11 year period of our study. A large number of infections continue to be diagnosed in the community children’s deworming program target population. With the move towards eradication of hookworm in the NT, our data raise the question of whether the deworming program should be adapted to improve efficacy against T. trichiura (400 mg albendazole daily for 3 days). More importantly our study supports increasing the focus on health education, healthy living practices and essential housing infrastructure. These factors are deficient in remote Indigenous Australian communities20 and greatly impact on the prevalence of all STH infections.3,18,19

1 Demographic and laboratory parameters of 400 patients* with Trichuris trichiura infection,
Northern Territory, January 2002 to December 2012

Age group


Parameter

All

< 17 years

≥ 17 years

P


Number

400 (100%)

239 (59.8%)

161 (40.3%)

< 0.001

Sex

< 0.001

Male

205 (51.3%)

141 (59.0%)

64 (39.8%)

Female

195 (48.8%)

98 (41.0%)

97 (60.2%)

Indigenous status

< 0.001

Indigenous

381 (95.3%)

236 (98.7%)

145 (90.1%)

Non-Indigenous

10 (2.5%)

3 (1.3%)

7 (4.3%)

Unknown

9 (2.3%)

0 (0)

9 (5.6%)

Median haemoglobin level
(g/L [IQR]))

114 (104–125)

114 (105–123)

113 (95–130)

Anaemia

143 (40.2%)

78 (32.6%)

65 (40.4%)

0.14

Median eosinophil count
(× 109/L [IQR])

0.5 (0.1–1.0)

0.5 (0.1–1.2)

0.5 (0.1–0.9)

Eosinophilia§

178 (51.6%)

104 (43.5%)

74 (46.0%)

0.87

Polyparasitism

160 (40.0%)

112 (46.9%)

48 (29.8%)

0.001

Episodes with no STH coinfection

Number

333 (83.3%)

205 (85.8%)

128 (79.5%)

0.10

Median haemoglobin level
(g/L [IQR])

114 (104–125)

114 (105–124)

114 (98–132)

Anaemia**

115 (39.2%)

66 (36.9%)

49 (43.0%)

0.30

Median eosinophil count
(× 109/L [IQR])

0.4 (0.1–0.9)

0.4 (0.1–1.0)

0.5 (0.1–0.8)

Eosinophilia

139 (48.9%)

82 (47.7%)

57 (50.9%)

0.60


IQR = interquartile range. STH = soil-transmitted helminth.
* Data from the 17 episodes of repeat infection were excluded from the analysis. Aboriginal or Torres Strait Islander; Indigenous status was not available for nine patients aged ≥ 17 years. Anaemia defined as a haemoglobin level ≤ 110 g/L; data available for 356 patients (211 aged < 17 years, 145 aged ≥ 17 years). § Eosinophilia defined as an eosinophil count ≥ 0.5 × 109/L; data available for 345 patients (203 aged < 17 years, 142 aged ≥ 17 years). Defined as detection of at least one other intestinal parasite (Ancylostoma duodenale, Strongyloides stercoralis, Cryptosporidium spp, Giardia lamblia, Hymenolepis nana, Isospora spp, Blastocystis hominis in high numbers). ** Data available for 293 patients (179 aged < 17 years, 114 aged ≥ 17 years). Data available for 284 patients (172 aged < 17 years; 112 aged ≥ 17 years).

2 Prevalence of Trichuris trichiura infections in the Northern Territory in 2002–2012 by age and region

Staphylococcus aureus bloodstream infection in Australian hospitals: findings from a Victorian surveillance system

Health care-associated (HA) infections are an important measure of quality of care in health care facilities. Staphylococcus aureus bloodstream (SAB) infections contribute to morbidity, mortality, and health care expenditure, and are frequently regarded as preventable.1

Standardised surveillance strategies for SAB infections have been effectively implemented internationally.2,3 In 2008, the Australian Health Ministers’ Conference endorsed that all Australian hospitals should establish HA infection surveillance, including reporting of SAB infections through relevant jurisdictions to a national data repository.

The Victorian Healthcare Associated Infection Surveillance System (VICNISS) SAB infection surveillance module was developed to enable collection of relevant laboratory and clinical data by health care workers trained in infectious diseases or infection prevention for community and HA-SAB infection events in the state of Victoria, including methicillin-sensitive and methicillin-resistant isolates.

The Victorian Department of Health mandated participation by Victorian public hospitals at the commencement of the program. VICNISS provided education to participating hospitals and developed a guide to facilitate standardised case review. Private health care facilities participated on a voluntary basis.

In Victoria, reporting of SAB infection events commenced in October 2009. In January 2010, the VICNISS implemented a standardised module that uses definitions developed by the Australian Commission on Safety and Quality in Health Care (ACSQHC) for monitoring in Victorian acute care public hospitals. This report outlines module components and a review of surveillance data captured during the first 3 years.

Methods

Uniform data were captured for all SAB infection events, including patient demographics, infection details and organism susceptibility.

Each infection was classified as either HA or community-associated using ACSQHC definitions. SAB infection was defined as HA if:

  • the patient’s first S. aureus-positive blood culture was collected > 48 hours after admission to hospital or < 48 hours after discharge, or
  • the patient’s first S. aureus-positive blood culture was collected ≤ 48 hours after admission to hospital and key clinical criteria were also met:
    • SAB infection was a complication of the presence of an indwelling medical device;
    • SAB infection occurred within 30 days of a surgical procedure where the SAB infection was related to the surgical site;
    • SAB infection was diagnosed within 48 hours of a related invasive instrumentation or incision; or
    • SAB infection was associated with neutropenia contributed to by cytotoxic therapy.

SAB infection was defined as community-associated if the patient’s first S. aureus-positive blood culture was collected ≤ 48 hours after admission to hospital and none of the key clinical criteria listed above were met.

The first SAB isolate per patient was counted as one episode. Subsequent positive blood cultures were only recorded as additional episodes if ≥ 14 days had passed without a positive blood culture Data for total occupied bed-days (OBDs) were obtained from the Victorian Admitted Episodes Dataset and HA-SAB infection rates were reported as number of epiodes per 10 000 OBDs.

Data collection and validation

Participating hospitals submitted data using a web-based tool. Webform design precluded lodgement of incomplete or inconsistent data. VICNISS staff were available if participating hospitals required assistance with applying standard definitions.

Statistical analysis

For this study, data collected during the first 36 months of the program (1 January 2010 – 31 December 2012) were analysed to determine relative proportions of HA and community-associated events and the proportion of SAB infection events attributed to methicillin-resistant S. aureus (MRSA). To test the hypothesis that a change in aggregate HA-SAB infection and MRSA bloodstream infection rates was not observed over time, both linear and non-linear quadratic trends in quarterly rates were evaluated using generalised estimating equations for Poisson regression with OBDs as the exposure. As no pre-observation data were available, we were unable to calculate a meaningful rate at time zero and thus suppressed the model intercept terms. The quasi-likelihood information criterion4 and modelled values for deviance and dispersion were used as metrics to assess comparative goodness of fit for linear and quadratic models. Cubic fits were calculated as a sensitivity analysis regarding the validity of presuming an underlying non-linear quadratic relationship. Statistical tests were performed using Stata, version 12 (StataCorp). Quarterly data for the study period were compared with the national threshold target of no more than 2.0/10 000 OBDs for HA-SAB infection rates in Australian hospitals in 2011.

Results

SAB infection data were submitted by 119 public health care facilities spanning 90/90 health care services (100%), and four private health care facilities. During the period studied, a total of 3205 SAB infection events were captured (2072 male patients, 1132 female patients, sex unknown for one event). The median age of patients with SAB infection was 64 years (range, 0–104 years).

Of all reported infection events, 1335 (41.7%) were HA, 1803 (56.3%) were community-associated, and 67 (2.1%) were unknown or unable to be classified. Of the HA-SAB infection events, 350 (26.2%) occurred ≤ 48 hours after hospital admission and 985 (73.8%) occurred > 48 hours after admission. MRSA was responsible for 295 HA-SAB infection events (22.1%) and 175 community-associated infection events (9.7%).

Quarterly data for HA-SA and HA-MRSA bloodstream infection events are summarised in Box 1. The median aggregate quarterly infection rates for HA-SA and HA-MRSA, respectively, were 0.95/10 000 OBDs (range, 0.7–1.4/10 000 OBDs) and 0.2/10 000 OBDs (range, 0.1–0.4/10 000 OBDs). Linear and quadratic regression models were fitted. The quadratic models both showed a significant decreasing trend over time (P < 0.001) with better goodness of fit. The quadratic models showed a decrease of 6.2 HA-SAB infection events per cumulative quarterly OBDs with a 0.5 unit change in slope (the quadratic coefficient), and a decrease of 7.8 HA-MRSA bloodstream infection events per cumulative quarterly OBDs with a 0.6 unit change in slope. The overall cumulative aggregate infection rates were 1.0/10 000 OBDs (95% CI, 0.9–1.0/10 000 OBDs) for HA-SA and 0.2/10 000 OBDs (95% CI, 0.19–0.24/10 000 OBDs) for HA-MRSA.

Quarterly HA-SAB infection rates in excess of 2/10 000 OBDs were reported in 54 instances, corresponding to a median of four (range, 2–8) instances each quarter. During the first quarter, eight health care services exceeded the benchmark, while four services breached the threshold target during the final reporting quarter.

Of the 350 HA-SAB infections that were identified ≤ 48 hours after hospital admission, most (68.9%) were reported as a complication of the presence of an indwelling medical device; 19.4% occurred within 30 days of a surgical procedure and were related to the surgical site. Smaller numbers of infections were reported in association with invasive instrumentation or in the setting of neutropenia contributed to by cytotoxic therapy. Associated key clinical criteria are summarised in Box 2.

Discussion

Our findings reflect successful implementation of continuous statewide SAB infection surveillance using nationally agreed criteria. Further, a significant reduction in Victorian SAB infection rates was shown during the first 3 years. This may be indicative of concurrent infection prevention strategies (eg, improved practices for intravenous catheter insertion and care,5 reduced surgical site infections,6 an operative hand-hygiene program7), together with the fact that falling rates of infection are frequently observed after the commencement of formal surveillance programs.8

Notably, 26% of HA-SAB infection events occurred within 48 hours of hospital admission. These early events were frequently (69%) associated with an indwelling medical device (eg, intravenous catheter, haemodialysis vascular access) present at the time of hospital admission (Box 2). Patients at risk of these events include those with intravenous devices managed by hospital-in-the-home programs, those on haemodialysis, haematology and oncology outpatients with central venous access devices and outpatients receiving parenteral nutrition. Given the burden of illness, surveillance strategies for HA infections must continue to capture early (≤ 48 hours after hospital admission), as well as late, events.

MRSA infection has previously been reported to comprise 11%–40% of HA-SAB infection events in Australia,1,9 but studies have been limited by the potential for selective sampling. Our statewide data indicated that 22% of HA-SAB infection events were due to MRSA, which is comparable to recent data from European and Canadian reports.10

For SAB infection surveillance, the denominator for a health care service comprises OBDs for acute medical care, acute surgical care, intensive care, hospital-in-the-home, rehabilitation and psychiatric care, in addition to OBDs for rehabilitation or psychiatry centres associated with the nominated acute care hospital. SAB infection events are infrequently seen within psychiatry and rehabilitation facilities. To focus on acute care centres would be an optimal use of infection prevention resources, and a denominator excluding low-risk patients would provide more meaningful data for interhospital comparison.

After the commencement of SAB infection surveillance in Victoria, public reporting was facilitated nationally by the Australian Institute of Health and Welfare via the MyHospitals website.11 Based on the National Healthcare Agreement,12 a threshold target rate for SAB infection (no more than 2.0/10 000 patient days) in acute care public hospitals was applied in 2012.13 Retrospective application of this target to our data spanning a 36-month period showed that eight health care services were above this target at the onset of the surveillance period, with four identified during the last quarter studied. If hospital-level data are to be compared with a national benchmark, it is vital that jurisdictions implement uniform methods for surveillance14 and validation.15 Our experience shows that, to ensure uniformity of surveillance methods and for education and discussion of complex events, health care facilities require direct and frequent liaison with a coordinating centre. Consideration of lower threshold targets may be necessary if sustainable improvement, such as that seen in Victoria, is achieved.15

1 Quarterly health care-associated Staphylococcus aureus bloodstream (SAB) infection rates* per 10 000 occupied bed-days (OBDs), Victorian health care facilities, Jan 2010 – Dec 2012


MRSA = methicillin-reistant S. aureus. *Error bars indicate 95% Cls. 119 public health care facilities spanning 90/90 health care services (100%), and four private health care facilities.

2 Key clinical criteria associated with health care-associated Staphylococcus aureus bloodstream (SAB) infection occurring ≤ 48 hours after hospital admission (n = 350), Victorian health care facilities,* Jan 2010 – Dec 2012


*119 public health care facilities spanning 90/90 health care services (100%), and four private health care facilities.

Airport arrivals screening during pandemic (H1N1) 2009 influenza in New South Wales, Australia

During the DELAY and CONTAIN phases of pandemic (H1N1) 2009 influenza, New South Wales Health conducted, at the request of the Australian Government, screening of passengers at Sydney Airport. The aim was to delay entry and minimise spread of the pandemic in Australia.1,2 In this study, we examined the effectiveness of this intervention, in order to inform its future use at the state and national level.

On 27 April 2009, two clinics were established at Sydney Airport, staffed by nurses from the local area health service, with public health support from the NSW Ministry of Health. On-board announcements were made before landing, and all incoming international passengers were asked to declare any symptoms or possible contact with a person with influenza A(H1N1)pdm09 by completing a health declaration card. Additionally, thermal imaging scanners with a set point of 38°C ± 2°C were used to detect febrile passengers.3,4

Public health staff triaged and assessed passengers who self-reported symptoms or were detected by thermal scanners according to the case definition current at the time (Box 1). Passengers who met the case definition answered a questionnaire, underwent a brief clinical assessment and had nose and throat swabs taken, which were sent to a pathology laboratory for testing. All demographic, exposure and health assessment data collected at the airport clinics were entered in real time into NetEpi, a national web-based public health data collection system.3,4 NetEpi was also used to collect data for all patients and contacts presenting anywhere with an influenza-like illness, and to assign case status when known.3

As airport clinics were being operationalised, media warnings were issued to the general public asking people with symptoms to call their local doctor and, if required, to go to an emergency department for assessment.3

Methods

Data from airport clinics and on all cases of influenza A(H1N1)pdm09 collected between 28 April 2009 and 18 June 2009 and stored in NetEpi had previously been imported into Microsoft Excel. The number screened was estimated on a pro rata basis as the total number of international passengers arriving at Sydney Airport between 28 April 2009 and 18 June 2009, using monthly data from the Bureau of Infrastructure, Transport and Regional Economics.5

The case detection rate of airport screening was calculated as the number of confirmed cases of influenza A(H1N1)pdm09 detected at the airport per 10 000 passengers screened. Sensitivity was calculated as the number of confirmed cases detected at the airport as a proportion of the total number of overseas-acquired cases in the period. Positive predictive value was calculated as the proportion of symptomatic or febrile passengers who tested positive for A(H1N1)pdm09, and specificity as a proportion of the total number of passengers minus the number of those with known overseas-acquired influenza A(H1N1)pdm09 who were identified as not being symptomatic or febrile. Negative predictive value could not reliably be calculated; as it is possible some passengers not identified as symptomatic or febrile at screening later developed influenza, but did not seek clinical care or testing and so never became confirmed cases. The number of cases detected at the airport was calculated as a proportion of all cases identified between 28 April and 18 June 2009, and compared with the proportion of cases over the same period who were detected at emergency departments and in general practice.

Analysis was performed using Excel (Microsoft) and Stata version 10 (StataCorp).

Ethics approval was not sought as the study used data collected under the Public Health Act 1991 (NSW).

Results

Results of the analysis are presented in Box 2. There were an estimated 625 147 passenger arrivals at Sydney Airport during the period, of whom 5845 or 0.93% were identified as being symptomatic or febrile. Of these 5845, three subsequently were confirmed as having influenza A(H1N1)pdm09, resulting in a detection rate of 0.05 per 10 000 (95% CI, 0.02–1.14 per 10 000). There were 45 people with overseas-acquired influenza A(H1N1)pdm09 in NSW who would have probably passed through the airport during this time, giving airport screening a sensitivity of 6.67% (95% CI, 1.40%–18.27%). Positive predictive value was 0.05% (95% CI, 0.02%–0.15%), and specificity was 99.10% (95% CI, 99.00%–100.00%).

Of the 1296 passengers identified as requiring further assessment, the large majority (1144 passengers or 88.27%) were detected through health declaration cards. Only 11 of these 1296 passengers (0.85%) were detected by the thermal scanners. For the remaining passengers (35 passengers or 2.70%), the identification method was either unknown or through other mechanisms, such as referral to the airport clinic by the Australian Quarantine and Inspection Service officers.

Across NSW, there was a total of 557 patients with confirmed cases who had samples collected and sent for laboratory testing between 28 April and 18 June 2009. Samples were obtained from patients seen at the airport clinic, emergency departments, general practices and other settings. Of these, 290 (52.1%) were detected at emergency departments and 135 (24.2%) at general practices, compared with three (0.5%) at the airport.

Discussion

Our analysis shows that airport screening in NSW during pandemic (H1N1) 2009 influenza had low sensitivity, detecting far fewer cases during the DELAY and CONTAIN phases compared with emergency departments or general practitioners. The case detection rate of 0.05 per 10 000 passengers screened reflects figures in reviews of airport screening in other Australian jurisdictions and other countries.610 The small number of passengers detected by thermal scanners is also consistent with published estimates of the sensitivity of non-contact infrared thermal image scanners, and the high proportion of influenza infections that are likely to be asymptomatic.11,12

Limitations of the study include possible underestimation of the number of overseas-acquired cases, as milder cases of illness may not have been notified. Also, case definitions used during the DELAY and CONTAIN phases largely sought to detect imported cases and may have underestimated the number of cases acquired in the community. Both factors are likely to further reduce rather than increase the sensitivity of airport screening.

Border screening, including the identification of ill passengers and the use of thermal scanners, was identified in pre-2009 planning as one of a number of control measures that might delay entry of a pandemic into Australia.2 This planning and initial assessment of the likely severity of the pandemic after the emergence of influenza A(H1N1)pdm09 in Mexico led to commencement of airport screening in May 2009. Research also showed that the public were supportive of screening and perceived measures such as thermal scanners to be useful in detecting ill passengers.2

The cost of staffing airport clinics in NSW has been estimated at about $50 000 per case detected (NSW Ministry of Health, unpublished data, 2012). Measures such as in-flight announcements and providing health information at airports may be still be useful mechanisms for raising awareness among incoming passengers during future pandemics. However, given the costs associated with staffing airport clinics, careful consideration should be given to deploying resources to airports for largely ineffective screening measures, compared with other activities such as contact tracing in the community.

1 Definitions for suspected cases of influenza A(H1N1)pdm09, DELAY and CONTAIN phases3

Phase

Case definition

DELAY (24 April 2009 to 21 May 2009)

A person with acute febrile respiratory illness, with onset within 7 days of close contact with a person who is a confirmed or an influenza A-positive suspect case of pandemic (H1N1) 2009 influenza virus infection; or onset since 15 April 2009 and within 7 days of travel to Mexico, the United States or Canada.

CONTAIN (22 May 2009 to 16 June 2009)

As above but expanded to include contacts of a confirmed case with more minor symptoms. Japan and Panama were added to the list of affected regions on 23 May, and Chile, Argentina and greater metropolitan Melbourne were added on 15 June.

2 Screening for influenza A(H1N1pdm09) at Sydney Airport, 28 April 2009 to 18 June 2009

Harms unknown: health uncertainties cast doubt on the role of unconventional gas in Australia’s energy future

Australia has significant reserves of unconventional gas, with combined estimated reserves of coal seam, shale and tight gas amounting to over three and a half times those of conventional gas.1 The industry is undergoing rapid growth as a result of advances in gas extraction techniques — most notably the widespread adoption of hydraulic fracturing, which involves injecting large quantities of water, chemicals and proppants (materials like sand intended to keep fractures open) into gas reservoirs to open fractures and allow the gas to flow more readily. While coal seam gas (CSG) has been the focus of much public debate in Australia, it is the nascent shale gas industry that is likely to be responsible for the biggest expansion of hydraulic fracturing in the coming decades.

The promise of reliable and affordable energy, the potential windfall from exports, and claims that it is less damaging to the climate than coal have become major selling points of unconventional gas for its proponents. However, the industry has been beset by controversy over its potential negative health, social and environmental impacts.

Fears over the potential health implications of hydraulic fracturing led over 100 medical practitioners to request the Obama administration to halt the construction of new liquefied natural gas (LNG) terminals on the basis that “[t]here is a growing body of evidence that unconventional natural gas extraction from shale . . . may be associated with adverse health risks through exposure to polluted air, water, and soil”.2 There are also environmental, social and psychological factors that have more indirect effects on health, and important social justice implications arising from the distribution of health burdens.

While there is a dearth of conclusive evidence about the health and environmental effects of fracturing, there is an emerging body of evidence on the areas of greatest potential risk and uncertainty in regards to water, air and social pathways. When taken into consideration along with concerns about the level of fugitive emissions and the potential effect on the development of renewable energy, these health concerns make unconventional gas a doubtful saviour for Australia’s energy needs.

Wastewater is a greater hazard than fracturing fluids

The risk of fracturing chemicals directly contaminating water used for drinking or irrigation has been one of the main sources of public concern. While the risk of well casing failure, spills and other accidents cannot be dismissed,3,4 these can be mitigated (though not removed entirely) by proper regulation and the move towards “safer” fracturing fluids. However, although any exposure would likely be to heavily diluted chemicals, the toxicological effects of some chemicals in their dilute form are not well understood.5,6 In particular, chemicals affecting the endocrine system — such as ethoxylated 4-nonylphenol, which has been used in Australian operations6 — can affect humans at extremely low quantities.7

The fate of stranded fracturing fluids (those remaining underground) has also not been well established, and there is a significant failure rate for abandoned wells in the United States, leading to materials leaking into the surrounding areas.8 Additionally, while the minor seismic activity caused by fracturing is unlikely to result in earthquakes of a magnitude that can be felt, it introduces a further risk of damage to well casings.

However it is wastewater, which contains naturally occurring contaminants that are difficult and costly to remove (as well as fracturing and drilling fluids), that poses a greater human and environmental health risk.4,8 There are many documented and anecdotal cases of spills, failures of holding dams, and the accidental and planned release of contaminated wastewater in Australia and the US.911 Natural contaminants present in wastewater can include heavy metals and radioactive materials, which have serious and well known health effects.8 Uranium and heavy metals have been shown to be mobilised by fracturing and drilling chemicals.12

Unconventional gas developments create air pollution

One of the clearest health benefits of gas over coal is the fact that it is responsible for significantly less damaging particulate matter (PM) than coal.13 However, unconventional gas extraction is responsible for air pollution from diesel fumes from infrastructure development and stationary equipment, gas processing, venting and flaring. Fugitive methane emissions can catalyse development of ground level ozone and combine with PM to form smog, both of which contribute to respiratory disease, among other health effects, and damage to crops — gas-field haze is a well known effect in the US, with such pollution capable of travelling substantial distances.14 Shale gas extraction can also involve the flaring or venting of “associated” gases, which can become hazardous air pollutants.15

The cumulative risks from these sources are difficult to estimate, however one study calculated the cumulative cancer risks for residents of Battlement Mesa, Colorado, to be “6 in a million for residents > 1/2 mile from wells and 10 in a million for residents ≤ 1/2 mile from wells”, also noting other symptoms reported by residents “consistent with known health effects of many of the hydrocarbons evaluated”.16

It is likely that the distance of most Australian operations from densely populated areas at present makes the health impacts of air pollution less pronounced than in the US, although this may change as the industry fights against current setback restrictions. Although not conclusive, findings from an investigation of “downwinder’s syndrome” in Queensland suggested no direct link to air pollution,17 and pollution can also be reduced by improvements to equipment. However it is becoming apparent that any level of such air pollutants can have health implications at a population level.13 Further, given the opportunity to move to far less polluting alternatives such as renewable energy, the reduction of PM compared with coal is not enough to recommend further gas developments.

Moreover, air pollution remains a potentially serious health issue for workers. Although the nature of risks to workers is unclear, potential exposures include toxic materials and chemicals, airborne silica from sand used as a proppant, and radon. A significant number of air samples collected in the US exceeded the recommended exposure limits for airborne silica, with one report claiming the potential of developing silicosis to be a significant known health hazard to workers involved in hydraulic fracturing.18

Social impacts exacerbate other health effects

Gas developments can have numerous and considerable social and psychological effects, which may exacerbate more direct health risks. Although there are potential benefits to communities, and effects are likely to be mixed,14 a study of the impacts of mining and CSG operations on the mental health of landholders in Queensland concluded that these operations placed rural communities “under sustained stress”, with study participants perceiving that these operations “significantly impacted or exacerbated issues such as the health, social fabric and economy of the community”, and the authors noting that local health services faced “unsustainable pressure”.19

Unconventional gas developments in Australia also make use of fly-in, fly-out and drive-in, drive-out work forces. While these arrangements have some benefits, they have come under scrutiny for their negative influence on community cohesion, increasing the cost of living, and their association with high levels of alcohol and drug use, mental health issues and violence (although these latter are also more generally associated with the demographic of young men who make up most of these workers).20

Social justice implications require more attention

Inequity can be an indirect cause of ill health, and the development of unconventional gas resources threatens to distribute health burdens in an unfair way. Most of the potential health hazards are likely to be felt by groups such as the elderly, children and the poor because of their vulnerability to the hazards involved, those living in rural, agricultural and Indigenous communities because of the location of operations, and future generations — the same groups liable to bear significant costs of climate change — while the financial benefits will accrue to the predominantly foreign owners of the resources.

Australia must also take responsibility for the moral implications of our role as one of the world’s largest exporters of gas, with exports expected to reach nearly 70% of gas production by 2035. The emissions from the combustion of exported gas are not included in our national inventory; however it is plausible that countries have a prima facie responsibility for at least part of the harms caused by their exported emissions. According to the International Energy Agency, “Only one third of the carbon contained in proven reserves of fossil fuels can be released into the atmosphere by 2050 if the world is to achieve its under 2°C goal”.21

It is clear that, insofar as we need to extract and use fossil fuel resources, this needs to occur in a controlled and fair way, but there are currently no such constraints on our development of new sources of gas.

The question of fugitive emissions

A further health issue raised by any proposed energy source is its contribution to climate change, which has the potential to reverse gains in global health, for example by exacerbating illnesses and causing deaths through under-nutrition, extreme weather conditions and disease.22 The combustion of gas produces about 40% of the greenhouse gas (GHG) emissions of coal, which has been offered as a reason to support the industry’s expansion, either as a “stepping stone” towards renewables or as an end point in itself. However, this proposed benefit is called into serious question by the level of fugitive emissions (emissions that are not captured for use) produced by its extraction and transport. There is considerable disagreement about the extent of these emissions, with estimates ranging from 0.1% up to 9% of gas produced (with current US Environmental Protection Agency estimations at about 2.4%).2326 Notably, there are as yet no reliable figures for Australian operations,27 and regardless of how it compares to coal, unconventional gas is responsible for large quantities of GHG emissions in absolute terms.

Unconventional gas is predominantly methane, which is estimated to have a global warming potential 25 times greater than carbon dioxide over a 100-year period, and 72 times greater over a 20-year period.28 The nature of climate change and the possibility of “tipping points” in the short-term make it important to consider this perspective, with several reports estimating fugitive emissions from unconventional gas to be of a level (between 2%–3.2% of production) that would likely undermine its climate benefits compared with coal in this time frame.29,30 The effects of climate change, such as increased floods and drought, can be expected to exacerbate many risks, and are also likely to disproportionately affect vulnerable groups. This highlights the importance of considering the short-term global warming potential of methane and the social justice implications of energy choices.

Increased gas production may also displace emerging renewables markets in export countries and impair the growth of the renewables sector in Australia. In addition, the technology used for generating energy from exported LNG cannot be assumed to be of comparable efficiency to that deployed in Australia.31

Implications of the health impacts of unconventional gas

The current evidence does not provide a clear picture of the health implications accompanying the proposed expansion of Australia’s unconventional gas industry. In some cases, this is because of gaps in our knowledge that could be rectified, while other risks are inherently uncertain because they involve complex systems and interacting health pathways.

It is important to note that the absence of concrete evidence of harm does not equate to evidence of its absence. The uncertainty over the health implications of unconventional gas is greater than that surrounding any other energy choice, and suggests that adopting an attitude of precaution — such as that employed with the introduction of a new drug — is justified on the basis of health risks alone.

However, as with decision making in a clinical setting, appeals to precaution need to take place in a broader assessment of risks and benefits. In the case of unconventional gas, this includes its implications for climate change, which — as argued above — also indicate its unsuitability. Further, while it is commonplace to compare gas with coal, coal is known to inflict serious damage on human and environmental health,32 making it a poor benchmark and obscuring unfavourable comparisons with renewable energy choices.

It is clear that Australia must quickly move beyond its reliance on coal for health and environmental reasons. However, when taking into consideration the uncertainties over health risks, the unfavourable comparisons with other energy options, the climate risks associated with fugitive emissions, the moral obligations Australia faces as a gas exporter, the potential displacement of renewables and doubts raised over the claim that gas will prove to be a cheap energy option,33 the scale is firmly tipped against the further development of unconventional gas.

Get back to work

A quote from literature is a time-honoured trope used in editorials to exemplify a chosen theme. Literature, however, is often negative about the idea of returning to work, which many doctors are now doing. Indeed, work itself is usually considered a black hole of mundanity. In the real world, any new year’s resolutions to do things better this time may already be starting to dissipate under the influence of such negativity. However, work, though at times uninspiring, does somehow get things done.

Unfortunately, despite our best efforts, any resolution
to stop the introduction into Australia of microorganisms resistant to multiple antimicrobial agents has probably been in vain. The case of a man repatriated from Greece with complications from perforated diverticulitis has brought home to clinicians that Australia has not averted the threat of multidrug-resistant (MDR) organisms. In their case report (doi: 10.5694/mja13.10592), Chua and colleagues describe the stormy and protracted course of “last line of defence” antimicrobials, complex operations and costly isolation and cross-infection prevention protocols. They identified 10 patients admitted to Austin Health between December 2011 and February 2013 with MDR organisms and a history of recent overseas travel. The larger implications of such cases for Australian health care are becoming clearer.

In hospitals across Australia, many wards and emergency departments will have welcomed new additions to their medical teams as this year’s interns started their first clinical term. All doctors well remember their first foray into paid clinical work, for reasons good and bad, and everyone can think of how their own apprenticeship could have been better supported and more focused on learning and practice. We all recognise that interns need ongoing structured education, protected from their clinical duties. In 2008, the Garling inquiry recommended interns spend 20% of their rostered time in a formal clinical training program (http://www.lawlink. nsw.gov.au/Lawlink/Corporate/ll_corporate.nsf/vwFiles/E_Overview.pdf/$file/E_Overview.pdf). Oates and colleagues (doi: 10.5694/mja13.10213) have estimated how much their education costs the New South Wales health system and found the total was close to $15 000 per intern. They also found that, in NSW, only 6% of an intern’s time is allocated to these educational activities, well short of the 20% recommended nearly 6 years ago. Interns are better supported educationally than previously, but there is still a considerable way to go in improving our investment in this area of health care.

Getting the right mix of people in medical school admissions is an area of ongoing interest. The University
of Queensland dropped the requirement for applicant interviews from 2009. Wilkinson and colleagues (doi: 10.5694/mja13.10103) show that the proportion of male students admitted grew substantially thereafter, up to almost three-quarters of domestic graduate-entry students in 2012. Male candidates’ better performance in the section of the Graduate Medical School Admissions Test (GAMSAT) on biological and physical sciences reasoning is thought to play a role. There are several ways to interpret these findings, but medical school interviews appear to have
a function in ensuring gender equity. This is also a discussion that has to go beyond the medical school.

Outside of hospitals and medical schools, the fight
for better community health continues. Elliott and colleagues (doi: 10.5694/mja13.11240) assess the “progress” made by the federal government’s Food and Health Dialogue over the past 4 years to improve the nutritional profile of foods and enhance consumer education about healthy diet choices. Depressingly, none of the agreed goals have been achieved. The authors argue for the Dialogue to have stronger transparency and accountability in its initiatives and targets, and to manage commercial vested interests whose involvement is essential, but whose goals are different to public health objectives. Improving the food environment needs sustained commitment but, in Australia, interest and focus is in danger of fizzling out. Let us hope that everyone involved can keep a lid on the influences that may stymie progress and get back to the work needed to renew this resolution to make Australians healthier.

Alcohol and cancer: the urgent need for a new message

New knowledge on old bottles: alcohol labelling and an unpalatable message

Alcohol is one of the most widely used drugs in Australia.1 In 1988, the World Health Organization International Agency for Research on Cancer declared it a Group 1 carcinogen — a fact of which few Australians are aware.2 In Australia annually, over 2000 cancer diagnoses and around 1400 cancer deaths are attributable to long-term alcohol use.2 Recent evidence indicates that any alcohol consumption increases the risk of developing cancer, including for the common cancers such as those of the bowel and breast, while smoking and alcohol together have synergistic effects that exceed the risk from either individually.2

This evidence has changed the known risk of developing cancer for a significant number of Australians, particularly those drinking alcohol at light-to-moderate levels, as risk increases cumulatively with consumption over time.2 Most of the Australian population of light-to-moderate drinkers who adhere to the National Health and Medical Research Council (NHMRC) guidelines of no more than two standard drinks daily3 may thus unwittingly be putting themselves at increased risk of developing cancer from their low-level chronic exposure to alcohol. Unlike genetic predisposition or increasing age, alcohol consumption
is a modifiable risk factor for cancer, and, therefore, a legitimate target for public health intervention. Conveying this new message to the Australian community is a major public health challenge, but is necessary to educate and inform the community about the long-term alcohol-related risks of cancer, and ultimately, to modify the risk
of this serious consequence of regular light-to-moderate alcohol consumption.

Several strategies have been suggested as part of this initiative, including volumetric taxation of alcohol and restrictions on alcohol marketing and promotion.2,4 As part of a comprehensive alcohol-control strategy, one approach deemed to be cost-effective, with high levels of public and political support, is the introduction of mandated health warning labels that include information about the alcohol-related risk of cancer on alcohol bottles and containers.4 Additional measures (such as messages displayed on posters, coasters, or other promotional material at the point of sale) may be required to ensure that the proposed health warning messages reach consumers purchasing alcohol in glasses in hotels, clubs, or bars.5

However, a number of issues need to be addressed to clearly establish the acceptability and efficacy of mandated alcohol labelling. First, any policy mandating alcohol warning labels involves state interference with a third party (alcohol producers), with the aim of changing individuals’ preferences and behaviours, which could be deemed paternalistic,6 embodying a “nanny state” approach. Notwithstanding that alcohol is addictive and intoxicating, such policies are controversial.4 Moreover, it may be difficult to argue that those drinking at light-to-moderate levels are sufficiently compromised, or indeed, sufficiently problematic, to justify intervention.

One of the arguments supporting policies that may be deemed paternalistic is that such policies counter “our cognitive limitations, bounded rationality and weakness
of will”;7 when faced with temptation, it is all too easy to reverse long-term rationally derived preferences. So, it may be that alcohol consumption is often not a matter of informed autonomous choice, but reflects an immediate prioritisation of short-term gratification over potential future reward. From this perspective, warning labels may be seen as supporting rational choice, and thus promoting autonomy. Regardless, few would deny that consumers have the right to know the health risks associated with the products they consume.

Second, alcohol plays a significant role in the social fabric of Australian culture, providing economic benefit, enhancing social interactions, and featuring in various cultural activities and traditions. For example, sport (a highly valued activity) is fundamentally linked with the advertising and promotion of alcohol, both at the individual and corporate level.8 The alcohol industry contributes substantially to the Australian economy, through tourism, employment in pubs, clubs and bars, and through sales locally and overseas. Consequently, moves to encourage a reduction in alcohol consumption seem likely to meet with resistance from various sectors of the Australian community including from the alcohol industry itself. This industry has, in fact, argued for self-regulation of the provision of information about alcohol risks through warning labels. Public health agencies, however, point to evidence showing that previous attempts to self-regulate have proven inadequate, and call for mandatory government regulation to ensure consistent implementation of alcohol warning labelling and to enforce compliance.9 Thus, for example, voluntary labelling proposed in mid 2011 by the alcohol-industry-funded organisation DrinkWise was promptly rejected as inappropriate and ineffective by the then Alcohol Education and Rehabilitation Foundation, which then released its preferred versions.9 It should also be acknowledged that plans to mandate alcohol warning labelling will be subject to legislation affecting trade and investment. Some public health advocates have voiced concern that current proposed negotiations (the Trans-Pacific Partnership Agreement) may hinder the development and implementation of effective warning labels.10

Third, it is unclear how effective alcohol labelling will be in modifying behaviour to reduce the risk of harm. There is limited evidence to suggest that warning labels can increase public awareness of alcohol-related harms
(with variation dependent on label design, content and demographic factors).9 Further, this awareness may not translate into desired changes in alcohol-related behaviours. For example, some Australian university students have reportedly used information in current NHMRC guidelines about alcohol4 to achieve cost-effective, rapid intoxication.11 Moreover, support for restrictive alcohol policies varies by demographic factors and patterns of drinking, with some evidence for declining support overall across Australia over time.12 It is therefore perhaps not surprising that the recommendation of Cancer Council Australia (that “to reduce their risk of cancer, people limit their consumption of alcohol, or better still avoid alcohol altogether”2) prompted negative mainstream media commentary followed by public responses such as “Pretty much everything gives you cancer these days (apparently) so you may as well enjoy life and have a glass or two of wine when you feel like it!”.13 This kind of statement provides some evidence of a community backlash to attempts to modify alcohol consumption,
but systematic social research is required to identify what, how, and in what context commonly held beliefs may
work to undermine the effectiveness of health-centred communication about alcohol and cancer risk.

Finally, for the proposed alcohol warning labels to achieve any reduction in behaviour that confers a risk of cancer, individuals must identify themselves as “at risk”. The medical consultation may be one situation within which to inform and explore individuals’ perceptions of alcohol-related cancer risk, but this is unlikely to be easy. A limited evidence base indicates that doctors often do not adequately investigate patients’ alcohol consumption, partly because of their own discomfort and the sensitive nature of the issue — even when faced with evidence of patients’ alcohol misuse.14 It seems unlikely that these factors will be any less influential when raising the issue
of light-to-moderate alcohol consumption and the risk of cancer.

We urgently need evidence on how Australians interpret and understand their risk in light of the information about long-term risk of cancer associated with alcohol consumption (specifically including information provided on alcohol warning labels), and how they then negotiate changes to their alcohol consumption. If we are to achieve appropriate modification of alcohol consumption, and
a consequent reduction in the incidence of cancer in Australia, this is a crucial component in the design of an effective communication strategy — both in the context of the public health message and the clinical consultation.

Food contaminants capable of causing cancer, pulmonary hypertension and cirrhosis

Pyrrolizidine alkaloids in food could be a cause of chronic disease

Pyrrolizidine alkaloids (PAs) are natural substances with known toxicity that occur in a number of weeds found in agricultural production systems worldwide.1,2 Bread made from PA-contaminated grain
is a recurring cause of large regional outbreaks of a food poisoning-like syndrome characterised by rapid liver failure and death or development of hepatic sinusoidal obstruction syndrome (HSOS) and cirrhosis.1,2 Similar liver damage can also result from the consumption of herbal medicines, teas, salads and spices containing PAs.14 PAs have been detected worldwide as contaminants in milk, eggs, meat and honey at levels that are too low to cause rapid liver failure or HSOS but perhaps sufficient to initiate chronic diseases, including a range of cancers and pulmonary arterial hypertension (PAH) leading to right-sided heart failure.2,5

Mechanism of PA toxicity

PAs are converted by liver enzymes to extremely reactive alkylating agents, which rapidly form adducts with sulfhydryl, hydroxyl and amine groups on DNA and proteins and other vital molecules in hepatocytes and adjacent sinusoids.1,2 The metabolites alkylate and rapidly deplete sinusoidal glutathione, leading to increased activity of matrix metalloproteinases, degradation of the extracellular matrix and release of sinusoidal endothelial cells, which aggregate with blood cells and adherent monocytes to obstruct sinusoidal blood flow and cause HSOS.6 They also react spontaneously with water to produce (±)-6,7-dihydro-7-hydroxy-1-hydroxymethyl-5H-pyrrolizine (DHP).1,2 DHP is a less reactive alkylating agent than the initial metabolites, and it enters the circulation and forms complexes with DNA and proteins in a wide range of tissues.1,2 Circulating DHP and protein–DHP adducts formed in the liver are considered to be responsible for the long-lasting and slowly developing effects of PA exposure.1,2

Alkylation of DNA by PA metabolites leads to accumulation of somatic mutations, and cancers of
the liver, lung, kidney, skin, intestines, bladder, brain
and spinal cord, pancreas, adrenal gland, muscle (rhabdomyosarcoma) and blood (leukaemia) have
been produced in experimental animals.1,7

Exposure to levels of PAs lower than those causing acute toxicity (liver failure and HSOS) leads to PAH and right-sided heart failure in a high proportion of treated animals, and PAs (in particular, monocrotaline and its metabolites) have been used experimentally to produce an animal model of these conditions.8 This model is widely used to study somatic mutations leading to vascular remodelling in the pathogenesis of PAH, and also to assess the efficacy of drugs. Intermittent low-level dietary exposure to PAs could therefore be a cause of PAH, especially in susceptible people, such as individuals already carrying bone morphogenetic protein receptor type 2 mutations or other predisposing factors that are associated with primary PAH.9

Risk assessment

Genotoxic carcinogens have no safe level of exposure. A tolerable or acceptable level is therefore set for the purpose of food regulation, but a range of opinions currently exist on the acceptable level of PAs in consumed products. For example, a German Federal Pharmaceutical Ordinance has, since 1992, banned the sale of all but a few traditional herbal medicines containing PAs that must be shown to contain no more than 1 μg of PAs per daily dose or 0.1 μg if the herbal product is taken daily for more than 6 weeks per year.2,10 Pregnant and lactating women are advised not to consume these medications, and warning labels must appear on the product. The German Federal Institute for Risk Assessment has more recently expressed the view that a target of zero PA exposure is justified;11 however, this would be impractical to enforce. Therefore, it has suggested that a daily intake of 0.007 μg of PAs/kg bodyweight “should possibly not be exceeded”.12 The United Kingdom Committee on Toxicity of Chemicals in Food, Consumer Products and the Environment has suggested that a PA exposure of 0.1 μg/kg bodyweight/day is unlikely to cause HSOS, and that cancer is unlikely if consumers are exposed to less than 0.007 μg/kg bodyweight/day.13 Dutch authorities have determined a virtual safe level of 0.00043 μg/kg bodyweight/day, leading to at most one person in a million developing cancer, and have proposed a limit of 1 μg/kg of product.10 Food Standards Australia New Zealand (FSANZ) suggests that dietary exposure to 1 μg/kg bodyweight/day is unlikely to cause HSOS and that, despite their undoubted genotoxicity, cancer is probably an unlikely outcome because no cancers in humans have been attributed to PAs.14 FSANZ is currently reconsidering this position in light of new data and recent international risk assessments, and is planning to determine the relative toxicity of PAs in Australian and New Zealand plants before changing its current assessment.15

Dietary exposure in Australia

PA plants of concern in Australia are widespread and include Paterson’s curse (Salvation Jane, Echium plantagineum), fireweed (Senecio madagascariensis), common heliotrope (Heliotropium europaeum) and rattlepods (Crotalaria spp). They can contaminate Australian grain14 and especially fodder and grain fed to livestock.14 Australian livestock are regularly exposed to and poisoned by PAs. Animal products, including milk, eggs and meat, are likely to be occasional sources of low-level dietary exposure.2

Honey from Echium species such as Paterson’s curse
may contain over 2500 μg of PAs/kg.16 Some Australian eucalypt honeys have been found to contain as much as 800 μg/kg, and blended honeys labelled “pure Australian honey” have been found to contain 250 μg/kg.16

Pure Paterson’s curse honey clearly contains hazardous levels of PAs. FSANZ therefore recommends that Australian honey producers not sell pure Paterson’s curse honey and that it should be blended with honeys from other sources to reduce the level of PAs to levels that are unlikely to cause HSOS. The Australian honey industry is endeavouring to comply with this suggestion, but it is still possible to buy honey labelled Paterson’s curse or Salvation Jane in Australia.

Overall, 10%–15% of Australian honey derives from Paterson’s curse, with higher proportions in some states such as South Australia, Western Australia and New South Wales. If 10%–15% of Australian honey contains 2500 μg of PAs/kg and if all of this honey is efficiently blended with other Australian honeys (assumed to contain zero PAs),
a product containing 250–375 μg/kg will be produced. A daily serving of 25 g of this honey is equivalent to eating 6.2–9.4 μg of PAs/day, which is well above the maximum 0.1 μg/day specified by the German herbal medicine regulations.2,10 For a person weighing 60 kg, this level of consumption would be equivalent to eating 0.1–0.16 μg/kg bodyweight/day, which is well above the 0.007 μg/kg bodyweight/day that would ensure that cancer is unlikely.12,13 At the other extreme, if a pregnant (or lactating) woman bought 1 kg of pure Paterson’s curse honey and consumed a serving of 25 g/day, she could be exposed to 62.5 μg of PAs/day for 40 days. If she weighed more than 62.5 kg, she would be within the tolerable limit set by FSANZ14 and, accordingly, unlikely to suffer HSOS; however, the fetus (or breastfeeding infant) may be exposed to a risk of disease. There is a case report of a pregnant woman in Germany whose daily use of a cooking spice containing 25 μg of PAs led to HSOS, liver failure and death of her fetus.4

Future directions

More local monitoring and reporting of PAs in all potential food sources is required, to enable clinicians to assess the level of dietary exposure to PAs and to consider possible health consequences. Such data would also provide important information that consumers (especially pregnant or lactating women) could use to guide food-buying decisions. Clinical and epidemiological studies are also needed, to ascertain whether some cases of liver disease, cancer and PAH are being caused by dietary PAs. Methods for measuring DNA–DHP and protein–DHP adducts in vivo are now available — these indicate current dietary exposure to PAs in specific populations and allow comparison with the incidence of chronic diseases. An appropriate history from patients with cancer, PAH or chronic liver disease of unknown aetiology about the foods that they consume will also assist in establishing or refuting PAs as a significant cause.

Nutrition in schools — outdated guidelines need updating

To the Editor: The National Healthy School Canteens (NHSC) project commenced in 2008 to help provide guidelines for healthier food and drink choices in Australian schools. At their core, the guidelines seek to restrict the availability of poor food choices by encouraging the preferential availability of healthy options. These guidelines should ensure the translation of health research and national health curriculum into practice. However,
the current NHSC guidelines are inadequate and fall short of their aims as they rate foods only on energy, fat and sodium, and disregard the sugar content of commercially available foods.

The initial decision to disregard sugar as a criterion for rating foods available in school canteens was intentional. The New South Wales government website states that sugar content was not included “To keep the criteria as simple as possible and to ensure that foods containing naturally occurring sugars . . . were not disadvantaged”.1 Surprisingly, sugar content is not even a criterion for assessing “sugar-sweetened drinks”.2

Excess sugar consumption is associated with type 2 diabetes and obesity. This has been reported in both human and non-human studies and is evidenced by outcomes including fatty liver, impaired glucose tolerance and increased site-specific adiposity. It is of little surprise then, that the most recent update to the Australian dietary guidelines in February of this year included a revision of the recommendation about foods and drinks containing added sugars (Guideline 3).3

Before February 2013, national dietary advice was to consume only moderate amounts of food and drinks with added sugar. This has since
been revised to advise their intake be limited. This shifts foods and drinks containing added sugar into the same category as foods high in fat, salt or alcohol. There is now an immediate need to review policies borne from the outdated national guidelines (such as the NHSC) to include “added sugar” as criteria for assessing the suitability of foods, just as fat and sodium currently are. Until then, the healthy development of our children and hence future health of our nation is at risk.

Climate change and diabetes: averting two linked catastrophes

To the Editor: Zimmet draws attention to the looming catastrophe of diabetes.1 However, there is a concomitant health catastrophe — climate change, “the biggest global health threat of the 21st century”.2

We believe that it is not useful to argue whether diabetes or climate change is a greater threat to health. Rather, diabetes and climate change are predictable manifestations of contemporary human ecosystems:

The conjoined processes of industrialisation, urbanisation, modernisation and the rise of consumer culture have influenced both . . . food energy intake and . . . physical activity . . . From this perspective the problem is primarily one of a systemic change in our way of living, rather than a consequence of defective individual behaviour.3

Obesity, with its pathological consequences, including diabetes, and climate change have “similar environmental aetiology, based in modern human lifestyles and their driving economic forces”.4

Our lifestyles and the economic forces behind them are driven by fossil fuels rather than agricultural or other renewable sources of energy. As a result, we perform less physical activity, and greenhouse gases are emitted to support our lifestyles and the economy in which we live.3 The industrialisation of food production was made possible by fossil fuels. This has increased the volume of agricultural output and reduced costs, enabling increased consumption of energy-rich, nutrient-poor food.5 Rising rates of obesity, diabetes and greenhouse gas emissions are an inevitable result.2,3

Therefore, effective control of diabetes and climate change at the global population level requires common strategic action.4 This includes:

  • increasing local food production;

  • designing cities and transport systems for sociability and physical activity; and

  • regulaton of corporations to support rather than undermine health and sustain rather than damage the environment.

These strategies will increase physical activity, improve nutrition and reduce our level of fossil fuel use.2

Governments, corporations and the professions must lead societal action to avert the looming catastrophes of diabetes and climate change. Individual clinical and household responses will complement and follow effective leadership. We as health professionals must work strategically and collaboratively to both prevent diabetes and reduce the potential impact of climate change.

A systematic interim assessment of the Australian Government’s Food and Health Dialogue

Chronic diseases are the main causes of premature death and disability in Australia and the world.1 Poor diets — high in salt, saturated fats, added sugar and energy, with inadequate fruits, vegetables and wholegrains — are now the leading cause of this disease burden.1 Adverse levels of these nutrients are driving epidemics of obesity, diabetes, high blood pressure and dyslipidaemia and their clinical sequelae.2,3

The food environment in Australia provides large quantities of cheap and convenient processed and restaurant foods to consumers. These foods are often high in salt, added sugar and fat and are typically delivered in large energy-dense portions.46 A predominance of these types of foods has been identified as a key driver of diet-related ill health around the world.7,8 This problem is well understood by public health groups, government, industry and consumers. However, while Australian agencies like the National Health and Medical Research Council (NHMRC) have provided specific guidance about optimal dietary intake, there has been little effective action to change the diet of the community. Most investment has been in interventions targeting individual behaviour modification. While these approaches can be effective when intensively applied to target groups,9,10 there is little evidence that they will have a positive impact on the dietary patterns of the population as a whole.11

Interventions that seek to change the food environment rather than individuals’ behaviour are now advocated as central to delivering real health gains for the community.2,11 Accordingly, in 2009, the Australian Government established the Food and Health Dialogue (the Dialogue).12 In our experience, the Dialogue is now the entity to which state, territory and federal governments and the Australian food industry consistently refer when questioned about actions required to control the large national disease burden caused by poor diet. In the absence of any reported plans for formal evaluation of the Dialogue, our objective was to determine the extent to which the Dialogue is delivering on its initial goals 4 years after its inception and to make recommendations on how its effectiveness might be enhanced.

Methods

We evaluated the Dialogue using the RE-AIM (reach, efficacy, adoption, implementation and maintenance) framework. This method has been used to assess the public health impact of a series of prevention programs and health policies.13,14 The five dimensions of the RE-AIM framework allowed a broad-based assessment of the Dialogue (Appendix 1). Evaluation was preceded by an examination of Dialogue materials and a broader consideration of diet-related ill health in Australia, in an effort to define the scope of the objectives to be assessed and the outcomes that might reasonably be anticipated.

Information about the Dialogue was derived from materials published on the Dialogue website, media releases, communiqués and e-newsletters from its inception in October 2009 to September 2013.12 We systematically searched these Dialogue materials to identify indications of intent, which were then grouped and summarised in terms of the rationale, goals, implementation plans and anticipated outcomes of the Dialogue (Box 1). Progress was evaluated using the RE-AIM framework by systematically reviewing the information collected, defining appropriate metrics for the evaluation of each dimension and, where possible, summarising those metrics in a tabular format. The final set of objectives and the form of the evaluation undertaken were agreed by the authors through an iterative process of review and amendment.

Data describing the processed foods marketed in Australia were extracted from an existing branded food composition database.5 The number of possible food reformulation areas for action (eg, reducing the level of sodium) was calculated by multiplying the number of food categories (n = 22, including five ‘‘other’’ categories comprising products not covered by the Dialogue’s food category definitions; Appendix 2) by the number of action areas (n = 8), then subtracting the 52 combinations where no target was applicable (eg, a sodium target for eggs is unnecessary because the amount of sodium in an egg is not modifiable), leaving a total of 124 areas for action.

Finally, the results were considered in the context of an accountability framework15 and the Australian Competition and Consumer Commission (ACCC) Guidelines for developing effective voluntary industry codes of conduct16 to try to identify recommendations for improvement.

Results

The available data with which to evaluate the Dialogue were limited, with no clear reporting of objectives or planned outcomes, no systematic baseline data collection and little quantitative reporting of progress between October 2009 and September 2013.

Identified goals of the Dialogue

The goals of the Dialogue were identified as “raising the nutritional profile of foods through reformulation, consumer education and portion standardisation” and providing “a framework for government, public health groups and industry to work collaboratively across all levels of the food supply chain to improve dietary intakes” (Box 1).12 Emphasis was given to “food innovation, including a voluntary reformulation program across a range of commonly consumed foods”, seeking to “reduce the saturated fat, added sugar, sodium and energy, and increase the fibre, wholegrain, fruit and vegetable content across nominated food categories”.12

Adoption and implementation

The Dialogue was established as a public–private partnership governed by an Executive Group chaired by the Parliamentary Secretary for Health and Ageing and now comprising representatives from the Australian Food and Grocery Council (AFGC), the Heart Foundation of Australia, Woolworths Limited, the Public Health Association of Australia, the Commonwealth Scientific and Industrial Research Organisation (CSIRO), the Quick Service Restaurant Forum, the Health Promotion Branch of SA Health, and Food Standards Australia New Zealand.

The Reformulation Working Group has identified priority food categories for reformulation and convened a series of industry roundtables to define targets, develop action plans and deliver the agreed outcomes. By September 2013, 11 targets from among the 124 possible action areas (8.9%) had been set (Box 2 and Appendix 3). None of the targets were due to have been achieved, and reporting of progress with their adoption is limited (Box 3). Engagement of the relevant companies in each food category ranges between 60% and 100% (Appendix 4). There have been no reported consumer awareness or education campaigns.

Reach and efficacy

The extent to which the Australian population has obtained access to reformulated foods, foods of standardised portion size and nutrition education has not been reported. There has also been no reporting of the degree to which exposure to reformulated foods and education has affected purchasing patterns, intermediate physiological parameters or measures of diet-related disease burden. Dialogue modelling data project reductions in dietary exposure to sodium from bread, simmer sauces and ready-to-eat breakfast cereals,12 but these claims cannot be objectively substantiated.

Maintenance

The Dialogue Executive Group has recently spoken about plans for a high-level framework for monitoring and evaluation of activities, but there is no documentation describing how this will be funded or delivered. Brief progress reports for some targeted food categories were initially forthcoming (Box 3), but the Dialogue has recently failed to report at the prespecified milestones for most food categories.

Discussion

The Dialogue has highly creditable goals. The emphasis of the work program on making the entire food environment healthier is especially welcome from a public health viewpoint as it represents a significant enhancement to current efforts that focus on trying to persuade individuals to make better food choices. Interventions that change the food environment require only the passive participation of the community and are projected to deliver large health gains for low cost.2,10,11,17,18 In particular, the core strategy of food reformulation has a key advantage over individually targeted behavioural and educational interventions, in that it can be delivered and sustained at scale within a resource-constrained setting.

Unfortunately, while the Dialogue’s goals are laudable, the mechanism for delivering on them has proved inadequate. Few targets have been set, little objective evidence about progress has been provided, and there is a low likelihood that any real health gains have been achieved. Furthermore, the recent decline in submission of progress reports raises concerns that interest is waning. In the context of an industry in which profitability is substantially aided by the addition of salt, sugar and fat to foods, it is perhaps unsurprising that a voluntary model based on a public–private partnership faces these challenges.16,19

Using these findings, we identified a series of suggested actions for strengthening the effectiveness of the Dialogue (Box 4). These recommendations have a focus on transparency and accountability and are substantively underpinned by the Competition and Consumer Act 2010 (Cwlth) and the ACCC guidelines,16 which note that voluntary industry codes must be both well designed and effectively implemented and enforced. The Healthy Weight Commitment Foundation in the United States and the United Kingdom’s Public Health Responsibility Deal have well developed strategies for monitoring and evaluation from which the Dialogue could learn.20,21 In particular, it will be necessary to develop mechanisms that control for the significant conflicts of interest that exist for influential industry umbrella organisations like the AFGC. While it is reasonable for such bodies to argue for a system that maximises profits, the Dialogue was established to reduce health problems, and this is not currently being achieved.

Strengths of our study include its systematic approach and the use of an established framework for assessment. Although the conclusions are limited by the few objective data available about the Dialogue’s progress, it is possible to draw some robust conclusions about the strengths and weaknesses of the process implemented to date. If the listed recommendations (Box 4) can be put in place, a future analysis should be even more informative.

In the meantime, the evidence suggests that the current approach to preventing diet-related ill health in Australia is failing. Australia has an unprecedented burden of disease attributable to poor diet, with no evidence that this is likely to reduce in the near future. The limited effectiveness of entirely voluntary measures in other jurisdictions suggests that some form of responsive regulation is likely to be required.2 While new standards for foods are off the agenda from the food industry perspective, it is clear that regulation can prevent diet-related ill health without harming business.19 Acute food poisoning is now very uncommon in Australia due to extensive but carefully constructed regulations. If the same were done to prevent the “chronic food poisoning” now killing more Australians than even tobacco,1 this would level the playing field for the food industry and make healthy foods the norm.

1 Rationale, approach and potential outcomes of the Food and Health Dialogue

2 Status of Food and Health Dialogue actions on food reformulation and portion size standardisation
4 years after inception

Food reformulation area for action


Food categories*

Sodium

Saturated fat

Added sugar

Energy

Fibre

Whole-grains

Fruit/vegetable content

Portion size


Breads

T

X

X

X

X

X

X

Other bakery products

X

X

X

X

X

X

X

Ready-to-eat breakfast cereals

T

X

X

X

X

X

X

X

Other cereal products

X

X

X

X

X

X

X

X

Simmer sauces

T

X

X

X

Other sauces and spreads

X

X

X

X

Processed meats

T

T

X

X

X

Other meat products

X

X

X

X

X

Soups

T

X

X

X

X

X

T

Savoury pies

T

X

X

X

X

X

X

T

Potato/corn/extruded snacks

T

X

X

X

X

X

X

Savoury crackers

T

X

X

X

X

X

X

Other snack foods

X

X

X

X

X

X

X

Confectionery

X

X

X

X

X

X

X

Convenience foods

X

X

X

X

X

X

X

X

Dairy products

X

X

X

X

X

Edible oils and emulsions

X

X

X

X

X

Eggs

Fish and fish products

X

X

X

X

X

Fruit and vegetable products

X

X

X

X

Non-alcoholic beverages

X

X

X

Sugars, honey and related products

X

X

X


Target achieved

T

Target set

X

No action

Not applicable

* Food categories are those defined in the George Institute for Global Health branded food composition database (Appendix 2).5 Targets set by the Food and Health Dialogue do not always cover all products in the food category (Appendix 3).

3 Time frames for implementation, scheduled reporting and actual reporting for targeted food categories of the Food and Health Dialogue

Food category
(time frame)

Reports
anticipated

Reports published
or missing


Breads
(May 2010 – Dec 2013)

6-monthly in 2010–11, then annually:

Nov 2010

Nov 2010

May 2011

Aug 2011 (late*)

Nov 2011

Aug 2012 (very late)

Nov 2012

Missing

Dec 2013

na

Ready-to-eat breakfast cereals
(May 2010 – Dec 2013)

6-monthly in 2010–11, then annually:

Nov 2010

Nov 2010

May 2011

Aug 2011 (late*)

Nov 2011

Aug 2012 (very late)

Nov 2012

Missing

Dec 2013

na

Processed meats
(Jan 2011 – Dec 2013)

6-monthly in 2011–12, then annually:

Jul 2011

Nov 2011 (late*)

Jan 2012

Aug 2012 (very late)

Jul 2012

Nov 2012 (late*)

Jul 2013

Missing

Dec 2013

na

Simmer sauces
(Jan 2011 – Dec 2014)

Every 2 years:

Dec 2012

May 2013 (late*)

Dec 2014

na

Soups
(Dec 2011 – Dec 2014)

Annually from Feb 2012:

Feb 2012

Missing

Feb 2013

Missing

Feb 2014

na

Dec 2014

na

Savoury pies
(Mar 2012 – Mar 2014)

6-monthly:

Sep 2012

Missing

Mar 2013

May 2013 (late*)

Sep 2013

Missing

Mar 2014

na

Potato/corn/
extruded snacks
(Dec 2012 – Dec 2015)

6-monthly for first year, then annually:

Jun 2013

Missing

Dec 2013

na

Dec 2014

na

Dec 2015

na

Savoury crackers
(Dec 2012 – Dec 2015)

6-monthly for first year, then annually:

Jun 2013

Missing

Dec 2013

na

Dec 2014

na

Dec 2015

na


na = not applicable at time of writing (Sep 2013). * ≤ 6 months overdue.
> 6 months overdue.

4 Recommendations for strengthening the effectiveness and accountability of the Food and Health Dialogue

Agreed objectives

  • Leadership from ministerial level of government

  • Coordination with strategy on front-of-pack labelling

  • Substantial new investment in Dialogue activities

  • Broader engagement to include all relevant stakeholder groups from government, industry, public health, academia and other organisations

  • New process for target-setting that removes conflicts between private-sector profit motives and public health objectives, adopts applicable overseas targets in the interim, and sets maximum acceptable levels

  • Industry roundtables focus on implementation activities

Monitoring and evaluation

  • Clear and meaningful objectives defined with timelines

  • Process, intermediate and definitive health outcomes to be specified

  • Objective third party delegated to measure and report on achievement of objectives

  • Economic evaluation to be conducted

  • Representative from Australian Competition and Consumer Commission to be appointed as an independent observer

Reporting

  • Transparency of Dialogue processes — open meetings of Executive Group, Reformulation Working Group and roundtables, published meeting agendas and minutes

  • 6-monthly scorecards reported for all outcomes

  • Comprehensive information provided on the website

Enforcement

  • Agreed Dialogue targets enshrined as Codes of Practice by Food Standards Australia New Zealand

  • Strategy to reward corporate participation and discourage non-compliance

  • Consideration of responsive regulation to support Dialogue activities

  • Documented plan to move from voluntary to regulatory mechanism if objectives not achieved

Iterative modification

  • Rolling review of each target every 5 years, with resetting as required

  • Annual review of Dialogue objectives against performance

  • Mechanism for review and upgrading of Dialogue approach as required