×

Local acquisition and nosocomial transmission of Klebsiella pneumoniae harbouring the blaNDM-1 gene in Australia

The emergence of carbapenem-resistant Enterobacteriaceae constitutes a critical global issue. Isolates harbouring the metallo-β-lactamase gene blaNDM-1 have few available treatment options. We report a case of an Australian adult with a locally acquired, community-onset blaNDM-1 Klebsiella pneumoniae infection and likely nosocomial transmission to another patient.

Clinical records

Patient A, a 68-year-old Australian-born woman living with her husband and son, had never travelled overseas and had no known contact with overseas visitors. Her past history included chronic bilateral lymphoedema with recurrent lower limb cellulitis, requiring multiple previous hospital admissions and home nursing care. She presented with septic shock and right leg erythema surrounding a 10 × 10 cm ulcer near the right lateral malleolus. Magnetic resonance imaging showed bony oedema and enhancement in the lateral malleolus, suggestive of osteomyelitis. Pseudomonas aeruginosa was isolated from blood cultures. A tissue biopsy from the overlying ulcer cultured P. aeruginosa, non-multiresistant methicillin-resistant Staphylococcus aureus (NORSA), and carbapenem-resistant Klebsiella pneumoniae, resistant to all first-line antimicrobials tested and susceptible to only colistin and fosfomycin.

She was given intravenous ceftazidime and vancomycin for treatment of P. aeruginosa and NORSA infection. After 6 weeks of treatment, the ulcer was not healing, and treatment for the carbapenemase-producing K. pneumoniae was commenced with intravenous colistin methanosulfonate (120 mg colistin base activity 12-hourly). Colistin was ceased after 3 weeks owing to acute kidney injury, and oral fosfomycin (3 g every 3 days) was administered for a further 6 weeks, in addition to oral ciprofloxacin and rifampicin for ongoing treatment of NORSA and P. aeruginosa infection. Since the cessation of her antibiotics, she has not required further antibiotic treatment of her ulcers.

Patient B, a 35-year-old Australian-born man with no history of overseas travel, was admitted with bilateral thigh cellulitis and septic shock. He had bilateral thigh debridement, with no evidence of necrotising fasciitis. Methicillin-susceptible S. aureus (MSSA) was isolated from multiple blood cultures. MSSA and Serratia liquefaciens were isolated from a thigh wound swab culture. Transthoracic echocardiogram revealed a left ventricular thrombus. He was commenced on intravenous flucloxacillin and ciprofloxacin. Two weeks after admission, further surgical samples from his thigh wounds cultured carbapenem-resistant K. pneumoniae, with similar antimicrobial susceptibility phenotype to Patient A. The isolate was deemed to be colonising the wound only, and no antimicrobials were commenced for treatment.

Both K. pneumoniae isolates demonstrated carbapenemase activity using the Carba NP assay.1 Molecular tests using polymerase chain reaction and sequencing for carbapenemase, extended-spectrum β-lactamase, plasmid-mediated AmpC β-lactamase and 16S ribosomal RNA methylase genes were performed as described elsewhere.2 The metallo-β-lactamase gene blaNDM-1 was detected in both isolates, in addition to blaCTX-M-15 and 16S ribosomal RNA methylases (armA and rmtB), which confer resistance to aminoglycosides, including amikacin. The relatedness of isolates was determined by semi-automated repetitive sequence-based polymerase chain reaction using a DiversiLab Klebsiella kit (bioMérieux). This analysis showed a > 95% genetic similarity between the two isolates. Further, the isolates were genetically distinct from two blaNDM-1-harbouring isolates that we isolated previously in patients with a history of overseas travel.

Patients A and B were admitted in December 2013 to a high dependency unit (HDU) — a four-bed area separated by curtains. They were one bed apart for 5 days before being moved adjacent to each other for 1 day, with Patient B occupying the bed cubicle space formerly occupied by Patient A for a further 5 days. The carbapenem-resistant K. pneumoniae was first identified in Patient A in the HDU, and 2 weeks later was isolated from Patient B.

After detection of the carbapenem-resistant K. pneumoniae, strict contact precautions were implemented. Environmental cleaning of the four-bed HDU and other rooms occupied by Patients A and B was undertaken with microfibre and steam cleaning, which has been shown to be an effective cleaning method.3 An exposure investigation was conducted, with environmental sampling and screening rectal swabs collected from all direct patient contacts of Patients A and B inoculated on chromogenic selective media. No other carbapenem-resistant organisms containing blaNDM-1 were isolated from clinical, screening or environmental samples.

Discussion

The metallo-β-lactamase gene blaNDM-1 was first described in a patient hospitalised in Sweden after travel to India in 20084 and subsequently identified in a series of patients in the United Kingdom, many of whom had travelled to the Indian subcontinent.5 There have been documented cases of infection with imported blaNDM-1-containing bacteria in Australia.610 These carbapenem-resistant bacteria are challenging to treat, as available treatment options are often limited to infrequently used drugs such as colistin, fosfomycin and tigecycline.

The case of Patient A has significant public health ramifications as the first detection of carbapenem-resistant blaNDM-1-harbouring K. pneumoniae infection locally acquired in Australia, independent of international travel or documented contact with a traveller. The case suggests that there may be more cases of blaNDM-1-harbouring bacteria in our community than previously suspected. We hypothesise that this carbapenem-resistant Enterobacteriaceae isolate was acquired after transmission from an unidentified carrier of blaNDM-1, possibly during previous hospital admissions or receipt of home nursing care.

The transmission from Patient A to Patient B may have occurred via a number of mechanisms. First, environmental contamination may have contributed, given that both patients shared the same bed area at different times. We previously reported an outbreak of carbapenem-resistant Enterobacteriaceae harbouring the metallo-β-lactamase gene blaIMP-4, associated with contaminated sinks in an intensive care unit; in that case, no carbapenem-resistant organisms containing blaNDM-1 were isolated from environmental samples.11 The second possible contributing factor for transmission is lapses in infection control practices by health care staff, which emphasises the importance of adhering to standard precautions such as hand hygiene.12

These cases highlight the evolving Australian epidemiology of multidrug-resistant organisms, particularly bacteria harbouring blaNDM-1. Such resistance is no longer exclusively associated with obvious international travel. There is an increasing need for effective antimicrobial stewardship and infection control measures to prevent potential future nosocomial spread of these organisms. In addition, further research and surveillance is needed in monitoring these local isolates to identify potential risk factors for local acquisition and any reservoirs within the Australian health system and community.

[Series] Management of obesity: improvement of health-care training and systems for prevention and care

Although the caloric deficits achieved by increased awareness, policy, and environmental approaches have begun to achieve reductions in the prevalence of obesity in some countries, these approaches are insufficient to achieve weight loss in patients with severe obesity. Because the prevalence of obesity poses an enormous clinical burden, innovative treatment and care-delivery strategies are needed. Nonetheless, health professionals are poorly prepared to address obesity. In addition to biases and unfounded assumptions about patients with obesity, absence of training in behaviour-change strategies and scarce experience working within interprofessional teams impairs care of patients with obesity.

Pithy overview of public health

PUBLIC HEALTH practitioners use diverse methods. Although their impact can sometimes be direct (eg, vaccinating school children to stop the spread of measles), many outcomes take a while to emerge. Years might elapse between the formation of a hypothesis about the cause of illness (eg, tobacco smoking) and consequent improvement in the community’s health (eg, reduced lung cancer rates), brought about by a suite of public health activities such as surveillance, epidemiology, biostatistics, communication, education, politics, partnership development, legislation, regulation, clinical trials, health promotion and health system financing and management.

The Oxford handbook of public health practice does a good job of explaining the range of these activities. Now in its third edition, the handbook is edited by an international team led by a former ACT Chief Health Officer and includes 60 essays by almost 100 authors. Although written largely from a British viewpoint, there is a fair smattering of Australian content and the occasional American and European example.

Despite its range, the editors have kept true to the handbook ideal, producing something that can be pulled out of your bag for a pithy overview of a subject (“Understanding data …”, “Communicable disease epidemics”, “Developing healthy public policy”, “Knowledge transfer”) on your morning commute. The reader is aided by a broadly standard approach to each essay.

Public health is going through a technological revolution, benefiting from new vaccines, genomics, access to large health databases, data matching and analytical tools, and efficient communications. The new edition addresses many of the emerging issues, although it focuses largely on ways of doing things (such as how to go about investigating an outbreak), rather than the technologies themselves (such as what new vaccines have been developed in recent years).

While it won’t make you an expert, the handbook will give you a good sense of the breadth of public health practice, and point you to further resources. It will be useful for students and early career public health workers, a valuable resource for primary care practitioners interested in figuring out what we do, and a handy checklist for us older hacks.

[Seminar] Multiple myeloma

Multiple myeloma is a malignant disease characterised by proliferation of clonal plasma cells in the bone marrow and typically accompanied by the secretion of monoclonal immunoglobulins that are detectable in the serum or urine. Increased understanding of the microenvironmental interactions between malignant plasma cells and the bone marrow niche, and their role in disease progression and acquisition of therapy resistance, has helped the development of novel therapeutic drugs for use in combination with cytostatic therapy.

Doctors for the Environment Australia: achievements and lessons learned

Political ideology has proved to be the greatest obstacle to DEA’s ability to reduce the health hazards of climate change

Doctors for the Environment Australia (DEA), created in 2002, aimed “to utilise the skills of members of the medical profession to address the ill health resulting from damage to the natural environment at local, national and global levels”.1 This agenda was overwhelming, and with humanity’s astonishing failure to stop the rise of greenhouse gas emissions and the gathering pace of climate change, DEA has focused on the medical threats of climate change. As a medical organisation, DEA was a frontrunner in its forthright recognition of this problem, which the World Health Organization now regards as the defining health issue of our time. DEA maintains that the established medical colleges and organisations need to speak out more strongly about the health hazards of climate change.

Since our inception we have had committed assistance from many distinguished medical and scientific colleagues. The late Tony McMichael was a founding member and tireless supporter of DEA with his advice and valuable long-term involvement with students and politicians. He helped us with policy and landmark publications. DEA and global public health owe him a huge debt.2

In 2009, the DEA made a policy decision to advocate and educate on the health effects of using fossil fuels as well as climate change. This led to our work on the health effects of coal combustion, which is actually an expensive form of power generation.3,4 The DEA promotes renewable energy as a replacement for coal, and educates about the potential harms of unconventional gas exploration and production.

In 2010, the DEA began to encourage its membership to divest from fossil fuel industries by pressuring the “big four” banks to withdraw from financing fossil fuel expansion, thus presaging the current and gathering momentum to encourage divestment from the fossil fuel industries.

In recent times DEA’s advocacy has included providing advice to governments and oppositions on the health impacts of coal seam gas, shale gas and coal, campaigning to save the Tarkine region in Tasmania from further mining developments, challenging the Victorian Environmental Protection Agency for approving a new coal-fired power plant and contributing to the development of the Climate Commission’s report, The critical decade: climate change and health.5

Of the problems faced when the DEA was formed, the most underestimated was political ideology as an impediment to progress.6,7 In Australia the health aspects of climate change are decided in an unequal contest between public health and an alliance of government, industry and much of the media. Health impact assessments are invisible in the crusade to push fossil fuel development and cut green tape. The scientific aspects of climate change are dismissed as “crap”. The conservative mind has become fixated on the perceived threats to economic growth imposed by the environmental movement. The intent of DEA has been to present global environmental change as a vital health concern and an increasing cost to our economic futures. In this regard, the Australian Government’s action on the carbon tax and the renewable energy target can be regarded as a threat to the vital public health need to reduce greenhouse gas emissions.

The DEA website (http://dea.org.au) provides details of our submissions, policies and activism. However, our greatest achievement has surely been involving medical students as full members who contribute to all levels of the decision making and to the activities of state committees, visits to ministers and members, letter writing and presentations to parliaments. More than 300 students attended this year’s DEA conference. This promises a wave of informed activism and medical knowledge that is essential for action on public health over the crucial next 20 years.

Although most DEA members are practising doctors, all sections of the medical community are represented as reflected in our promotional video.8 We believe our clinical appreciation of vital public health issues strengthens our advocacy.

When we ask doctors for help, the usual response is “I don’t have time but I agree with your cause”. To these colleagues we say, “Our work is funded almost totally on membership fees, so by joining you are helping”. You can join here: http://dea.org.au/join.

Equivalence of outcomes for rural and metropolitan patients with metastatic colorectal cancer in South Australia

Metastatic colorectal cancer (mCRC) is the fourth most common cause of cancer death in Australia.1 The past 15 years have seen improved outcomes in patients with mCRC, largely due to increased chemotherapeutic and biological treatment options and widespread adoption of liver resection for liver-limited mCRC.2 These improvements have led to an increase in reported median survival from 12 to 24 months since 1995. Despite these advances, patients with unresectable mCRC usually die from the disease, with 5-year overall survival of about 15%.2 Initial treatment for mCRC involves combination chemotherapy or single-agent therapy. Survival is improved in patients who ultimately receive all three active chemotherapy drugs (oxaliplatin, irinotecan and a fluoropyrimidine)3 and have access to biological agents, such as bevacizumab.2

Australia’s geographical challenges (large land area and low population density) contribute to difficulties in service provision and disparity of cancer outcomes.4 Some authors have suggested the observed higher death rate among Australia’s rural population is the result of a double disadvantage: higher exposure to health hazards and poorer access to health services.5,6 There is a complex interplay between remoteness of residence and other known causes of poor cancer outcome, including unequal exposure to environmental risk factors,5 less participation in cancer screening programs,79 delayed diagnosis,10 socioeconomic disadvantage,4,11 and higher proportions of disadvantaged groups such as Indigenous Australians.12 Despite these factors, an Australian study of patients with rectal cancer found that increasing distance between place of residence and a radiotherapy centre was independently associated with inferior survival.6 A recent analysis of cancer outcomes using population mortality data found that reductions in the cancer death rate between 2001 and 2010 were largely confined to the metropolitan population, with an estimated 8878 excess cancer deaths in regional and remote Australia, including 750 CRC deaths.13

Remoteness poses practical difficulties that may lead patients with cancer and their clinicians to make choices based on the need for travel, or because of perceived toxicity risks of different regimens. Population studies have shown that rural patients have reduced rates of radical surgery,9 less adjuvant radiotherapy,14 delays in commencing adjuvant chemotherapy15 and reduced clinical trial participation.16 Rural cancer patients can also face a significant financial and travel burden.17

Rural patients in South Australia have historically had limited access to regional oncology services, as population numbers outside metropolitan Adelaide are insufficient to support onsite oncologists. Until recently, this has meant that most chemotherapy is delivered in Adelaide, reflecting a more centralised service than in Australia’s eastern states. An effort is currently being made to shift to more rural chemotherapy delivery and an expanded visiting oncology service.18

In this study, we used the South Australian Clinical Registry for Metastatic Colorectal Cancer (SA mCRC registry) to investigate disparity in outcomes and treatment delivery for rural patients with mCRC compared with their metropolitan counterparts.

Methods

The SA mCRC registry is a state-wide population-based database of all patients diagnosed with synchronous or metachronous mCRC since February 2006. Previous registry-based analyses have led to the description of important associations of patient subgroups and outcomes.1921 Core data include age, sex, demographics, tumour site, histological type, differentiation and metastatic sites. Treatment data consist of surgical procedures, chemotherapy (including targeted therapy), radiotherapy, radiofrequency ablation, and selective internal radiation therapy. The date and cause of death for each patient in the registry is obtained through medical records review and electronic linkage with state death records. Approval for this study was granted by the SA Health Human Research Ethics Committee.

For this study, we included data collected between 2 February 2006 and 28 May 2012. We compared the oncological and surgical management (primarily metastasectomy) and survival of metropolitan versus rural patients. Based on the accepted registry definitions, patients residing in metropolitan Adelaide (postcodes 5000–5174) were designated the “city” cohort, with all other patients (postcodes 5201–5799) in the “rural” cohort. Patient characteristics, use of chemotherapy across first, second and third lines of treatment, choice of first-line chemotherapy, hepatic resection rates and survival were analysed and compared between the city and rural patient cohorts.

All analyses were undertaken using Stata version 11 (StataCorp). Overall survival (OS) analysis was done using conventional Kaplan–Meier methods. Survival was calculated from the date of diagnosis of stage IV disease to the date of death, with a final censoring date of 28 May 2012. The log-rank test of equality was used for comparisons. OS was used as the end point because this outcome measure was available in the registry data and to avoid misclassification of cause of death in disease-specific survival.

Results

Patient characteristics

Data from 2289 patients, including 624 rural patients (27.3%), were available for analysis (Box 1). There was a higher proportion of male patients in the rural than the city cohort (62.7% v 53.6%; P < 0.001). The colon was the primary site of malignancy in a higher proportion of city than rural patients (75.7% v 71.5%; P = 0.04). Kirsten rat sarcoma viral oncogene homolog (KRAS) mutation testing was performed in around 14% of patients in both cohorts, and the proportion of KRAS exon 2 wild-type tumours was not significantly different between rural and city cohorts (59.8% v 59.7%; P = 0.96). Clinical trial participation did not differ significantly between the cohorts (7.1% v 9.2%; P = 0.10).

Treatment

Chemotherapy

First-line chemotherapy was administered in 58.3% of rural patients, compared with 56.0% of city patients (P = 0.32) (Box 2). As a percentage of patients who received any chemotherapy, rates of second-line (22.5% v 23.3%; P = 0.78) and third-line (9.3% v 10.1%; P = 0.69) chemotherapy administration were also similar between rural and city cohorts. There were differences between the cohorts in the type of first-line treatment: rural patients had less use of combination chemotherapy (59.9% v 67.4%; P = 0.01) and biological agents (16.8% v 23.7%; P = 0.007) than city patients, though numerically these differences were small. When an oxaliplatin combination was prescribed, the oral prodrug of 5-fluorouracil, capecitabine, was used more frequently in rural patients than city patients (22.9% v 8.4%; P < 0.001). Only 21 rural patients (5.8%), and no city patients, received their first dose of first-line chemotherapy in a rural chemotherapy centre.

Non-chemotherapy

Adoption of any of the non-chemotherapy treatment modalities did not differ significantly by place of residence (Box 3). Of note, there was no significant difference in rates of hepatic metastasectomy between city and rural cohorts (13.7% v 11.5%; P = 0.17). Pulmonary metastasectomy rates were higher in city patients (3.2% v 2.1%; P = 0.10), but total numbers were small.
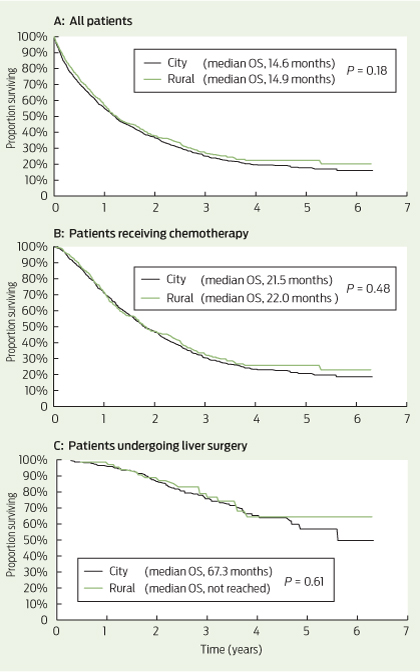
Survival

Among all patients, the median OS was 14.6 months for city patients and 14.9 months for rural patients (P = 0.18) (Box 4, A). Among patients receiving chemotherapy (with or without metastasectomy), the median OS was 21.5 months for city patients and 22.0 months for rural patients (= 0.48) (Box 4, B). For patients undergoing liver metastasectomy, the median OS was 67.3 months for city patients and was not reached in rural patients (P = 0.61) (Box 4, C).

Discussion

Our results demonstrate that rural patients with mCRC in SA receive comparable treatment and have equivalent survival to their metropolitan counterparts. In particular, patients in rural areas are treated with equivalent rates of potentially curative metastasectomy and chemotherapy, two key determinants of length of survival. These are the first Australian data specifically analysing rates of chemotherapy in rural patients with mCRC, and they suggest the excess colon cancer mortality seen in rural patients relates to factors other than access to treatment in the metastatic setting.

While there were no significant differences between the cohorts in rates of patients receiving chemotherapy across all lines of treatment, rural patients received less first-line combination chemotherapy, increased use of capecitabine and reduced use of biological agents in the first line than city patients.

First-line combination chemotherapy with intravenous infusional 5-fluorouracil, folinic acid and oxaliplatin (FOLFOX) has equivalent efficacy to oral capecitabine and oxaliplatin (XELOX).22 The choice between the two regimens is based on differing toxicities and practical considerations. FOLFOX requires a central venous catheter (CVC) and a second visit to a chemotherapy day centre every fortnight for ambulatory pump disconnection. XELOX has the advantages of single 3-weekly clinic visits and no CVC, but compliance with twice-daily chemotherapy tablets and potentially higher rates of symptomatic toxicity (hand–foot syndrome and diarrhoea) are limitations. The higher use of XELOX among rural patients reflects the relative practical benefits of this regimen where travel distances and access to nursing staff trained in CVC management are important considerations. The potential for toxicity of XELOX requires careful patient education and system approaches to enable early recognition and intervention in the event of severe toxicity among rural, often isolated, patients. Early follow-up telephone calls by a nurse practitioner or telemedicine consultations are potential strategies to provide this important aspect of care to rural patients.23,24

We observed a small but significant reduction in the rate of biological agents used in first-line therapy for rural patients, mostly due to reduced bevacizumab prescribing. It is possible clinicians were reluctant to “intensify” therapy in rural patients due to a lack of supervision or access to health care, particularly given risks of haemorrhage. It is also possible this small difference reflects a chance finding. The pattern of bevacizumab prescribing has evolved over the period captured in the registry, and an updated analysis of patients diagnosed since 2010 may provide further insights.

The equivalent rate of attempted curative metastasectomy in rural mCRC patients compared with city patients is reassuring, given this approach provides the only option for long-term survival in mCRC. The survival curves of patients undergoing liver metastasectomy showed a survival plateau at 5 years of 50% or greater for both city and rural patients (Box 4, C). This compares favourably with other modern surgical case series, with reported 5-year survival of 32%–47% after liver resection.25

Delivery of specialised health care services for rural Australians requires policymakers to carefully balance the merits of a centralised versus a decentralised system, with unique consideration for each region. For example, no regional centres in SA have a population sufficient to support a full-time resident medical oncologist and are instead serviced by a visiting (fly-in fly-out) oncologist. Limited infrastructure and staff training have also largely prevented widespread administration of chemotherapy in regional centres. Highlighting this point, we found that only 5.8% of rural patients receiving chemotherapy received their first cycle in a rural treatment centre. The SA Statewide Cancer Control Plan 2011–2015 lists the establishment of regional cancer services and chemotherapy centres as a key future direction to optimise care for rural cancer patients.18 Unfortunately, no publications have assessed outcomes of rural patients with mCRC treated in other regions of Australia, particularly in the eastern states where regional oncology services are common. While our analysis supports equivalent survival outcomes for rural patients treated within SA’s largely centralised service, the practical, social and economic advantages of regional cancer centres remain an important consideration not captured in our study. Given this, we consider that our findings highlight the positive outcomes achieved through high-quality, specialised care, rather than suggest that current regional services in Australia should also adopt a centralised approach.

As our analysis dichotomised patients into city and rural cohorts, it does not provide outcome information based on the degree of remoteness. Despite this limitation, chemotherapy and surgical treatment were almost entirely delivered in Adelaide, and thus our analysis appropriately distinguishes those patients who had to travel to access oncological care. The possibility of inadequate registry ascertainment of rural cases of mCRC also poses a possible limitation. However, we are confident this is not a source of bias, as the registry collects information from all histopathology reports in SA, which are processed centrally in Adelaide. An important limitation of our study is that we report only on mCRC, and stage I–III disease is not included. The impact of treatment differences in early-stage CRC (eg, quality and timeliness of surgery, use of adjuvant chemotherapy) on overall survival of patients with mCRC cannot be determined in this analysis. Reassuringly, however, about two-thirds of mCRC cases in both cohorts were synchronous (ie, no prior early-stage disease), suggesting this is unlikely to limit our conclusions. Further, the equivalent rates of synchronous diagnosis in rural and urban patients may suggest there was no major delay in diagnosis of rural patients.

Although higher cancer incidence and poorer outcomes have been consistently demonstrated for rural cancer patients in Australia, we found equivalent treatment patterns and survival for rural patients diagnosed with mCRC in SA since 2006 compared with their metropolitan counterparts. This confirms optimal treatment of rural patients results in equivalent outcomes to metropolitan patients, irrespective of disadvantage. Further, it suggests previously demonstrated disparate outcomes may be due to factors such as higher incidence of CRC as a result of burden of risk factors and potentially reduced screening participation, rather than treatment factors once mCRC has been diagnosed. Targeting these factors is likely to provide the greatest impact on reducing the excess cancer burden for rural Australians.

1 Patient characteristics, by city versus rural residence (n = 2289)*

Characteristic

City

Rural

P


No. (%) of patients

1665 (72.7%)

624 (27.3%)

Median age (range), years

73 (17–105)

72 (31–100)

0.11

Sex


Male

893 (53.6%)

391 (62.7%)

< 0.001

Female

772 (46.4%)

233 (37.3%)


Primary site


Colon

1260 (75.7%)

446 (71.5%)

0.04

Rectum

405 (24.3%)

178 (28.5%)


Synchronous disease

1070 (64.3%)

407 (65.2%)

0.67

Site of metastasis


Liver only

665 (39.9%)

226 (36.2%)

0.10

Lung only

128 (7.7%)

45 (7.2%)

0.70

Liver and lung only

178 (10.7%)

65 (10.4%)

0.85

All other sites

694 (41.7%)

290 (46.5%)

0.13

> 3 metastatic sites

138 (8.2%)

54 (8.7%)

0.38

KRAS testing

243 (14.6%)

87 (13.9%)

0.77

KRAS wild-type

145 (59.7%)

52 (59.8%)

0.96

Clinical trial participation

154 (9.2%)

44 (7.1%)

0.10


KRAS = Kirsten rat sarcoma viral oncogene homolog. * Data are number (%) of patients unless otherwise indicated. † P values calculated using χ2 tests.

2 Frequency of first-line, second-line and third-line chemotherapy, and regimens, by city versus rural residence


First-line treatment


Second-line treatment


Third-line treatment


Regimen

City

Rural

P

City

Rural

P

City

Rural

P


Total

933 (56.0%)

364 (58.3%)

0.32

217 (23.3%)*

82 (22.5%)*

0.78

94 (10.1%)*

34 (9.3%)*

0.69

Single-agent chemotherapy

271 (29.0%)

118 (32.4%)

0.23

58 (26.7%)

18 (22.0%)

0.40

21 (22.3%)

7 (20.6%)

0.83

Capecitabine

202

82

0.30

24

4


8

0


5-FU

58

31

0.29

3

3


4

1


Irinotecan

11

3


31

11


9

6


Oxaliplatin

0

2


Combination chemotherapy

629 (67.4%)

218 (59.9%)

0.01

115 (53.0%)

44 (53.7%)

0.92

49 (52.1%)

17 (50.0%)

0.83

FOLFOX

491

146

0.001

21

8


14

2


XELOX

53

50

< 0.001

15

4


8

2


FOLFIRI

76

18

0.12

62

26


15

7


XELIRI

1

0


1

2


2

2


MMC–5-FU or capecitabine

8

4


16

4


10

4


Other

33 (3.5%)

28 (7.7%)


44 (20.3%)

20 (24.4%)


24 (25.5%)

10 (29.4%)


Biological agent

221 (23.7%)

61 (16.8%)

0.007

97 (44.7%)

30 (36.6%)

0.21

72 (76.6%)

34 (100%)

0.003

Bevacizumab

185

52


60

22


16

14


EGFR mAb

15

5


26

8


52

19


Other

21

4


11

1


4

1


5-FU = 5-fluorouracil. FOLFOX = folinic acid–5-FU–oxaliplatin. XELOX = capecitabine–oxaliplatin. FOLFIRI = folinic acid–5-FU–irinotecan. XELIRI = capecitabine–irinotecan. MMC = mitomycin C. EGFR mAB = epidermal growth factor receptor monoclonal antibody. * Total rates of second-line and third-line chemotherapy use are expressed as a percentage of patients who received any chemotherapy. † Includes use of raltitrexed and MMC (as single agent and combination).

3 Frequency of non-chemotherapy treatments, by city versus rural residence

Treatment

City (n = 1665)

Rural (n = 624)

P


Lung resection

53 (3.2%)

13 (2.1%)

0.10

Hepatic resection

228 (13.7%)

72 (11.5%)

0.17

Surgery*

858 (51.5%)

345 (55.3%)

0.11

Ablation

12 (0.7%)

3 (0.5%)

0.53

Selective internal radiation therapy

10 (0.6%)

8 (1.3%)

0.10

Radiotherapy

299 (18.0%)

132 (21.2%)

0.08


* Includes resection of colorectal primary cancer.

4 Overall survival (OS) in city versus rural patients

Pathogeni-city

Mornings in cities in Australia and elsewhere are a microcosm of early 21st century urban lifestyle, in the making since at least the 19th century — streetscapes dominated by slow-moving cars and trucks, paths occupied by workers, smokers, snackers and runners, and cyclists negotiating traffic. This consumption-dense, movement-poor environment affects our health and our efforts to prevent and manage smoking, obesity and diabetes.

Smokers these days participate in what is increasingly an activity of the outcast — a far cry from the 1960s and 1970s, when (as recent television series remind us) smoking was integral to working and urban culture. Now, Australia’s plain packaging legislation is forcing out, at an individual level and a community level, an activity that shortens and worsens lives, and costs a great deal of money. In this issue, Daube and Chapman (doi: 10.5694/mja14.01026) spell out the clear downward impact that plain packaging has had on smoking rates. The effect is so obvious that simply presenting the facts and adhering to widely accepted editorial standards is all that is required to get the message out — qualities that The Australian doubtless aspires to as it passes its 50th birthday.

I bought and ate a very nice muffin on my way to work today, even though it was packaged very plainly and was not the product of a multinational muffin company. Tackling unhealthy eating clearly requires very different approaches. Nevertheless, as with smoking, putting primary responsibility on the consumer to “quit” unhealthy consumption is counterproductive. Instead, as suggested by Harris and Spooner (doi: 10.5694/mja14.00922) in their editorial on helping patients manage their weight in general practice, modifying a patient’s social environment is a valuable initial step. This can involve mobilising social support and implementing behavioural interventions. Specific dietary, medical and surgical interventions have a scope of use limited to patients with more severe obesity. Perhaps doctors, as part of their patients’ environment, should consider whether they themselves do what they ask their patients to do.

This environment has deep roots in the economics and organisation of modern society. Leeder and Downs (doi: 10.5694/mja14.00943) argue that many aspects of it are obesogenic — economic and commercial models of food production, a built environment discouraging healthier work and leisure, and a lack of public infrastructure to enable people to get about efficiently. Together, these conspire against weight control and better lives. It is too hard to cycle, walk or run along city streets, and too easy to stop and eat, because communities, cities and their food supply lack human scale and responsiveness to real needs. This makes primary care much harder.

Diabetes is one of the more visible manifestations of our current situation. But the threshold for intervention to reduce its development and complications is contestable, and particularly so for gestational diabetes. In two other articles, the authors argue that the most recent international and Australian guidelines, with lower threshold criteria for diagnosis, may result in overdiagnosis, overtreatment and attendant harms. Kevat and colleagues (doi: 10.5694/mja14.00099) highlight the increased risk of maternal hypoglycaemia from treatment, the potential to overlook other important aspects of maternal and fetal wellbeing, and medicolegal implications. D’Emden (doi: 10.5694/mja14.00277) points out that the additional people captured by the new criteria are women for whom risk of adverse neonatal outcomes has not been established.

But, looking beyond smoking, obesity and diabetes, the medical profession could also have a great impact by supporting people to have better health by advocating for a better environment. Doctors as “environmentalists”, perhaps — an idea that has been around since the time of Rudolf Virchow in the 19th century (J Urban Health 2003; 80: 523-524 http://www.ncbi.nlm.nih.gov/pmc/articles/PMC3456221/pdf/11524_2006_Article_252.pdf).

The G20, human health and sustainability: an interview with Jeffrey D Sachs

We must reinvigorate our sense of humanity, justice and foresight

Jeffrey Sachs is an American economist and Director of The Earth Institute, Quetelet Professor of Sustainable Development and Professor of Health Policy and Management at Columbia University. He is Special Adviser to United Nations Secretary-General Ban Ki-Moon on the Millennium Development Goals, having held the same position under former UN Secretary-General Kofi Annan. He is known as a commentator and advocate for the relief of poverty, the achievement of improved health in developing countries and for environmental sustainability. From 2000 to 2001, he chaired the World Health Organization Commission on Macroeconomics and Health, which made clear the linkage between health gain, relief of poverty and economic growth.

Sachs is author of The end of poverty: economic possibilities for our time (2005). His most recent book is To move the world: JFK’s quest for peace (2013).

He was interviewed by the Editor-in-Chief of the Medical Journal of Australia, Stephen Leeder, who worked with Sachs in New York in 2003–2004, about the upcoming G20 meeting in Brisbane, Australia, in November.

What is your primary message as an economist interested in the relief of poverty about sustainability and its relation to both economics and human health?

It is not possible to consider ending poverty in the midst of human-induced climate change. Even if poor countries, such as those in Africa, make some short-term progress in the fight against poverty, this progress will be overtaken by climate disruption. Africa already is suffering from food price shocks, famine, heatwaves, droughts and other extreme climate shocks. We’ve got to get real: fighting poverty and environmental degradation go hand in hand.

How could the upcoming G20 meetings in Brisbane be an important forum for consideration of the economics of sustainability?

The G20 countries are the world’s most important economies. They account for the lion’s share of global greenhouse gas emissions. If the G20 gets its house in order, the world can be saved. If not, the G20 will wreck the world, pure and simple. So what will it be? Will the richest and most powerful countries also be the most short-sighted, or will they understand that they hold not only their fate but the fate of humanity in their grasp? Brisbane is therefore crucial. The prospects are not bright. The Australian Government claims it is driven by science, but it seems to us on the outside that it is driven by mining interests, or by the likes of Rupert Murdoch, the world’s number one anti-science propagandist.

The G20 should acknowledge that 2015 is the most important year of diplomacy on sustainable development in at least 15 years. We have three mega-summits next year. The first is on Financing for Development, in Addis Ababa, Ethiopia, in July 2015. The next is on Sustainable Development Goals, at the UN headquarters in New York, in September 2015. The third is on climate change — the so-called COP21 [21st Conference of Parties] of the UN Framework Convention on Climate Change — in Paris in December 2015. The Brisbane G20 should help to prepare the world’s leading countries to be true forward-looking problem solvers during these three crucial summits next year.

Can the world still prevent runaway climate disaster?

Yes, but we’ve almost run out of time. In 2009, and again, 2010, the world’s governments agreed to fight to keep global warming below 2°C. Yet we are on a trajectory of 4–6°C by the end of this century. In fact, we could trigger runaway climate change, in which warming unleashes various feedback processes (such as the release of carbon dioxide from vegetation, soils and permafrost) that could lead to runaway climate disaster. That’s why the 2°C limit is also called a “guardrail” for the world: one that keeps us from spinning completely out of control.

So, to be more specific, can we still keep warming below 2°C?

Yes, just barely, if all major economies of the world begin to take very strong and consistent actions to decarbonise their national energy systems in three main ways: shifting to low-carbon electricity, moving from fossil fuels to electricity in vehicles and buildings, and massive gains of energy efficiency. A fourth main global pillar is to shift from deforestation to reforestation and to reduce emissions from agriculture. These transformations are deep, but they are feasible. And they will not only protect the climate but also boost prosperity if we apply our efforts and ingenuity to the effort. We are running out of our planet’s carbon budget — that is, the amount of carbon the world can burn and still remain below 2°C.

But do you see these transformations being achieved by economic reasoning alone?

No. A reinvigoration of a global moral code must also be a lifeline in the 21st century. Pope Francis is utterly correct and compelling when he speaks of the “globalisation of indifference”. We have lost our moral compass as a global society. The mass media, the cynicism of Murdoch and others, have crowded out decency, humanity, justice and foresight. Yet each of us wants our children and grandchildren to survive and to flourish. We each have an instinct, a moral fibre, to keep the world safe for the future and for each other. Yet we have to reinvigorate this morality, to overcome the immorality of greed and power that drive our societies today.

At a time when our societies have unprecedented technological capacity in hand to end extreme poverty, a billion people worldwide are chronically hungry and destitute; in a period when health care technology enjoys astounding advances, 6 million children under the age of 5 worldwide still die each year of utterly preventable causes; and in an era when sustainable technologies for energy, industry, buildings and transport could reign in climate change, the world rushes headlong towards climate catastrophe — our attitudes and moral judgements will be the most important determinants of our fate, not our resources or our capacities.

At this stage of history, humanity is at a crossroads, with the future course of our own choosing. We have the technical means to solve our national and global problems — to banish poverty, fight disease, protect the environment, and train the illiterate and unskilled. But we can and will do so only if we care enough to mount the effort.

President John F Kennedy made the point compellingly a half-century ago. In his inaugural address in January 1961, he noted: “For man holds in his mortal hands the power to abolish all forms of human poverty and all forms of human life”. Two years later, on the quest for peace with the Soviet Union, J F K made the most essential point, the key reason for hope in peaceful problem solving, on poverty, climate change and the end of war itself:

So, let us not be blind to our differences — but let us also direct attention to our common interests and to the means by which those differences can be resolved. And if we cannot end now our differences, at least we can help make the world safe for diversity. For, in the final analysis, our most basic common link is that we all inhabit this small planet. We all breathe the same air. We all cherish our children’s future. And we are all mortal.

Indigenous health: radical hope or groundhog day?

Professor Ernest Hunter explains why learning from the past and investing strategically will have the best chance of success

In his book Radical hope: education and equality in Australia, Aboriginal lawyer, academic and land rights activist Noel Pearson contends:

Governments and their bureaucracies are informed by everything other than memory of what was done five years ago, ten years ago and eighteen years ago. Politics are remembered, policies are not.1

It also includes his 2004 Judith Wright Memorial Lecture, in which, reflecting on the political forces necessary to drive national change in Indigenous affairs, he notes:

it will take a prime minister in the mould of Tony Abbott to lead the nation to settle the “unfinished business” between settler Australians and the other people who are members of this nation: the Indigenous people.1

A decade on, Tony Abbott, as Prime Minister, delivered the Closing the Gap report.2 Having identified that his government’s new engagements will involve centralising responsibility for Commonwealth-funded programs in the Department of the Prime Minister and Cabinet, setting up the Prime Minister’s Indigenous Advisory Council and fostering linkages between bureaucrats, business and Indigenous leaders, he details mixed outcomes across four key areas — health, education, employment and safe communities. The outcomes were consistent with the Closing the Gap Clearinghouse report released a year earlier,3 which identified key high-level principles and practices characterising programs that worked: flexibility to meet local needs and contexts; community involvement and engagement; building trust and relationships; a well trained and resourced workforce; and continuity and coordination. Themes associated with less successful initiatives included: programs implemented in isolation; short-term funding and high staff turnover; lack of cultural safety; and inflexible program delivery. Similar issues emerged in a recent review of early childhood parenting, education and health intervention programs.4

Clinicians working in remote Australia will not be surprised. There have been health gains, but they are uneven: remote Indigenous Australia is clearly behind. Furthermore, it can be argued that for some conditions and in some areas the situation is worse despite significant clinical investments. For instance, when I began work as a psychiatrist in Cape York and the Torres Strait over 20 years ago, there were no mental health or substance misuse services. Now there are well over 100 workers across Queensland Health, Education Queensland, the Royal Flying Doctor Service, Medicare Locals, community-controlled services and Commonwealth-funded programs, plus contracted private clinicians. This does not include the dozens of residents trained variously in community and personal wellbeing, empowerment, mental health literacy, suicide prevention and more. Sadly, the situation in terms of mental illness is worse, probably reflecting both contemporary social contexts and delayed effects of neurodevelopmental adversity.5,6

Our understanding of the developmental determinants of chronic disease in Indigenous Australians has been evolving for more than half a century7 and there is accumulating evidence on childhood social factors increasing the risk of adult-onset mental disorders. For example, bereavement stress in mothers during the first years of life (particularly after suicide in the family) increases the risk of affective psychosis.8 Research on such topics involves controlling for potential confounders. In the real world of remote Indigenous communities, many children are exposed to serial adversity: pregnancies affected by high levels of stress; poor nutrition and inadequate antenatal care; prematurity; infant environmental instability and attachment difficulties; hospitalisation and other forms of separation from caregivers; bereavement stress; exposure to violence; early-onset substance misuse; and more. We can only presume that the consequences of such risk amplification will be substantial.

In 2006, soon after Pearson commended him, Tony Abbott called for a new form of “paternalism” that would be “based on competence rather than race” to address unrelenting Indigenous health problems associated with failed past policies such as self-determination.9 Now, he holds the reins. But whatever happens, the economic agenda will weigh heavily; Indigenous Australians will not be quarantined from budget cuts, changes to Medicare and welfare entitlements, privatisation, and the continuing feud between federal and state governments over health funding. In Queensland, public sector services (particularly population health and health promotion) sustained dramatic losses in the 2012–13 financial year that will be most consequential for remote Indigenous communities. Career public sector employees are giving way to locums, casual workers, agency nurses and project workers funded by non-government organisations. While this may bring new ideas, it risks losing domain knowledge and incremental improvement based on practice-based evidence.10

While there is no doubt that greater economic self-reliance will be critical to Indigenous futures, I believe that there is complacency regarding the flow-on effects of the contraction of federal and state public sectors for Indigenous health in remote Australia. Indeed, to support self-reliance in the long term, it is critical that we increase and sustain strategic investment in public health and clinical programs for pregnancy and early childhood to optimise neurodevelopmental potential. Is it “radical hope” to suppose that the new paternalism and new engagements will deliver? Or, as Pearson suggests in his chapter on cycles of policy reinvention in Indigenous affairs, will it be groundhog day?

Acellular pertussis vaccine effectiveness for children during the 2009–2010 pertussis epidemic in Queensland

In Queensland, 2009 and 2010 were epidemic years for pertussis. New patterns of disease emerged, with particularly high rates of pertussis notification for those aged 6 – < 12 years despite high primary course and booster vaccine coverage for more than a decade. A similar disease pattern was observed in California.1 Evidence from Qld,2 California36 and Oregon7 indicates that changing from whole-cell to acellular pertussis vaccine in the late 1990s8,9 contributed to recent pertussis epidemiology. In Qld and Northern California, the highest notification rates during 2010 occurred in the first birth cohorts to receive acellular pertussis vaccine. North American studies describe rapid waning of protection following a five-dose course of acellular pertussis vaccine.4,5,10 Data from Qld2 and Oregon7 showed a primary course of whole-cell vaccine, or at least the first dose of the primary course being whole-cell vaccine, provided significantly greater protection against pertussis than priming with acellular pertussis vaccine alone. These findings are supported by earlier work from Canada, which suggests that the median time until disease following the most recent vaccine dose may be shorter in children who receive acellular pertussis vaccine compared with children who receive whole-cell pertussis vaccine.11

Pertussis vaccination is available to children as part of the publicly funded National Immunisation Program.8 Due to adverse events associated with the whole-cell pertussis vaccine,12 acellular pertussis vaccine was introduced into the National Immunisation Program in 1997. The acellular vaccine (principally the three-component type) completely replaced the whole-cell vaccine by 1999 (Appendix 1).8

We sought to assess the effectiveness of acellular pertussis vaccine during 2009 and 2010 in Qld. Recognising the potential influence that changes in testing patterns may have on pertussis notification rates and vaccine effectiveness (VE) estimates,13 we also investigated pertussis notification rates between 2008 and 2010 and laboratory testing patterns during 2009 and 2010 for Qld children.

Methods

Notification and testing patterns

We obtained confirmed pertussis notification data from the Qld notifiable diseases database and calculated annual age-specific notification rates for children aged 1 – < 12 years between 2008 and 2010. According to the national guidelines, pertussis case confirmation requires one of the following: definitive laboratory evidence; suggestive laboratory evidence and clinical evidence; or clinical evidence and epidemiological evidence.14

Definitive laboratory evidence consists of Bordetella pertussis isolation by culture or detection via a nucleic acid amplification test, such as a polymerase chain reaction (PCR) assay. Suggestive laboratory evidence is most commonly met by identifying a single high serum IgA titre to pertussis antigens or evidence of seroconversion. Clinical evidence for confirmed cases requires a coughing illness lasting ≥ 2 weeks or one of the following: coughing paroxysms, inspiratory whoop or post-tussive vomiting. Epidemiological evidence consists of contact between two people at a time when one of them is likely to be infectious and the other becomes symptomatic 6–20 days later, with at least one case in the chain of epidemiologically linked cases having been being confirmed with suggestive or definitive laboratory evidence.

Two major Qld pathology providers — Pathology Queensland, the publicly funded laboratory service, and Sullivan Nicolaides Pathology, a private company — provided data on pertussis serological tests and PCR assays undertaken at their laboratories in 2009 and 2010 for Qld residents. These providers were responsible for about 40% of pertussis notifications in Qld during the study period. We did not include culture results to determine pertussis testing patterns because culture was performed infrequently and mostly on specimens also tested by PCR. We describe the numbers of serological and PCR tests, and the results of these tests, by age and year of test for children aged 1 – < 12 years.

Pertussis vaccine schedule and vaccine effectiveness

We calculated estimates of acellular pertussis VE against pertussis notification and hospitalisation in 2009 and 2010. To restrict the analysis to children who exclusively received acellular pertussis vaccine, only those residing in Qld and born in 1999 or later were included. We excluded second notifications or hospitalisations that occurred in the same individual during the same calendar year. We retrieved data on hospitalisations with a pertussis code in any diagnostic field from all Qld public and private hospitals.15 Due to small admission numbers, VE against hospitalisation was only calculated for children aged 1 – < 4 years as a single age group.

Changes in the acellular pertussis vaccine type and schedule delivered to Qld children during the study period included removing the 18-month booster dose in 2003 and introducing an adolescent booster dose in 2004 (Appendix 1). Children were considered fully vaccinated if they had received the recommended number of pertussis-containing vaccines for their age according to the schedule at the time. This meant that children in the 2006–2008, 2002–2004 and 1999–2001 birth cohorts were considered fully vaccinated if they had received three doses (primary course only), four doses (primary course plus 4-year booster) and five doses (primary course plus 18-month and 4-year boosters), respectively.

VE was calculated using the screening method, which involves comparing the proportion vaccinated among people who had a case of disease (PCV) with the proportion of the study population that is vaccinated (PPV).16 We obtained the vaccination status of patients who had a case of pertussis from Queensland Health’s Vaccination Information and Vaccination Administration System. As this register does not include children who have not received any vaccines, we obtained aggregated population coverage data for Qld for each birth cohort from the national, population-based Australian Childhood Immunisation Register (ACIR). Vaccinations recorded < 2 weeks before illness onset were excluded from calculations. The “third-dose assumption” was used in all VE calculations — children are assumed to have received the first two doses of a three-dose course if their third dose is recorded. The validity of this assumption has been demonstrated for the ACIR.17 Partially vaccinated children were excluded from PCV and PPV calculations. VE was not calculated for children aged < 1 or 4 – < 5 years as their vaccination status changed during the period of analysis due to receipt of the primary course or 4-year booster.

VE estimates and 95% confidence intervals were obtained by fitting logistic regression models with the outcome variable as the vaccination status of the patient with pertussis and offset for the logit of PPV.16 We fitted constant-only models for each stratum of birth cohort and notification year. When estimating the association between birth cohort and VE, we included birth cohort as a main effect. Sensitivity analyses on diagnostic method (notified cases confirmed by PCR or culture versus all notified cases) and hospital coding (hospitalisations with a pertussis code listed as the principal diagnosis versus hospitalisations with a pertussis code in any diagnostic field) were performed. Stata version 12 (StataCorp) was used for the analysis.

Ethics approval

The Human Research Ethics Committee of Children’s Health Services, Queensland Health, approved this study.

Results

Epidemiology

Pertussis notification rates increased substantially in 2009 and 2010 from pre-epidemic 2008 levels. The highest rates were in 2010, for children aged 7 – < 11 years (Box 1).

Testing patterns

The numbers of pertussis tests performed and relative contribution of PCR tests for children aged 1 – < 12 years increased between 2009 and 2010 (Box 2). The proportions of PCR tests with a positive result were highest in the older children and increased in children aged 6 – < 12 years between 2009 and 2010 (Box 2). The proportions of serological tests with a positive result were lower, but followed a similar pattern to that for the PCR tests (Box 2).

Vaccine effectiveness

In total, 1961 pertussis notifications and 29 pertussis hospitalisations were included in the VE calculations (Appendix 2).

Notifications

In 2009, point estimates of three-dose primary course VE against pertussis notification were 87.0% and 89.4% for the 2007 and 2006 birth cohorts, respectively, similar to that for preventing hospitalisation (87.1%) (Box 3; Appendix 3). Point estimates of VE for children aged 5 – < 11 years — who should have received the primary-course, 4-year booster and largely also the 18-month booster — ranged from 71.2% in the 2000 birth cohort to 87.7% in the 2003 birth cohort.

In 2010, point estimates of three-dose primary course VE against pertussis notification remained high (83.5% and 85.4% for the 2008 and 2007 birth cohorts, respectively) (Box 3; Appendix 3). Point estimates of VE were lower for children aged 5 – < 12 years in 2010 compared with those for children aged 5 – < 11 years in 2009. Among these older cohorts, 2010 VE point estimates ranged between 55.3% and 70.3%, with the exception of the 2002 cohort, which had a VE estimate of 34.7%. VE against pertussis notification waned with increasing age in 2009 (P = 0.006) and 2010 (P < 0.001).

Restricting the analysis to notified cases that were cases confirmed by PCR or culture, all 2009 VE point estimates and a majority of 2010 VE estimates changed by six or fewer percentage points, and no overall consistent pattern emerged (Box 3). However, VE point estimates for several birth cohorts were substantially lower in 2010 for cases confirmed by PCR or culture. The trend of waning VE with age remained significant among cases confirmed by PCR or culture (P = 0.001 for 2009; P < 0.001 for 2010).

Hospitalisations

For children aged 1 – < 4 years, the VE estimates for the three-dose primary course against hospitalisation were 87.1% and 85.6% in 2009 and 2010, respectively (Box 3). Restricting the analysis to hospitalisations with a pertussis code in the principal diagnoses field yielded similar results.

Discussion

The primary course of acellular pertussis vaccine was highly effective in protecting children aged 1 – < 4 years against pertussis notification and hospitalisation in Qld during the epidemic years of 2009 and 2010. Our VE estimates are similar to findings for predominantly whole-cell pertussis vaccine in the late 1990s in New South Wales, where VE was 85% for children aged 2 – < 5 years.18

However, our findings indicate that protection waned with increasing age following receipt of the 4-year booster and are consistent with the waning protection observed in the United States.4,5,10 The decline in point estimates for VE against notification in 2009, from 88% in children aged 5 – < 7 years to 71% and 80% among children aged 8 – < 10 and 9 – < 11 years, respectively, is similar to 2010 findings from California, where VE progressively declined from 95% for children 1 – < 2 years after their fifth pertussis vaccine dose to 71% for children ≥ 5 years after their fifth pertussis vaccine dose (recommended to be given at age 4–6 years).5 Overall, higher VE estimates were found for the whole-cell pertussis vaccine in NSW between 1996 and 1998 — 87% for children aged 5 – < 9 years and 78% for children aged 9 – < 14 years.18 This is consistent with evidence showing that the whole-cell vaccine used previously in Australia provided greater duration of protection against pertussis than the acellular vaccine.2 Despite the waning protection provided by acellular pertussis vaccine, we should ensure that high coverage with current vaccines is maintained until low-reactogenic vaccines providing sustained high-level protection against pertussis are developed.

As the screening method is very sensitive to small changes in coverage estimates, the accuracy of PPV estimates is important. Our study benefited from obtaining PPV values from the ACIR, which registers about 99% of Australian children by 12 months of age.19 Previous validation of ACIR data indicates that the most likely inaccuracy is that PPV will be underestimated,20 which, in isolation, may result in underestimating VE. A limitation affecting our study is that in the context of very high vaccination coverage, modest changes in PCV can lead to marked changes in VE estimates. Due to regional variation in immunisation coverage (estimated to be largely < 2%), our lack of geographical stratification may have biased statewide VE estimates in either direction. In addition, the small numbers of hospitalisations provide low precision for VE estimates against severe disease. The value of this method is in providing a broad overview of VE and changes in VE over time.21

In our study, VE point estimates were lower for 2010 compared with 2009, particularly among the older age groups. We are unable to explain the isolated low VE point estimate of 35% in 2010 among children born in 2002. While there is evidence of increasing circulation of vaccine-mismatched strains,22 we believe vaccine-driven selection pressure is unlikely to account for such rapid and uneven changes in VE estimates between 2009 and 2010, as this would require circulating pertussis strains to vary with childhood age group and change very rapidly over time.

Changes in diagnostic testing behaviour, owing to expanded availability and increased awareness of PCR testing,13 may have contributed to decreased VE estimates in 2010 compared with 2009. While we cannot be certain of the generalisability of the laboratory data that we used, they are probably broadly representative of pertussis testing in Qld because they accounted for about 40% of statewide pertussis notifications. Based on our data, use of the more sensitive, less invasive PCR assays for pertussis testing has increased rapidly in Qld. Before the widespread availability of PCR assays, clinicians may have been less likely to seek laboratory confirmation involving venepuncture, particularly for milder illness in children. Publicity about pertussis during the epidemic may have increased pertussis testing requests by clinicians; a recent study showed an almost 40% increase in testing between April 2009 to March 2010 and April 2010 to March 2011.23

Increases in awareness, testing and detection of milder disease, and the possibility that the vaccine may be less effective against milder disease, may have resulted in decreases in VE estimates.24 It may be hypothesised that through differential health care use, older children may be less likely to have milder disease diagnosed, leading to relatively high and stable VE estimates. However, point VE estimates among older children were substantially lower in 2010 compared with 2009. Increased testing is likely to have contributed substantially to high notification rates during the epidemic. However, the high and increasing proportion of pertussis tests with a positive result between 2009 and 2010 in older children suggests that the disease burden was truly greatest and increasing in 2010 among children aged 6 – < 12 years, consistent with notification patterns and waning protection following a four- or five-dose acellular vaccine course. A likely consequence of increased pertussis incidence among older children is increased transmission, which will have the greatest impact on infants.

In the era of predominant PCR use and heightened awareness, pertussis notification rates even during non-epidemic periods are likely to be substantially higher, and VE estimates for preventing notification may be consistently lower than recorded previously. This change in testing behaviour, leading to identification of milder disease, may require a recalibration of what are considered baseline notification rates and will need to be considered when interpreting future VE estimates.

1 Age-specific pertussis notification rates, Queensland, 2008–2010

2 Numbers of pertussis serological and polymerase chain reaction (PCR) tests by Queensland Health and Sullivan Nicolaides Pathology laboratories, and proportions with a positive result, for children aged 1 – < 12 years in 2009 and 2010, Queensland

3 Vaccine coverage and vaccine effectiveness (VE) against pertussis notification and hospitalisation using the “third-dose assumption” for children aged 1 – < 12 years in 2009 and 2010, Queensland, by birth cohort*

Notifications

Birth cohort

Age,
years

Course used to assess VE

PCV
for all cases

PCV for PCR-positive and culture-positive cases

PPV

VE (95% CI)
for all cases

VE (95% CI)
for PCR-positive
and culture-positive cases


2009 notifications

2007

1 – < 3

3 doses

74.6% (50/67)

71.4% (40/56)

95.8%

87.0% (77.5% to 92.5%)

89.0% (80.3% to 93.8%)

2006

2 – < 4

3 doses

71.8% (56/78)

66.7% (42/63)

96.0%

89.4% (82.6% to 93.5%)

91.7% (85.9% to 95.1%)

2003

5 – < 7

4 doses

73.6% (64/87)

73.9% (51/69)

95.8%

87.7% (80.1% to 92.3%)

87.4% (78.5% to 92.7%)

2002§

6 – < 8

4 doses

81.6% (71/87)

80.6% (50/62)

94.8%

75.5% (57.8% to 85.7%)

77.0% (56.7% to 87.8%)

2001

7 – < 9

5 doses

77.4% (82/106)

75.7% (56/74)

94.5%

80.3% (68.9% to 87.5%)

82.0% (69.4% to 89.4%)

2000

8 – < 10

5 doses

83.9% (78/93)

86.0% (49/57)

94.7%

71.2% (49.9% to 83.4%)

66.0% (28.3% to 83.9%)

1999

9 – < 11

5 doses

77.8% (63/81)

79.5% (35/44)

94.7%

80.3% (66.7% to 88.3%)

78.1% (54.5% to 89.5%)

2010 notifications

2008

1 – < 3

3 doses

80.2% (93/116)

84.2% (80/95)

96.1%

83.5% (73.9% to 89.5%)

78.2% (62.1% to 87.4%)

2007

2 – < 4

3 doses

78.0% (92/118)

76.6% (72/94)

96.0%

85.4% (77.5% to 90.6%)

86.5% (78.3% to 91.6%)

2004

5 – < 7

4 doses

86.2% (131/152)

88.1% (104/118)

95.5%

70.3% (53.0% to 81.3%)

64.7% (38.3% to 79.8%)

2003

6 – < 8

4 doses

86.1% (149/173)

86.2% (119/138)

95.0%

67.3% (49.6% to 78.7%)

67.0% (46.4% to 79.7%)

2002§

7 – < 9

4 doses

91.7% (189/206)

94.9% (148/156)

94.5%

34.7% ( 7.2% to 60.3%)

8.6% ( 121.2% to 46.7%)

2001

8 – < 10

5 doses

88.6% (164/185)

90.8% (119/131)

94.6%

55.3% (29.6% to 71.6%)

43.3% ( 2.7% to 68.7%)

2000

9 – < 11

5 doses

88.7% (205/231)

90.4% (142/157)

94.7%

56.2% (34.2% to 70.9%)

47.5% (10.6% to 69.1%)

1999

10 – < 12

5 doses

88.4% (160/181)

86.8% (118/136)

94.7%

57.1% (32.4% to 72.8%)

63.1% (39.4% to 77.5%)

Hospitalisations


Birth cohort

Age,
years

Course used to assess VE

PCV
for all cases

PCV for principal diagnosis cases

PPV

VE (95% CI)
for all cases

VE (95% CI)
for principal diagnosis cases


2009 hospitalisations

2006–2007

1 – < 4

3 doses

75.0% (15/20)

66.7% (10/15)

95.9%

87.1% (65.6% to 95.3%)

91.4% (74.9% to 97.1%)

2010 hospitalisations

2007–2008

1 – < 4

3 doses

77.8% (7/9)

77.8% (7/9)

96.1%

85.6% (30.9% to 97.0%)

85.6% (30.9% to 97.0%)


PCR = polymerase chain reaction. PCV = proportion vaccinated among people who had a case of pertussis. PPV = proportion of study population that is vaccinated.

* VE not calculated for children < 1 year of age in 2009 and 2010, and for the birth cohorts of 2004–2005 in 2009 and 2005–2006 in 2010, as the vaccination status of these cohorts was changing during the period of analysis due to receipt of either their primary course or 4-year booster.

Data are percentage (number fully vaccinated/total). Fully vaccinated is defined as: receipt of third dose for 2006–2008 birth cohorts; receipt of third dose and 4-year booster for 2002 and 2003 birth cohorts; and receipt of third dose, 18-month booster and 4-year booster for 1999–2001 birth cohorts. Total is defined as: number of fully vaccinated children who had a case of pertussis plus number of unvaccinated children who had a case of pertussis.

PPV values were obtained from the Australian Childhood Immunisation Register; they were calculated by dividing numbers of fully vaccinated children in each birth cohort by total number of fully vaccinated and unvaccinated children in each birth cohort.

§ About one-quarter of this cohort was eligible for the 18-month booster.

Principal diagnosis cases are those in which a pertussis code was listed in the principal diagnosis field.