×

Empowering clinicians to address the global challenge of trauma: an example from Myanmar

Investment in clinicians and in hospitals can trigger wholesale change in thinking about health systems

Runner-up — Medical practitioner category

No one had thought to resuscitate him; shocked, hypoxic and drowsy as he was. This Myanmar Delta fisherman had been left alone with his obstructed airway and bleeding, bilateral compound femoral fractures. Hours earlier, he’d fallen from his boat and under the blades of the outboard motor. Dragged out of the water by his comrades, he didn’t receive any first aid and the local clinic care was woefully inadequate. Even at the national trauma hospital in Yangon, the fisherman lay unattended and neglected in the emergency receiving area.

He didn’t receive essential trauma care until we arrived: a team of doctors training to be Myanmar’s first emergency specialists and me, as their tutor. He needed simple airway support, oxygen, intravenous fluids for shock, pressure and immobilisation for his fractures, antibiotics and some pain relief. Not complicated, not expensive, but perhaps too late.

Fast forward 2 years, for that was in 2013, and I’m impressed by the rapid response to another trauma patient. She’s been hit by a car and has severe facial injuries and a tense, swollen abdomen. This time I’m an observer at the Myanmar hospital, visiting my former students who are now leading the care. The team have assembled around the patient in the dedicated resuscitation space of the newly renovated emergency department. She receives simple but effective interventions that stabilise her until the surgeons, called urgently to assist, can take her to theatre.

These are stories of trauma and clinical care. In Myanmar, injuries, primarily from road traffic accidents, remain the leading cause of morbidity and the second highest cause of death. Like other low-income countries, the burden of trauma falls heavily on the young and productive. In Myanmar, and elsewhere, death and disability from trauma have long been unacknowledged by local and global health authorities whose focus is on Millennium Development Goals priorities.

Clinical care of injured patients in low-income countries is substandard or absent. Health systems are weak and underfunded. Crowded, dirty hospitals are perceived as places of death and infection; people don’t trust them to provide emergency care. For donors and funders, hospitals are unsustainable drains on limited resources. An Australian Government aid official told me recently that hospitals are “expensive luxuries” that are not on any global health agenda.

Yet, my experience in Myanmar suggests that investment in clinicians and in hospitals, as critical places of care, can trigger wholesale change in thinking about health systems and health advocacy. Further, given future Sustainable Development Goals targets that aim to reduce death from road traffic accidents, much more attention to clinical care, hospitals and clinicians will be required.

What has been behind the transformation taking place in Myanmar? The examples given above are of life-saving improvements in emergency care, but it’s more than that. In Myanmar, the program that is reducing death and disability from trauma — and any other acute and urgent condition — has expanded from training staff to hospital renovation, introducing acute care systems (such as pre-hospital care and triage), changing legislation and educating the public. Where and how were the seeds sown for this type of change?

One starting point, and perhaps a symbol of the importance of empowering clinicians, is the Primary Trauma Care (PTC) course. Introduced in Yangon in 2009 in the aftermath of Cyclone Nargis, PTC is a 2-day course that aims to train front-line staff with the skills, knowledge and attitude for preventing death and disability in the seriously injured patient. Designed specifically for underdeveloped and low-resource areas, PTC exists under the auspices of a non-for-profit Foundation based in Oxford, United Kingdom (http://www.primarytraumacare.org). It’s free, adaptable to any context and empowers local clinicians to teach the PTC principles in their own environments. First launched in Fiji in 1997, the course is now being taught in over 70 countries and is thriving in parts of Africa, the Middle East and Central America. In the Pacific region (where I’ve also taught), PTC is known as a “gospel message”; it is bringing new vision, new language and new actions to previously limited clinical environments.

After our inaugural PTC course in Myanmar, a young orthopaedic doctor went back to his rural district hospital and mobilised his colleagues and hospital administrators. He sourced funding to renovate and equip a room in the old hospital “receiving area” to provide a safe and effective environment to care for emergency trauma victims. He taught his staff the PTC principles and practised teamwork through simulated trauma scenarios. Six years later, this doctor is now a leader of emergency medicine in the country. He’s meeting government authorities to discuss the national roll-out of acute and trauma care standards, participating in workshops to introduce a coordinated pre-hospital system, making plans for road safety and injury prevention campaigns, and providing good quality clinical care in his well designed, functional emergency department. This doctor was part of our team who tried to save the life of the Myanmar Delta fisherman.

The work to establish these clinical and health system improvements in Myanmar has been substantial, and not just about a short trauma skills course. Supported mostly through a network of volunteers from Australia and Hong Kong, Myanmar doctors and nurses have been trained and empowered to provide better clinical care in superior clinical environments and become national leaders in acute health care.

These Myanmar clinicians already had the vision and drive for change. The PTC course has been a catalyst to realise their desire for improvement. It is a tool that starts with the clinical, then inspires broader thinking about environments and systems of care, and then even the health status of the population. This “clinical to public health” cascade has brought about substantial health improvements in other national contexts. For trauma, the front-line clinicians dealing with injuries agitated for seatbelts, speed limits and helmets.

Investment in clinicians and their hospitals is a priority in order to achieve the right balance between clinical medicine and public health for an effective response to the global challenge of trauma.

Clinicians have often been the “outsiders” in the global health discourse. In low-income countries, they are exhausted and overwhelmed by the service provision needs of their communities. Working their guts out day after day, they often view public health authorities with suspicion. Likewise, the authorities perceive clinicians as somehow less worthy, excluding them from funding sources and health improvement programs. This is a false and harmful division. Public health needs clinical service in order to provide an effective health system and prevent unnecessary death and disability. People need hospitals that they can trust to deliver safe and effective clinical care in order to inculcate confidence in their health system for times of increased need. As the Myanmar example shows, given support, a network and a few simple tools (like the PTC), clinicians can address the global challenge of trauma and become the strongest advocates for public health and health systems improvements.

Upstream or downstream?

The river analogy helps describe the health continuum from prevention to treatment

Winner — Medical student category

When I first looked at a map of Alice Springs, the ephemeral Todd River was marked as a deceptive blue snake, winding its way through the centre of town. For the local Arrernte people, the river is known as Lhere Mparntwe. In my head, I pictured a desert oasis, brown-skinned children gleaming with sun and water, screaming with glee as they plunged from rope swings into the cool river water. During my first week in Alice, somebody told me that it’s only after you have seen the river flow three times that you can be considered a local. The rest of the time it is just a dusty creek bed, filled with the soft rusty sand that has now found its way into almost every item that I own.

In public health, there is the concept of “upstream” and “downstream” factors. The analogy of the river is used to describe how pre-existing social, cultural, financial, environmental and historical factors ultimately go on to influence health outcomes in a profound way.1

The children’s ward at Alice Springs Hospital is busy. The nurses exasperatedly chase a young boy down the corridor. This pint-sized patient is surprisingly speedy as he makes his naked bid for freedom. A happy little boy and exceptionally cute, this child has quickly become a favourite of mine. It’s close to a month since he was first admitted for ongoing weight loss on a background of acute gastroenteritis. He has had chronic diarrhoea since he’s been here, his stool best described as a microbiological zoo. His small body has been bombarded with every antibacterial, antifungal and antiparasitic agent we have. His poor gut is so damaged from his numerous recurrent infections that it’s essentially no more than a slippery dip. It’s difficult for him to absorb any nutrients from his food, and we desperately need him to gain weight so his body and brain can grow.

In the treatment room Bananas in Pyjamas is playing. The room is crowded. In between the paediatrician, two nurses, the surgical registrar, mum and a writhing, screaming patient, there are bubbles. So many bubbles. The young surgical trainee gingerly examines the numerous boils that cover the little girl’s legs and groin. They will require an operation to drain them. She too has been with us for a week already. Her kidneys are struggling, after her body mounted an autoimmune reaction to the streptococcal infection from the boils. We closely monitor her weight and blood pressure until her kidneys are out of the woods.

The diabetes educator and paediatrician discuss a 13-year-old girl, who has just been diagnosed with type 2 diabetes mellitus. Already she weighs over 100 kg. Her case being outside the realm of conventional paediatric practice, the paediatrician is seeking advice on the best management plan for this patient. The girl’s mother, in her 30s, already suffers from retinopathy from her diabetes. One of the challenges of managing type 2 diabetes in an adolescent is the general lack of evidence to inform practice. It’s simply too new a phenomenon. The evidence to inform the management of type 2 diabetes in an Indigenous child is virtually non-existent.

At the hospital, we are so far downstream that we are practically out to sea. Essentially, we patch the kids up, keep them from dying, and make an attempt at educating the child’s parents about what has happened and why. It is grossly inadequate when almost everything that we see is preventable.

How is it then, in a wealthy nation like Australia which boasts a universal health system that is arguably one of the best in the world, that the life expectancy of Indigenous Australians is still (at a conservative estimate) 10–17 years less than their non-Indigenous counterparts? Why do the babies of Aboriginal mothers die at more than twice the rate of non-Aboriginal mothers? Why are so many remote communities still plagued by poor hygiene, overcrowding and dysfunctional living conditions, condemning their inhabitants to lifelong chronic disease? To me, it’s incomprehensible.

The instinct of many is to blame the individual. I know that I am often tempted to do so, especially when you see children who are suffering. However, blaming or inducing guilt is counterproductive. It does not help anyone. If anything, it alienates and denigrates. It is simply not correct to suggest that a person engages in certain behaviours by “choice”, and choice alone. It is too simplistic. To do so ignores the fact that every individual is a member of a community and is shaped by that community, his or her environment, education, and a personal and collective history.

To date, many health promotion programs have made a grossly inaccurate assumption that health education will automatically translate to behaviour change. It’s the same flawed logic that tells me I should floss daily and do at least 30 minutes of moderate-to-vigorous physical activity each day. Does knowledge alone empower me to change my behaviour? Sometimes it can, but only when the environment allows. Can I prevent my children from getting scabies when 15 people live in my home, multiple people share mattresses and I don’t have running water in the house, let alone a washing machine? Unlikely.

There is no strategic plan or coordination between services to promote hygiene improvement in remote communities.2 The social determinants of health have been ignored or, at the very least, addressed in a piecemeal manner. Public servants in air-conditioned offices write hygiene promotion strategies that fail to address the functional state of housing infrastructure and the unique environmental conditions of remote communities. Obesity and micronutrient deficiency in remote communities is a direct result of food insecurity caused by low incomes and the high price of fresh, nutritious food. This is unlikely to ever be overcome as long as local stores (often the sole providers of food in remote communities) continue to be viewed as a small business, rather than an essential service such as health or education.3 The past and continuing erosion of Indigenous culture and language serves only to perpetuate the vicious cycle of poverty and poor health.4

Government departments are often only as far apart as a different floor in the same building, yet the level of communication and collaboration between departments would suggest there is in fact a chasm between them. Multisector collaboration and high-level engagement and partnership with Indigenous peoples are the only hope we have to “close the gap”.

Good health is not made in hospitals. Good health is made by the food we eat, the water we drink, by feeling safe, secure, loved and connected. It is the roof over our heads, our sense of purpose in the world. Education is not just power, but health too. It is health, not illness that I am passionate about. I need to be further upstream. Maybe I need to see the Todd River flow.

 –


The Todd River, Alice Springs. Photo taken in March 2015.

Malnutrition: a global health perspective from a Timorese mountain

Malnutrition is an unacceptably prevalent and preventable global scourge

Winner — Medical practitioner category

Her name was Rosa and she hailed from a small rural hamlet about 6 hours’ “drive” from Dili in Timor-Leste, as the snaking, boulder-choked mountain pass permitted no more than a crawl past the rusted chassis and blown tires dotting the unforgiving terrain.

Rosa’s story typified so many of Timor-Leste’s young. A 6-year-old girl from a remote subsistence village, she presented to our outreach clinic simply hungry. The rudimentarily performed anthropometry and growth charting was arresting, but then so are national statistics. According to UNICEF, malnutrition is despairingly rife in Timor-Leste. About 58% of children are stunted, 19% severely malnourished with endemic micronutrient deficiency, with poorer outcomes still for rural dwellers. To benchmark, malnutrition in Timor-Leste eclipses that of Ethiopia and Malawi, traditional purveyors of poster-children for global hunger.

Surprising, then, that this mountainous district and Timor-Leste at large are not bedevilled by drought or infertility; rather the contrary. The causes of malnutrition are thus manifold and complex. They offer an instructive and galvanising tale on the merits and methods of combining clinical and global health responses to combat global malnutrition. In Timor, the Ministry of Health cites a panoply of local contributors, many transferable to the Global South at large: the abiding and disruptive legacy of war/decolonisation; extreme poverty with attendant low agricultural productivity and capital investment; overemphasis on staple mono-cropping (eg, rice) with reduced agricultural diversity/resilience; underresourced and inaccessible health services; inadequate sanitation, food hygiene and clean water; population pressures; insufficient public education regarding nutrition; and degradation of ecosystem services underpinning food production.

Malnutrition in Timor (and globally) represents the intersection of multiple demographic, agricultural, economic, ecological and political forces. It is foremost the preserve of the clinician to attend to malnutrition within the medical paradigm; that is, triaging at-risk populations, diagnosing individual cases, intervening early with nutritional supplementation, and serial monitoring to assess effectiveness. However, the contemporary clinician must also be cognisant of “big picture drivers” behind “small picture disease”. Working in concert with population-based public health approaches in sometimes unfamiliar disciplines with implications for malnutrition will yield the profoundest dividend. To this end, an approach that enjoins public health programs and clinicians in the four components of the food security equation is potentially gainful in addressing malnutrition; namely, the adequacy, availability, utilisation and security/sustainability of food supplies.

Adequacy of food is rightly the starting point for malnutrition. Targeted public health interventions can helpfully augment the argument for reform by entering the discourse on 1) local/international market integration; 2) education for farmers regarding sustainable agriculture; 3) loss of arable land due to urban encroachment and erosive farming; 4) land tenure instability stymieing investment; 5) loss of youth interest in agriculture; 6) prohibitive investment climates; and 7) research and development in country-specific technology/methods to increase yield.

Second, public health and clinical responses might usefully assist with measures to render food more available. In Timor, like in much of the malnourished world, food, even if plentiful, is unavailable because of redistributive failure, poverty, market incentive for diversion and population pressure. Without adequate food hygiene, sanitation, refrigeration, road/rail networks and vehicle support, populations are confined to consuming what they can produce locally. Again, there is a role here for the public health professional and clinical outreach services to take opportunities to both agitate against and ameliorate infrastructure bottlenecks. Realistically, resource constraints are insurmountable and encouraging diversification to engender more self-sufficiency by remote communities, while preserving trade competitiveness in cash commodities, will help health outcomes. This is often (and understandably) limited by inducements for communities to divert arable land to cultivation of cash crops for Western markets; for example, the internal market in Timor for expatriates or, in Bolivia, international markets for traditional and highly nutritious superfood staples like quinoa.

This segues into another important dimension to the availability challenge, which should be part of the public health clinician’s bailiwick: poverty alleviation through trade reform and development finance. Trade liberalisation instruments, such as the beleaguered Trans-Pacific Partnership, stalled Doha development round of global trade reform and parallel non-governmental organisations’ trade campaigns, such as “Fair Trade”, offer far-reaching potential to realise wealth transfers to developing country farmers. Public health campaigners and individual clinicians could laud trade liberalisation for its hunger-ameliorating potential. Internalising the costs for minimum labour and environmental standards into price signals for Western consumers (through Fair Trade) is also a salutary exercise in health advocacy for the same reason. Similarly, it is timely for public health campaigners to vocally interpose health imperatives into negotiations regarding global financing instruments for development and the soon to be minted Sustainable Development Goals. Population controls and contraception counselling represent another crucial but much more established method for clinical and public health approaches to easing demands on dwindling food stocks.

Appropriately utilising foods is a further component of the malnutrition challenge requiring intervention by the health care community at both public health and clinical levels. There is a sinister double burden of malnutrition in Timor and globally — obesity and non-communicable diseases coexist with hunger and micronutrient deficiencies. Much of this trend is the result of imported processed food and departure from nutrient-dense traditional diets, as well as more sedentary lifestyles. Here, clinicians must offer tailored dietary and lifestyle counselling opportunistically at the coalface. Public health approaches can assist through education programs and “Let’s Go Local” food campaigns to address deficiencies in iron, iodine and vitamin A, aided by food fortification where feasible. Appropriate food handling and safety also looms large as markets fragment and contaminants from co-located industry concentrate up the trophic chain. Again, the case of Timor (and the Pacific) is illustrative: cyanide in cassava; cadmium in taro; mercury, histamine and ciguatera in fish; and Escherichia coli in fish. Foods can degrade and spoil in the tropics and infective hazards compound malnutrition but they offer prize opportunities for material intervention by clinicians and public health specialists alike.

Finally, food security demands attention by the broader health care community to put a dent in malnutrition. Farming less vulnerable to volatility in commodity or climate cycles is more sustainable. The latter bears closer attention. Climate change stands to disproportionately affect the Global South where nutritional adequacy is already marginal, with potential impacts all along the food supply chain. By instilling resilience and adaptive potential, malnourished populations can ensure surety and sustainability of food supply in the face of potentially catastrophic climate change. It behoves health care practitioners to underline this point as malnutrition is an unacceptably prevalent and preventable global scourge. It predisposes to diseases of reduced immunological and physiological reserve, and clinicians have a unique vantage point and political clout in their communities to assist with adaptation (and mitigation endeavours). Climate change portends a host of indirect sequelae ranging from increased (and potentially violent) competition for arable land, increased glacial melt flows with attendant water scarcity, loss of agro-diversity, increasingly frequent and intense weather events, sea water incursions into freshwater supplies, and more far-ranging food, water and vector-borne disease which will further imperil food supply and disproportionately afflict already benighted populations.

Rosa’s story well demonstrates the arcane and complex aetiology of global malnutrition. While focusing on the clinical dimensions of malnutrition is traditionally the province of medicine, the medical practitioner — whether physician or policymaker — must confront its socioecological and politico-economic determinants to consign it to history.

 –


Remote outreach clinic, Timor-Leste.

Disseminated methicillin-sensitive Staphylococcus aureus infection resulting from a paracervical abscess after acupuncture

A young woman was treated for musculoskeletal neck pain with acupuncture and developed a local paracervical abscess that progressed to a disseminated sepsis. The treatment was performed with an unusually long retention time of the acupuncture needle. This unique case shows that although acupuncture is deemed to be safe, serious complications may arise.

Clinical record

A 16-year-old, previously healthy girl was experiencing left-sided neck pain. She had no history of trauma or intravenous drug use, and there were no associated symptoms such as fevers, chills, cough or rigors. Initially, she attempted to manage her pain with simple pain medications. One week after onset, and experiencing ongoing pain, she presented to her general practitioner, who treated her with acupuncture. Two acupuncture needles (about 5 cm long) were placed locally to the left side of her neck. One remained for only 15 minutes; the other was fully inserted with only the handle visible and remained in situ for almost 24 hours.

Three days later, she developed significant worsening of her neck pain, lymphadenopathy, fevers, sweats and rigors. The next day, she was admitted at a small rural hospital with left neck pain and stiffness, associated with left-sided back and chest wall pain. She was started on 1 g of flucloxacillin every 6 hours.

Her pulse rate was 107 beats/min, oxygen saturation was 98% on room air, body temperature was 37.1°C and blood pressure was 121/68 mmHg. On physical examination, there was a diffuse swelling in the posterior triangle of her neck. An ejection systolic flow murmur was audible on auscultation. Oral candidiasis and pharyngitis with small punctate lesions were present. There was decreased air entry in her left lung base.

Investigations at the time of presentation showed a white blood cell count of 24.7 × 10⁹/L (reference interval [RI], 4–11 × 109/L), C-reactive protein level of 404 mg/L (RI, < 10 mg/L) and albumin level of 17 mg/L (RI, 30–50 mg/L). Test results for HIV, hepatitis B and hepatitis C were negative. Blood cultures grew methicillin-sensitive Staphylococcus aureus. A chest x-ray showed a left pleural effusion. An ultrasound scan showed numerous enlarged lymph nodes in her neck that were reactive in appearance, as well as a left chest wall haematoma. A computed tomography (CT) scan of her neck also identified multiple small-volume reactive lymph nodes on both sides of the neck and diffuse subcutaneous oedema extending from the left preauricular region to the root of the neck. No focal fluid collection or abscess was identified. A CT scan of her chest and abdomen showed bilateral pleural effusions (left more than right), bilateral consolidation, splenomegaly, and a chest wall haematoma on the left.

A change of management involved increasing the flucloxacillin dose to 2 g every 4 hours (changed to 6-hourly on Day 10) and further investigations. On Day 1 after admission, a transthoracic echocardiogram showed no evidence of infective endocarditis. Her C-reactive protein level improved to 247 mg/L on Day 3.

A magnetic resonance imaging scan on Day 7 identified an infiltrative lesion in the posterior paravertebral muscles, involving cervical vertebrae 1–5 and the spinal canal at that level (Box). The diagnostic possibilities were primary or secondary malignancy or infection. A pleural tap the next day drained 500 mL of blood-stained fluid. Laboratory results confirmed an empyema that grew S. aureus from the tap fluid.

Eleven days after her admission to the rural hospital, she was transferred to our tertiary teaching hospital. A CT-guided biopsy of the lesion identified S. aureus infection. No monoclonal B-cell or aberrant T-cell or natural killer cell populations were detected. There was no need for surgical management. The patient improved significantly with antibiotic therapy and was discharged from the tertiary hospital after 10 days and transferred back to the rural hospital.

Discussion

Acupuncture is a common treatment used for the management of pain. It is an invasive procedure whereby a needle is inserted to varying depths below the skin. In a review of 12 prospective studies looking at more than one million treatments, there were 715 adverse events including 12 deaths.1,2 Serious complications included pneumothoraxes,1 infections and neurovascular injuries.3 A review of the literature identified 65 case reports and series of infection occurring after acupuncture. When there is a breakage in the protective skin, barrier infection is an expected complication. There are certain factors that increase the risk of an infection after acupuncture. These include inadequate skin disinfection and poor hygiene,4 the use of needles that are too long (with subsequent penetration of the bowel and direct inoculation of the soft tissues), patients with immunodeficiency,5 and acupuncture into joints that have a metal prosthesis.6 We believe that the time that the needle is kept in situ is likely to be another important factor in increasing the likelihood of developing infection.

There is only limited evidence for the advantage of prolonged acupuncture needle retention time and almost no evidence or recommendation for needle retention time for longer than a few hours.

Although some acupuncturists consider needle retention time as an important variable in the management of patients,7,8 there are limited studies examining the best needle retention time.7,8 Further, there are no randomised clinical trials demonstrating the efficacy of a needle retention time of 24 hours or more. Some studies found that increased needle retention time caused a greater duration of breach of the skin barrier, which could increase the likelihood of infection.9,10 The current infection control guidelines for acupuncture of the Australian Acupuncture and Chinese Medicine Association11 do not discuss the needle retention time.

Our patient’s left neck pain was thought to be musculoskeletal in origin and was initially managed with acupuncture by a GP. Both acupuncture needles were placed in the left neck region and one remained in situ for almost 24 hours. Because of the temporal nature of the cervical collection and the pain occurring in the exact location that the acupuncture needle was placed, the needle was the presumed source of infection.

This case shows a serious complication in an otherwise healthy young woman after an acupuncture treatment with unusually long needle retention time, which most likely contributed to the development of the infection. It highlights that even fairly minor invasive procedures can lead to significant complications. This should be considered when recommending these procedures, and high hygiene standards should always be applied.

Box –
Magnetic resonance imaging scan of the patient’s neck, showing a left-sided paracervical abscess (arrows)

Climate change is harmful to our health: taking action will have many benefits

“Tackling climate change could be the greatest health opportunity of the 21st century” (The Lancet, 2015)

Humanity is at a critical juncture, where decisions made today will have a dramatic impact on our future. In late November 2015, world leaders will gather in Paris for the 21st Conference of the Parties of the United Nations Framework Convention on Climate Change (COP21). The aim of the meeting is to deliver a global agreement that will reduce carbon emissions, with the aim of limiting global warming to an increase of 2°C. A failure to do so will have far-reaching consequences for human health, in Australia and globally.

While the evidence for human-induced climate change is strong, and the current and projected effects of climate change are well described,1 calls to action often do not mention its health aspects. The Lancet Commission on Climate Change and Health has attempted to redress this omission with their second report, released in June 2015.2 This report summarises the health impacts of climate change and outlines the potential health benefits that would flow from reducing carbon emissions, such as those achieved by reducing particulate air pollution by decreasing fossil fuel combustion.2 The report concludes that “tackling climate change could be the greatest health opportunity of the 21st century”.2 This opportunity comes from maximising the direct health benefits of reducing carbon emissions, as well as from lessening the risk of human harm caused by catastrophic climate change.2 The report also makes a number of specific recommendations, including conducting further research into the impacts on human health of climate change.2

Changes in our climate have the potential to affect human health in many different ways, and some effects are amplified by other projected demographic and social changes, such as ageing populations and population growth increasing the demand on agricultural production.1,2 The consequences for human health include the effects of extreme heat and other climate-related events, such as floods, bushfires and more intense cyclones. The influence of heatwaves on morbidity and mortality is well documented.1,3 For example, the prolonged heatwave in south-eastern Australia during February 2009 was directly associated with an estimated 374 excess deaths in Victoria, more than double the 173 deaths linked with the “Black Saturday” bushfires that occurred during the heatwave.1,3,4 The immediate results of other extreme weather events are self-evident, but less apparent are the public health and mental health effects that can continue for some time after the event.5

The health consequences associated with the impact of climate change on natural, societal and economic systems will become progressively more important as global temperatures rise.2 A stable climate is important for agriculture, and threats to food security will be increasingly evident as a result of increasing temperatures.1,3 Food security does not just mean producing sufficient energy and protein for survival; the consumption of sufficient amounts of fruit, vegetables and whole grains is necessary for good health. Droughts and other climate events can affect the availability and cost of such foods, putting them out of reach for many people.6 The increasing cost of food relative to income also reduces the resources that are available for shelter, education and health services.

Water security is something that Australians know not to take for granted, and increasing drying trends, particularly as the result of more severe El Niño events, will further threaten water security in many parts of Australia. Both water availability and water quality are at risk.1,3 With sufficient resources, wealthy countries can respond to such problems with desalination plants, but these are unlikely to be available across Australia, so that people in rural and remote areas will be the most affected.1,3

The increasing frequency and intensity of extreme weather events, combined with climate change-related impacts on agriculture and the need to expend public money on infrastructure in response to rises in sea levels, will have major consequences for our economy.1,3 In particular, they will reduce the resources available for health and welfare services and education. The poor are most vulnerable to these repercussions, and are also most vulnerable to the effects of rising heat and other extreme weather events.

The impact of climate change on the emergence and spread of infectious diseases is likely to be complex, with some becoming more widespread, and others less so. Some infectious diseases are more prevalent after climate-related events such as cyclones and floods; eg, the outbreak of leptospirosis in Queensland after the 2011 floods.7 The prevalence of bacterial food- and water-borne diseases is likely to increase, and the epidemiology of some vector-borne diseases will probably shift as temperatures rise and ecosystems are transformed.1,3

While Australians are not yet sufficiently motivated to make the changes to our energy generation systems and consumption that are necessary for reducing the risk of dangerous climate change, it would be foolish to think that we will not experience its effects. We are already doing so, and will increasingly do so as temperatures rise.

The writing is on the wall, and Australia must respond. We must reduce our emissions substantially, reduce our economic reliance on the export of fossil fuels, and actively promote drastic emissions reductions in international forums such as COP21. The carbon content of the atmosphere means that we can expect to see an average global temperature rise of 1.5°C by 2030–2040, regardless of any mitigation efforts we might undertake.1 This will have consequences for health, most of which can be avoided if we invest significantly in adaptation measures, including building community resilience (the capacity to adapt and respond to changing conditions), adjusting our agricultural and water systems, and ensuring that our health and social systems are sufficiently flexible and well resourced to respond to the increasing and changing needs of our communities. We must also assist low-income countries to adapt to climate change, both for ethical reasons and to limit the risks of increased migration and conflict.1

As the Lancet Commission emphasises,2 with threat comes opportunity, and we can build a healthier nation by mitigating and adapting to climate change. Reducing air pollution caused by burning fossil fuels, increasing the use of active (walking, cycling) and public transport, and reducing our consumption of meat and animal products will all contribute both to mitigating climate change and to improving health.2 In addition, crucial adaptation measures, such as strengthening our public health systems,5 transforming our economy, improving housing and community resilience, and reducing social inequalities, will make our society a healthier and better place to live for all.1

The extra resource burden of in-hospital falls: a cost of falls study

In-hospital falls remain a major cause of harm in acute care hospitals; a multicentre study estimated that falls comprised about 40% of all reported patient incidents (11 766 of 28 998) in the British National Health System.1 They result in additional hospital costs because of their impact on hospital length of stay (LOS) and use of resources.2 Previous studies of the costs of falls have had methodological limitations — small samples from single hospitals, capture of fall events using single sources (resulting in measurement bias),35 modelled costs based on diagnosis-related group or per diem costs (known to be crude estimates of cost), or costing data more than 10 years old. Poor capture of fall events will result in inaccurate estimates of cost,6 while modelled costs are unlikely to reflect the true total cost attributable to the fall. Further, most studies have focused on falls resulting in serious injury,7,8 underestimating the total financial burden of in-hospital falls.

In Australia, only one study has examined the differences in the demand on resources by fallers and non-fallers in the acute hospital setting.9 This retrospective study was undertaken in a sample of 151 patients from a single hospital. Fallers were grouped by diagnosis-related group, and it was found that the LOS of patients who experienced a fall in hospital was up to 11 days longer than that of non-fallers (matched for age and sex). Costing analysis was undertaken for patients with complete costing data in the three most common diagnosis-related groups (39 pairs). Total hospital-related costs for fallers were reported to be double those for non-fallers, although no figures were cited. While this study provided insights into the increased consumption of resources caused by falls, the small sample consisted of a select group of patients from only one hospital. For this reason, data that can be generalised to the broader acute population in Australia are still needed.

Given the lack of comprehensive and contemporary data on the cost of falls, the aim of our study was to identify the economic burden associated with in-hospital falls in six Australian hospitals. The study had three main objectives:

  • to calculate the difference between the hospital LOS and costs of patients who experienced at least one in-hospital fall and of those who had not;

  • to calculate the difference between the hospital LOS and costs of patients who experienced at least one in-hospital fall injury and of those who had a non-injurious fall; and

  • to estimate the incremental change in hospital LOS and costs associated with each in-hospital fall or fall injury.

Methods

Study design

This multisite prospective study of the cost of falls was conducted as part of a larger falls prevention cluster randomised control trial, the 6-PACK project.10 A detailed description of the methods used in this study has been published elsewhere.6

Study population and setting

Our study included all patient admissions to 12 acute hospital wards in six public hospitals (metropolitan and regional teaching hospitals) in two Australian states (Victoria and New South Wales). The sample was restricted to wards randomised to the control group of the 6-PACK trial to minimise confounding due to the effects of the 6-PACK program. Participating wards included four general medical, two general surgical, one general medical short-stay, four specialist medical and one specialist surgical wards. All wards continued their standard care falls prevention practices during the study period.

Data collection and data sources

Data were prospectively collected in each hospital over a 15-month period during 2011–2013, including 3-month baseline and 12-month cluster randomised controlled trial study periods.

Fall events

An in-hospital fall was defined as “an event resulting in a person coming to rest inadvertently on the ground, floor, or other lower level”11 during their hospital stay. A fall injury was defined as any reported physical harm resulting from a fall; the injuries were classified as no injury, mild, moderate or major according to the definitions provided by Morse12 (Box 1).

Falls data were prospectively collected using a multimodal method to ensure maximal capture of falls events: (1) daily patient medical record audit; (2) daily verbal reports from the ward nurse unit manager; and (3) data extracts obtained from hospital incident reporting and administrative databases. Radiological investigation reports were reviewed to verify fractures. All recorded falls were reviewed and re-coded by a second independent assessor, and disagreements resolved by a third.

Patient hospital utilisation

Patient hospital utilisation was assessed on the basis of inpatient LOS and hospital episode costs. LOS was defined as the total number of hospital bed-days (calculated from the day of hospital admission to the day of discharge) and was extracted for all study participants from hospital administrative datasets. Patient hospital episode costs were extracted from hospital clinical costing systems. Hospitals with incomplete or poor-quality costing data (three of the six participating hospitals) were omitted from the costing analysis, but not from the LOS analysis; this involved 13 489 admissions, or 49.9% of the total number of admissions. Costs are reported in Australian dollars and were inflated to the base year 2013, based on the Australian Bureau of Statistics consumer price index for hospital services.13

Other hospital admission covariates

Data on patient demographics (age, sex) and admission characteristics (admission source, admission type, diagnoses) were obtained from hospital administrative datasets for all participants. Age was coded into four categories (< 55 years, 55–69 years, 70–84 years, ≥ 85 years). Admission type was coded into four categories (emergency v elective, and medical v surgical, based on diagnosis-related group classification). To account for comorbid illness on admission, comorbidities were generated with the Elixhauser comorbidity method.14 The assessment of cognitive impairment on or during a patient’s admission was based on International Classification of Diseases, 10th revision, Australian modification (ICD-10-AM) codes for dementia or delirium. A history of falls was defined as presenting with a fall or a history of falls coded as either the principal reason for admission or as an associated condition on admission.

Data linkage

Hospital administrative datasets were linked to data on fall events (linking variables: patient identifier, date of admission, date of event, ward). Data were then linked to patient hospital costing data (linking variables: patient identifier, date of admission). Three patients (0.02% of cohort) with missing costing data were excluded from the analysis of costs.

Statistical analysis

Descriptive and bivariate analyses of patient and admission characteristics and of hospital utilisation for each hospital admission were undertaken. Hospital LOS and costs were reported as means (with standard deviations) and medians (with interquartile ranges). If a patient was admitted to hospital several times during the study period, each admission was treated as a separate event. For patient admissions with an identified fall or fall injury, we analysed the average additional hospital LOS and costs with multivariate linear regression models (Box 2).

All analyses were adjusted for prespecified variables (age, sex, cognitive impairment6) and clustering by hospital (to account for in-hospital correlations). Additional admission covariates were included in the regression analysis if P < 0.25 in the bivariate analysis, or if they were clinically significant according to clinical opinion and literature. Standard errors were calculated using a bootstrap approach.15 Statistical significance was defined as P < 0.05 for all analyses. Data were analysed with Stata version 13 (StataCorp).

As hospital LOS and costing data were each positively skewed, cross-validation of the linear regression analyses was undertaken with generalised linear models that estimated the adjusted relative increase in LOS and costs for falls and fall injuries, using Poisson and gamma error distributions, respectively, and including a log-link function. In addition, multivariate linear regression analyses were undertaken, with log transformation of LOS and cost data. The smearing estimator developed by Duan and colleagues16 was used to retransform covariates from the log-scale back to the original scale (Australian dollars).

Sensitivity analysis

Sensitivity analyses were undertaken that separately compared the data of non-injured fallers with those of non-fallers, and of injured fallers with those of non-fallers. To examine the robustness of the cost of fall estimates, sensitivity analyses were undertaken that individually removed each of the hospitals to determine their influence on hospital costs and LOS, or that excluded patients who were deemed by visual inspection to be extreme statistical outliers (costs or LOS).

Ethics approval

This study received multicentre ethics approval from the Monash University Human Research Ethics Committee (project number CF11/0229–2011000072). Ethics and research governance approval was also obtained from local ethics committees at all participating hospitals.

Results

Our study included 21 673 unique patients and 27 026 patient hospital admissions (Box 3). We found that 966 hospital admissions (3.6%) involved at least one fall, and 313 (1.2%) at least one fall injury, a total of 1330 falls and 418 fall injuries. A summary of the numbers and types of fall events are summarised by hospital in Appendix 1.

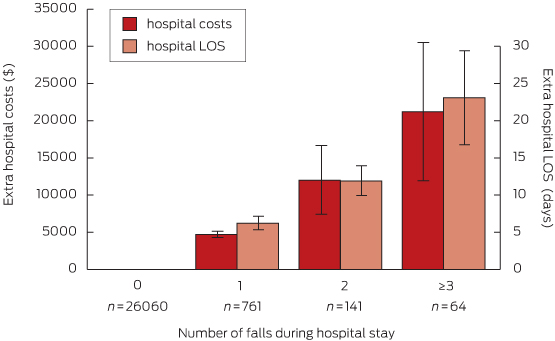
Data for hospital LOS and costs for the total cohort and by group are summarised in Box 4. The total hospital costs of fallers in this dataset were $9.8 million, with $6.4 million attributable to non-injured fallers and $3.4 million to injured fallers. After adjustment for age, sex, cognitive impairment, admission type, comorbidity, history of falls on admission and clustering by hospital, the mean LOS for fallers was 8 days longer (95% CI, 5.8–10.4; P < 0.001) than for non-fallers, and on average they incurred $6669 more in hospital costs (95% CI, $3888–$9450; P < 0.001) (model 1a, Box 5). Each additional fall was associated with a longer LOS and additional hospital costs; the LOS for patients who experienced three or more falls was estimated as being 23 days longer (95% CI, 10.7–35.4; P = 0.003) than for non-fallers, and they incurred more than $21 000 in additional hospital costs (95% CI, $3035–$39 355; P < 0.001) (model 1b, Box 6).

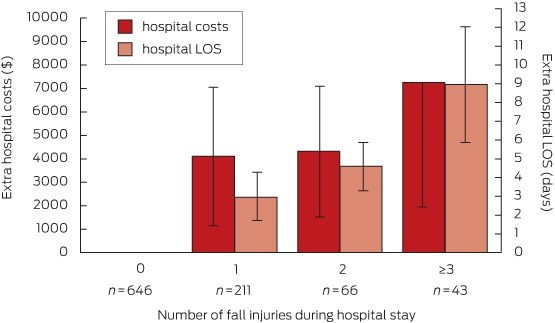
Within the cohort of fallers, the mean LOS for an injured faller was 4 days longer (95% CI, 1.8–6.6; P = 0.001) than for a faller without injury. Consistent with our other findings, mean hospital costs were also higher (by $4727; 95% CI, −$568 to $10 022; P = 0.08), but the difference was not statistically significant (model 2a, Box 5). Each additional fall injury was associated with increased LOS and additional hospital costs (model 2b, Box 7); patients who experienced three or more in-hospital fall injuries were estimated to have a mean increase in LOS of 9 days (95% CI, 2.8–15.1; P = 0.004) compared with a faller without injury, and incurred more than $7000 in extra hospital costs (95% CI, −$3126 to $17 636; P = 0.171) (Box 7). There were no statistically significant differences in hospital LOS or costs associated with the severity of a fall-related injury (189 hospital admissions with mild injury, 89 with moderate injury, 35 with severe injury; model 2c). Results from models 1b, 2b and 2c are summarised in Appendix 2.

The cross-validation analyses of the linear regression using generalised linear models and log transformation of LOS and costs (Appendix 3) did not alter our conclusions.

Sensitivity analyses

Fallers who did not sustain injuries were estimated to have a mean increase in LOS of 7 days (95% CI, 5.1–8.7; P < 0.001) compared with non-fallers, and incurred mean additional hospital costs of $5395 (95% CI, $3788–$7002, P < 0.001). Injured fallers were estimated to have a mean increase of LOS of 11 days (95% CI, 5.1–8.7; P < 0.001) compared with non-fallers, and incurred mean additional hospital costs of $9917 (95% CI, $3273–$16 561; P = 0.003). Additional sensitivity analyses were undertaken to examine the robustness of study estimates by individually excluding each hospital from the analysis, and by excluding 78 patient admissions that appeared to be outliers with respect to hospital LOS or costs. There were no appreciable differences in the excess LOS or costs calculated by these analyses (results available from authors on request).

Discussion

This study found that in-hospital falls remain highly prevalent, with 3.6% of all patient admissions resulting in at least one fall, a third of which caused a fall injury. They are a significant burden on hospital resources because of the resulting increases in hospital LOS and costs, with patients who experience an in-hospital fall having nearly twice the LOS and costs of non-fallers. Our study shows that more than half of the additional costs associated with a fall injury can be attributed to the fall itself, not the injury.

The increase in resource burden associated with an in-hospital fall, whether the patient sustains an injury or not, may be caused by changes in the patient’s care pathway and discharge planning. Previous studies have found that a fall (regardless of injury) will affect the patient’s confidence and independence,17 and therefore influences their rate of recovery and plan to leave hospital. Best practice guidelines recommend that patients who have a fall be provided with strategies that minimise the risk of subsequent falls and an assessment of safety and readiness for discharge home.18,19 As a result, delivery of guideline-based care is likely to influence the overall hospital LOS, regardless of injury, and thus their use of hospital resources.

However, as our study was observational, it is possible that a fall might be the consequence of a patient’s longer hospital stay rather than its cause. Patients at risk of falling in the acute hospital setting are typically acutely unwell, often have multiple comorbidities, and take several medications. A fall may therefore reflect deterioration in an individual’s health and function rather than cause it. Further exploration of temporal trends in the occurrence of falls and the care pathway of patients following a fall event are warranted.

Some limitations should be considered when interpreting our findings. While we adjusted our analyses for potential confounding factors, unmeasured characteristics may have influenced hospital cost and LOS outcomes. These include differences in patient management across wards, severity of illness and acuity of care. There are also limitations associated with analysis of routinely collected hospital data for the assessment of health conditions,20 which may have resulted in the undercoding of confounding factors. However, the coding quality of ICD-10-AM in Australia has been found to be good to excellent for many diagnostic codes and comorbidities.21

The use of hospital costing data also poses challenges. While analysis of clinical costing data is a powerful research tool and aims to preserve information about variability in individual patient resource use,22 clinical costing standards are relatively new for Australian public hospitals. We observed some variability in the completeness and quality of the available costing data, and hospitals with incomplete or poor-quality costing data were removed from our costing analysis, resulting in a sample that included about half of the total study cohort. Finally, the results from our study only incorporated costs of hospitalisation from the acute hospital perspective, potentially providing a more conservative estimate of the overall resource burden.

Fall rates in the acute hospital setting remain unacceptably high and are clearly associated with longer hospital patient stays and higher hospital costs. The resource burden of in-hospital falls for the Australian hospital system is considerable. Our findings highlight the fact that falls prevention programs in the acute hospital setting need to focus not only on the minimisation of harm resulting from falls, but also on the prevention of all falls. In the absence of evidence from randomised control trials that supports the effectiveness of any single falls prevention strategy in the acute hospital setting,23 the challenge remains to develop innovative ways to prevent falls in hospital and to reduce the additional resource burden associated with these events. Our findings have important financial implications for hospitals in light of an ageing population and the growth in the burden of disease, and the complexity of patients within a health care system facing major cost constraints.

Box 1 –
Fall injury classification, according to Morse12

  • No injury: No physical damage (observed or documented) as a result of the fall
  • Mild injury: An injury (such as a bruise, swelling, abrasion, laceration or skin tear) that does not require medical treatment other than simple analgesia, such as paracetamol
  • Moderate fall injury: Dislocation, sprain and/or an injury that requires medical or surgical treatment
  • Major fall injury: Any fracture or head injury (open or closed), including subdural haematoma

Box 2 –
Linear regression models for analysis of additional hospital length of stay (LOS) and costs associated with a fall or fall-related injury

Model

Definition


1a

Additional hospital costs and LOS of patients who experience at least one in-hospital fall (fallers), compared with those who do not (non-fallers)

1b

Additional hospital costs and LOS of each additional in-hospital fall (1, 2, ≥ 3 falls) compared with non-fallers

2a

Additional hospital costs and LOS of patients who experience at least one in-hospital fall injury (injured fallers), compared with those who fell at least once but were not injured (non-injured fallers)

2b

Additional hospital costs and LOS of each additional in-hospital fall injury (1, 2, ≥ 3 injuries) compared with non-injured fallers

2c

Incremental hospital costs and LOS associated with the type of fall injury (based on the injury classification: mild, moderate and major fall injuries) compared with non-injured fallers


Box 3 –
Characteristics of the study cohort

Characteristic

All hospital admissions (n = 27 026)

Hospital admissions by faller status


Hospital admissions by injury status


Faller (n = 966)

Non-faller (n = 26 060)

P

Injured faller (n = 313)

Non-injured faller (n = 653)

P


Age

< 0.001

0.064

< 55 years

8332 (30.8%)

120 (12.4%)

8212 (31.5%)

32 (10.2%)

88 (13.5%)

55–69 years

6626 (24.5%)

188 (19.4%)

6438 (24.7%)

51 (16.3%)

137 (21.0%)

70–84 years

8730 (32.3%)

451 (46.7%)

8279 (31.8%)

152 (48.6%)

299 (45.8%)

≥ 85 years

3338 (12.4%)

207 (21.4%)

3131 (12.0%)

78 (24.9%)

129 (19.8%)

Sex (female)

12 997 (48.1%)

400 (41.4%)

12 597 (48.3%)

< 0.001

112 (35.8%)

288 (44.1%)

0.055

Admission type

< 0.001

0.338

Medical non-emergency

2421 (9.0%)

105 (10.9%)

2316 (8.9%)

34 (10.9%)

71 (10.9%)

Medical emergency

16 232 (60.1%)

637 (65.9%)

15 595 (59.8%)

207 (66.1%)

430 (65.8%)

Surgical non-emergency

4585 (17.0%)

122 (12.6%)

4501 (17.3%)

19 (6.1%)

65 (10.0%)

Surgical emergency

3355 (12.4%)

84 (8.7%)

3233 (12.4%)

45 (14.4%)

77 (11.8%)

Not recorded

433 (1.6%)

18 (1.9%)

415 (1.6%)

8 (2.6%)

10 (1.5%)

Admitted from nursing home

166 (0.6%)

13 (1.3)

153 (0.6%)

0.001

3 (1.0%)

10 (1.5%)

0.267

Reason for hospital admission

Injuries

3852 (14.3%)

114 (11.8%)

3738 (14.3%)

< 0.001

37 (11.8%)

77 (11.8%)

0.602

Digestive system diseases

3512 (13.0%)

71 (7.3%)

3441 (13.2%)

0.042

31 (9.9%)

40 (6.1%)

0.130

Circulatory system diseases

3150 (11.7%)

115 (11.9%)

3035 (11.6%)

0.907

25 (8.0%)

90 (13.8%)

0.008

Respiratory system diseases

3051 (11.3%)

107 (11.1%)

2944 (11.3%)

0.706

36 (11.5%)

71 (10.9%)

0.896

Cancer

3029 (11.2%)

152 (15.7%)

2877 (11.0%)

< 0.001

49 (15.7%)

103 (15.8%)

0.533

Genitourinary system diseases

1867 (6.9%)

48 (5.0%)

1819 (7.0%)

0.535

19 (6.1%)

29 (4.4%)

0.062

Musculoskeletal and connective tissues disease

1309 (4.8%)

41 (4.2%)

1268 (4.9%)

0.027

11 (3.5%)

30 (4.6%)

0.338

Endocrine, nutritional, metabolic diseases

989 (3.7%)

57 (5.9%)

932 (3.6%)

0.010

20 (6.4%)

37 (5.7%)

0.440

Infectious and parasitic diseases

978 (3.6%)

40 (4.1%)

938 (3.6%)

0.755

15 (4.8%)

25 (3.8%)

0.775

Mental and behavioural disorders

536 (2.0%)

59 (6.1%)

477 (1.8%)

< 0.001

17 (5.4%)

42 (6.4%)

0.587

Other

4753 (17.6%)

162 (16.8%)

4591 (17.6%)

0.584

53 (16.9%)

109 (16.7%)

0.782

Presence of cognitive impairment during admission*

1882 (7.0%)

270 (28.0%)

1612 (6.2%)

< 0.001

93 (29.7%)

177 (27.1%)

0.061

Total number of comorbidities on admission, mean (SD)

1.8 (2.7)

2.5 (1.5)

1.5 (1.8)

< 0.001

2.7 (1.8)

2.4 (1.8)

0.532

History of falls on admission

2042 (7.6%)

133 (13.8%)

1961 (7.5%)

0.001

53 (16.9%)

80 (12.3%)

0.008


∗ICD-10-AM codes for delirium and dementia: F050, F051, F058, F059, F104, F106, F114, F124, F134, F144, F154, F164, F174, F184, F194, F430, F00-F03, G30, G311, G309. †Elixhauser comorbidity method.14 ‡ICD-10-AM codes for history of falls: W00, W01-10, W13-15 W17-19.

Box 4 –
Hospital length of stay and hospital costs for patient hospital admissions

Hospital length of stay

All hospital admissions (n = 27 026)


Hospital admissions with a fall (n = 966)


Hospital admissions without a fall (n = 26 060)

Hospital admissions with a fall (n = 966)

Admissions without a fall injury (n = 653)

Admissions with a fall injury (n = 313)


Mean hospital length of stay, days (SD)

7.9 (8.5)

19.5 (17.6)

18.0 (15.0)

22.5 (21.9)

Median hospital length of stay, days (IQR)

5 (3–9)

14 (9–24)

14 (8–23)

17 (9–27)

Hospital costs

All hospital admissions (n = 13 489)


Hospital admissions with a fall (n = 533)


Hospital admissions without a fall (n = 12 956)

Hospital admissions with a fall (n = 533)

Admissions without a fall injury (n = 376)

Admissions with a fall injury (n = 157)


Mean hospital costs, $ (SD)

9368 (12 572)

19 289 (21 712)

17 897 (17 317)

22 623 (29 511)

Median hospital costs, $ (IQR)

6038 (3658–10 585)

12 833 (8314–21 261)

12 821 (8440–20 904)

13 563 (7850–21 500)


IQR = interquartile range.

Box 5 –
Adjusted increased hospital use by patients with an in-hospital fall or fall injury (multivariate linear regression models)

Mean hospital length of stay, days (95% CI)

P

Mean hospital costs, $ (95% CI)

P


Faller (model 1a)

8.1 (5.8 to 10.4)

< 0.001

6669 (3888 to 9450)

< 0.001

Sex (female)

0.4 (0.2 to 0.6)

566 (41 to 1092)

0.035

Age

< 55 years

1.0

< 0.001

1.0

55–69 years

1.1 (0.6 to 1.6)

< 0.001

839 (−1575 to 3253)

0.496

70–84 years

1.6 (0.7 to 2.4)

< 0.001

1,698 (−856 to 4251)

0.193

≥ 85 years

2.0 (0.9 to 3.0)

< 0.001

795 (−1353 to 2944)

0.468

Cognitive impairment

4.8 (3.4 to 6.2)

< 0.001

5229 (943 to 9515)

0.017

Admission type

Medical non-emergency

1.0

1.0

Medical emergency

0.9 (−0.3 to 2.2)

0.146

906 (−524 to 2337)

0.214

Surgical non-emergency

1.7 (0.2 to 3.2)

0.023

7,330 (3730 to 10 930)

< 0.001

Surgical emergency

6.1 (3.9 to 8.2)

< 0.001

12 407 (1487 to 23 327)

0.026

Number of comorbidities

2.1 (1.5 to 2.6)

< 0.001

2605 (1564 to 3647)

< 0.001

Admitted from nursing home

−0.3 (−2.7 to 2.2)

0.831

4549 (−2697 to 11 794)

0.219

History of falls on admission

0.5 (−1.1 to 2.0)

0.567

−549 (−2490 to 1393)

0.580

Injured faller (model 2a)

4.2 (1.8 to 6.6)

0.001

4727 (−568 to 10 022)

0.080

Sex (female)

1.0 (−0.8 to 2.8)

0.278

519 (−1580 to 2618)

0.628

Age

< 55 years

1.0

0.784

1.0

55–69 years

−0.4 (−3.0 to 2.2)

0.556

−7095 (−20 182 to 5992)

0.288

70–84 years

−0.9 (−3.9 to 2.1)

0.111

−5772 (−17 208 to 5665)

0.323

≥ 85 years

−1.3 (−2.9 to 0.3)

<0.001

−8436 (−20 759 to 3887)

0.180

Cognitive impairment

5.3 (2.6 to 8.0)

6865 (1575 to 12 155)

0.011

Admission type

Medical non-emergency

1.0

1.0

Medical emergency

−0.7 (−3.7 to 2.4)

0.664

−973 (−3103 to 1157)

0.371

Surgical non-emergency

9.7 (2.9 to 16.5)

0.005

11 272 (2769 to 19 774)

0.009

Surgical emergency

10.3 (5.2 to 15.2)

< 0.001

19 706 (1530 to 37 881)

0.034

Number of comorbidities

2.7 (1.3 to 4.2)

< 0.001

3065 (1366 to 4763)

< 0.001

Admitted from nursing home

−4.0 (−13.2 to 5.3)

0.404

6953 (−14 912 to 28 819)

0.533

History of falls on admission

−0.4 (−2.1 to 1.3)

0.659

−3778 (−7787 to 231)

0.065


∗The intraclass correlation coefficient was 0.002 for the number of falls (95% CI, 0.000–0.005) and 0.001 for number of fall injuries (95% CI, 0.000–0.003). †Elixhauser comorbidity method.14

Box 6 –
Adjusted increases in hospital length of stay (LOS) and costs associated with each additional fall (total study cohort)


Data expressed as means ± standard errors.

Box 7 –
Adjusted increases in hospital length of stay (LOS) and costs associated with each additional fall injury (faller cohort only)


Data expressed as means ± standard errors.

Are some more equal than others? Challenging the basis for prisoners’ exclusion from Medicare

A mixed funding approach can help meet the urgent requirement for a level of health care in prison commensurate with need and equivalent to community standards

Consistent with global literature,1 prisoners in Australia experience profound health disparities relative to those who have not been incarcerated, with a disproportionate burden of mental illness, chronic and communicable diseases.2,3 Many prisoners have complex histories of disadvantage encompassing family violence, unstable housing, limited education, unemployment and economic adversity. Risky health-related behaviours including smoking, illicit drug use, harmful alcohol consumption and unsafe sexual practices are common in incarcerated populations.2

Correctional settings are uniquely placed to detect health problems, initiate care and promote health in a way that is unlikely to occur in the community, with important public health implications for the communities to which prisoners return.4 It is paradoxical, therefore, that prisoners are excluded from Australia’s universal health care scheme — Medicare — while incarcerated. Instead, health care for prisoners is transferred to state and territory government departments for the duration of their incarceration.

Some of Australia’s peak health and medical advocacy groups have criticised this exclusion, arguing that it transgresses human rights, results in suboptimal care, and perpetuates the cycle of ill health and disadvantage.5,6 Although these groups have called for reform to the legislation that underpins this exclusion, a way forward has not been clearly articulated. In this article, we outline the legal basis for prisoners’ exclusion from Medicare, articulate key arguments for reform and offer some pragmatic next steps, informed by an understanding of the legislation and an appreciation that wholesale replacement of prison health services with Medicare is neither workable nor desirable.

The evolution of Medicare — the basis for prisoners’ exclusion

Australia’s universal health care system, originally called Medibank, was introduced in 1975 by the Whitlam Labor government in response to widespread dissatisfaction and inequities caused by the previous voluntary health insurance scheme.7 Following numerous reviews and alterations, the system was reincarnated in 1984 as the Medicare Benefits Scheme (MBS).8 The Pharmaceutical Benefits Scheme predates Medicare, with some benefits first made available in 1948. Today, these two taxpayer-funded schemes, collectively known as Medicare, are centrally administered under the Health Insurance Act 1973 (Cwlth).

Until the introduction of Medicare in the mid 1970s, regulation of health was not a federal government power, and an amendment to the Constitution was required to make the federal system possible. The first years of constructing and implementing Medicare revealed the enormous economic burden that it would be for the government. In 1976, a review committee was established to “trim the fat”, and the resulting legislative amendments were aimed at carving out situations in which Medicare subsidies would not apply if there was another source of funding.9

An amendment in 1976 to the Health Insurance Act — s 19(2) — states that where health services are being provided by, on behalf of, or under an arrangement with any government entity (whether federal, state or territory), Medicare will not be available unless the Minister for Health or his/her delegate grants an exemption to this exclusion. As state-funded entities, prisons fall under this domain and thus, the legislation operates on the assumption that prisoners are excluded from Medicare because the state or territory in which they are incarcerated provides equivalent services. It also presumes that allowing access to Medicare for prisoners, who are provided with care at the expense of state or territory governments, would either constitute double dipping, or allow states and territories access to federal funds for an area that should be their economic burden to bear.

Is equivalence a reasonable assumption?

Health care in Australian custodial settings is guided by the concept of community equivalence, as outlined in numerous national and international frameworks.5,10 In principle, this means prisoners are entitled to receive the same level of access and quality of health care as the general population. In reality, however, persistent underinvestment in health services means that prisoners may miss out on certain treatments and medications.11 While the complexity of governance and funding arrangements in prisons means that it is often difficult to determine whether equivalence of care has been achieved,2 there are a number of key areas in which states and territories are failing to meet their obligations. Below, we consider two examples whereby the lack of access to Medicare affects prisoners’ health.

The Medicare Health Assessment for Aboriginal and Torres Strait Islander People (MBS item 715) is designed to target the ongoing health needs of Indigenous people who experience earlier onset and more severe progression of chronic illnesses than non-Indigenous Australians. Prisoners’ effective exclusion from Medicare means that neither prisoner health services nor community organisations that provide health services to Aboriginal and Torres Strait Islander people in prison can claim Medicare billing for this item. We know of no equivalent, culturally acceptable health assessment delivered in prisons in Australia, despite a well recognised need for Aboriginal-specific justice health services.12

Despite prisoners having some of the highest rates of mental illness of any population group, there is increasing evidence that prisons do not have the resources to address the extent of need. In the community, Medicare rebates are available for up to 10 allied mental health services in any one calendar year, with additional rebates available for group-based therapies. In prison, limited mental health resources are typically directed to those with the most severe mental health disorders and psychotropic medications are the mainstay of treatment for the majority.2 Unlike Medicare-subsidised schemes in the community, most prisoners have limited access to ongoing counselling and other individual therapeutic approaches, particularly for the treatment of common mental disorders, such as depression.

Exemptions to exclusion from Medicare — the equity argument

Parliamentary documents show that the Health Minister’s power to waive the Medicare exclusion was explicitly included in s 19(2) of the Health Insurance Act so that governments could make amendments if the exclusion was deemed to cause disadvantage.9 In practice, the Commonwealth has been willing to grant exemptions in cases of clear and demonstrated need. Two main groups of exemptions exist.

The first applies to Commonwealth-funded Aboriginal Community Controlled Health Services (ACCHSs). While the Act states that Medicare entitlements do not apply to services already funded by the Commonwealth, an exemption was granted in recognition of the gap in services between ACCHSs and mainstream primary care. The Inala Indigenous Health Service in South East Queensland also has an exemption. This service is a state-based primary care practice funded by Queensland Health and was granted an exemption in 2006, allowing services to be rebated through Medicare.13

Similarly, in 2006, the Council of Australian Governments (COAG) implemented the Improving Access to Primary Care in Rural and Remote Areas (s 19[2] Exemptions) Initiative. The COAG exemptions are open to eligible state funded health organisations that operate in areas with small populations (< 7000) with identified health workforce shortages. Recognising that state-funded facilities in small rural and remote towns provide primary care, the COAG exemption was granted to permit these organisations to bill Medicare for non-admitted, non-referred services.14

These precedents demonstrate the willingness of Commonwealth governments to permit access to Medicare if the ability of a health service to adequately care for the needs of a community was curtailed by the exclusion; a situation that clearly exists in prisons. The current exemptions all share a common theme: an expressed intention to ensure that all Australians have access to appropriate and quality health care, regardless of their circumstances. All of the current exemptions were granted in the last years of the Howard Coalition government under the then Minister for Health and Ageing, Tony Abbott.

Reforming funding for prisoner health care — a way forward

Legal action on the subject of prisoner health care has at times been successful, and has prompted meaningful change, such as access to condoms in prisons (Prisoners A-Xx Inclusive v State of New South Wales [1995] NSWSC 109). It has also been used in individual cases, such as Allan Petit v State of New South Wales [2012] NSWDC 105, where the failure of a New South Wales prison authority to inform a prisoner that he tested positive for hepatitis C after several blood tests was deemed to have deprived him of the opportunity to receive treatment and potentially prevent further transmission. Legal action in Castles v Secretary of the Department of Justice [2010] VSC 181 was successful in granting a female prisoner serving a term in a minimum security facility leave to access in-vitro fertilisation before she reached the age limit in Victoria. However, in relation to prisoners’ exclusion from Medicare, the issues are more complex. The legislation is clear: state and territory authorities are responsible for prisoners. Legal action against the responsible state government would not resolve the issue when the problem lies with federal legislation.

The Health Minister has the power, under the Health Insurance Act, to grant an exemption that would end prisoners’ exclusion from Medicare, paving the way for rebates to be claimed for prison-based health care services in certain circumstances. In an arrangement similar to that enjoyed by other state-based services that operate under s 19(2) exemptions (eg, Inala Indigenous Health Service), this would allow prisons to retain their existing health service delivery model but to enhance service delivery through access to certain Medicare items. Costs incurred by Medicare would be minimal. As an example, we estimate the cost of delivering the Indigenous-specific health assessment to every Indigenous prisoner in Australia in any one year would be less than 0.01% of the annual $20 billion Medicare budget (based on the current rebate of $212.25). Given that the focus of the health assessment is on disease prevention in Indigenous populations, combined with evidence that uptake in the community is poor among those most at risk,15 delivering this service in prisons has strong cost-effectiveness credentials. We are not aware of publicly available data comparing per capita expenditure on prison-based and community health care, although such information would inform the equivalence debate.

Cost sharing between the states and territories and the Commonwealth to achieve equity in prisoner health care is not new and has been debated by public health policy advocates in Australia for over a decade. What has emerged in the interim is evidence that prisons have substantially underinvested in health care, often because services are too expensive to deliver without access to Medicare rebates. Our proposal for a mixed funding model aligns with current government policy, whereby scarce health resources can be directed to where they will be most effective in improving the health of all Australians.

The 12 mental health indicators we should be focusing on

Australia spends $7.6 billion on mental health services annually, but experts question whether anyone is getting better and say we need to change our focus.

“Despite 20 years of rhetoric, Australia’s approach to accountability in mental health is overly focused on fulfilling governmental reporting requirements rather than using data to drive reform,” Sebastian Rosenberg, senior lecturer at the University of Sydney’s Brain and Mind Centre (BMC) and co-authors write in this week’s Medical Journal of Australia.

“The existing system is both fragmented and outcome blind. Australia has failed to develop useful local and regional approaches to benchmarking in mental health,” they say.

They believe that hundreds of mental health indicators and reports should be scrapped and data collection should be refocused into 12 indicators.

These “modest but achievable” indicators would provide a more accurate picture of mental health in Australia.

Related: MJA – Frequency and quality of mental health treatment for affective and anxiety disorders among Australian adults

The group suggests the indicators would “emphasise proximal factors (eg, death rates in the 12 months following discharge from a health facility) that can drive reform, rather than distal outcomes that are likely to reflect more complex determinants acting over longer time frames (eg, life expectancy)”.

The indicators suggested are:

Health domain indicators

  • Suicide rate: attempts and completions
  • Death rates after discharge from any mental health facility
  • Proportion of the population receiving mental health care services
  • Prevalence of mental illness

Social domain indicators

  • Employment rates
  • Education and training rates
  • Stable housing
  • Community attitudes towards mental illness

System domain indicators

  • Experience of care
  • Hospital readmission rates
  • Life expectancy
  • Accessing to specialised programs

“All Australian governments should agree now to refocus their reporting priorities around these 12 indicators. Governance of their collection should reside in a body suitably independent from government which can identify gaps and inequity”, they write.

“Local empowerment is the engine of mental health reform, and timely, useful accountability data are the fuel.”

To read the full article, visit the Medical Journal of Australia.

Latest news:
Is there value in the Relative Value Study? Caution before Australian Medicare reform
MBS Review a quick and nasty cost-cutting exercise
Troponin test concerns

“What should happen before asymptomatic men decide whether or not to have a PSA test?” A report on three community juries

Prostate-specific antigen (PSA) testing of asymptomatic men remains controversial.1 Testing may improve prostate cancer survival rates,2 but can also lead to harms, such as repeated investigations and the unwanted effects of treatments, including incontinence and impotence.35 Evidence regarding benefits and harms alone has not resolved tensions over PSA testing.6 Disagreement among experts and in guidelines has confused public communication in Australia and internationally.7,8

In December 2014, the Prostate Cancer Foundation of Australia (PCFA) and the Cancer Council Australia (CCA) released clinical consensus guidelines for general practitioners for public comment,9 after the National Health and Medical Research Council (NHMRC) had published information on the topic for health practitioners.10 These documents established criteria for identifying men more likely to benefit than to be harmed by PSA testing. However, it remains unclear if and when GPs should introduce the subject of PSA testing in consultations with individual men. The Royal Australian College of General Practitioners (RACGP) advises GPs not to broach the subject of PSA testing, but to provide full information regarding the benefits, risks and uncertainties of testing and treatment if patients specifically ask about it.11

In this article, we report the outcomes of three community juries convened in 2014 to consider the dilemmas associated with PSA testing. A community jury is a group of citizens brought together to receive detailed evidence about a specific problem and to then deliberate on this problem.12 Our aim was not to capture the opinions of the broader community, but to ascertain what a well informed citizenry would accept as legitimate PSA testing policy and practice, and the reasons for their views. Community juries are an established, appropriate method for investigating such questions.12 Community juries have been used in Australia and elsewhere to consider questions related to cancer screening.13,14 Unlike surveys and focus groups, they involve extensive provision of information, constructive and structured dialogue between ordinary members of the public and experts, and adequate time for consideration of the problem. The process is similar to a legal proceeding, but the outputs are not legally binding; they instead provide evidence for policy making.

We consulted major stakeholders (consumer organisations, GPs, epidemiologists, urologists, the CCA) to design the questions that the juries would consider. All agreed that the key issues to be explored were:

  • whether GPs should initiate discussions with asymptomatic men about the PSA test;

  • when men should be given information about the potential benefits and harms of testing, biopsy and treatment.

Valid consent for interventions is integral to an ethical health care system, and providing adequate and timely information is fundamental to valid consent. While this has been noted in relation to PSA testing,15,16 it is not yet clear what should happen before men decide for or against taking a PSA test. Noting the work currently being undertaken by the NHMRC, CCA and PCFA, we sought information on what selected groups of members of the public consider to be the obligations of GPs regarding informing men about PSA testing, and what else might be required before a man could validly consent to a PSA test.

Methods

Community jury research is a deliberative method, with the following general characteristics:

  • a group of citizens is convened for 1 to 3 days;

  • they are asked to consider a specific problem;

  • they hear evidence from (often opposed) experts, and ask the experts questions;

  • they are given time for deliberation and to come to a documented conclusion.

There are two main approaches in community jury research: participants draft open recommendations as a group, or vote on options specified by the researchers.17 We used both approaches in our investigation: Jury 1 tested an open approach, while Juries 2 and 3 were asked to vote on specific options (Box 1).

Recruitment and selection

We recruited three community juries in 2014 — two of mixed gender and ages (Juries 1 and 2), and one of men of PSA screening age (Jury 3) — by placing advertisements and articles in the mass and social media in Sydney. Of 119 respondents, 42 were unavailable on the days scheduled for the juries; 37 with recent personal or close family member experience of prostate cancer treatment, biopsy or active PSA monitoring were also excluded. We sought socioeconomic and cultural diversity for our juries. Juries 1 and 2 were socioculturally diverse but of above-average educational attainment; the all-male Jury 3 was also socioculturally diverse, but its educational attainments broadly matched those of the general Australian population. Forty participants were thus recruited according to their eligibility, sociodemographic characteristics and availability (Box 2).

Each jury commenced with an evening orientation session (Day 0), during which the questions and the jury process were introduced and consent was obtained. Jury Day 1 focused on interrogating the evidence and understanding the ethical, legal and practical aspects of the problem. Testimony on the following themes was prerecorded by selected experts and shown to jurors in a video presentation:

  • basic biology, diagnosis, treatment and prognosis of prostate cancer;

  • qualitative empirical evidence on how Australian GPs manage PSA testing in their practices;

  • ethical and legal aspects of patient consent (in general, and with regard to screening);

  • potential harms of screening asymptomatic men for prostate cancer; and

  • potential benefits of screening asymptomatic men for prostate cancer.

Each presentation lasted about an hour. Prerecording ensured that the evidence presented was standardised, although some experts slightly modified their presentations for Juries 2 and 3 according to the more specific options considered by these juries. The biographical sketches of the experts and the video presentations shown to Juries 2 and 3 are available online.18 Immediately after each video, the relevant expert was available for questions through a conference calling system. Facilitated by a researcher, these question-and-answer sessions allowed jurors to clarify or challenge the arguments presented. Facilitation focused on promoting constructive dialogue and fair interaction between jurors. Our observations of unstructured deliberations and the transcripts indicated that this inclusivity was maintained during non-facilitated periods.

For the first hour of Jury Day 2, jurors reflected on, discussed and debated the evidence, aided by a researcher acting as facilitator. Juries then deliberated for an hour without the researchers, and either reached a set of recommendations (Jury 1) or majority verdicts on the questions posed (Juries 2 and 3). The recommendations or verdicts, the underlying reasoning, and dissenting views were reported to the research team in a final, facilitated feedback session.

Data collection and analysis

The three deliberative groups (juries) were the units of analysis in this study. All jury deliberations (facilitated and non-facilitated) and expert question-and-answer sessions were audio-recorded and transcribed. During the final session, the verdicts and reasons were recorded by a researcher on a flipchart. Each point was reviewed by the jury to ensure accuracy. Transcripts were subsequently reviewed to identify key reasons why jurors supported or rejected the presented options.

Ethics approval

Our study was approved by the Cancer Institute NSW Population and Health Services Research Ethics Committee (HREC/12/CIPHS/46).

Results

Jury 1

In response to the question, “What should happen before men decide whether or not to be tested?”, Jury 1 recommended that:

  • GPs should initiate discussions about PSA testing with 50–70-year-old asymptomatic men, and provide information about the limitations of the test and the potential benefits and harms of biopsy and treatment;

  • these discussions should be encouraged but not mandatory;

  • discussions should inform a man’s decision making rather than be constrained by formal procedures (eg, signing a form);

  • GPs should consider a cooling-off period, so that men need to wait 1 to 2 days after the discussion before being tested; and

  • the community should be informed about expert uncertainty regarding the PSA test, to stimulate discussion between men and their GPs.

Problems discussed by Jury 1 without reaching a consensus were:

  • the appropriate content for a patient information sheet;

  • how to communicate to men that they can opt out of PSA testing; and

  • whether to discourage PSA testing by charging a fee.

Juries 2 and 3, part A

Similar to Jury 1, the majority view of both Juries 2 and 3 was that GPs should introduce the topic of PSA testing to asymptomatic men aged 50–70 years (Box 3). Prostate cancer was seen as a legitimate health concern for older men, so that PSA testing was an appropriate topic for general health discussions. Jury 3 (all males) also argued that GPs were best placed to inform men about PSA testing, as GPs were a more reliable point of access to medical advice; relying on other information sources would be “leaving it to chance”. All men, they said, should have equal access to the same information.

A minority in both Juries 2 and 3 voted that GPs should not raise the topic of PSA testing with asymptomatic men because other, more important health issues should receive priority, and because men might be more inclined to have a PSA test if GPs raised the topic. They were particularly concerned about the unreliability of the test and the risks of unnecessary treatment ensuing.

Juries 2 and 3, part B

Like Jury 1, the majority of Jury 2 (mixed gender) voted that detailed benefit–harm information about PSA testing and prostate biopsy and treatment should be provided in advance to support informed decision making. This was a minority position in the all-male Jury 3 (Box 3).

The reasons given by members of Juries 2 and 3 for their views included:

  • men have a right to know relevant information before making a decision; and

  • after an elevated PSA test result, it might be difficult to refuse subsequent biopsy and treatment, and men may not obtain the information needed to decide about the next steps.

Similar to Jury 1, Juries 2 and 3 supported a cooling-off period so that men could reconsider their decision before testing.

The majority of Jury 2 (13 of 15) supported providing all information before PSA testing. However, 10 of the 13 objected that our wording (especially “should” and “all”) was too prescriptive. They wanted GPs to be free to provide information tailored to an individual’s level of interest and personal requirements.

Two-thirds of the all-male Jury 3 voted that information about the benefits and harms of biopsy and treatment should be provided only after an elevated PSA test result had been received. These jurors argued that the PSA test alone was not intrinsically harmful, and favoured staggering the delivery of information, with written information available to those who wanted it at any particular point. Jury 3 members, in particular, were concerned about “information overload”. They felt that most men would not want to understand the harms and benefits of prostate biopsy and treatment until it was directly relevant to them. They trusted GPs to tell them what they needed to know in a timely manner, avoiding unnecessary anxiety. Notably, some participants argued that details about the risks of biopsies and treatment options should be provided to men by urologists because of their specialist expertise.

Discussion

After two days of deliberation, all three community juries recommended that GPs should discuss the PSA test with asymptomatic men over 50 years of age as part of routine care. Jurors felt GPs were best placed to consistently inform men about PSA testing, rather than relying on their being informed (or not) by other sources. All three juries wanted GPs, if prompted, to provide information about the limitations, benefits and risks of testing, biopsy and treatment, and to offer to provide more details if desired by the patient. The concept of a cooling-off period to allow men to think about whether or not they wanted a PSA test was also highly valued.

All Jury 3 members were men, and many were having, and appeared committed to, routine annual PSA tests. They also reached different conclusions to the other juries about when information should be provided. While Juries 1 and 2 focused on what would be good for men generally, members of Jury 3 often focused on their own personal experiences and preferences, including a shared inclination to rely on a doctor’s assessment of the particular information that was required to inform a patient’s decisions. This suggests that, although an informed public prefers GPs to take an active role in educating men about the PSA test, some men of screening age may not wish to be burdened with uncertain and detailed information about the consequences unless they have received an elevated PSA test result.

There are valid reasons why GPs might resist raising awareness of the PSA test. Simply mentioning it may encourage men to favour being tested; patients differ in their information needs;19 and communicating the potential harms of PSA screening is difficult.20,21 The new consensus recommendations and NHMRC-developed information resources promise to support GPs in the challenging task of discussing the topic. Models for communicating information about screening in a balanced and patient-centred way have also been described in the literature. The “consider an offer” model,19 for example, suggests that GPs help men consider and evaluate recommendations or offers of screening, while explicitly acknowledging that the offer might reasonably be refused. Rather than encouraging screening or expecting people to analyse detailed evidence, whether they felt ready to do so or not, such patient-centred approaches could help individuals decide how much information they wish to receive, and to reflect on their values and preferences regarding benefits and harms when deciding whether or not to be screened.

A limitation to this study is that community juries are comprised of small groups of engaged citizens whose views may not represent those of the general public. However, as all three juries came to similar conclusions, it is likely that our findings are replicable. Our unit of analysis was the deliberative group, but we note that the findings from the all-male jury differed from those of the mixed-gender juries, and that the men in the mixed juries endorsed the final recommendations of the juries in which they participated. This suggests that gender-related factors may influence jury processes.

The juries were clear: GPs should raise the topic of PSA testing and explain the benefits and harms, but tailor their information to the individual patient. Timing of information provision was less clear. PSA testing, the juries concluded, is a health issue that matters to men, and GPs are a reliable, trustworthy source of advice on health issues. These jury outcomes invite critical reflection by professional bodies about how GPs should actively support individual men making decisions about PSA testing.

Box 1 –
The questions addressed to the three juries, and the options available for their verdicts

Jury 1 deliberated and drafted recommendations on the open question:

  • Consent and PSA testing for prostate cancer: “What should happen before men decide whether or not to be tested?”

Juries 2 and 3 were asked to vote on two questions:

  • Part A. Select 1 or 2:
    1. Should GPs introduce the topic of PSA testing during appointments with male patients who have no symptoms?
    2. OR

    3. Should they wait until men ask about it?
  • Part B. Which of these options do you endorse? (Please give your reasons):
    1. Men without symptoms should get all the information about the possible benefits and harms of testing, and biopsy and treatment, before they decide whether or not to have a PSA test.
    2. OR

    3. Men should not get information about possible benefits and harms of biopsy and treatment before PSA testing. Instead, the doctor should wait until they know the test result. If the test result is raised, then the doctor should give information.

      Jurors were asked to endorse either B1 or B2, and to give reasons for their decisions. The juries were repeatedly reminded that the questions were specifically about PSA testing for asymptomatic men.

Box 2 –
Characteristics of the jury participants

Jury 1

Jury 2

Jury 3


Number

13

15

12

Age

< 40 years

2

5

1

40–70 years

10

8

9

> 70 years

1

2

2

Range, years

28–70

19–75

37–74

Median, years

52

49

57

Gender

Male

9

9

12

Female

4

6

0

Highest educational attainment

High school

2

3

1

Trade or diploma

0

1

7

Bachelor degree

4

7

3

Postgraduate degree

7

4

1

Cultural background/ethnicity*

Australian

11

11

7

Southern/eastern European

0

1

0

Southeast Asian

1

0

1

Northeast Asian

1

2

2

Southern/central Asian

0

1

1

Northwest European

0

0

1

Socioeconomic status of suburb

Low

1

1

2

Middle

1

4

4

High

11

10

6


∗Based on the Australian Standard Classification of Cultural and Ethnic Groups (ASCCEG).22 †Based on Socio-Economic Indexes for Areas (SEIFA).23

Box 3 –
The outcomes of the deliberations of the three juries

Jury 1 recommendations

  • GPs should:
    • initiate discussions with 50–70-year-old asymptomatic men about PSA testing;
    • be prepared to provide men with information about all the potential harms and benefits;
    • consider instituting a cooling-off period so that men need to wait before taking the test.

Juries 2 and 3 verdicts

  • Part A
    1. Should GPs introduce the topic of PSA testing during appointments with male patients who have no symptoms?
    2. OR

    3. Should they wait until men ask about it?
    4. Jury 2 (mixed gender, n = 15) voted 12–3 for option 1;

      Jury 3 (all men, n = 12) voted 10–2 for option 1.

  • Part B
    1. Men without symptoms should get all the information about the possible benefits and harms of testing, and biopsy and treatment, before they decide whether or not to have a PSA test.
    2. OR

    3. Men should not get information about possible benefits and harms of biopsy and treatment before PSA testing. Instead, the doctor should wait until they know the test result. If the test result is raised, then the doctor should give information.
  • Jury 2 (mixed gender, n = 15) voted 13–2 for option 1;

    Jury 3 (all men, n = 12) voted 8–4 for option 2.

Prevalence of e-cigarette users in New South Wales

Electronic cigarette (e-cigarette) use has grown rapidly in parts of the world, the United Kingdom and United States in particular.1,2 In Australia, evidence is lacking regarding how widely e-cigarettes are used, for what purpose and by whom. There is vigorous debate over the harms and benefits of e-cigarettes, including whether they are the next big thing in smoking cessation or whether they will act as a gateway to tobacco smoking.3,4 The first step towards being able to answer these important questions is to understand the profile and prevalence of e-cigarette users.

While information on the prevalence of e-cigarette use among smokers in Australia has been publicly reported,4 to our knowledge, there is no published information on population-level prevalence rates of e-cigarette use in Australia and no indication of whether we are seeing an increase from year to year comparable with what has been seen overseas. The 2014 New South Wales Population Health Survey provides insights into e-cigarette use in the state and a baseline from which future changes in use can be measured in the general population.

The telephone-based survey, administered by the NSW Ministry of Health, captured responses to a question on e-cigarette use from 12 502 respondents aged 18 years or older, using a dual frame (mobile phone and landline) sampling strategy to account for declines in landline ownership. Data collection and weighting methods for the survey have been described elsewhere.5 Current e-cigarette use was defined as respondents who used e-cigarettes on a daily or occasional basis, which may include users who were trialling the devices when surveyed.1 Design-adjusted prevalence estimates, relative risks (RRs) and 95% confidence intervals were calculated using SAS version 9.4 (SAS Institute).

We found the prevalence of current e-cigarette users in NSW was 1.3% (95% CI, 0.9–1.7), while 8.4% (95% CI, 7.5–9.3) of the population was estimated to have tried an e-cigarette (Box). Current smokers were 7.5 times more likely to be current e-cigarette users than non-smokers (RR, 7.5; 95% CI, 4.2–13.7), while males (RR, 1.2; 95% CI, 0.7–2.2) and people aged 18–44 years (RR, 1.8; 95% CI, 1.0–3.3) were more likely to have ever tried an e-cigarette compared with females and people aged 45 years or older, respectively. We estimate that about 78 000 people are current users of e-cigarettes in NSW. Current use of e-cigarettes is relatively low compared with other countries, such as the US and the UK.1,2 While increases in e-cigarette use were observed in the US and the UK, it is unclear whether NSW will see a similar growth pattern. The NSW Ministry of Health will continue to monitor the use of e-cigarettes in the state.

Box –
Selected characteristics of current and lifetime users of e-cigarettes, NSW, 2014

Characteristic

Current user (95% CI)

Ever used (95% CI)


Overall

1.3% (0.9%–1.7%)

8.4% (7.5%–9.3%)

Sex

Male

1.5% (0.9%–2.0%)

10.3% (8.9%–11.7%)

Female

1.2% (0.7%–1.8%)

6.6% (5.5%–7.6%)

Age group

18–44 years

1.7% (1.1%–2.4%)

12.6% (11.1%–14.2%)

45 years or older

1.0% (0.5%–1.4%)

4.5% (3.7%–5.3%)

Tobacco smoking status

Current smoker

4.9% (3.1%–6.8%)

36.5% (32.9%–40.1%)

Non-smoker

0.7% (0.4%–1.0%)

3.2% (2.5%–3.8%)

Rurality

Metropolitan

1.3% (0.8%–1.7%)

8.5% (7.5%–9.5%)

Rural

1.6% (0.8%–2.4%)

8.1% (6.3%–9.8%)


∗Respondents aged 18 years or older. †Current smokers include daily and occasional smokers.