×

Therapeutic advances and risk factor management: our best chance to tackle dementia?

An update on research advances in this field that may help tackle this growing challenge more effectively

Increasing life expectancy has fuelled the growth in the prevalence of dementia. In 2015, there were an estimated 47 million people with dementia worldwide (including 343 000 in Australia), a number that will double every 20 years to 131 million by 2050 (900 000 in Australia).1 The global cost of dementia in 2015 was estimated to be US$818 billion.1 Low-to-middle income countries will experience the greatest rate of population ageing, and the disproportionate growth in dementia cases in these nations will be exacerbated by a relative lack of resources.

The diagnostic criteria for dementia (relabelled “major neurocognitive disorder”) of the American Diagnostic and Statistical Manual of Mental Disorders, fifth edition (DSM-5)2 include a significant decline in one or more cognitive domains that is clinically evident, that interferes with independence in everyday activities, and is not caused by delirium or other mental illness. Whether the new diagnostic label catches on remains to be seen. The most common type of dementia is Alzheimer’s disease (AD) (50–70% of patients with dementia), followed by vascular dementia (10–20%), dementia with Lewy bodies (10%) and fronto-temporal dementia (4%).3 These percentages are imprecise, as patients often present with mixed pathology.

Our discussion will focus on AD because it receives significant research attention as the most common cause of dementia. The two hallmark pathological changes associated with neuronal death in AD are deposition of β-amyloid plaques, and tau protein neurofibrillary tangles. Understanding this process has been enhanced by prospective cohort studies, such as the Australian Imaging Biomarkers and Lifestyle (AIBL) study.4 As shown in the Box, the results of this research indicate that the degree of β-amyloid deposition exceeds a predefined threshold about 17 years before the symptoms of dementia are detectable. In the absence of an alternative model, the amyloid cascade remains the most compelling hypothesis for the pathogenesis of AD. This is supported by the fact that early onset familial AD is caused by mutations in chromosome 21 that result in the production of abnormal amyloid precursor protein (APP), or by mutations in chromosomes 1 or 14 that result in abnormal presenilin, each of which increase amyloid deposition. The extra copy of chromosome 21 in Down syndrome also leads to faster amyloid deposition and the earlier onset of AD. Further, the symptoms of AD are correlated with imaging of amyloid in the living brain and with cerebrospinal fluid biomarkers that are now included in new diagnostic criteria for AD and which will enable suitable participants to be selected for trials of drugs that may prevent or modify the disease,2 in particular to determine whether anti-amyloid agents are useful for delaying or treating AD.

At present, cholinesterase inhibitors (donepezil, galantamine and rivastigmine) and the N-methyl-D-aspartate (NMDA) receptor antagonist memantine are licensed for treating AD dementia, and produce modest but measurable benefits for some patients. These medications are thought to work by increasing cholinergic signalling and reducing glutamatergic activity respectively, partially redressing neurochemical abnormalities caused by the amyloid cascade.5 More than 200 other drugs advanced to at least Phase II development between 1984 and 2014, but none has yet entered routine clinical use.6 Lack of efficacy in clinical trials may be the result of their being introduced at a rather late stage of the disease process; hippocampal damage is so profound by the time individuals present with AD dementia that attempting to slow their decline with an anti-amyloid agent may be analogous to starting statins in patients on a heart transplantation waiting list. As it provides the most compelling hypothesis for AD, the amyloid cascade remains the main target for developments in treatment. Treatment trials in people with preclinical or prodromal AD will in due course determine its validity.

Recent developments include promising results for treating prodromal AD with passive vaccines containing monoclonal antibodies directed against β-amyloid, such as solanezumab and aducanumab. This may point the way to treatments in the next decade that delay the onset of dementia in people with developing AD pathology.7,8

The identification of risk factors for AD may lead to risk reduction strategies. Recent randomised controlled trials of multidomain interventions, such as the Finnish Geriatric Intervention Study to Prevent Cognitive Impairment and Disability (FINGER) study (a 2-year program including dietary, exercise, cognitive training and vascular risk monitoring components), show that such interventions could improve or maintain cognition in at-risk older people in the general population.9 Greater risk reduction might be attained by intervening 10 to 20 years before the first clinical signs of cognitive impairment are presented. A recent review of 25 risk and protective factors associated with AD concluded that “the evidence is now strong enough to support personalized recommendations for risk reduction by increasing levels of education in young adulthood, increasing physical, cognitive and social activity throughout adulthood, reducing cardiovascular risk factors including diabetes in middle-age, through lifestyle and medication, treating depression, adopting a healthy diet and physical activity, avoiding pesticides and heavy air pollution and teaching avoidance of all potential dangers to brain health while enhancing potential protective factors”.10 These risk factors, and particularly vascular risk factors, are implicated in neurodegeneration pathology in a number of dementia processes.

While the search for effective preventive strategies and access to evidence-based pharmacological treatments and psychosocial interventions are critical, there are still delays in diagnosis and a failure to utilise existing available resources.1,3 The introduction of the federal government-funded, state-based Dementia Behaviour Management Advisory Services (DBMAS), the initiation of severe behaviour response teams, and increased funding for research should be applauded, but there needs to be greater coordination of service delivery systems for patients and carers at every stage, from prevention through to end-of-life care, and the medical profession needs to do more to ensure that all existing and trainee practitioners are well informed about what we can do for people with dementia right now.

Box –
Relationship of ß-amyloid deposition with other parameters in Alzheimer disease


Aß-amyloid = ß-amyloid; CDR = Clinical Dementia Rating. Reproduced with permission from Villemagne et al (2004).4

Novel insights, challenges and practical implications of DOHaD-omics research

The basic tenet of developmental origins of health and disease (DOHaD) research is that perinatal health behaviours of the mother and father, as well as those of the child in early life, can have a significant impact on the future health of the child and that of subsequent generations. Studies exploring DOHaD investigate how early life exposures increase susceptibility to later adverse health outcomes from medical and public health perspectives. This altered health risk appears to occur through reprogramming of physiological systems away from their normal developmental trajectories, and highlights the plasticity of organ systems in the perinatal periods.1 Recent research in this field has focused on the potential for these physiological changes to exert trans-generational effects, without the requirement for further exposures in subsequent generations.2 This appears to occur through genetic and environmental interactions, resulting in phenotypic changes that persist across generations.

The emergence of “-omics” biotechnologies (eg, genomics, proteomics and metabolomics) has revolutionised physiological research in the DOHaD field. From the genome to the epigenome, microbiome and metabolome, research investigating pathways leading to disease has never before had the technology to investigate physiology in such a high throughput, data-rich capacity. We summarise this emerging research capability and its application in DOHaD studies to explain how environmental and social factors, such as diet, stress and exposure to toxins, affect our physiology and become inherited, leaving a legacy of disease susceptibility for future generations.

The epigenome

The epigenome refers to changes made to the genome that result in altered transcriptional activity in the absence of DNA sequence alterations. This highly dynamic process, occurring in response to several external factors, is stably maintained and endures over multiple generations. Epigenetic mechanisms regulating gene expression, including DNA methylation, histone modifications and the actions of small non-coding RNAs, each contribute to tissue-specific gene expression and an altered cellular phenotype. The introduction of efficient sequencing and microarray techniques has facilitated the study of these epigenetic mechanisms.

The interaction between epigenetic inheritance and environmental exposures has been recognised as an important determinant of phenotypic outcomes for offspring.1 Exposures of the mother can result in epigenetic modifications in the developing fetus and the germline.3 Such transmission is not restricted to maternal exposures, and recent evidence shows that epigenetic modifications are also inheritable down the paternal line.4 Specifically, a murine model of paternal obesity has shown altered methylation and microRNA profiles,4 which highlights the role of the father’s contribution to inheritable disease susceptibility. Further, data from the Överkalix Swedish tri-generation population study have shown that the mortality risk ratio of grandchildren was associated with the food supply available to their same-sex paternal grandparent.5 Whether an epigenetic mode of inheritance can contribute to such human outcomes is as yet unknown, but is expected, given the strong parallels observed between animal and human trans-generational studies. Single-generation epigenetic effects have been seen in humans, eg, maternal depression in the third trimester of pregnancy is associated with increased methylation of the NR3C1 gene in cord blood mononuclear cells, in conjunction with altered stress responses in the infants at 3 months of age.6 Increased methylation of this same gene was found in the brain tissue of adolescents with a history of child abuse who later committed suicide,7 and in lymphocytes of 11–21-year-olds after childhood maltreatment, and is associated with poor psychological health.8 Together, these studies suggest that early epigenetic modifications may increase vulnerability to poor long-term health in humans. Recognition of epigenetic mechanisms that contribute to poor outcomes may contribute to interventions to reverse these effects. For example, rat offspring exposed to low maternal grooming behaviour have increased DNA methylation of the hippocampal glucocorticoid receptor gene, which is reversed by increased care provision in early postnatal life.9 Similar epiphenotypes are observed in infant saliva, when high tactile stimulation of the infant in the postnatal period normalises glucocorticoid receptor hypermethylation induced by maternal depression.10

The microbiome

The human microbiome is the collection of microorganisms that inhabit the human body, including commensal and symbiotic microbes. The study of the microbiome and its role in disease onset has been made possible by the introduction of large-scale sequencing techniques and gene expression arrays. These techniques have increased our ability to understand the contribution of the maternal microbiome to disease in subsequent generations. For example, altered bacterial colonisation of the alimentary tract of piglets, after antibiotic and stress exposure in early life, has been associated with immune development perturbations.11 This may have particular implications for preterm children, for whom exposure to antibiotics and stress is common in early life. Already, preliminary studies of the microbiome in preterm twins have shown that an altered pattern of microbial gut colonisation precedes the development of necrotising enterocolitis.12 In humans, obesity,13 smoking14 and different modes of delivery (eg, vaginal versus caesarean)15 are common potential prenatal factors that can influence maternal and neonatal microbiomes. An altered microbiome can also contribute to epigenetic changes.16

The metabolome

The metabolome is the complete set of metabolites (compounds of low molecular mass found in biological samples) that regulate cell and tissue growth, development, survival, maintenance and responses to the environment. The potential for metabolomic profiling to provide a phenotypic signature of pathophysiology has been recognised.17 Methods to assess the metabolome rely on high-resolution analytics, including mass spectrometry, nuclear magnetic resonance spectrometry and Fourier transform infrared spectroscopy. Unlike the epigenome and the microbiome, the metabolome can be highly dynamic and is able to change in short time frames, ranging from seconds to minutes. The choice of sampling material is therefore an important consideration and a challenge. The decision on sampling material will be specific to the research question and critical to the interpretation of results. For example, blood samples reflect highly dynamic responses, but hair samples reflect prolonged exposure and can therefore provide a more stable phenotype.18 The large volume of data generated by such techniques can provide insight into interactions between metabolites, genes, transcripts and proteins.19 These data can be highly informative about mechanisms leading to disease and the impact of environmental exposures on system physiology, such as the developmental impact of prenatal exposure to the endocrine disruptor, bisphenol A.20

The potential for metabolomics platforms to be used to identify biomarkers predicting pregnancy outcome is already becoming apparent. These platforms include observations of differences in the neonatal blood metabolome across gestational ages (differences that are dependent on postnatal age at sampling21) and specific pathology and illness severity;22 a study linking the maternal hair metabolome with fetal growth restriction;18 and an ongoing prospective study for early prediction of pre-eclampsia23 (trial NCT01891240).

Challenges to -omics approaches in DOHaD research

Use of these emerging biotechnological approaches in DOHaD research shows clear promise in expanding our current knowledge of mechanisms driving intergenerational transmission of disease and heightened disease susceptibility in individuals after specific exposures in early development. While such large volumes of biological data using these -omics approaches provides enormous opportunity, some challenges remain in their application and interpretation. The first challenge relates to identifying the appropriate time for tissue sampling, given the current limited use of these approaches in this field. Healthy ranges are also yet to be established, a limitation that occurs with any advance in technology and will be overcome through public sharing of data. To establish healthy ranges, sampling from multiple time points and multiple tissues will be necessary. This information will benefit the design of future studies, in which sampling can then occur at a single time point during tissue-specific sensitive periods to yield the most reliable, valid and interpretable data. The establishment of normative ranges will also help elucidate many other current unknowns in this area, including understanding what sample sizes are needed to identify meaningful effects; understanding and predicting the stability of -omics profiles; identifying the effects of a “second hit” or multiple exposures; understanding whether the duration or timing of each exposure is important in determining outcome; and understanding whether a genetic susceptibility is needed for the intergenerational transmission of poor outcomes or whether this is a highly conserved process.

Once we have identified biomarkers or signatures predictive of poor maternal, fetal or neonatal outcomes, the next critical step is to use this information to identify how to normalise these effects. This will necessitate an understanding of how postnatal factors normalise or exacerbate the -omics profile induced by the early life environment. Longitudinal studies of twins have provided some preliminary evidence of environmental influences, exploring the stability of the epigenome across the first 18 months of life and the degree of epigenetic discordance between siblings with a shared genetic and environmental background.24 Continued longitudinal assessments of these children will increase our understanding of the role of the environment on the epigenome through life. The impact of additional exposures in pregnancies of these subsequent generations has also yet to be identified, because few studies have assessed the potential for -omics profiles to be modified beyond the second generation.2

Recommendations for future studies

We highly recommend collaborative studies that integrate data derived from multiple platforms, collected from samples throughout early development and linked to clinical health outcomes. Analysis of samples from current and planned randomised controlled trials will allow the effects of standard care and interventions to be assessed concurrently. These studies will facilitate our understanding of disease susceptibility, onset and progression to a degree that has not previously been possible.

Implications for policy and practice

Effective interventions applied at critical periods of development can substantially reduce future disease burden. The potential for this research to be translated into tangible health benefits for child health and future generations is therefore enormous, aligning with the growing demands of national health regulatory bodies to focus efforts on preventative health care. The outcomes of this research could then potentially be used by health advocates to improve policy and practice, by clinicians and health workers to promote and support healthy perinatal behaviours, and be communicated to the wider community to optimise future child health.

Information on DOHaD and early life healthy behaviours is becoming more readily available, but it is unclear whether this is being effectively communicated to the health care providers who need it most, that is, those in direct contact with women who are pregnant or planning a pregnancy. For example, surveys of general practitioners reveal that they have limited knowledge of nutritional requirements in pregnancy, and also feel uncomfortable providing this information to women due to a lack of confidence.25 Knowledge gaps such as this must be urgently addressed to optimise the health of future populations. Similarly, while the internet is teeming with websites offering advice for pregnant and breastfeeding women, these often contain inaccurate or misleading advice and conflicting information. Evidence-based online resources to which women can be directed for accurate health information are needed.

Therapeutic advances and risk factor management: our best chance to tackle dementia?

An update on research advances in this field that may help tackle this growing challenge more effectively

Increasing life expectancy has fuelled the growth in the prevalence of dementia. In 2015, there were an estimated 47 million people with dementia worldwide (including 343 000 in Australia), a number that will double every 20 years to 131 million by 2050 (900 000 in Australia).1 The global cost of dementia in 2015 was estimated to be US$818 billion.1 Low-to-middle income countries will experience the greatest rate of population ageing, and the disproportionate growth in dementia cases in these nations will be exacerbated by a relative lack of resources.

The diagnostic criteria for dementia (relabelled “major neurocognitive disorder”) of the American Diagnostic and Statistical Manual of Mental Disorders, fifth edition (DSM-5)2 include a significant decline in one or more cognitive domains that is clinically evident, that interferes with independence in everyday activities, and is not caused by delirium or other mental illness. Whether the new diagnostic label catches on remains to be seen. The most common type of dementia is Alzheimer’s disease (AD) (50–70% of patients with dementia), followed by vascular dementia (10–20%), dementia with Lewy bodies (10%) and fronto-temporal dementia (4%).3 These percentages are imprecise, as patients often present with mixed pathology.

Our discussion will focus on AD because it receives significant research attention as the most common cause of dementia. The two hallmark pathological changes associated with neuronal death in AD are deposition of β-amyloid plaques, and tau protein neurofibrillary tangles. Understanding this process has been enhanced by prospective cohort studies, such as the Australian Imaging Biomarkers and Lifestyle (AIBL) study.4 As shown in the Box, the results of this research indicate that the degree of β-amyloid deposition exceeds a predefined threshold about 17 years before the symptoms of dementia are detectable. In the absence of an alternative model, the amyloid cascade remains the most compelling hypothesis for the pathogenesis of AD. This is supported by the fact that early onset familial AD is caused by mutations in chromosome 21 that result in the production of abnormal amyloid precursor protein (APP), or by mutations in chromosomes 1 or 14 that result in abnormal presenilin, each of which increase amyloid deposition. The extra copy of chromosome 21 in Down syndrome also leads to faster amyloid deposition and the earlier onset of AD. Further, the symptoms of AD are correlated with imaging of amyloid in the living brain and with cerebrospinal fluid biomarkers that are now included in new diagnostic criteria for AD and which will enable suitable participants to be selected for trials of drugs that may prevent or modify the disease,2 in particular to determine whether anti-amyloid agents are useful for delaying or treating AD.

At present, cholinesterase inhibitors (donepezil, galantamine and rivastigmine) and the N-methyl-D-aspartate (NMDA) receptor antagonist memantine are licensed for treating AD dementia, and produce modest but measurable benefits for some patients. These medications are thought to work by increasing cholinergic signalling and reducing glutamatergic activity respectively, partially redressing neurochemical abnormalities caused by the amyloid cascade.5 More than 200 other drugs advanced to at least Phase II development between 1984 and 2014, but none has yet entered routine clinical use.6 Lack of efficacy in clinical trials may be the result of their being introduced at a rather late stage of the disease process; hippocampal damage is so profound by the time individuals present with AD dementia that attempting to slow their decline with an anti-amyloid agent may be analogous to starting statins in patients on a heart transplantation waiting list. As it provides the most compelling hypothesis for AD, the amyloid cascade remains the main target for developments in treatment. Treatment trials in people with preclinical or prodromal AD will in due course determine its validity.

Recent developments include promising results for treating prodromal AD with passive vaccines containing monoclonal antibodies directed against β-amyloid, such as solanezumab and aducanumab. This may point the way to treatments in the next decade that delay the onset of dementia in people with developing AD pathology.7,8

The identification of risk factors for AD may lead to risk reduction strategies. Recent randomised controlled trials of multidomain interventions, such as the Finnish Geriatric Intervention Study to Prevent Cognitive Impairment and Disability (FINGER) study (a 2-year program including dietary, exercise, cognitive training and vascular risk monitoring components), show that such interventions could improve or maintain cognition in at-risk older people in the general population.9 Greater risk reduction might be attained by intervening 10 to 20 years before the first clinical signs of cognitive impairment are presented. A recent review of 25 risk and protective factors associated with AD concluded that “the evidence is now strong enough to support personalized recommendations for risk reduction by increasing levels of education in young adulthood, increasing physical, cognitive and social activity throughout adulthood, reducing cardiovascular risk factors including diabetes in middle-age, through lifestyle and medication, treating depression, adopting a healthy diet and physical activity, avoiding pesticides and heavy air pollution and teaching avoidance of all potential dangers to brain health while enhancing potential protective factors”.10 These risk factors, and particularly vascular risk factors, are implicated in neurodegeneration pathology in a number of dementia processes.

While the search for effective preventive strategies and access to evidence-based pharmacological treatments and psychosocial interventions are critical, there are still delays in diagnosis and a failure to utilise existing available resources.1,3 The introduction of the federal government-funded, state-based Dementia Behaviour Management Advisory Services (DBMAS), the initiation of severe behaviour response teams, and increased funding for research should be applauded, but there needs to be greater coordination of service delivery systems for patients and carers at every stage, from prevention through to end-of-life care, and the medical profession needs to do more to ensure that all existing and trainee practitioners are well informed about what we can do for people with dementia right now.

Box –
Relationship of ß-amyloid deposition with other parameters in Alzheimer disease


Aß-amyloid = ß-amyloid; CDR = Clinical Dementia Rating. Reproduced with permission from Villemagne et al (2004).4

Repeat exposure to active tuberculosis and risk of re-infection

Clinical record

A 20-year-old woman of Indo-Fijian background who had lived in Australia for 10 years presented to the emergency department with a 3-day history of pain in the lower back and right hip. She had been coughing for 3 months and reported fevers and weight loss of 6 kg over the same period. Her medical history included treatment for latent (dormant) tuberculosis infection (LTBI) at 13 years of age with an unproblematic 6-month course of isoniazid 300 mg daily at a hospital chest clinic when her father, who lived in the same household, had sputum smear-positive pulmonary tuberculosis (TB). She had had a positive tuberculin skin test result of 15 mm before commencing treatment for LTBI, and had been given the BCG vaccine as a baby. Chest x-rays at the beginning and end of her treatment for LTBI had been normal. Her older sister, who also lived in the same household, was diagnosed with sputum smear-positive miliary TB 16 months after the father was diagnosed with TB (and 10 months after our patient had completed treatment for LTBI). Although our patient lived in the same household as her sister at that time, she did not receive a repeat course of preventive TB treatment. Six years after the sister was diagnosed with TB, our patient developed the symptoms described above.

When our patient presented at the emergency department, she had a heart rate of 120 beats/min, was normotensive, and was febrile at 38.3°C. A chest x-ray showed bilateral pulmonary nodular opacities (Box 1). Magnetic resonance imaging of the lumbar spine 2 days later revealed signs of early osteomyelitis with subchondral bony oedema and contrast enhancement of the right sacroiliac joint (Box 2). Mycobacterium tuberculosis DNA was detected in two sputum samples by polymerase chain reaction. We diagnosed our patient with pulmonary and osseous TB and commenced anti-TB treatment: isoniazid, rifampicin, pyrazinamide, ethambutol and vitamin B6 backup.

Two weeks later, M. tuberculosis complex was isolated from a sputum culture and was found to be fully sensitive to first-line (standard) anti-TB drugs. The patient’s overall condition improved rapidly on treatment and the opacities seen on her chest x-ray cleared. Two weeks into treatment, however, the patient developed nausea and vomiting, and blood tests showed an increase in liver transaminase levels, supporting the clinical suspicion of drug-induced hepatitis. After all anti-TB medications were withdrawn, the patient felt better within 2 days and her liver transaminase levels were normal 10 days later. The anti-TB drugs were re-introduced sequentially and additively in escalating doses following international recommendations for the order of re-introduction,1 starting with ethambutol 800 mg daily and an increasing dose of rifampicin (up to 600 mg daily) over 4 days, adding isoniazid over the next 5 days (up to 300 mg daily) and finally adding pyrazinamide (up to a dose of 1500 mg daily) over 3 days. Two days after re-introduction of full dose pyrazinamide (and thus on full TB treatment), the patient experienced nausea, her liver transaminase levels increased again, and we suspected pyrazinamide as the cause of drug-induced hepatitis. After all anti-TB medications were again withdrawn and her liver transaminase levels again normalised, all anti-TB drugs excluding pyrazinamide were restarted at full dose. However, 16 days later, the patient again developed hepatitis. Subsequent treatment with rifampicin, moxifloxacin, ethambutol and pyrazinamide, but without isoniazid, was tolerated well by the patient without laboratory evidence of hepatitis.

Genotyping of the M. tuberculosis organisms by the 24-loci mycobacterial interspersed repetitive units variable number tandem repeat (MIRU-VNTR) method2 showed that the patient, her father and her sister had indistinguishable genotypes, suggesting that all had been infected with the same organism.

Contacts of patients who have active TB are routinely screened in countries with a low incidence of TB such as Australia. If they have evidence of LTBI, but not active TB, they are usually offered a course of preventive TB treatment with isoniazid daily for 6–9 months. Isoniazid is estimated to be up to 90% effective in eradicating LTBI,3 but it does not offer protection from subsequent re-infection.

This case emphasises the importance of repeating a course of preventive TB treatment with each significant new exposure. It is highly likely that our patient was re-infected with TB through contact with her sister (who was sputum smear-positive and likely to have been infected by the father), but we cannot exclude with certainty that active TB developed as a consequence of failed LTBI treatment and re-activation of TB after the first exposure. In both scenarios, the patient’s M. tuberculosis organism would be the same as the father’s. It is also possible that all three family members (or at least the father and the sister) were infected at the same time. Treatment of LTBI and full anti-TB treatment do not offer protection from subsequent re-infection with M. tuberculosis and individuals do not develop immunity to TB after exposure.4 Thus, treatment of LTBI is not a priority in countries with a high incidence of TB, ongoing transmission and a high risk of re-infection.5

In patients with previous evidence of LTBI, repeat testing with a tuberculin skin test or blood test (interferon gamma release assay) is not helpful to assess the risk of re-infection, as these tests often remain positive even after a full course of LTBI treatment.6,7 In people with repeat contact with active TB, the decision to give a course of preventive TB treatment should be informed by an assessment of the risk that transmission occurred (taking into account the infectiousness of the index case with active TB, and the duration and proximity of contact) and factors that affect the risk of TB re-activation (eg, immunosuppression or use of biological agents such as infliximab) in the person under consideration for preventive TB treatment.

Our patient developed isoniazid-induced hepatitis when she was on full TB treatment, while she previously had no problems with preventive isoniazid monotherapy. Patients with low-acetylator status of N-acetyltransferase 2 have a significantly increased risk of developing drug-induced hepatitis on anti-TB drugs (our patient was not tested for this).8 The concurrent exposure to drugs that induce cytochrome P450 enzymes (including rifampicin, which is routinely prescribed for TB) could have increased the risk of isoniazid-induced hepatotoxicity.9 This needs to be kept in mind when patients who tolerated isoniazid preventive therapy well develop hepatitis on full anti-TB treatment.

Lessons from practice

  • It is possible for a person to be re-infected with tuberculosis (TB), even after a completed course of preventive TB treatment.

  • A person with repeat significant exposure to active TB should be considered for repeat preventive TB treatment.

  • Isoniazid could be the cause of drug-induced hepatitis in a person on multi-drug therapy for active TB, independently of whether isoniazid was previously tolerated well by the same person as monotherapy for TB prevention.

Box 1 –
Chest x-ray showing bilateral nodular opacities of the lungs

Box 2 –
Magnetic resonance image of the sacroiliac joints


Note the subchondral bony oedema and contrast enhancement of the right sacroiliac joint (arrow).

Influenza vaccine effectiveness in general practice and in hospital patients in Victoria, 2011–2013

The 9th edition of the Immunisation Handbook sponsored by the National Health and Medical Research Council maintained that influenza vaccines were 70%–90% effective in preventing influenza when the match between vaccine strains and circulating strains was good.1 Even when published in 2008, this was probably a generous assessment of the evidence. The 10th edition, published in 2013, maintained that influenza vaccines were 59% effective in preventing influenza in healthy adults and at least as effective in children, although in some years there was no evidence of any benefit.2

Although not explicitly stated in the handbooks, these estimates referred to efficacy in protecting against influenza infections managed in the community, the majority of which are relatively mild. While protection against the mild disease seen in primary care might be modest, it is nevertheless possible that the protection provided against more serious disease, including confirmed influenza infections requiring admission to hospital, might be greater.

In Victoria, two surveillance schemes make it possible to investigate whether there was any major difference in vaccine effectiveness estimates in community and hospital patients. The Victorian Sentinel Practice Influenza Network (VicSPIN) is a group of sentinel general practitioners in Melbourne and regional Victoria, operating since 1997, that has provided estimates of influenza vaccine effectiveness for protection against laboratory-confirmed influenza since 2003.3 The Influenza Complications and Alert Network (FluCAN) is a national hospital-based sentinel surveillance scheme that has provided estimates of influenza vaccine effectiveness since 2010.4 About 40% of patients registered by this scheme were reported by Victorian hospitals.

We compared influenza vaccine effectiveness estimates for 3 years in Victoria, basing our analysis on data from these two sentinel surveillance systems. Each scheme has published separate vaccine effectiveness estimates for the three study years.510

Methods

We reviewed data for the influenza seasons of 2011–2013 from the general practice and hospital-based schemes. Vaccine effectiveness was estimated by comparing the vaccination status of influenza cases (patients with laboratory-confirmed influenza) with that of non-cases (patients for whom influenza test results were negative). The use of test-negative controls is an established variation of the case–control study design.11

VicSPIN uses a community-based, test-negative design. Sentinel GPs were located in metropolitan Melbourne, Geelong and regional Victoria, and patients were recruited by sentinel GPs when they presented with symptoms consistent with influenza infection. At presentation and before their case status was known, patients were swabbed at the discretion of the GP. Patients with positive influenza test results were defined as cases, and those with negative results as non-cases or controls. Vaccine effectiveness was calculated as 1 − odds ratio (OR), and expressed as a percentage, where the OR compared the odds of vaccination for cases with the odds for controls. Logistic regression was used to adjust estimates for age group (0–17 years, 18–64 years, ≥ 65 years), comorbidity (yes v no), and time within influenza season (number of weeks from peak). Estimates were restricted to patients vaccinated at least 14 days before the onset of symptoms, accepted as the time needed to produce protective antibodies, and to those presenting within 7 days of symptom onset, as data from shedding studies suggest that influenza virus detection declines after 7 days.12 On the assumption that vaccine effectiveness would not be detectable when influenza virus was not circulating, we also restricted our analyses to patients who presented during the influenza season, as defined by positive case ascertainment and sentinel surveillance of influenza-like illness.13 Year was added as a covariate to the regression analysis for the combined 3-year estimate. Although the number of sentinel practitioners participating in the scheme in different years varied slightly, the approach to surveillance remained constant. Vaccination status was determined by patient or GP report, with vaccine date requested as a proxy for a register record. All samples were tested by polymerase chain reaction (PCR) assays at the Victorian Infectious Diseases Reference Laboratory, a designated National Influenza Centre of the World Health Organization. The assay detected influenza A(H3N2), influenza A(H1N1), influenza B and influenza C viruses. Two patients with influenza C were excluded from the analysis.

FluCAN is a sentinel surveillance system that receives data from 17 Australian hospitals. It provides data on the number of cases admitted with severe influenza A or B confirmed by PCR nucleic acid assays in the reporting hospitals’ laboratories. We based our analysis on the four Victorian hospitals reporting to FluCAN (the Alfred Hospital, Monash Medical Centre, University Hospital Geelong, the Royal Melbourne Hospital). Only adults (over 18 years of age) were included in the study. The vaccination status of cases was compared with that of controls (1:1); each selected control was the next patient after each case who presented with an acute respiratory infection and a negative influenza test result. Vaccination was defined as the patient having received the inactivated influenza vaccine at least 14 days before presentation, and the patient’s status was based on patient report and medical record. Vaccine effectiveness was estimated in the same way as for the community patients, but adjusted for potential confounders using conditional logistic regression to account for the matched design. Binary covariates included in the model were: being over 65 years of age, chronic comorbidities, Indigenous Australian status, and pregnancy. Because the control group was frequency-matched by the date of admission using the incidence density control selection strategy, we did not adjust or stratify estimates for time. We conditioned the analysis on the basis of hospital site. For the pooled analysis of all three seasons, the analysis accounted for year by adjusting standard errors with the Huber–White robust sandwich estimator.

During the years included in our study, FluCAN did not collect control data for people aged 0–17 years. We estimated vaccine effectiveness for all ages from the VicSPIN data, but, to improve the comparability of results, we also calculated vaccine effectiveness for the VicSPIN data after excluding the 0–17-year-old age group. All vaccines used in Australia during the study period were trivalent inactivated vaccines. We did not collect information on vaccine manufacturer, and assumed that all vaccines performed equivalently.

Ethics approval for FluCAN data collection and reporting was obtained from the Human Research Ethics Committees of all participating hospitals and the Australian National University. VicSPIN data were collected, analysed and reported under the legislative authorisation of the Victorian Public Health and Wellbeing Act 2008 and the Public Health and Wellbeing Regulations 2009, and therefore did not require formal Human Research Ethics Committee approval.

Results

In the VicSPIN surveillance system, before exclusion of patients vaccinated within 14 days of symptom onset or presenting outside the influenza season, 1680 patients for whom vaccine status by age group was known were available for the three seasons 2011–2013. Their number varied from 354 in 2013 to more than 600 in each of the two earlier years (Box 1). Eighty-five per cent of swabbed patients were from Melbourne or Geelong, the locations of the Victorian sentinel hospitals. Most patients consulting a sentinel GP were aged between 18 and 64 years. Older people were under-represented, but more than 70% were vaccinated each year (Box 1). For the 3 years combined, 5% of patients aged 0–17 years reported a comorbidity, compared with 16% of those aged 18–64 years and 48% of those aged 65 years or more. Comorbidity status was not recorded for 12% of patients.

In the FluCAN surveillance system, 1289 patients were enrolled in Victorian hospitals for whom vaccine effectiveness estimates could be made for the three seasons 2011–2013. The number of participants varied from 271 in 2011 to 737 in 2012. The majority of patients admitted to hospital were at least 65 years old. For the 3 years combined, 76% of adults aged 18–64 years had a comorbidity, compared with 91% of those aged 65 years or more. The estimated vaccine coverage varied during the 3 years between 76% and 82% in those aged at least 65 years, and between 38% and 44% in adults aged 18–64 years.

Information on Indigenous status was not recorded in the VicSPIN data. Fifteen Indigenous patients (nine influenza-positive) were recorded in the FluCAN data. VicSPIN included six pregnant patients, while FluCAN recorded 26 (including 19 who were influenza-positive).

Estimates of protection afforded by influenza vaccines were similar in both schemes. On the basis of the VicSPIN data, vaccine effectiveness against influenza for all age groups managed in general practice varied between 37% in 2011 (when the confidence interval included zero) and 61% in 2013 (Box 2). Vaccine effectiveness estimates changed by no more than four percentage points when the 0–17 years age group was omitted from analysis of the VicSPIN dataset. The pooled estimate for the 3 years was 50% (95% CI, 26%–66%). When the youngest age group was excluded in order to improve comparability with the data for hospitalised patients, the pooled vaccine effectiveness was 51% (95% CI, 27%–67%) (Box 2).

The estimates based on the data from the Victorian sentinel hospitals reporting to FluCAN varied between 35% in 2012 and 52% in 2013, with a pooled estimate of 39% (95% CI, 28%–47%). The crude and adjusted VicSPIN estimates were very similar to those of FluCAN, apart from in 2012. Point estimates were highest in both settings for 2013, and confidence intervals for each estimate included zero in 2011. The point estimates were higher in the general practice than the hospital setting in two of the three years when a significant protection could be demonstrated, but the confidence intervals for the two schemes overlapped in each year. The difference between the pooled vaccine effectiveness in general practice and hospital settings was 12% (P = 0.23).

Discussion

We found that the estimated protection provided by inactivated influenza virus vaccines, after adjustment for important confounders, was slightly higher in general practice than in hospital-based studies, but with overlapping confidence intervals. All FluCAN and most VicSPIN patients were recruited from metropolitan Melbourne and Geelong; very ill patients from regional Victoria can be transferred to any of the FluCAN hospitals.

Our estimates are similar to those found by other studies of similar design that have used PCR-confirmed influenza as the outcome,14 and suggest that older vaccine effectiveness estimates based on serology data15 or non-specific endpoints16 may have overestimated protection.

By targeting populations at risk of severe outcomes, the national immunisation program has assumed that the vaccine protects against severe outcomes associated with laboratory-confirmed influenza, such as hospitalisation, as well as influenza infections managed in the community. Our data support this view, while the small differences in the point estimates of vaccine effectiveness in community and hospital patients suggest that the influenza vaccine prevents hospital admission by preventing symptomatic infection rather than by attenuating the severity of illness. The difference in vaccine effectiveness may reflect the population at risk of hospitalisation, which includes people more likely to be elderly and to have comorbidities, characteristics that may be associated with impaired vaccine-induced immunity.17

A limitation of this study was the potential for selection bias, given that clinicians (GPs or hospital doctors) had discretion as to which patients were swabbed. However, we have shown there was no association between swabbing and vaccine status in VicSPIN patients during 2011–2014. In an unpublished study of 3649 patients with influenza-like illness who presented to VicSPIN GPs during the influenza seasons of 2011–2014, 2224 samples (64%) were submitted for testing. In the crude analysis, age, sex and year were associated with testing, but vaccination status was not. After adjustment, none of the variables were statistically associated with testing (Lisa McCallum, epidemiologist, Hunter New England Health; personal communication, 20 October 2015). We have not explored this association in the FluCAN dataset.

The selection of patients for inclusion in both VicSPIN and FluCAN distinguish them from surveillance schemes reporting the same outcomes, such as those in the United States18 and New Zealand,19 although the vaccine effectiveness estimates were broadly similar.

Another limitation of our study was that the two surveillance systems collected different covariate data, limiting combined data reporting. Details about covariates have been reported elsewhere.510 Influenza subtyping was incomplete in the FluCAN data, but the match between circulating and vaccine strains in the VicSPIN data has been previously explored.20 In all 3 years of our study, circulating influenza A(H1N1) and influenza B strains were matched to the vaccine strains. The influenza A(H3N2) subtype was matched in 2011, but was partially mismatched in the following two years.

A further substantial limitation of this study was that it was underpowered to detect small differences, if they existed, in the two clinical settings.

Vaccine status was incompletely reported in the FluCAN system, but ascertainment has improved in recent seasons. In particular, previous sensitivity analyses using multiple imputation have found similar estimates for vaccine effectiveness when comparing collected and imputed missing data; this suggests that missing data are unlikely to significantly bias estimates of vaccine effectiveness.8 A date of vaccination was provided for at least 85% of VicSPIN patients during this period.

Despite these shortcomings, published results from the VicSPIN studies are consistent with estimates of protection based on meta-analyses of community trial data.21,22 No reviews of efficacy in preventing hospital admission have been published because there have been no trials examining this outcome. However, in schemes that recruit patients from the same defined population in the same year, such as those conducted in Navarra (Spain) and Auckland (New Zealand), vaccine effectiveness estimates have been reported to be similar for hospital and community patients. For instance, vaccine effectiveness in Navarra during 2010–2011 was 75% (95% CI, 61%–84%) in preventing outpatient influenza cases, and 60% (95% CI, 37%–75%) in preventing influenza-associated hospitalisations.23 In Auckland, interim estimates of vaccine effectiveness against laboratory-confirmed influenza for 2014 were 67% (95% CI, 48%–79%) for presentation to a sentinel GP and 54% (95% CI, 19%–74%) for hospitalisation.24 While point estimates of protection in this and in two other studies where patients in community and hospital settings were recruited from the same population were higher for community than for hospital patients, the comparisons are illustrative rather than exhaustive; further, the confidence intervals for vaccine effectiveness estimates overlapped.

A randomised controlled trial of vaccine efficacy in averting hospital admission for laboratory-confirmed influenza might help to resolve the question. To account for annual variation in influenza circulation and vaccine effectiveness, however, this would require a study including tens of thousands patients conducted over more than one influenza season. As well as being extremely expensive, such a trial would not be ethical in view of current recommendations that all people aged 65 years and over, the age group most commonly admitted to hospital for influenza infection, receive the influenza vaccine.4,810 This emphasises the importance of observational studies in this context.

The Australian and international surveillance systems provide continuous data that support the effectiveness of the national influenza immunisation program. While the magnitude of benefit may not be as great as earlier studies had suggested, and while variation from year to year is acknowledged, influenza vaccination remains an important intervention for protecting vulnerable patients, as shown by our pooled analyses; this is especially true in the FluCAN setting, where a large majority of patients reported a comorbidity. Further evidence that protection against confirmed influenza infection managed in the community is similar to protection against hospitalisation will require additional studies in which patients in both clinical settings are drawn from exactly the same population.

Box 1 –
Vaccination status by age group and case/non-case status for hospitalised and community patients in two sentinel surveillance schemes, Victoria, 2011–2013

Year

Age group

FluCAN*vaccinated patients/all patients (%)


VicSPINvaccinated patients/all patients (%)


Influenza-positive

Influenza-negative

Influenza-positive

Influenza-negative


2011

0–17 years

2/78 (3%)

4/123 (3%)

18–64 years

19/60 (32%)

51/116 (40%)

9/96 (9%)

58/320 (18%)

≥ 65 years

23/34 (68%)

49/61 (80%)

5/6 (83%)

13/19 (68%)

All

42/94 (45%)

100/177 (56%)

16/180 (9%)

75/462 (16%)

2012

0–17 years

2/79 (3%)

6/93 (6%)

18–64 years

45/141 (32%)

103/274 (38%)

33/171 (19%)

85/289 (29%)

≥ 65 years

103/153 (67%)

129/169 (76%)

15/18 (83%)

27/34 (79%)

All

148/294 (50%)

232/443 (52%)

50/268 (19%)

118/416 (28%)

2013

0–17 years

1/17 (6%)

4/50 (8%)

18–64 years

27/106 (25%)

36/84 (43%)

10/59 (17%)

65/199 (33%)

≥ 65 years

26/37 (70%)

44/54 (82%)

0/3 (0%)

21/26 (81%)

All

53/143 (37%)

80/138 (60%)

11/79 (14%)

90/275 (33%)


FluCAN = Influenza Complications Alert Network; VicSPIN = Victorian Sentinel Practice Influenza Network. * Victorian hospital data only. † Excluded because no controls were available for this age group in these years.

Box 2 –
Vaccine effectiveness against influenza, as indicated by hospital admission or presentation to a general practitioner in Victorian sentinel surveillance systems, 2011–2013

Year

Effectiveness against hospital admission with laboratory-confirmed influenza to a Victorian sentinel hospital (FluCAN)


Effectiveness against presentation with laboratory-confirmed influenza to a sentinel general practitioner (VicSPIN)


Crude (95% CI)

Adjusted (95% CI)

Crude (95% CI)

Adjusted (95% CI)

Adjusted (95% CI)*


2011

39% (−1% to 64%)

40% (−6% to 66%)

50% (11%–72%)

37% (−34% to 70%)

35% (−44% to 71%)

2012

18% (−11% to 40%)

35% (8%–54%)

42% (16%–60%)

52% (19%–71%)

53% (19%–72%)

2013

57% (31%–73%)

52% (19%–71%)

67% (34%–83%)

61% (1%–85%)

65% (5%–87%)

Pooled: 2011–2013

34% (9%–52%)

39% (28%–47%)

47% (31%–60%)

50% (26%–66%)

51% (27%–67%)


* Excludes patients aged 0–17 years.

A survey of Sydney general practitioners’ management of patients with chronic hepatitis B

In Australia, the prevalence of chronic hepatitis B (CHB) infection has increased over the past decade, with an estimated 218 000 Australians living with the disease.1 The annual number of deaths attributable to CHB is also expected to rise from 450 in 2008 to 1550 in 2017.2 Cost-effective treatments to reduce morbidity and mortality are available;24 however, up to 44% of infected Australians remain undiagnosed1,5 and only 2%–13% of those infected are receiving adequate treatment.2,6

The highest prevalence of CHB in New South Wales is in the Sydney and South Western Sydney Local Health Districts (LHDs), with respective estimated prevalence rates of 1.67% and 1.61% (the NSW average is 1.11%).7 In these LHDs, a large proportion of the population was born in countries with an intermediate or high prevalence of CHB.8,9 To relieve the pressure on specialist liver services, the National Hepatitis B Strategy 2014–20175 recommends an increased role for general practitioners in the management of CHB. We therefore examined the CHB assessment and management practices of GPs in the two LHDs, and the confidence that these GPs have in different models of care.

Methods

We used a descriptive cross-sectional study design to survey GPs about case management. A questionnaire (Appendix) was developed by a steering group that included hepatologists, nurses, public health physicians, an infectious diseases physician and a GP. The survey also included a separate section on contact management; this is not discussed in this article.

Eligible GPs were those practising in Sydney LHD (SLHD) or South Western Sydney LHD (SWSLHD) who had had at least one patient aged 18 years or over who had been notified as having CHB to the Public Health Unit under the NSW Public Health Act 2010 between 1 June 2012 and 31 May 2013. A survey was posted to each GP, and those who had not returned it within 4 weeks received a telephone call and another copy of the survey. GPs were excluded if they no longer practised at the same location.

Returned surveys were coded and the data entered into Excel 2010 (Microsoft) and analysed with Excel 2010 (Microsoft), SAS Enterprise Guide 6.1 (SAS Institute) and Stata 10.0 (StataCorp). Blank responses were coded as “unknown”. Demographic information for all GPs in SLHD and SWSLHD was obtained from the Inner West Sydney and South Western Sydney Medicare Locals.

Human research ethics approval was granted by the SLHD Ethics Review Committee (RPAH Zone), protocol number X13-0035.

Results

Completed questionnaires were returned by 123 of 213 eligible GPs (57.7% response rate), with no statistically significant difference in response rate between SLHD and SWSLHD GPs (P = 0.41).

There were significant differences in sex, age distribution, and type of practice between the study participants and those of all GPs in SLHD and SWSLHD (Box 1). The average number of patients with CHB notified by responding GPs during the study period was 1.88, compared with 1.96 for non-responders (P = 0.73). Most GPs (97 of 123, 78.9%) estimated that they cared for 50 or fewer patients with CHB. GPs from SWSLHD were more likely than SLHD GPs to have cared for more than 50 patients with CHB (odds ratio [OR], 3.24; 95% CI, 1.08–9.68).

GPs were asked how confident they were about different aspects of CHB assessment and management (Box 2). GPs who reported that they were “not very” or “not at all” confident were more likely than GPs who were “very” or “reasonably confident” to have cared for 50 or fewer patients (OR, 1.26; 95% CI, 1.14–1.40).

Box 3 summarises responses by GPs who were asked how comfortable they would be managing a patient with CHB in a number of different scenarios. GPs who were at least reasonably confident without specialist or hepatitis nurse input were more likely than those who were not to have cared for more than 50 patients with CHB (OR, 4.68; 95% CI, 1.28–17.16).

Discussion

This is the largest survey of Australian GPs to have examined their CHB assessment and management practices, and their views about specific models of care. Our results have important implications for service development. We found that GPs were generally confident about diagnosing and managing CHB, and were most comfortable with a model of care that included an initial specialist review. However, a significant number of GPs were not confident about managing CHB, particularly without the support of a specialist. If there is to be a successful shift toward a CHB model of care in which primary health care plays an increased role,5 this problem will need to be addressed by policy makers and medical educators. A framework that provides GPs with the support and resources necessary for appropriate CHB management is needed.

Most GPs felt confident about CHB management, but it is notable that almost one-fifth were “not very” or “not at all” confident. These GPs were more likely to have had a lower CHB patient load, and may thus have had less experience in this area. Previous surveys of Australian GPs have identified knowledge gaps about different aspects of CHB management.8,10,11 Our findings are consistent with these reports, but also indicate that a supportive CHB model that enables GPs to easily access appropriate resources and specialised advice is required.

The current Australian CHB model of care is focused on specialist hepatological care; however, these services are facing huge demands, and it has been suggested that increased involvement of GPs is needed to deal with the growing burden of CHB,2,5,12 as well as integrated nursing models and an exploration of the role of nurse practitioners.5 The majority of surveyed GPs were most comfortable with a care model that included initial review by a specialist and continuing GP management, with less support for a model in which there was no specialist input, and a reluctance to accept review by a hepatitis clinical nurse consultant alone. The stated preference of GPs in our study for specialist input in CHB management has implications for future health service planning. If nursing support for GPs is to be successful in an alternative CHB model of care, background specialist support needs to be clearly promoted to gain the confidence of GPs and to optimise the management of CHB.

Our study has limitations. While the response rate compares favourably with other recent written GP surveys about CHB,11,13 the possibility of response bias cannot be excluded. The significant difference in sex, age distribution, and type of practice between study participants and all GPs in the surveyed LHDs affects the external validity of our findings. While the steering group provided GP input into questionnaire development to improve its face validity for GPs, we did not test the questionnaire on another group of GPs; the applicability of the instrument to other settings is therefore unclear. Closed-ended and multiple-choice questions were used to facilitate the comparability of responses; however, their use may have prevented GPs from expressing other views.

This study identified that some GPs working in areas where the prevalence of CHB is high lack confidence about managing CHB. GPs in areas where CHB is less prevalent may encounter these problems to a greater extent, but further research is necessary to confirm this assumption and to thereby inform educational programs and service planning. As the CHB burden in Australia rises and the capacity of specialist liver services is tested, a new model of care focusing on primary health care needs to be developed, but must be considered carefully, noting the clear preference of GPs for specialist support. Our results suggest that well designed and targeted support programs that include specialist support are needed as part of a model of care which ensures that GPs feel confident about managing CHB.

Box 1 –
Demographic characteristics of the study participants (n = 123) and of all general practitioners in the Sydney and South Western Sydney Local Health Districts (n = 1135)

Study participants

All GPs

P (χ2 test)


Sex

< 0.001

Female

31.7%

40.3%

Male

67.5%

59.7%

Not recorded

0.8%

0

Age group

< 0.001

< 30 years

0

0

30–39 years

10.6%

6.2%

40–49 years

26.0%

16.6%

50–59 years

32.5%

18.2%

≥ 60 years

30.1%

22.2%

Not recorded

0.8%

36.7%

Local Health District

NA

Sydney

48.0%

South Western Sydney

52.0%

Type of practice

< 0.001

Solo

35.8%

19.0%

Group

63.4%

80.8%

Not recorded

0.8%

0.3%


NA = not applicable.

Box 2 –
Confidence of general practitioners (n = 123) about different aspects of the assessment and management of patients with chronic hepatitis B (CHB)

Very confident

Reasonably confident

Not very confident

Not at all confident

Unknown


Identifying patients at risk of CHB

49.6%

48.8%

1.6%

0

0

Screening patients at risk of CHB

52.0%

45.5%

1.6%

0

0.8%

Ordering appropriate tests for diagnosing CHB

57.7%

39.0%

2.4%

0

0.8%

Interpreting hepatitis B serology and DNA results

43.1%

47.2%

7.3%

1.6%

0.8%

Managing patients with CHB

22.8%

56.1%

17.9%

1.6%

1.6%

Undertaking surveillance of liver cancer

30.9%

57.7%

8.9%

1.6%

0.8%

Referring for fibroscan

12.2%

35.8%

35.0%

16.3%

0.8%


Box 3 –
Confidence of general practitioners (n = 123) about managing patients with chronic hepatitis B in various models of care

Very

Reasonably

Not very

Not at all

Unknown


With no specialist input

8.9%

48.0%

29.3%

12.2%

1.6%

Initial referral to a specialist for assessment, then managed by GP

43.1%

45.5%

8.9%

0.8%

1.6%

Initial referral to a specialist for assessment, then managed by GP with support from a hepatitis clinical nurse consultant

37.4%

45.5%

9.8%

5.7%

1.6%

Initial review by a hepatitis clinical nurse consultant, then managed by GP

18.7%

40.7%

22.8%

16.3%

1.6%


Using a multidisciplinary approach to combat the burden of asbestos-related disease

An update from the Asbestos Diseases Research Institute

Australia was the world’s highest per capita consumer of asbestos in the previous century. As such, it is considered to be a sentinel site for observing, over time, the deleterious human health, environmental, economic and social effects associated with high levels asbestos exposure.1 The increasing awareness of the dangers of asbestos among asbestos workers in Australia and the public request for disease-oriented research resulted in the establishment in 2009 of the Asbestos Diseases Research Institute (ADRI), housed in the Bernie Banton Centre on the campus of the Concord Clinical School in Sydney.

The ADRI’s most important mission is to improve the grim outlook for patients with asbestos-related diseases. It was decided early on to adopt a multidisciplinary approach with the development of a research program concentrating on epidemiology and prevention of asbestos-related diseases; drafting guidelines for the diagnosis and treatment of malignant pleural mesothelioma (MPM); and establishment of a biobank for research into the biology of mesothelioma, to support the search for novel treatment approaches.

An essential tool for tracking the national mesothelioma epidemic was the re-establishment in 2010 of the Australian Mesothelioma Registry (AMR). The AMR collects fast-track notifications of newly diagnosed mesothelioma cases across the country and invites patients/families to provide information about asbestos exposure. The AMR is a collaborative arrangement between Safe Work Australia, Comcare and the Cancer Institute NSW, with collaboration from the ADRI, Monash University, the University of Sydney, the Hunter Research Foundation, and state and territory cancer registries. ADRI analysis of AMR data suggests that the malignant mesothelioma epidemic is slowing, but the number of older patients diagnosed with MPM is projected to increase until 2020. An increase in the incidence of malignant peritoneal mesothelioma among men up to 2025 is also projected.

In 2010, the ADRI convened a multidisciplinary national team of 50 mesothelioma experts and organised a detailed review of the world literature. Critical appraisal of 1110 publications led to 40 recommendations and 23 clinical practice points. The guidelines were approved by the National Health and Medical Research Council and published in 2013.2 These formed the basis of an information booklet for patients and carers drafted in cooperation with Cancer Council Australia.3

Shortly after the ADRI’s establishment, a biobank was set up, supported by an equipment grant from the Cancer Institute NSW and corporate funding. The ADRI biobank has focused on the prospective collection of optimally preserved (fresh-frozen) tissue samples and blood from patients and control individuals, and represents Australia’s largest repository of mesothelioma specimens. Fresh-frozen MPM samples have contributed to an intercontinental effort, led by The Cancer Genome Atlas, to picture the most important genetic changes in MPM, leading to a better understanding of the fundamentals of malignant mesothelial growth. Researchers at the ADRI have also made extensive use of formalin-fixed tissues archived by thoracic surgeons at Royal Prince Alfred Hospital. Comparison of tumour and control tissues revealed major changes in the expression of microRNAs, a class of non-coding gene regulators frequently lost in cancer. These changes have potential diagnostic, prognostic and therapeutic implications.

ADRI researchers showed that levels of microRNA-16 (miR-16), a gene known for its tumour suppressor activity, are significantly reduced in mesothelioma tissues. This observation led to additional laboratory experiments using mesothelioma cell cultures and mesothelioma xenograft tumour-bearing mice. In both models, the addition of miR-16 mimics, synthetic versions of these short gene regulators, was able to halt tumour growth.4 The translation into the clinic was quickly made and a dose-finding (phase I) study was initiated at the end of 2014. This trial is using miR-16-based mimics packaged in nanocells, a unique delivery system developed by Sydney-based biotech company EnGeneIC. The nanocells are targeted with an antibody against the epidermal growth factor receptor. A major clinical response observed in the study — the first to be reported in a patient treated with a microRNA-based therapy — provided a clear indication that the new treatment concept is worth continued investigation, and a phase II study is in preparation.5

In a little over 6 years, the ADRI’s focus on epidemiology, biobanking, guidelines, and research into the basic biology of asbestos-related diseases has led to rapid clinical translation. It is a good example of how, with sufficient investment, a relatively small, disease-oriented research institute can produce prominent research outcomes within a relatively short time.

Asbestos exposure: challenges for Australian clinicians

The unique properties of asbestos that still make it valuable for industry make it extremely hazardous to health

Due to the extensive past use of asbestos in Australia, known exposure is common and causes anxiety, especially because of the acknowledged increased risk of thoracic malignancies. With the increasing use of computed tomography for routine diagnostic purposes, more people are being identified with pleural plaques from minor asbestos exposure. This has led to increased concerns about the risks of more serious asbestos-related diseases (ARDs) developing, and has resulted in an increased number of diagnostic tests being performed, even though the presence of pleural plaques is not as such a risk factor for (pleural) malignant mesothelioma (MM) or bronchogenic cancer.1 Nevertheless, anxiety2 and the inability to reduce MM risk following exposure3 or to halt progression of established asbestosis result in significant health care problems and expenditure.

Although overall rates of MM in Australia have levelled off at around 50 per million per annum in men and tenfold less in women,4 the pattern of exposure of patients with MM is changing.5 Three waves of disease have been described: disease resulting from exposure to asbestos in the mining and milling of ore and the manufacturing of asbestos products; disease among people who have used asbestos products; and disease among those engaged in the repair, renovation and demolition of buildings.6 Landrigan also predicted disease resulting from serious environment exposure among residents, tenants and users of these buildings. These will continue to evolve. Since prohibition of the production and importation of asbestos in Australia in 2004, patterns of workforce and domestic exposure have further changed. Increasingly, claimants are presenting with MM arising solely from domestic exposure.7

Pleural plaques — the most common benign ARD — have minimal effect on lung function. However, plaques calcify with age and become more readily visible radiographically.

While there is no evidence that early diagnosis improves the survival of people with benign asbestos-related pleural diseases, asbestosis or MM, low-dose (albeit high-cost) computed tomography-based detection of early stage lung cancer in heavy smokers has been demonstrated to improve their survival, resulting in the establishment of screening programs.8 The level of risk justifying participation in such programs is yet to be established.

Asbestosis also remains a problem because it cannot be distinguished on clinical or pathological grounds from diffuse interstitial pulmonary fibrosis of other or unknown cause, other than on the basis of evidence (historical, radiological or pathological) of asbestos exposure.911 As exposure to asbestos in the community declines, it will be increasingly unlikely that clinicians will be mindful of the condition and diligent in taking an asbestos exposure history. There is still no treatment shown to be effective for asbestosis.

Lung cancer and MM remain the outcomes of asbestos exposure which are most feared in the community. As there is no exposure threshold for either asbestos or smoking in causing lung cancer, and because smoking and asbestos interact in lung cancer causation, it is difficult to attribute disease solely to asbestos unless an exposed patient has never smoked. The principles of treatment and prognosis of asbestos-related lung cancer are identical to those of lung cancer in non-asbestos-exposed patients, with special consideration of lung function in the assessment of fitness for surgical resection.

Epidemiological observations have shown that the risk of MM is doubled in first-degree relatives of index cases,12 leading to a need to understand the mechanism of such inheritance that could provide an understanding of the molecular changes in the process of carcinogenicity in general. MM has also become more readily and accurately diagnosed with cytology,9 reducing the need for more invasive diagnostic procedures. MM remains universally fatal, with a median survival of 9–12 months, and epithelioid disease is the least rapidly progressive.13 Most patients present with advanced disease, and palliative cytotoxic chemotherapy has been the mainstay of treatment for the past 15 years, prolonging survival modestly in selected patients.14 A recent randomised clinical trial reported a survival benefit from the addition of a monoclonal antibody targeting vascular endothelial growth factor,15 and there are early reports of responses to immunotherapies targeting the checkpoint blockade molecules cytotoxic T lymphocyte antigen 4 and programmed death 1. Immunotherapies currently provide the most promise for new treatment advances.

Fortunately, in the face of an ongoing ARD burden, liability issues in common law damages claims have largely been resolved across Australia, and most people with disabling ARD are compensated. However, workers’ compensation schemes for ARD vary among the states — there is still a disparity in the awards of general damages (for pain and suffering) in the various jurisdictions such that there is a strong case to harmonise the approach nationally.

“Sorry, I’m not a dentist”: perspectives of rural GPs on oral health in the bush

Australians living in rural areas have poorer oral health than city residents.1 They experience higher rates of dental caries2 and are more likely than people in city areas to visit dentists for problems other than check-ups.3 Complicating this situation is the inadequate availability of dental care services in rural areas because of the uneven distribution of dental practitioners across Australia; most dentists and other dental practitioners practise in city areas.4,5 Many small rural towns in Australia do not have the population to support a full-time or resident dentist. Dental services in Australia are largely provided by the private sector (85%);6 public oral health services are provided only for those under 18 years of age and for adults who hold health care concession cards.7

People on low incomes who cannot regularly access dental care and who do not have private insurance are more likely to present to general medical practices and hospital emergency departments with oral health problems for immediate treatment and referral.813 It is concerning that dental conditions accounted for 63 000 avoidable hospital admissions in Australia during 2012–13.14 The admission rates for these conditions were lowest among city residents (2.6 admissions per 1000 population) and highest for very remote residents (3.7 per 1000),15 although the rates in each category vary between jurisdictions.16

When dental services are not available in remote areas, people visit non-dental health providers, including medical staff, for dental care.12 Although rural general practitioners see patients with dental health problems, there has been limited research into their views about oral health. Our study investigated how rural GPs manage presentations by patients with oral health problems, and their perspectives on strategies to improve oral health in rural areas.

Methods

This study forms part of a broader oral health rural workforce research project that is investigating the relationship between dental practitioners and primary care networks. The chief dental officers of Tasmania, Queensland and South Australia were invited to identify rural and remote communities in which oral health care was a significant problem, and where there was at least one general medical practice, a health care facility and a pharmacy, but no resident dentist. Primary care providers in selected communities who had experience in advising patients with oral health problems were invited to participate in semi-structured interviews. Participants were recruited using both purposive and snowball sampling strategies.17

The interview guide was developed on the basis of our review of the relevant literature, and included questions about each participant’s professional background; the frequency and management of oral health presentations, and the level of confidence with which the practitioners managed these patients; and their views on strategies that could improve rural oral health. The interviews were conducted in the participants’ workplaces by one or more members of the research team between October 2013 and October 2014. Recruitment continued until data saturation18 was attained in the concurrent data analyses. Interviews were audio-recorded and later transcribed.

Interview data were subjected to thematic analysis.19 NVivo version 10.0 (QSR International) was used to organise transcripts and codes. All transcripts were verified against audio recordings by two members of the research team, and interview data coded independently for cross-validation. The coding results were compared and discussed at regular meetings involving all researchers until consensus was reached. The consolidated criteria for reporting qualitative research (COREQ)20 were used as a guide for ensuring quality. Quotes from individual GPs are identified in this article only by number (eg, GP 20).

Ethics approval for the study was granted by the Human Research Ethics Committee (Tasmania) Network (reference H0013217).

Results

Characteristics of study sites and participants

Sixteen communities were identified by state dental officers for inclusion in the investigation: three each in Tasmania and South Australia, and ten in Queensland. All but three Queensland communities were found to satisfy the study inclusion criteria (Box 1). In these communities, 101 primary care providers, including 30 GPs, participated in the study. In this article we report on the perspectives of these 30 GPs (18 from Queensland, nine from Tasmania, three from South Australia). Twenty-two were men, eight were women; 15 were 40 years old or younger, 15 were over 40 years old; the median time that the participants had worked in their current practice was one year (range, 0.04–35 years; interquartile range, 0.11–3.88). Nine GPs participated in two group interviews and 21 in individual interviews. Interviews lasted 30 to 60 minutes.

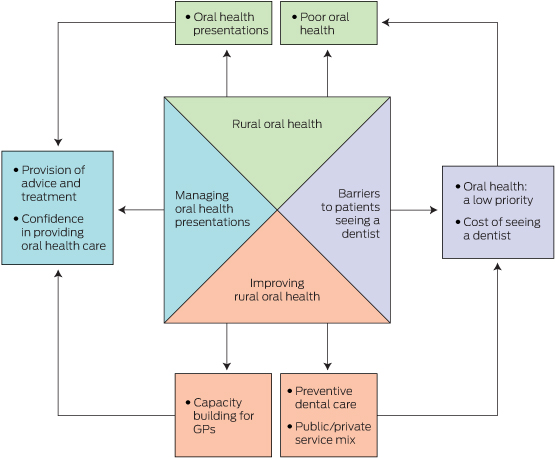
Four themes emerged from the interviews: rural oral health; managing oral health presentations; barriers to patients seeing a dentist; and improving oral health (Box 2).

Rural oral health

Participants reported seeing between one and 20 patients of various ages with oral health problems each month (mean, 12 per month for each community):

… the guy that just walked out and the one before him just walked out with a dental problem and probably three others came in today … four to five per week, close to 20 a month. (GP 10)

The oral health problems they saw ranged from toothaches, abscesses, oral infections and dentures to trauma:

… mostly what we see is dental abscesses, mouth ulcers, sometimes it is dentures … And, of course, extreme pain and tooth abscesses. (GP 8)

Having seen patients with oral health problems, GPs could observe the oral health status of their communities. Nine of 30 GPs commented that it was “so bad”, “very poor”, “never expected”, or even “shocking”:

I mean this town has shocking, shocking dental care … I’ve never seen teeth so badly decayed. (GP 10)

Managing oral health presentations

Most participants provided prescriptions for antibiotics and short-term pain relief, and advised patients to see dentists:

… if I suspect infection I will give antibiotics … As far as pain goes, I will give them a short-term oral pain relief … but I always give advice to go to the dentist. (GP 13)

Some also reported providing education about oral hygiene and preventive dental care:

I mostly provide pain relief, provide antibiotics, provide advice in personal dental care, I’m very hot on that. (GP 10)

Other treatments include dental block injections and tooth extractions:

Occasionally I pull people’s teeth here, but I’d rather not do it. (GP 19)

Eighteen of the GPs were confident, within their scope of practice, about providing oral health care advice and treatment:

Yes, pretty confident with basic dental emergency relief. (GP 4)

However, some acknowledged that they were not always confident, and that they lacked training in the area:

I start off … “sorry, I’m not a dentist”, and all I know is there are supposed to be 32 teeth in the mouth and that is pretty much all I know. I don’t have the training, absolutely not. (GP 6)

Barriers to patients seeing a dentist

Participants expressed concern that, for a number of reasons, patients would often not visit a dentist as advised. Some believed that this was because oral health was a low priority for these patients and this started with the parents:

Dental care is not a priority in rural people’s lives — at all … There are some quite attractive young men and women who’ve got shocking teeth … so just for lack of care … But again, it’s parental priority. When I was a kid, I come from a large family, my memory of school holidays was twice a year mum driving to a dentist. That was in the day with the old dentist drill with the black rubber bands … drilling … terribly slow … but we still used to go, we didn’t have a choice. But it’s my parents drove that, and they didn’t have a lot of money to spare, but they saw it as a priority. (GP 19)

As a consequence, some patients returned to the GP with even worse problems that required hospitalisation:

… the pain goes away and they don’t go to the dentist, and then they come back with chronic infection, and I say, “but I told you to go to the dentist” … lots of repeat clients. (GP 7)

Dental problems become medical problems if not treated and [we] need to admit them to hospitals. (GP 3)

Participants also noted that those on low incomes who did not have health care cards could often not afford to see a dentist regularly:

… the other thing that really is a big hindrance for oral health is the cost of going to the dentist, so a lot of people aren’t really going … [not] willing or are able to do that. I know I haven’t been to a dentist for a long time. (GP 20)

In the absence of a resident dentist or regular visits by mobile dental services, both public and private patients needed to travel to a larger centre to obtain dental care. This was described as “quite hard” and a “dilemma” for rural residents. A very remote GP reported:

I think the major issue for most of our patients is cost issues [involved in] flying off the island … so it’s the dilemma we face as professionals, as practitioners, as well as our patients. (GP 8)

Improving rural oral health

GPs suggested a number of ways to improve oral health in their rural communities. This included additional training in dental care on topics such as “major trauma interventions”, and more “practical advice”:

… we don’t really learn any dentistry at all … it’s still part of the body and doctors just kind of bypass it. (GP 20)

… I suppose we have to do what is best for our patients, and if we can in any way up-skill, upgrade our scope of practice in terms of dental care delivery, I’m happy to consider that. (GP 8)

Being busy clinicians in a small town, most GPs preferred flexible education and training, such as short online courses and workshops.

… the problem is I went to this course, had a great time, bought the kit, came back, never used it and then I’ll forget it! … it has to be regular, annual or semi-annual. (GP 19)

Spending some time at a dental clinic was also regarded as very beneficial:

I spent a day there [at a dental clinic] to have a look at what they did … It was a really helpful day … And because you have a friendly relationship, I can say OK, I am flicking [patients with dental problems] your way. (GP 15)

Twelve participants described the importance of community- and school-based oral health promotion:

Oral health education for the public should be better. Mum and Dad don’t brush their teeth, so the kids don’t do it either. (GP 2)

I really feel that having someone locally doing preventative health advice, especially with the children, checking that the fluoride is enough, a lot of our patients use tank water and they are not getting possibly the fluoride they need. Getting the paste on their teeth on a regular basis I think would make a big difference; just educate them. (GP 7)

Some saw opportunities to provide preventive advice to patients when they came for medical appointments:

I tell people routinely, but it’s part of the whole general holistic approach in general medicine. (GP 19)

Both public and private visiting oral health services were regarded as valuable for the community. A strategy suggested by 12 participants was to have a resident or visiting dentist or dental practitioner who could serve both public and private patients. This model was described by one GP as “half public and half private”:

We’d like an adult dentist please! On a regular basis and not just from the public system. It would be useful if there was someone out here that did private patients, so that people are not more disadvantaged who can’t get to town, and can’t get in if they don’t have a health care card. (GP 12)

GPs were not well informed about visiting dental services.

The private dentist comes when he comes … I don’t know why the hospital and doctors don’t know when the government dentist is coming. (GP 9)

Some GPs expressed concerns about the lack of a clear referral pathway to dentists, describing the communication as “one-way”; “nothing comes back”, “[we] never get feedback”:

There is no follow-up there, most of the time the dentist does not really send you anything back. Usually when I refer patients, you get more feedback, but I don’t get that from dentists. To be honest, the professional interaction coordination between me and most dentists, as a GP and the dentist, is nothing. (GP 11)

Only one GP reported receiving feedback from a dentist to whom he referred patients:

So if I refer someone to a dentist … I’ll write a letter to them and they’ll write back to me. (GP 19)

Discussion

We found that residents of the communities we sampled presented to GPs with oral health problems. Consistent with other reports,9,12,22 management of these problems by GPs typically included short-term pain relief, prescribing of antibiotics, advice that the patient see a dentist, and, if required, hospitalisation. GPs raised concerns about repeatedly seeing patients who did not visit a dentist as advised, and they referred to the relatively low priority given by many patients to oral health, as well as to cost and travel distances as major barriers to patients visiting a dentist. A number of presentations that required hospitalisation could have been averted by following the GPs’ advice. Participating GPs were therefore conscious of the need in their communities for broader oral health education and for promotion measures that would involve a range of health care professionals linking with other stakeholders. These measures include the delivery of regular oral health promotion programs in schools, reinforcement of good oral hygiene practices by parents, and fluoridation of town (or tank) water supplies where this was not currently undertaken.23 As primary care providers, GPs could play a critical role in providing oral health screening and education during their regular interactions with patients.

The interviewed GPs recognised that building their capacity and confidence could help them better care for patients with oral health problems. This might be achieved through regular short workshops on practical skills, training for dental emergencies,24,25 undertaking training modules, and consulting practice guidelines, including those available from the Royal Australian College of General Practitioners, the Australian College of Rural and Remote Medicine and the Royal Flying Doctor Service. These could be included in the induction process for GPs working in more isolated practice settings.

Participants expressed concerns about the lack of information about the dental services that visited their towns and the dearth of feedback from dentists about patients they had referred to them. Changes in professional and medical personnel and to visiting dental services, often attributed to funding cuts, compounded this problem. For the communities sampled in this study, there was clearly a need to establish effective communication and referral pathways between GPs and members of the dental teams.

In the absence of a universal dental health insurance scheme, some GPs recognised the opportunity for developing alternative business models for delivering dental services. For example, a mixed public/private funding model could enable dentists to provide services to both public and private patients in smaller communities in a financially viable and ethical manner. The potential of tele-dentistry to connect the GP with a dentist located elsewhere could also improve care for patients26 and help reduce the costs and burdens to patients of travel to regional centres for dental care.

A limitation of our study was the fact that 14 of the 30 GPs interviewed had worked in their communities for less than a year. This may have affected their answers to some questions, including those about communicating with the dental team. However, their responses were consistent with those of participants who had worked in their communities for longer periods, which suggested that this was a common problem, regardless of time in the current location. Further, we did not specifically recruit GPs from Aboriginal health centres, and our data were not verified against the records of dentists who had worked in the region. Finally, although we achieved data saturation, not all problems experienced by GPs may have been identified; different concerns might perhaps have emerged in other settings and in specific population groups.

Nevertheless, this study was unique in that it included a diverse sample of communities across three states and a relatively large number of GPs. This study contributes to our understanding of the experiences of GPs with respect to oral health in rural communities, and canvassed a number of strategies for improving the situation.

Rural oral health could be improved by a number of approaches, including building the capacity of GPs to assist people with dental health problems, strengthening community and individual engagement with oral health promotion and prevention activities, improving visiting dental services for all remote residents, regardless of whether they hold health care cards, and establishing more effective referral and communication pathways between dentists and GPs.

Box 1 –
Characteristics of the communities including in the study

Town

Population

Nearest dental surgery

Visiting dental service

ASGC-RA


1

< 500

248 km

Public dentist: once every 3 months; school dental van: sporadic visits

RA5

2

< 1000

70 km

No visiting oral health services

RA4

3

< 1000

40 km

School dental van: sporadic visits

RA3

4

< 1000

87 km

Private dentist: once a month

RA4

5

< 1000

179 km

Public dentist: once a year

RA5

6

< 1000

210 km

Private and public dentist visits: once every 3 months; mobile Aboriginal dental van: once a year; school dental van: sporadic visits

RA5

7

> 1000

43 km

No visiting oral health services

RA4

8

> 1000

40 km

No visiting oral health services

RA3

9

> 1500

214 km

Private dentist: once a month for 3 days; school dental van: sporadic visits

RA4

10

> 1500

212 km

Public and private dentists: sporadic visits

RA5

11

> 1500

200 km

Private dentist visits: once a month; school dental van: sporadic visits

RA5

12

> 2000

62 km

Private dentist visits: once a year

RA3

13

> 3000

196 km

Public dentist visits: once a month; mobile Aboriginal van: once a year

RA4


ASGC-RA = Australian Standard Geographical Classification Remoteness Area.21

Box 2 –
Thematic representation of general practitioners’ perspectives on rural oral health

Natural history and long-term impact of dental fluorosis: a prospective cohort study

Dental fluorosis is a developmental condition of tooth enamel caused by excessive fluoride exposure during periods of enamel formation (the first 3 years of life). Fluorotic enamel is histologically characterised by subsurface porosity. In clinical terms, fluorosis ranges from barely visible white striations to staining and pitting of the enamel.1 Systemic fluoride exposure in childhood is the necessary aetiological factor in the development of dental fluorosis.24

Dental fluorosis is the most common adverse effect of exposure to fluoride used to prevent dental caries.5 The public health importance of dental fluorosis lies in its role as a population indicator of excessive fluoride exposure. Dental fluorosis, once dismissed as a condition without public health significance, is now an important problem in oral health care for a number of reasons:

  • Reports in the scientific literature have recently elevated the prominence of dental fluorosis as an adverse outcome of fluoride use;

  • Public opinion about the safety of fluoride now routinely cites dental fluorosis as a specific concern; and

  • Recommendations about the use of fluoride should be based on evidence regarding the benefit–risk trade-off between preventing dental caries and the risk of fluorosis.

Judgements about dental fluorosis should be based on a sound understanding of its natural history. Scientific information about dental fluorosis is, however, limited to cross-sectional and case–control studies. It is therefore unknown whether post-eruptive changes in enamel affect the clinical presentation of fluorosis.

Dental fluorosis is potentially an important problem, both for the affected individuals and for public health.6 Fluorosis can affect perceptions of dental appearance and, consequently, indicators of oral health-related quality of life. However, there have been no prospective studies that document any long-term impact of dental fluorosis on oral health-related quality of life.

The specific aim of this study was to document the natural history of untreated dental fluorosis during a 6-year period, and to assess factors associated with longitudinal changes in dental fluorosis. Our second aim was to investigate the long-term impact of dental fluorosis on perceptions of oral health.

Methods

The baseline study

Our study was a longitudinal follow-up of a population-based study of children aged 8–14 years in South Australia conducted between 2003 and 2004.79 The baseline study collected data on socio-economic status, residential history, oral health-related behaviours, and the oral health status of the children.

A total of 677 children were examined by a specially trained dentist. Fluorosis was initially diagnosed using the Russell differential diagnostic criteria10 and then scored for severity according to the 10-point Thylstrup and Fejerskov (TF) Index.1 A total of 1365 fluorotic teeth were identified in 267 children. The prevalence of fluorosis, defined as a maxillary central incisor scored as at least TF 1, was 30%; 11% of the teeth were scored as TF 2 or 3. Maxillary central incisors are commonly assessed when estimating the prevalence of dental fluorosis to ensure comparability across ages. The highest score in our sample was TF 3 (moderate fluorosis).9

Study participants and their parents completed the Child Perception Questionnaire (CPQ) and the Parental Perception Questionnaire (PPQ) respectively,11,12 each of which included a Global Rating of Oral Health (GROH). Dental caries and malocclusion were associated with poor perceptions of oral health, but dental fluorosis was not.7

The follow-up study (October 2010 – December 2012)

The baseline study sample was recontacted with the help of their recorded contact details. Tracking attempts were also made through the Australian Electoral Commission, the White Pages, and through third parties for whom contact details had been provided during the baseline study.

The participants and their parents received questionnaires requesting information about their socio-economic situation, oral health behaviours and practices, and their perceptions of oral health-related quality of life (CPQ and PPQ respectively, each with GROH).

Participants who completed the questionnaire were invited for an oral health examination at a local South Australian Dental Service clinic. The examination protocol was the same as that for the baseline study. The three trained and calibrated examiners, including the baseline examiner who trained the other examiners, were blinded to baseline dental fluorosis scores.

Dental caries and malocclusion were assessed.13 Dental fluorosis was assessed with the TF index,1 using the same examination procedures as the baseline study.

When tooth discolourations had already been recorded for a participant by the principal examiner, a research assistant invited the child for another visit and randomly assigned them to one of the other two examiners, who were not made aware that the participant was attending for a repeat examination. A total of 12 repeat examinations were undertaken. Inter-rater agreement at the individual and tooth levels was estimated. The estimated weighted kappa (κ) scores were all over 90%.

Statistical analysis

The major demographic characteristics of the follow-up sample were compared with those of the baseline sample to identify any retention bias. The follow-up sample with full data and the group of those who provided only questionnaire data were compared with non-respondents.

Forty-one children with orthodontic treatment and three with tooth bleaching were excluded from the analysis; they did not differ with respect to baseline fluorosis from the included participants (data not shown).

First aim

The main analysis compared dental fluorosis at baseline and follow-up. Separate analyses were conducted at the person and tooth levels using pairwise analysis of fluorosis scores collected at baseline and follow-up. The person-level analysis defined cases of dental fluorosis based on the highest TF scores for maxillary central incisors. The tooth-level analysis compared TF scores of individual teeth in the maxillary arch, from first premolar to first premolar (up to eight teeth per child). The direction and magnitude of changes were reported. The McNemar test assessed the significance of differences in pairwise comparisons, using 2 × 2 cross-tabulations. Two further analyses were then conducted. First, the PROC CROSSTAB procedure of SUDAAN release 11.01 (RTI International) generated estimates of changes in proportions at the tooth level, with 95% confidence intervals. Second, the MIXED procedure of SAS 9.4 (SAS Institute) used a mixed model for repeated measures to estimate mean scores at follow-up. For tooth-level analysis, individuals were treated as clusters to account for the interdependence of teeth characteristics within individuals.

For the tooth-level comparison, diminished and increased fluorosis were defined as having one or more teeth with respectively a lower or higher TF score at follow-up than at baseline. Two separate log-binomial multivariable regression models were generated for the two directions of change, with explanatory factors being socio-economic factors, dental health behaviours, and fluorosis on the maxillary central incisors. These regression models assessed whether the observed changes in fluorosis reflected a natural process. Prevalence ratios associated with changes and 95% CIs were reported.

Second aim

GROH responses by the children and their parents at follow-up were used to produce two outcome variables, child and parental GROH, with the ordinal categories “excellent/very good”, “good” and “fair/poor”. These outcomes were regressed in multinomial regression models with baseline factors as explanatory variables. The long-term impact of dental fluorosis recorded at baseline on GROH at follow-up was assessed in models adjusted for other baseline factors, including socio-economic characteristics, occlusal traits measured by the Dental Aesthetic Index, and dental caries. Proportional odds ratios and 95% CIs are reported. The proportional hazards assumption was not violated in our models.

Ethics approval

The study was approved by the University of Adelaide Human Research Ethics Committee (reference H-153-2008).

Results

A total of 409 participants completed the questionnaire (60% of baseline sample), and 314 of the baseline sample (46%) underwent oral examination at follow-up (Box 1). There were no statistically significant differences between those who only completed the questionnaire and those who provided full data at follow-up with respect to the major baseline characteristics, including oral health behaviours and dental fluorosis and caries.

Box 2 summarises pairwise comparisons of dental fluorosis at baseline and follow-up at the person and tooth levels. At the person level, 87% of individuals who scored TF 0 at baseline also did so at follow-up; about 12% were scored as TF 1 at follow-up. For those scored as TF 1 at baseline, 46% were scored as TF 0 at follow-up, and the others were unchanged. For half of those with a TF score of 2 or 3 at baseline, the fluorosis score was lower at follow-up — five were scored as TF 0, seven as TF 1 — while the scores for 10 children were unchanged.

At the tooth level, 91% of examined teeth with TF 0 at baseline were also scored as TF 0 at follow-up. More than 60% of teeth scored as TF 1 at baseline were scored as TF 0 at follow-up, and only two of 79 teeth deteriorated to TF 2 or 3. Two-thirds of the 58 teeth scored as TF 2 or 3 at baseline received a lower score at follow-up. After adjustment for clustering within individuals, tooth-level mean TF scores at follow-up were significantly lower than the actual scores recorded at baseline (mean score changes for teeth with baseline score of TF 1: 0.26 [95% CI, 0.20–0.32]; TF 2: 0.39 [95% CI, 0.27–0.51]; TF 3: 0.97 [0.76–1.18]).

Factors potentially associated with either reduced or increased dental fluorosis were evaluated in two multivariable regression models (Box 3). More frequent teeth brushing was associated with a non-significantly greater reduction in fluorosis. Household income at baseline was not significantly associated with changes in fluorosis score. Urban residents and those whose parents had medium levels of education were more likely to have increased fluorosis. The baseline fluorosis score was statistically correlated with reduced but not with increased fluorosis.

Associations between the socio-economic, behavioural and clinical factors measured at baseline and the rating of oral health by participants and their parents at follow-up were regressed in two multinomial regression models (Box 4). Baseline fluorosis was not significantly associated with poorer rating of oral health. Infrequent teeth brushing (less than twice daily), dental caries and malocclusion at baseline were significant predictors of a poorer rating of oral health at follow-up.

Discussion

This is the first study to evaluate the natural history of dental fluorosis and its long-term impact on individual perceptions of oral health.

The study found that mild and very mild dental fluorosis (TF score, 1–3) in children had a tendency to diminish with time. Increased fluorosis was associated with medium parental education and an urban place of residence, for which there is no obvious explanation. However, the proportion of teeth in which fluorosis increased was small, so that the changes may simply reflect the natural progression of mild and very mild dental fluorosis in this adolescent population. The implication of this finding is that this level of dental fluorosis, as a side effect of fluoride used to prevent dental caries, may not have a significant dental public health impact.

Enamel is not static, and its appearance can be affected by post-eruptive changes, exaggerating or reducing the clinical presentation of fluorosis. Physical forces in the mouth during mastication and teeth brushing can cause fluorotic porous surfaces to be worn away, exposing enamel that does not appear fluorotic. Further, enamel continues to mature after eruption, and during adolescence this can lead to the closing of the microporosities observed in very mild or mild dental fluorosis. Expectations of these directions of change, especially in mild forms of fluorosis, are, however, based largely on cross-sectional findings or laboratory assessments.14 Our study has confirmed the reduction of dental fluorosis with age in a real-life, population-based sample.

The study also found that dental fluorosis did not have any negative effect on perceptions of oral health. Dental fluorosis at this low level has only an aesthetic impact, if any.15 Our finding was consistent with our earlier cross-sectional findings,7 as well as with those of other cross-sectional studies.1618

The public perception of fluorosis has attracted increasing attention in recent major reviews.5,19 There is overwhelming support for the use of fluoride as part of oral health policy because of its role in the substantial decline in the prevalence of dental caries. However, the currently relatively low level of dental caries among children may alter attitudes to the balance between caries prophylaxis and fluorosis. The community deserves a thorough explanation of the nature of fluorosis, as well as consideration of their perceptions of oral health and wellbeing. The findings of our investigation of the natural history of dental fluorosis will help inform the public about the condition and evidence-based clinical recommendations for its treatment.

Balancing risks and benefits is a problem associated with any intervention. In the case of fluoride, the benefit of preventing dental caries has always been associated with some risk of fluorosis. Evaluation of the risk–benefit balance provides scientific information upon which to base recommendations for the use of fluorides. Evaluation of the trade-off must include clinical experience of both sides of the balance. More importantly, it must include evaluation of the potential impact that each outcome has on the health and wellbeing of individuals and of the population as a whole.

Dental caries causes permanent destruction of dental tissue, leading to pain and discomfort that may require treatment which is costly for both the individual and society. Caries was found in cross-sectional studies to have a negative impact on the oral health-related quality of life of children and their families studies.7,20,21 Our study confirmed that dental caries in childhood has a negative impact on perceptions of oral health 6–7 years later. After controlling for other factors, dental caries during childhood significantly increased the probability of a lower rating of oral health in young adulthood. Preventing dental caries from a young age is therefore of the utmost importance in evaluating the value of fluoride use.

Possible limitations to this study include the low retention rate between baseline and follow-up, the influence of parental education, inter-rater variability, and the use of the TF index. Systematic retention bias was unlikely. Dental fluorosis at baseline did not influence participation at follow-up. Parental education was a factor that was of mild statistical significance in determining participation at follow-up. There is, however, no theoretical background or empirical evidence suggesting that parental education influences the natural course of dental fluorosis. Only 12 participants were available for rating inter-rater reliability, so we assessed this at the tooth level, using more than 200 teeth. It might be argued that the TF index assesses dental fluorosis under unnatural conditions, but we believe it ensured that the examination conditions were standardised, enabling data at the two time points to be compared.

In conclusion, our study provides strong evidence about the natural history of mild and very mild dental fluorosis during the period between adolescence and young adulthood. Dental fluorosis during childhood diminishes over time. Further, dental fluorosis at this low level had no impact on perceptions of oral health, in contrast to dental caries. It is, therefore, preferable to emphasise the beneficial effect of fluoride in preventing dental caries rather than the risk of dental fluorosis.

Box 1 –
Characteristics of the study participants at baseline and follow-up

Baseline factors

Non-respondents


Respondents with questionnaire only


Respondents with full data


n

% (95% CI)

n

% (95% CI)

n

% (95% CI)


Total number

268

95

314

Birth cohort

Born 1989–1990

72

26.9% (21.5–32.2)

32

33.7% (24.2–43.2)

67

21.3% (16.8–25.9)

Born 1991–1992

94

35.1% (29.3–40.8)

29

30.5% (21.2–39.8)

101

32.2% (27.0–37.3)

Born 1993–1994

102

38.1% (32.2–43.9)

34

35.8% (26.1–45.5)

146

46.5% (41.0–52.0)

Sex

Male

143

53.0% (47.0–58.9)

50

52.6% (42.6–57.4)

156

49.7% (44.1–55.2)

Female

125

47.0% (41.1–53.0)

45

47.4% (37.3–57.4)

158

50.3% (44.8–55.9)

Income at baseline

Low

94

40.9% (34.5–47.2)

37

44.6% (33.9–55.3)

116

40.7% (35.0–46.4)

Medium

101

43.9% (37.5–50.3)

37

44.6% (33.9–55.3)

133

46.7% (40.9–52.5)

High

35

15.2% (10.6–19.9)

9

10.8% (4.1–17.6)

36

12.6% (8.8–16.5)

Parental education*

Low

104

43.3% (37.0–49.6)

36

41.4% (31.0–51.8)

132

44.0% (38.4–49.6)

Medium

72

30.0% (24.2–35.8)

24

27.6% (18.2–37.0)

59

19.7% (15.2–24.2)

High

64

26.7% (21.1–32.3)

27

31.0% (21.3–40.8)

109

36.3% (30.9–41.8)

Brushing frequency

Less than twice a day

79

33.8% (27.7–39.8)

28

32.6% (22.6–42.5)

84

28.9% (23.6–34.1)

At least twice a day

155

66.2% (60.2–72.3)

58

67.4% (57.5–77.4)

207

71.1% (65.9–76.4)

Dental caries

Baseline DMFS

268

1.02 (0.76–1.29)

95

0.81 (0.47–1.15)

314

0.96 (0.72–1.20)

Baseline dental fluorosis

TF 1

36

14.2% (9.9–18.5)

15

16.3% (8.7–23.9)

37

12.3% (8.5–16.0)

TF 2 or 3

29

11.5% (7.5–15.4)

4

4.3% (0.2–8.5)

24

7.9% (4.9–11.0)


DMFS = decayed, missing or filled tooth surface; TF = Thylstrup and Fejerskov Index score. All percentages are column percentages. * P < 0.05 (?2 comparison).

Box 2 –
Changes in dental fluorosis scores at the person and tooth levels

Baseline fluorosis score

Follow-up fluorosis score


TF 0


TF 1


TF 2–3


n

% (95% CI)

n

% (95% CI)

n

% (95% CI)


A Person-level changes*

TF 0 (207 children)

181

87.4% (82.9–92.0)

24

11.6% (7.2–16.0)

2

1% (0.0–2)

TF 1 (35 children)

16

46% (29–62)

19

54% (38–71)

0

NA

TF 2 or 3 (22 children)

5

23% (5–40)

7

32% (12–51)

10

46% (25–66)

B Tooth-level changes

TF 0 (1270 teeth)

1157

91.1% (89.5–92.7)

103

8.1% (6.6–9.6)

10

1% (0–1)

TF 1 (126 teeth)

79

62.7% (54.2–71.1)

45

35.7% (27.3–44.1)

2

1.6% (0.0–3.8)

TF 2 or 3 (58 teeth)

18

31% (19–43)

20

35% (22–47)

20

35% (22–47)


NA = not applicable; TF = Thylstrup and Fejerskov Index score. * Maximum TF scores on maxillary central incisors. Forty-four participants were excluded because they had had orthodontic treatment or tooth bleaching; six children were excluded because they did not have any erupted permanent teeth at the time of the baseline examination. † TF scores of individual maxillary permanent teeth: first premolars, canines and incisors.

Box 3 –
Factors associated with longitudinal changes in dental fluorosis

Baseline factors

Reduced TF score*


Increased TF score


n (row %)

Adjusted PR (95% CI)

n (row %)

Adjusted PR (95%CI)


Birth cohort

Born 1989–1990

22 (33.9%)

0.92 (0.59–1.43)

14 (21.5%)

0.94 (0.54–1.61)

Born 1991–1992

39 (39.4%)

1.18 (0.81–1.72)

16 (16.2%)

0.76 (0.46–1.28)

Born 1993–1994

43 (30.3%)

1

25 (17.6%)

1

Sex

Male

53 (34.6%)

0.89 (0.64–1.24)

27 (17.7%)

1.19 (0.77–1.84)

Female

51 (33.3%)

1

28 (18.3%)

1

Income at baseline

Low

33 (29.5%)

1

19 (17.0%)

1

Medium

47 (35.9%)

1.06 (0.73–1.53)

31 (23.7%)

1.00 (0.63–1.59)

High

16 (47.1%)

1.16 (0.68–1.97)

1 (2.9%)

Parental education

Low

45 (34.6%)

1

17 (13.1%)

1

Medium

16 (28.6%)

0.90 (0.56–1.44)

20 (35.7%)

2.47 (1.48–4.12)

High

40 (37.7%)

1.16 (0.78–1.72)

16 (15.1%)

0.89 (0.49–1.60)

Brushing frequency

Less than twice a day

23 (27.7%)

1

19 (22.9%)

1

At least twice a day

77 (38.3%)

1.26 (0.85–1.87)

33 (16.4%)

0.77 (0.49–1.21)

Residence type

Urban

59 (45.0%)

1

35 (26.7%)

1

Rural

45 (25.7%)

0.70 (0.50–1.00)

20 (11.4%)

0.54 (0.34–0.85)

Baseline TF scores on central incisors

TF 0

54 (22.4%)

1

37 (15.4%)

1

TF 1

25 (67.6%)

2.78 (1.86–4.15)

9 (24.3%)

1.27 (0.72–2.24)

TF 2 or 3

23 (95.8%)

3.91 (2.53–6.04)

8 (33.3%)

1.65 (0.86–3.18)


PR = prevalence rates estimated by multivariable regression models; TF = Thylstrup and Fejerskov Index score. * One or more teeth with a lower TF score at follow-up. † One or more teeth with a higher TF score at follow-up. ‡ Medium and high income categories combined for this calculation because of low numbers.

Box 4 –
Factors associated with poor perception of oral health at follow-up (proportional odds ratios with 95% CIs)*

Baseline factors

Study participants

Parents


Income at baseline

Low

0.71 (0.32–1.58)

1.12 (0.40–3.14)

Medium

0.83 (0.39–1.78)

0.92 (0.34–2.50)

High

1

1

Parental education

Low

0.83 (0.49–1.45)

1.53 (0.78–3.03)

Medium

0.92 (0.49–1.71)

1.18 (0.54–2.58)

High

1

1

Brushing frequency

Less than twice a day

1.40 (0.87–2.27)

2.07 (1.19–3.63)

At least twice a day

1

1

Residence type

Urban

0.82 (0.52–1.30)

1.49 (0.86–2.59)

Rural

1

1

TF scores

TF 0

1

1

TF 1

1.13 (0.63–2.03)

1.32 (0.52–3.38)

TF 2 or 3

0.99 (0.39–2.53)

1.00 (0.31–3.20)

Malocclusion

Normal

1

1

Severe malocclusion

0.88 (0.52–1.30)

1.99 (1.05–3.77)

Moderate malocclusion

0.91 (0.51–1.63)

1.09 (0.52–2.28)

DMFS score

1.27 (1.12–1.44)

1.14 (1.01–1.28)


DMFS = decayed, missing or filled tooth surface; TF = Thylstrup and Fejerskov Index score. * Ordinal logistic model for perception of oral health. Other included factors (age, sex) are not presented. Proportional odds ratios indicate probabilities of having the lower ordered values (poorer Global Rating of Oral Health). † Highest dental fluorosis scores on maxillary central incisors. ‡ Assessed with the Dental Aesthetic Index.