×

Impact of HPV sample self-collection for underscreened women in the renewed Cervical Screening Program

Major changes will occur in the Australian National Cervical Screening Program (NCSP) from 2017, following an extensive review (“Renewal”).1 In addition to a re-designed mainstream program (5-yearly human papillomavirus [HPV]-based screening with partial genotyping; colposcopy referral for women testing positive for HPV16/18; liquid-based cytology [LBC] triage for other oncogenic HPV types), it was also recommended that HPV testing on self-collected cervico-vaginal samples (“self-collection”) be funded for unscreened and underscreened women.2 Self-collection must be facilitated by a clinician who also offers mainstream cervical screening, and is likely to be restricted to women aged 30–74 years who have never been screened or are overdue for cervical screening by 2 years or more.3

Offering self-collection has increased screening participation among unscreened and underscreened women in several settings,4 and is seen as a potentially useful strategy for extending cervical screening to previously hard to reach groups. It is being introduced for this purpose in several countries, including the Netherlands.57 Recent international reviews have reported that HPV testing on self-collected samples was somewhat less sensitive for high grade cervical abnormalities than testing on clinician-collected samples if signal-based tests are used; however, sensitivity was similar when using polymerase chain reaction (PCR)-based tests.8,9 These findings describe a range of possible test performances for self-collection, but they cannot be applied to specific technologies in the Australian context: here the performance measures and standards for HPV test platforms to be used as part of the population screening program will need to meet National Pathology Accreditation Advisory Council requirements.

Taking all of these factors into consideration, the aim of our study was to inform decision making by women offered self-collection in Australia by quantifying how different screening decisions affect the future risk of cervical cancer in previously unscreened women.

Methods

We used a dynamic model of HPV transmission and vaccination in conjunction with a cohort model of HPV natural history, cervical screening, diagnosis, treatment, and cancer survival. This model platform underpinned the Renewal review, and has been described in detail elsewhere.10 Dynamic models are considered the most comprehensive models of HPV epidemiology, as they incorporate the direct and indirect effects of HPV vaccination on the incidence of infection, and thus reflect its full impact on changes in risk. Model-predicted outputs have been extensively calibrated and validated against local cancer and pre-cancer outcomes by age and HPV type, resource use, and observed effects of HPV vaccination.10,11 Detailed clinical management pathways were informed by an expert advisory panel convened for the Renewal review.1,10

Model scenarios

We evaluated three choices that could be made by previously unscreened women:

  • a single round of HPV testing on a self-collected sample (“1 × self-collected”);

  • a single round of HPV testing on a clinician-collected sample (“1 × clinician-collected”); and

  • joining the mainstream screening program (5-yearly HPV-based screening with partial genotyping for HPV16/18 and LBC triage for other oncogenic HPV types; testing on clinician-collected samples) (“join the program”).

The comparator in all cases was choosing to remain unscreened. In the single screening round scenarios (the first two options), women were assumed to complete a single round of screening, but then to never re-attend for subsequently recommended rounds. We considered a round of screening to be completed if the women were HPV-negative on their primary screening test, or if they were HPV-positive but had subsequently undergone appropriate follow-up and had then been recommended to return to routine screening. The main analysis evaluated outcomes based on a decision taken at age 30 years, as this is the earliest age at which self-collection will be offered to most women, but we also considered the outcomes if the decision was deferred to age 40 or 50 years.

Since the intention was to provide information useful to women when making their decision, we assumed that those who elected to undergo screening would attend for all subsequently indicated tests and procedures, including LBC triage (an additional visit is required, as LBC cannot be performed on a self-collected sample), colposcopy, and treatment. In a sensitivity analysis, we examined imperfect compliance with the recommended follow-up (Appendix, section 3).

Test characteristics

The characteristics of HPV testing on self-collected samples (baseline and feasible range) were informed by a recent meta-analysis of performance relative to clinician-collected samples8 (Appendix, section 2.1). We took a conservative approach and considered a performance range based on international data relevant to various test technologies.7 In the baseline analysis, we assumed that self-collected samples would be tested for any oncogenic HPV type. In a sensitivity analysis, we evaluated the use of a clinical test with partial genotyping on these samples, allowing differential management of women who test positive for HPV16/18, consistent with the mainstream screening program and an Australian trial of self-collection.12 The characteristics of other tests used were informed by meta-analyses, and by colposcopy test data from Australia and England (Appendix, sections 2.2–2.4).

HPV vaccination

The baseline analysis estimated outcomes for women in the absence of HPV vaccination, which would be relevant for older women; however, in a secondary analysis we also considered outcomes for a cohort of women offered vaccination against HPV16/18 at age 12, as currently implemented in Australia. Estimates of the uptake of vaccination by these girls (72%) and by older females (included to capture the indirect effects of the catch-up program) were based on published data.13,14 National uptake data for males (included to capture the indirect effects of the program) were not yet available, so we assumed an age-specific uptake by those offered vaccination since 2013 equivalent to that achieved among females, based on initial state-based reports.15 Results for cohorts offered vaccination would be relevant to women in Australia who turn 30 years of age from around 2026 (who were offered HPV vaccination at age 12), but are also potentially useful for those who turn 30 from 2017 onwards (who were offered vaccination when aged 13–20 years; since some will have been exposed to HPV prior to vaccination, their absolute risks of developing cervical cancer will be slightly higher than for those offered vaccination at age 12).

Outcomes assessed

We estimated for a cohort of 100 000 previously unscreened women aged 30 years the cumulative numbers of incident cervical cancer diagnoses, cervical cancer deaths, and women ever treated for cervical pre-cancer to age 84 years. The number of women needing to be treated for cervical pre-cancer (NNT) to avert one cancer diagnosis (or one cancer death), compared with women who remained unscreened, was also calculated as a measure of the balance between the benefits and harms of screening.

Sensitivity analyses

In addition to those previously discussed, we also performed sensitivity analyses of several parameters that were previously found to be the most influential across a range of screening evaluations using our model, as well as of those parameters for which the value was most uncertain (Appendix, section 1).10,16 These included the accuracy of triage testing with LBC, the diagnostic accuracy of colposcopy, and the management of women who test positive for oncogenic HPV types other than 16/18 at the primary test and whose LBC triage test is low grade (“intermediate risk”; 12-month recall v colposcopy referral).

Ethics approval

This model-based study did not involve human participants, so ethics approval was not required. A number of de-identified datasets were used in the prior development and calibration of the model platform that was used for this evaluation. Ethics approval for the use and analyses of these datasets to inform the model was provided by the Cancer Council NSW Ethics Committee (references 232, 236) and by the University of New South Wales Human Research Ethics Committee (references HC13270, HC13349).

Results

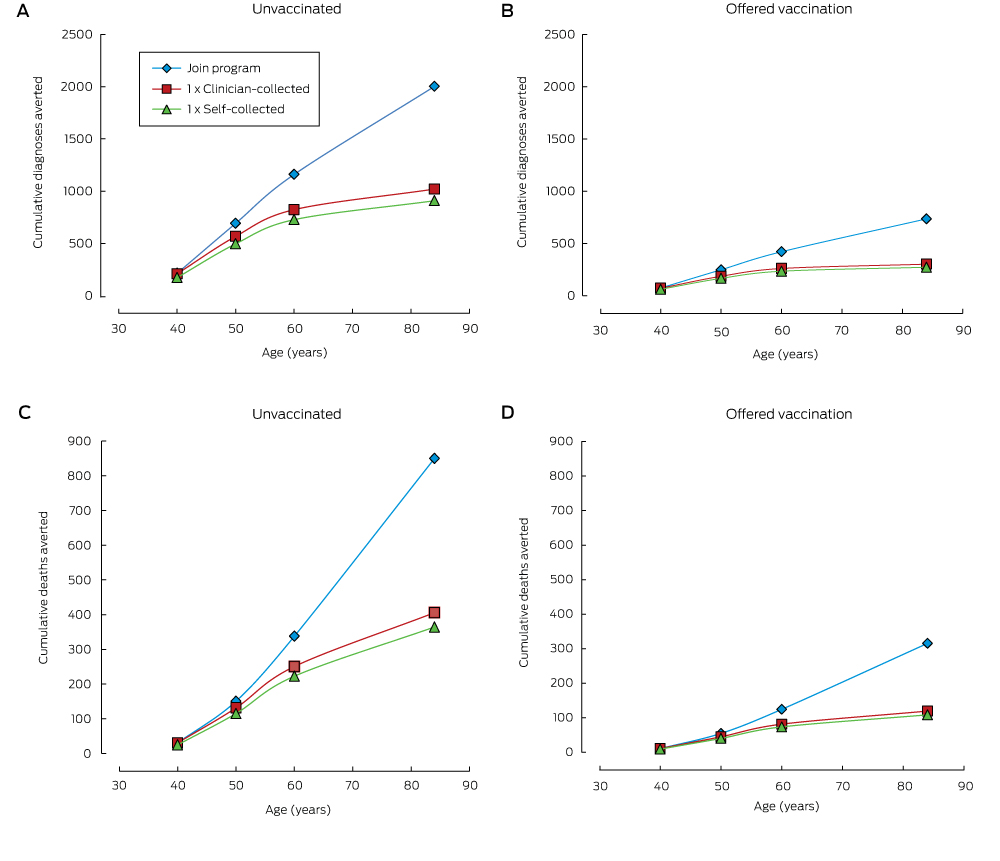
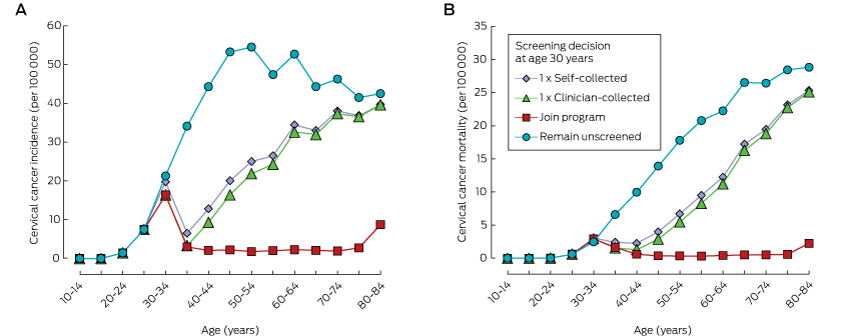
Compared with remaining unscreened, a single screening round at age 30 substantially reduced cancer incidence and mortality, and the number of cancer cases or deaths averted continued to increase over a woman’s life (Box 1, Box 2). One round of self-collected sample HPV screening in 100 000 women aged 30 years would avert 908 cancer diagnoses and 364 cancer deaths by age 84 (NNT, 5.8). Over a lifetime, the number of cancer cases or deaths averted by joining the mainstream program at age 30 years was about double that associated with a single screen at the same age. Underlying these findings is the fact that cancer incidence and mortality both start to increase again about 10 years after a single screen at age 30 years, whereas the lower incidence rate is maintained for most of a woman’s life if they join the program (Box 3). Joining the program was associated with the lowest NNT to avert each cancer case or death over a lifetime.

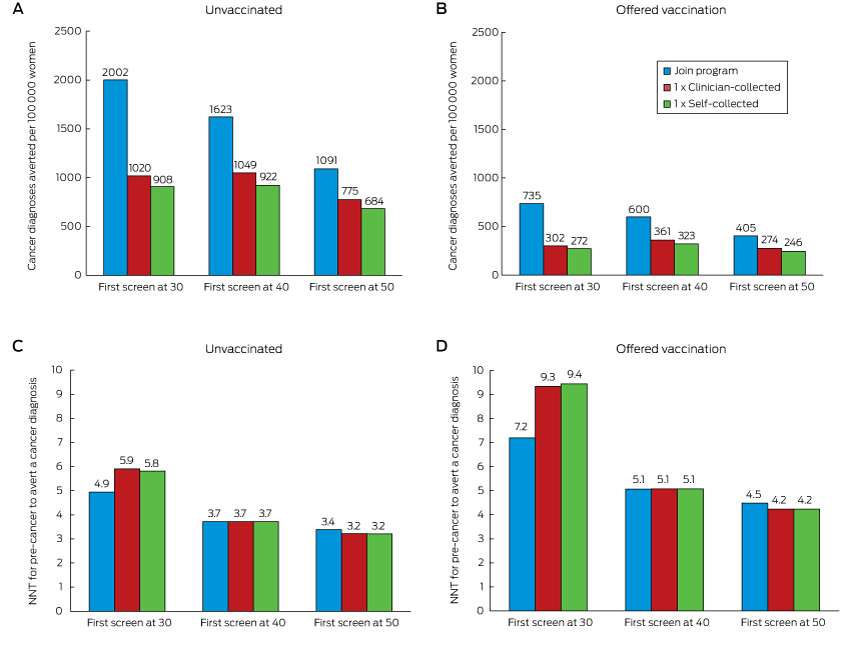
When the screening decision was deferred until age 40 or 50, the reduction in cancer diagnoses and deaths remained greatest when a woman joined the mainstream screening program; even doing so at age 50 averted more cases than a single screening round at age 30 or 40 (1091 fewer diagnoses and 583 fewer deaths [NNT, 3.4] by joining the program at age 50 v 908 or 922 fewer diagnoses and 364 or 426 fewer deaths [NNT, 5.8 or 3.7] for a single round of self-collection at ages 30 or 40 respectively). For each sample type, a single round of screening at age 40 prevented more cervical cancer cases and deaths than a single round at either age 30 or 50 (for self-collection, a single round of screening at ages 30, 40 or 50 years resulted in 908, 922 and 684 fewer diagnoses and 364, 426 and 385 fewer deaths respectively; for a clinician-collected sample, in 1020, 1049 and 775 fewer diagnoses, and 406, 480 and 437 fewer deaths respectively) (Box 4). While having a first screen at older ages often reduced the number of cases averted, the NNT to avert a cancer case was also lower.

Relative reductions in the numbers of cervical cancer diagnoses and deaths were similar for women in cohorts offered HPV vaccination and those who were not offered HPV vaccination. These reductions were substantial even when only one screening round was undertaken; however, the absolute numbers of diagnoses and deaths averted in those offered vaccination was smaller (by 63–70%) because of their lower underlying risk. In women offered vaccination, joining the program at age 30 averted more than twice as many cancer diagnoses and deaths as a single screen at the same age, and was also associated with a lower NNT to avert each cancer case (Box 2). Joining the program at age 50 remained more effective than a single screen at ages 30, 40 or 50 years (Box 4). At age 30, joining the mainstream program had the most favourable balance between benefits and harms; at older ages, the NNT was similar for all screening decisions. The NNT to avert a cancer diagnosis was 44–64% higher for women who had been offered vaccination than for those who were not (Box 4).

Sensitivity analyses

No feasible assumptions considered in sensitivity analysis altered the estimate of the number of diagnoses averted by more than 5%, or the NNT to avert a diagnosis by more than 8% (supplementary figures 3 and 4 in the Appendix). Results for self-collection were most sensitive to the accuracy of the HPV test and the availability of partial genotyping for HPV16/18. The effectiveness of joining the mainstream program was most sensitive to women’s compliance with the recommended tests, whereas the effect of this on single screening round scenarios was smaller (further discussion in the Appendix, section 5).

Discussion

This study provides valuable information that can inform decision making by women and clinicians. Even a single round of HPV screening on a self-collected sample can reduce the lifetime risk of a cervical cancer diagnosis, by around 41% if performed at age 30 or 40 years. A single round of HPV testing on a clinician-collected sample may offer superior results, but it is possible that the difference in outcomes may be smaller if a sufficiently accurate HPV test is used and if partial genotyping is performed on self-collected samples. However, our results also indicate that joining the mainstream program, even at an older age, offers substantially greater protection. Our findings also help to quantify the benefit for women of joining the program rather than being screened only once. For example, the benefit for women who continue to attend for recommended screening after a first screen at the age of 30 years is about double that of undergoing a single round of screening at 30. The balance of benefits and harms associated with joining the mainstream program was more favourable than or similar to that for a single screening round at all ages we considered in this analysis.

Self-collection was recommended during the Renewal review in the context of several factors in Australia. First, the 2-yearly cervical screening participation rate had remained relatively stable at around 60% for more than a decade, and the proportion of women remaining unscreened after 3 (almost 30%) or 5 years (about 17%) had also not decreased. Second, cervical cancers were mostly diagnosed in women who were unscreened or had not been screened in the previous 3.5 years (45% and 23% respectively of diagnosed invasive cancers in 2012).17 Third, there were persistent disparities in screening participation, with lower participation rates in lower socio-economic groups, among Aboriginal and Torres Strait Islanders, and in some migrant groups, and these participation disparities were reflected in the incidence of cervical cancer.1822 These factors suggested that infrequent or non-participation in screening was a major barrier to further reducing the incidence of cervical cancer (which had plateaued over the past decade), and was also driving some persistent inequalities in cervical cancer incidence. Consequently, ensuring that all Australian women have access to a program that is acceptable, as well as effective and efficient, was a fundamental aim of Renewal.11 Self-collection is specifically aimed at women who are unscreened or underscreened.2

Two recent studies in Victoria suggested that self-collection is likely to be acceptable among women who are not being screened regularly, although, as both involved a mail-out model, their findings are not directly comparable with the NCSP recommendations. The iPap trial compared participation by previously unscreened and underscreened women who were randomly assigned to receiving either a mailed-out self-collection kit or a screening reminder letter.12 Offering self-collection was more effective in increasing participation than a reminder; attendance for recommended follow-up tests was high among women who returned a self-collected sample in the iPap trial; and participants reported finding self-collection simpler, more comfortable and less embarrassing than their previous Pap test (personal communication, Dorota Gertig, Medical Director, Victorian Cervical Cytology Register, July 2015). Secondly, a telephone survey in which women were asked about the option of home-based self-collection found that almost two-thirds of women who were unscreened or underscreened preferred this option to clinician-collected samples.23 Time since the most recent cervical screening test was the only significant factor associated with a preference for self-collection, with women who were up to date with screening less likely to prefer self-collection (27%) than women who had never been screened (62%; odds ratio [OR], 4.16; P < 0.001) or had not been screened in the previous three years (65%; OR, 5.19; P < 0.001). Women who did not favour self-collection most commonly cited a preference for seeing a general practitioner and a lack of confidence in their ability to collect the sample properly. This suggests that the model proposed for the NCSP, where self-collection is facilitated by a practitioner who also performs mainstream screening, is appropriate, as women may be reassured about their ability to perform the test by the facilitating provider or elect to have their practitioner collect a sample. However, some of the women who are currently less likely to participate in screening, including Aboriginal and Torres Strait Islander women, migrants, and those from lower socio-economic groups, were under-represented in the survey.

One concern about self-collection is that women who currently attend the mainstream program may switch to self-collection, and this could lead to a less effective program overall. The proposed model of restricting self-collection through a screening provider to under- and unscreened women is designed to reduce this problem. The results from our study provide additional information for both the provider and the woman by quantifying both the benefit of self-collection for unscreened women and the additional benefit of remaining in the mainstream program. Findings from a recent modelling study in the Netherlands suggest that, to maintain the overall effectiveness of a program including targeted self-collection, it is crucial that women at the greatest risk are among those who adopt self-collection and that a sufficiently accurate test is used.24 Our results also underline the importance of using a sufficiently accurate test and partial genotyping for HPV16/18 for ensuring comparable long term cancer outcomes in self-collected and clinician-collected samples.

The strengths of this study include the use of a robust model that has been calibrated against a large number of program outputs, and that clinical management pathways incorporated detailed local expert input.10 Another strength is that it included estimates for women offered vaccination during early adolescence, meaning the results will remain informative into the future. When self-collection first becomes available for unscreened women aged 30–74 years in 2017, the youngest women eligible will have been 20 years old when the HPV vaccination program commenced. A sizeable proportion of these women will have been vaccinated (30–63% with three doses),14 although possibly with lower effectiveness than in the cohorts modelled here.25 The absolute benefit of screening in these intermediate cohorts will potentially be slightly higher than for those offered vaccination at age 12, but our results suggest that the relative reductions are similar in both unvaccinated cohorts and those offered vaccination. Our results for cohorts offered vaccination will be fully applicable to women turning 30 from 2026.

As our results are intended to provide guidance for women and clinicians when making decisions, a limitation to our study is that compliance with recommended follow-up tests and procedures was assumed to be perfect. This assumption means our results cannot be directly interpreted as population-wide results; this was beyond the scope of the current study. However, trial data support the strong benefits we found from even a single screening round (further discussion in the Appendix, section 7), and these benefits did not vary substantially across the range of compliance assumptions examined. Self-collection at regular intervals was not evaluated, given the greater uncertainties in the evidence concerning the use of self-collection for routine screening, and because self-collection is not intended as a regular replacement for clinician-collected samples.

Our results support offering self-collection to women who are unscreened and reluctant to join the mainstream screening program, including older women, for whom the balance between benefits and harms remains very favourable. However, the level of protection achieved by joining the mainstream program and thereafter undergoing regular screening, even at older ages, is far greater. Engaging women and redressing barriers to their participation in the mainstream program must remain a primary focus.

Box 1 –
Impact of screening decision at age 30 years on the future risk of cervical cancer diagnosis and death, and treatment for pre-cancer, for a cohort of 100 000 previously unscreened women aged 30 years (unvaccinated cohort)

Number of women affected by cervical cancer, by age:


40 years

50 years

60 years

Lifetime*


Cervical cancer diagnosis

Join program

99

120

139

205

1 × clinician-collected

104

245

476

1187

1 × self-collected

140

316

572

1299

Remain unscreened

312

811

1299

2207

Relative risk reduction compared with remaining unscreened, by age:


40 years

50 years

60 years

Lifetime*


Cervical cancer death

Join program

22

26

30

45

1 × clinician-collected

22

46

117

490

1 × self-collected

28

62

145

531

Remain unscreened

53

177

367

895

Died from other causes

488

1655

4195–4202

39 509–39 780

Cervical cancer diagnosis

Join program

68%

85%

89%

91%

1 × clinician-collected

67%

70%

63%

46%

1 × self-collected

55%

61%

56%

41%

Cervical cancer death

Join program

58%

85%

92%

95%

1 × clinician-collected

58%

74%

68%

45%

1 × self-collected

47%

65%

61%

41%

Women ever treated for cervical pre-cancer, by age:


40 years

50 years

60 years

Lifetime*


Join program

7373

8498

9143

9894

1 × clinician-collected

5973

6018

6019

6019

1 × self-collected

5235

5277

5278

5279


* Until (and including) 84 years of age. † Five-yearly human papilloma virus (HPV)-based screening with partial genotyping; colposcopy referral for women testing HPV16/18 positive; liquid-based cytology triage for other oncogenic HPV types.

Box 2 –
Cumulative numbers of cervical cancer diagnoses (A, B) and deaths (C, D) averted in women screened for human papillomavirus (HPV) at age 30 (compared with remaining unscreened), by attained age, in unvaccinated women (A, C) and women offered vaccination at age 12 (B, D)

Box 3 –
Cervical cancer incidence and mortality in women screened or unscreened for human papillomavirus (HPV), by attained age

Box 4 –
Cervical cancer diagnoses averted to age 84 by one screening round (A, B) and number needed to treat to avert a cancer diagnosis (NNT) (C, D), compared with remaining unscreened, in unvaccinated women (A, C) and women offered vaccination at 12 years of age (B, D)

HPV vaccine impact in Australian women: ready for an HPV-based screening program

In 2017, Australia is moving to a new state-of-the-art, evidence-based cervical screening program using primary human papillomavirus (HPV) DNA testing for all women, whether they have received HPV vaccination or not. Commencing HPV screening at 25 years of age is only possible in the context of a decrease in high-risk HPV prevalence in young women. This is because in an unvaccinated population of young women, infection with HPV (particularly the most oncogenic types, HPV 16 and 18) is common and would result in over-referral of women who test positive for HPV 16 or 18 to colposcopy for infections never destined to persist or cause disease. Since the implementation of the quadrivalent HPV vaccination program in Australia between 2007 and 2009, when over half of all women aged 12–26 years were fully vaccinated, the prevalence of HPV 16 and 18 in young women has declined dramatically.1,2

Using Victorian Cervical Cytology Registry data, including those from 2014, we present for the first time evidence that strongly suggests that the impact of the vaccination program on histologically confirmed cervical pre-cancerous lesions now extends to women aged 25–29 years (a 17% decline in the past 2 years from 18.8/1000 to 15.6/1000 [χ2 = 18.6; P < 0.0001]) (Box). We also note the first sign of a decline in the underlying rising rates of high-grade lesions in 30–34-year-olds as vaccinated cohorts reach this age range. Women in these age groups were aged 18–26 years at vaccination; therefore, although many were sexually active before vaccination, the benefits of vaccination are now measurable, as incident HPV 16 and 18 infections that would otherwise have been acquired in the years since vaccination, and their consequent high-grade lesions, are prevented.3 Initial declines (from 2009) occurred in the youngest women (< 20 years), with increases in prevalence observed in older women through the vaccination period. These increases appear to be a continuation of the underlying trend over the past decade of increasing rates of abnormality, exacerbated by the increased screening of higher-risk women (under-screened and never-screened) documented around the time of the vaccination program relating to prominent media messaging and campaigns regarding HPV and cervical screening.4 HPV vaccine cannot treat pre-existing infection or disease. It is possible that the illness and eventual death in 2009 of the young reality television star, Jade Goody, from cervical cancer in the United Kingdom also influenced screening behaviour, as seen in contemporaneous UK screening program data that noted similar increases in disease detection.5

These new findings of continuing and extending declines in the prevalence of cervical disease are in line with modelling studies underpinning the new screening program6 and indicate that the promise of HPV vaccines is coming to fruition in disease prevention. In combination with the new cervical screening program, Australian women will have protection against cervical cancer that is highly effective and evidence based.

Box –
Trends in prevalence rates of high-grade histologically confirmed cervical abnormalities∗ diagnosed in Victorian women, by age group, 2000–2014


4v HPV = quadrivalent human papillomavirus. ∗ Using Australian Institute of Health and Welfare indicator 4.2, which includes high-grade squamous abnormality, cervical intraepithelial neoplasia (CIN) grade 2, CIN grade 3 or CIN not otherwise specified; high-grade endocervical abnormality, endocervical dysplasia; and high-grade endocervical abnormality, adenocarcinoma in situ (http://www.aihw.gov.au/publication-detail/?id=60129550871).

“Good kid, mad system”: the role for health in reforming justice for vulnerable communities

Let’s invest in better services for high-risk communities rather than in more prisons

Australia’s prisoner population is expanding at an unsustainable rate. Incarceration rates are higher than at any time since federation, and substantially higher than those in most western European countries.13 Incarceration rates of Indigenous Australians match those of African Americans; these are the most intensely incarcerated subpopulations in the world.1 The over-representation of Indigenous Australians in all stages of the justice system is one of Australia’s most significant social justice issues. Australian governments are grappling with the costs of building new prisons and, more broadly, fulfilling “tough-on-crime” agendas.4 At the same time, human rights arguments for reducing overincarceration of Indigenous peoples are aligning with the economic imperatives to contain prison costs.5

It is time to redesign our criminal justice system to redress the over-reliance on incarceration as the means of achieving safer communities. In Australia, the Human Rights Law Centre has joined the call to tackle the causes of crime. Director of International Advocacy, Ben Schokman, said:

The evidence is clear that governments should be spending less money on prisons and investing more in tackling the causes of crime. Every dollar spent on prisons is one less dollar available to spend on education, health, support services for people with disability, training and employment programs, or providing adequate public housing. There are much smarter approaches that build stronger communities, reduce crime and save taxpayers millions of dollars by avoiding wasteful prison spending.6

A substantive reconfiguration of mental health, disability and substance misuse services is essential to provide comprehensive treatment rather than punishment for vulnerable people.

The health of prisoners

Ill health, social disadvantage and incarceration are deeply interconnected and mutually reinforcing. Those most at risk of incarceration are among the most vulnerable in society, with a complex array of health and social needs and multiple risk factors for ill health.5,7 Mental health problems, substance misuse, learning and cognitive difficulties, hearing loss and other physical health problems, including high rates of trauma and acquired brain injury, feature prominently. Prisoners have also experienced high levels of traumatic life experience, including family violence and sexual abuse in childhood and as adults (Box).9 The interactions between encounters with the justice system by, and human services provided for Aboriginal people — particularly those with mental and cognitive disabilities — have been well articulated. Their needs are particularly acute and are poorly serviced by past and current policies and programs.10

While Australia-wide studies indicate that many prisoners report improvements in their health while incarcerated,8 prison experience almost universally compounds their health and social disadvantage after release, and mortality rates are significantly higher for those who have been incarcerated and released. In a New South Wales data-linkage study, over an 8-year period after incarceration, men had 3.7 times the mortality rate of their age- and sex-matched peers, while for women it was 7.8 times greater.11

Mental health, traumatic stress and disability

Proper mental health, disability and substance misuse services are the cornerstone of an improved health service response for those at risk of offending.

Current mainstream mental health services — from primary through to tertiary level — are ill-equipped to respond systematically to the complexity of problems facing vulnerable clients.2 Provision of comprehensive trauma-informed services is grossly under-resourced and is only available to a select few. People experiencing crippling levels of traumatic stress and emotional distress, outrage and anger problems, cognitive impairment and substance misuse concerns — often co-occurring — are rarely supported adequately when they present to mental health services.10

There is no evidence that vulnerable clients with a history of involvement with the justice system pose additional risk to service providers, yet they are, at times, excluded from mental health and substance misuse services. Discriminatory practices categorising people as “mad, sad or bad” are simplistic and unhelpful. Too often, clients are inappropriately deemed dangerous or undeserving and, based on an assessment of risk to staff, may subsequently be denied access to care.

People with an intellectual disability, and particularly Aboriginal people, are even more compromised. Support systems can break down at every point in the system — from police assessment and gathering of evidence to advocacy during court and legal processes; from the lack of community alternatives to sentencing with the potential risk of further exploitation and recruitment into illegal behaviours to increased recidivism. Fetal alcohol spectrum disorder and acquired brain injury, as parts of the cognitive impairment spectrum, should be considered at every stage of the criminal justice system. Those with cognitive impairment and mental health or substance misuse problems — whose offences are predominantly non-violent — have among the highest rates of involvement with criminal justice services, and this involvement starts earlier in their lives and persists for longer. Those who are afforded support through disability services fare much better than those who do not receive such support.10

A better coordinated service system

Well designed service responses for those with the most complex needs have the potential to significantly reduce incarceration rates and to support vulnerable people to achieve satisfying, socially contributing lives. However, Australia’s prisons are overflowing with people who, throughout their lives, have been denied appropriate health and social services. Many vulnerable people, often with limited capacity to advocate for their own needs, fall through very wide gaps in service delivery and are, in effect, efficiently channelled into the justice system from an early age.

For change to occur, health services, social services and justice services must work collaboratively with improved information sharing and shared management plans. Currently, health services are not always aware if their clients are concurrently involved in the justice system. Those who are rarely confide such information for fear of discrimination, or because they are not asked. Similarly, magistrates and the police are not always adequately aware of health and social problems that may be influencing a person’s offending.

There are encouraging innovative models at the interface of health, social and legal services. Advocacy health alliances, such as the Health Justice Partnership project in Bendigo, Victoria, are providing legal services to patients within health care settings. The Neighbourhood Justice Centre in Collingwood, Victoria, employs therapeutic jurisprudence principles in a problem-solving court to link sentencing to community-based health and social support services, creating complete treatment, rehabilitation and social support for offenders with a broad range of health and substance misuse problems.12

It is time for a transformation. A dedicated focus by all levels of government, including the federal level, on reducing incarceration is needed, in proper partnership with Indigenous communities and organisations. This would acknowledge the connection between health and social interventions and justice outcomes so that services could be adequately resourced to tackle the health and social determinants of crime.

A new policy response — justice reinvestment

Imprisonment is expensive. Adult prison beds cost between $250 000 and $500 000 for infrastructure and around $100 000 to run each year.13 Youth justice beds cost around $200 000 per year.13 In the 2013–14 financial year, direct costs of imprisonment increased nationally by about $1million every day.13

An innovative policy idea that is gaining traction is justice reinvestment (JR). JR can be conceived as both a philosophy for justice reform and a set of strategies that examine spending on incarceration, so that funds that might be spent on incarceration are instead reinvested into health and social interventions that reduce offending in communities with the sociodemographic features that disproportionately contribute to prisoner populations. The idea springs from an understanding that overincarceration affects communities in ways that perpetuate cycles of crime. As a systems-based approach, JR encompasses a comprehensive range of areas such as health, housing, employment, justice, family support, mental health and substance misuse services. It impels policymakers to consider the implications of current punitive policies that result in more incarceration, particularly of Indigenous Australians, and instead fund initiatives that redress the health and social determinants of incarceration.14

In the United States, JR strategies have had some success in ameliorating health and social disadvantage associated with offending and, depending on the JR model implemented, have achieved reductions in offending and incarceration rates. For example, in Texas since 2007, investing in community-based drug and mental health treatment services and improved supervision has averted $US1.5 billion in prison construction costs, saving $US340 million in annual operating costs.15 Evidence from US initiatives suggests better outcomes are achieved when responses are data driven, evidence based and directed at those at highest risk.15

While JR policy has not yet been adopted by any Australian jurisdiction, so local evidence of its effectiveness is not yet available, preliminary work is being undertaken in several regional locations, including Bourke and Cowra in NSW, Ceduna in South Australia and Katherine in the Northern Territory. In 2014, the Australian Capital Territory Government announced a commitment to developing a JR strategy, using data-driven evidence to guide stakeholder consultations across health, human and justice services systems.

Proponents of JR do not claim it to be the solution in the Australian context, nor will it automatically solve problems of racial disparity. However, it has the potential to offer a shared framework for government, non-government organisations and other services to explore and commit to holistic community investment and solutions.4

Conclusions

Prisons exist as part of the comprehensive response to keep communities safe. However, when overused, prisons can break spirits and further alienate and disenfranchise many who would be capable of being engaged, contributing members of families and communities if they were supported rather than punished. Health care practitioners have an important role to play in understanding the many needs of clients at risk of engagement with the justice system and in advocating strongly for community-based service models that provide for these clients.

No matter how well health care in prisons is administered, incarcerating people does not constitute a cost-effective “opportunity” to invest in their health. Providing responsive, community-based health and social services attuned to the needs of those who are vulnerable to imprisonment represents a highly preferable allocation of resources. Achieving successful outcomes depends largely on increased interdisciplinary collaboration and the greater availability of safe, well designed and resourced community-based options within health and social services, in urban, regional and remote settings.

High-quality responses may appear costly and even politically elusive. But such a reinvestment of funds and redesign of the system would unquestionably deliver far greater individual and societal benefits — indeed, better justice — than our current inequitable, outdated and costly services.

Box –
The health of prisoners in Australia8

Health factors

Percentage affected


Mental health

Overall on admission

46%

Including substance misuse and personality disorder

Females, 90%; males, 75%

Traumatic stress

Females, 75%

Substance misuse

Alcohol, risky use

54%

Illicit drug use in the past 12 months

70%

Tobacco smoking

Currently smoking

Overall, 85%; Indigenous, 92%

Wanting to quit

46%

Disability

Intellectual disability (IQ, < 70)

10%

Borderline intellectual capacity or lower (IQ, < 80)

30%

History of traumatic brain injury

80%

Physical health

Chronic disease

32%

Hepatitis C

22%

Hearing loss

Northern Territory Indigenous people, 90%


Methamphetamine in wastewater 5x higher

METHAMPHETAMINE residue has been found in wastewater of an Australian coastal city at levels almost 5 times what they were in 2009, suggesting a corresponding increase in methamphetamine use, according to a Short Report published today in the Medical Journal of Australia.

Researchers from the University of Queensland and the Queensland University of Technology used liquid chromatography and mass spectrometry to analyse 498 wastewater samples drawn from a coastal metropolitan city in south-east Queensland between 2009 and 2015, and 712 samples from a major inland regional city (2010-2015).

“Methamphetamine consumption (measured in mg per day per 1000 inhabitants) was higher in the metropolitan city than in the regional city, and levels in both locations increased significantly between 2009–2010 and 2015.

“Consumption increased 4.8 times in the metropolitan area between 2009 and 2015, and 3.4 times in the regional city between 2010 and 2015,” the researchers wrote.

“Our data do not allow us to decide whether methamphetamine consumption has increased because there are more new users, because current users are consuming higher doses of a purer drug, or as a result of a combination of these possibilities.”

The study, the authors wrote, showed the value of wastewater analysis for providing timely data on trends in illicit drug use.

For the full study go to the MJA.

Comparing colorectal cancer treatment and survival for Aboriginal and non-Aboriginal people in New South Wales

Previous studies of colorectal cancer survival in New South Wales,1 South Australia,2 Queensland3 and the Northern Territory4 have found that survival tended to be poorer for Aboriginal than for non-Aboriginal people. These studies identified disease factors and less access to primary and follow-up treatments as possible reasons for the survival disparities.

The recommended treatment for colorectal cancer is generally surgery combined with adjuvant chemotherapy or radiotherapy, depending on the cancer type and extent of disease.5,6 Treatment guidelines also highlight the importance of post-surgical follow-up care, as one in three people will die from disease recurrence after initial treatment.3 However, the Australian guidelines available during the study period for this article did not describe a specific protocol for follow-up care.5,6

Our main aim was to compare the treatment and survival rates for Aboriginal and non-Aboriginal people diagnosed with colorectal cancer in NSW using routinely collected, population-based linked data. We also estimated the proportions of a sample of NSW Aboriginal people with colorectal cancer who received chemotherapy or radiotherapy.

We respectfully use the descriptor “Aboriginal people” throughout this report to refer to the original people of Australia and their descendants.

Methods

We analysed two different linked datasets, both of which have been described previously:7,8 data from the NSW Population-wide Study (2001–2007) and data from the Patterns of Care study (2001–2011). The NSW Population-wide Study data comprised incident cancer cases linked with hospital separations data and death records; the Patterns of Care study data comprised information collected in an audit of medical records of Aboriginal people with colorectal cancer (diagnosed during the period 2000–2011) linked to incident cancer cases, hospital separations data and death records. People were eligible for inclusion in the study if they were NSW residents diagnosed with primary colorectal cancer (International Classification of Diseases, revision 10, topography codes C18–C20, and International Classification of Diseases for Oncology morphology codes ending /3) and 18 years or older.

NSW Population-wide Study

Data sources

Demographic and disease information for all eligible people diagnosed with colorectal cancer during the period 2001–2007 was obtained from the NSW Central Cancer Registry. Cases were matched by the Centre for Health Record Linkage (CHeReL) with inpatient records from the NSW Admitted Patient Data Collection (APDC), death records from the NSW Registry of Births, Deaths and Marriages, and coded causes of death in Australian Bureau of Statistics (ABS) data. A person was determined to be Aboriginal if they were identified as Aboriginal in any of their linked records.

Variables for analysis

Information from the Clinical Cancer Registry included month and year of diagnosis, age at diagnosis, and spread of disease at diagnosis (reported as localised, regional, distant, or unknown). Cancers were also categorised by site (colon, rectum, or rectosigmoid junction).

Using the Accessibility and Remoteness Index for Australia (ARIA+),9 the Local Government Area (LGA) of residence of participants at diagnosis was categorised as major city, inner regional or rural (“rural” comprising outer regional, remote, and very remote). The LGA of residence at diagnosis was also assigned to a quintile of socio-economic disadvantage according to the Index of Relative Socio-economic Advantage and Disadvantage.10

We restricted our analysis to surgical treatment, both planned and emergency, as other studies have shown a high concordance between surgery recorded in the APDC and clinical audits of medical records.11

Comorbidities were any non-cancer conditions described in the Charlson Comorbidity Index12 that were recorded for any hospital admission in the 12 months before and the 6 months after diagnosis with colorectal cancer. People not admitted to hospital during this period were recorded as having “no comorbidity information available”.

Statistical methods

Analyses were performed with SAS 9.2 (SAS Institute) and R 3.0.0 (R Foundation for Statistical Computing). We used Pearson χ2 tests to compare demographic data for Aboriginal and non-Aboriginal people. Logistic regression was initially used to compare the unadjusted odds of Aboriginal and non-Aboriginal people having surgery within 12 months of diagnosis. We then fitted a multivariable model by adding the variables sex, age at diagnosis, year of diagnosis, site of cancer, spread of disease, comorbidities, socio-economic disadvantage, and place of residence.

Colorectal cancer-specific survival was analysed with cumulative incidence curves and Cox regression models. Follow-up was censored at 31 December 2008 for all people whose deaths were not recorded. People who died from other causes were censored at the date of death. Variables were entered into the model described above, with the addition of surgical treatment as a variable. We included the statistically significant interaction between surgery and Aboriginal status in the final model. The proportional hazards assumption for Aboriginal status was satisfied in the final model.13

The probabilities of having a colonoscopy between 3 months and 3 years post-surgery were estimated for Aboriginal and non-Aboriginal people with localised or regional spread at diagnosis using cumulative incidence curves, with the competing risk of death without a colonoscopy included in the analysis.14

Patterns of Care (POC) study

Variables for analysis

The information collected from 23 public hospitals and three clinical cancer registries included age, sex, year of diagnosis, spread of disease, postcode of residence, and comorbidities. Postcode of residence was used to assign quintiles of socio-economic disadvantage10,15 and ARIA&plus; category.9 Treatment information (surgery, chemotherapy and radiotherapy) included start and end dates, and reasons for incomplete or no treatment. We merged data for people who attended several hospitals, and data were checked for appropriate ranges of responses and any anomalies.

Ethics approval

The collection of the POC data was approved by the Royal Prince Alfred Hospital Human Research Ethics Committee (reference, 08/RPAH/374) and the Aboriginal Health and Medical Research Council (AH&MRC; reference, 636/08). Local Regional Governance Offices granted site-specific approval for data collection in participating hospitals and clinical cancer registries. Linkage of the POC data to the population datasets was approved by the NSW Population and Health Services Research Ethics Committee (reference, 2011/04/319) and the AH&MRC Ethics Committee (reference, 791/11). Analysis of the NSW population data was approved by the NSW Population and Health Services Research Ethics Committee (reference, 2006/04/004) and the AH&MRC committee (reference, 550/06).

Results

NSW Population-wide Study

Characteristics

During 2001–2007, 30 448 people were diagnosed with primary colorectal cancer in NSW. We excluded 281 people notified to the Clinical Cancer Registry by death certificate only (0.9% of all cases) and 390 people (1.3%) with no matching hospital inpatient record (Box 1). This resulted in a final sample of 29 777 people, of whom 278 (0.9%) were identified as Aboriginal.

Compared with non-Aboriginal people (median age, 71 years), the Aboriginal people in our study were younger (median age, 64 years), more likely to live outside major cities and in socio-economically disadvantaged areas, and to have diabetes and chronic pulmonary disease at the time of their cancer diagnosis. Cancer site, disease spread at diagnosis, and the proportions of men and women were similar for Aboriginal and non-Aboriginal people (Box 2).

Surgical treatment

Aboriginal and non-Aboriginal people had the same median time to surgical treatment (13 days; interquartile range [IQR] for non-Aboriginal people, 1–33 days; IQR for Aboriginal people, 2–28 days), and the proportions who had received surgical treatment within 12 months of diagnosis were also similar (76% and 79% respectively) (Box 2). After accounting for differences in sex, age at diagnosis, year of diagnosis, spread of disease at diagnosis, cancer site, place of residence at diagnosis, comorbidities, and socio-economic disadvantage, there was no significant difference in the likelihood of Aboriginal and non-Aboriginal people receiving surgical treatment (odds ratio for Aboriginal people receiving surgical treatment, 0.93; 95% confidence interval [CI], 0.68–1.27).

Survival

For the first 18 months after diagnosis, mortality among people with colorectal cancer was similar for Aboriginal and non-Aboriginal people (Box 3). However, from 18 months a difference between the two groups was apparent, and by 5 years after diagnosis the cumulative mortality from colorectal cancer was 43% for Aboriginal people, compared with 33% for non-Aboriginal people (Box 4).

The unadjusted risk of death from colorectal cancer for Aboriginal people was 33% greater than for non-Aboriginal people (hazard ratio [HR], 1.33; 95% CI, 1.09–1.61; P = 0.006). For those who did not have surgical treatment, the risk of death after adjusting for sex, age at diagnosis, year of diagnosis, spread of disease, site of cancer, comorbidities, socio-economic disadvantage, and place of residence, was similar for Aboriginal and non-Aboriginal people (HR, 1.05; 95% CI, 0.70–1.50). However, the adjusted risk of death among those who had received surgical treatment was 68% greater for Aboriginal than for non-Aboriginal people (HR, 1.68; 95% CI, 1.32–2.09) (Box 4). The risk of death for those who had had surgical treatment was similar for Aboriginal and non-Aboriginal people during the first 18 months after diagnosis (Box 5).

Aboriginal and non-Aboriginal people who had received surgical treatment had similar rates of emergency surgery (Box 2) and median lengths of stay in hospital (10 days). During the admission for surgical treatment, 15% of Aboriginal and 13% of non-Aboriginal people had post-surgical complications (difference, 2%; 95% CI, −2.7% to 6.9%); 2% of Aboriginal people and 3% of non-Aboriginal people died within 30 days of surgery (difference, −1%; 95% CI, –2.9% to 1.2%).

By 18 months after surgery, 45% of Aboriginal people had had a colonoscopy, compared with 55% of non-Aboriginal people (Box 6). However, the proportions after 3 years were 59% for Aboriginal people and 65% for non-Aboriginal people.

Patterns of Care study

Characteristics

Compared with the Aboriginal people recorded in the NSW Population-wide Study data, the 145 Aboriginal people with colorectal cancer whose medical records we reviewed were, on average, younger at diagnosis (median age, 61 years), more likely to live outside major cities, and less likely to have been diagnosed with rectal cancer (Box 2, Box 7). As the two samples overlapped, formal statistical comparisons could not be made.

Surgical treatment

Overall, 117 people (81%) had received surgical treatment within 12 months of diagnosis. The proportions of people receiving surgical treatment were 82% for people with colon cancer, 77% for people with rectal cancer, and 82% for people with cancer in the rectosigmoid junction.

Adjuvant chemotherapy and radiotherapy

Of those who received surgical treatment, 48% also received adjuvant chemotherapy and/or radiotherapy. Of the 56 people with regional spread of disease, ten (18%) did not receive adjuvant treatment. Reasons for not receiving adjuvant treatment included the choice of the patient, and advice from their doctor that the associated harms would probably outweigh the benefits. Of the 42 people with localised disease who had surgery, three (7%) also received adjuvant treatment.

Discussion

We found that the 5-year survival rate was lower for Aboriginal people in NSW with colorectal cancer than for non-Aboriginal people, despite their being, on average, younger at diagnosis and having a similar spread of disease, similar surgical treatment rates, and similar times to surgery. This disparity in survival was evident from 18 months after diagnosis, and was largely confined to those who had received surgical treatment, although we found no differences in post-surgical complications or in the 3-year rates of follow-up colonoscopy. We also found that the Aboriginal people in our POC data received adjuvant chemotherapy and radiotherapy at levels similar to those reported in a previous population-based survey of colorectal cancer care in NSW16,17 and in a more recent analysis of node-positive cases.18

The survival disparity was only observable from 18 months post-surgery, suggesting that Aboriginal people may have had higher rates of disease recurrence, recurrence that was not identified because of poorer follow-up, lower rates of follow-up colonoscopies to detect new tumours, or lower rates of adjuvant therapies. However, we observed no significant differences (when compared with non-Aboriginal people) in planned or emergency post-surgical admissions, or in the receipt of adjuvant therapies, and no differences in the rates of colonoscopy up to 3 years after surgery. Alternatively, the observed difference in mortality between Aboriginal and non-Aboriginal people may be due to differences in the proportions of people with microsatellite unstable tumours or to other tumour characteristics; information in this regard, however, was not available for this study.

As we found that Aboriginal people with colorectal cancer had poorer survival outcomes than non-Aboriginal people, but no obvious differences in the treatment or follow-up they received, it is plausible that small differences and delays along the treatment pathway, perhaps caused by cultural barriers, contribute to lower survival. This has been found for M&amacr;ori people accessing chemotherapy for stage III colon cancer in New Zealand.19

That Aboriginal people with cancer generally have poorer survival outcomes than non-Aboriginal people with cancer has been reported by other Australian studies, with health care access and cultural differences generally being identified as factors underlying this disparity.13,7 The Cancer Institute NSW recently reported that Aboriginal people had a 63% increased risk of death from bowel cancer after adjusting for age and year of diagnosis and for spread of disease;1 this report did not, however, adjust for comorbidities, surgical treatment, sex, place of residence, socio-economic disadvantage, or cancer site. Similarly, a South Australian study reported that Aboriginal people with bowel cancer had a 5-year survival rate of 34.1%, compared with 56.1% for non-Aboriginal people.2 An older study of cancer survival in the Northern Territory4 attributed the higher risk of death for Aboriginal people to their having poorer access to quality health services, perhaps because of a lack of “social proximity” to these services.

Qualitative research on the health care received by Aboriginal people with cancer20 has identified several cultural barriers that may contribute to delays in their accessing mainstream health services (such as follow-up colonoscopies), including feelings of fatalism, shame, and embarrassment about colorectal cancer. More recent studies have identified lower health literacy,21 feelings of social exclusion when in hospital,22 and health services not fully responding to cultural differences as potential barriers to optimal care for Aboriginal people.23

Our analysis of the NSW Population-wide Study data is the first to include detailed information about the influence of comorbidities on surgical treatment and survival for Aboriginal people with colorectal cancer. However, it does have some limitations. First, the identification of Aboriginal people is dependent on correct recording of their status in the source datasets. As 98% of the Australian population is non-Aboriginal, the chance of positive misclassification is low, and we attempted to minimise under-identification of Aboriginal people by accepting any record of Aboriginal status in any linked record, including admissions not related to cancer. Second, using ABS information on deaths to identify Aboriginal people may have biased our survival results. In a sensitivity analysis we found, however, that using the APDC alone to determine Aboriginal status reduced the proportion of Aboriginal people who died from colorectal cancer within 5 years of diagnosis from 43% to 37%, and the overall survival patterns were similar to those reported here. Other potential sources of error include the possibility that we did not fully account for potential confounding factors that might contribute to the observed differences in survival, and measurement errors in the recording of covariates, such as comorbidities and spread of disease at the time of diagnosis. In addition, socio-economic disadvantage and place of residence were determined at the LGA level, and may thus be a source of measurement error. Further, although the POC data included more detailed information on the medical treatment of Aboriginal people with colorectal cancer than any other published study, the representativeness of the results may be limited, as we included only people from 23 hospitals and three clinical cancer registries.

Conclusion

Aboriginal people with colorectal cancer who had received surgery had lower survival rates than non-Aboriginal people, even though we found no overall differences in time to surgery, surgical rates, post-surgical complications, or receipt of adjuvant therapies or follow-up colonoscopies. However, small differences and delays along the cancer treatment pathway, possibly caused by cultural barriers to health care, may have resulted in lower survival for Aboriginal people with colorectal cancer. To ensure that survival rates improve, further work is needed to understand and reduce potential barriers to Aboriginal people with colorectal cancer receiving the best care.

Box 1 –
Inclusion and exclusion criteria for the NSW Population-wide Study of colorectal cancer diagnosed during 2001–2007 in New South Wales

Box 2 –
Comparison of socio-demographic and clinical data for 29 777 Aboriginal and non-Aboriginal people diagnosed with colorectal cancer during 2001–2007 in New South Wales

Aboriginal


Non-Aboriginal


P

Number

%

Number

%


Total number

278

29 499

Sex

0.864

Men

150

54%

16 068

54%

Women

128

46%

13 431

46%

Age at diagnosis, years

< 0.001

18–49

47

17%

1901

6%

50–59

49

18%

4256

14%

60–69

81

29%

7678

26%

70–79

77

28%

9216

31%

≥ 80

24

9%

6448

22%

Place of residence at diagnosis*

< 0.001

Major cities

114

41%

20 184

68%

Inner regional

103

37%

7177

24%

Rural

61

22%

2138

7%

Site of cancer

0.555

Colon

174

63%

19 342

66%

Rectum

81

29%

7785

26%

Rectosigmoid

23

8%

2372

8%

Spread of disease at diagnosis

0.551

Localised

98

35%

9985

34%

Regional

102

37%

11 801

40%

Distant

54

19%

4977

17%

Unknown

24

9%

2736

9%

Socio-economic disadvantage*

< 0.001

Least disadvantaged

15

5%

5296

18%

Second least disadvantaged

34

12%

6324

21%

Third least disadvantaged

43

15%

4762

16%

Second most disadvantaged

67

24%

6218

21%

Most disadvantaged

119

43%

6899

23%

Comorbid conditions

Diabetes

56

21%

4321

15%

0.009

Cardiovascular disease§

52

19%

4405

15%

0.071

Chronic pulmonary disease

33

12%

2360

8%

0.016

Renal disease

14

5%

1262

4%

0.518

Liver disease

8

3%

810

3%

0.879

Other comorbid conditions

17

6%

2511

9%

0.162

Surgical treatment by 12 months post-diagnosis

0.480

Emergency presentation

36

13%

3651

12%

Planned surgical treatment

176

63%

19 641

67%

No surgical treatment

66

24%

6207

21%


* Based on Local Government Area of residence at time of diagnosis. † “Rural” includes outer regional, remote and very remote. ‡ Comorbidities were not available for 453 people, of whom six were Aboriginal and 447 were non-Aboriginal. § Myocardial infarction, congestive heart failure, peripheral vascular disease, or cerebrovascular disease.

Box 3 –
Cumulative mortality from colorectal cancer for 278 Aboriginal and 29 499 non-Aboriginal people diagnosed in New South Wales during 2001–2007

Box 4 –
Mortality and hazard ratios for death from colorectal cancer for 278 Aboriginal people, compared with those for 29 499 non-Aboriginal people in New South Wales during 2001–2007


Hazard ratios for death from colorectal cancer (v non-Aboriginal people)

Aboriginal (unadjusted)

1.33 (95% CI, 1.09–1.61)

Aboriginal (adjusted)*

Surgical treatment

1.68 (95% CI, 1.32–2.09)

No surgical treatment

1.05 (95% CI, 0.70–1.50)

Unadjusted mortality 5 years after diagnosis

Aboriginal

43%

Non-Aboriginal

33%


* Adjusted for sex, age at diagnosis, year of diagnosis, place or residence, site of cancer, spread of disease at diagnosis, socio-economic disadvantage, and comorbid conditions.

Box 5 –
Cumulative mortality from colorectal cancer for 278 Aboriginal and 29 499 non-Aboriginal people diagnosed in New South Wales during 2001–2007, by surgical treatment received

Box 6 –
Cumulative incidence of colonoscopy after surgery for colorectal cancer for 212 Aboriginal and 23 292 non-Aboriginal people diagnosed in New South Wales during 2001–2007*


* Shaded areas represent the 95% confidence intervals.

Box 7 –
Characteristics of 145 Aboriginal people in the Patterns of Care Study data diagnosed with colorectal cancer in New South Wales during 2001–2010

Number

%


Sex

Men

83

57%

Women

62

43%

Age at diagnosis, years

18–49

38

26%

50–59

27

19%

60–69

50

34%

70–79

25

17%

≥ 80

5

3%

Place of residence at diagnosis*

Major cities

44

30%

Inner regional

42

29%

Rural

59

41%

Site of cancer

Colon

88

61%

Rectum

35

24%

Rectosigmoid

22

15%

Spread of disease at diagnosis

Localised

51

35%

Regional

57

39%

Distant

34

23%

Unknown

3

2%

Socio-economic disadvantage*

Least disadvantaged

3

2%

Second least disadvantaged

14

10%

Third least disadvantaged

30

21%

Second most disadvantaged

42

29%

Most disadvantaged

56

39%

Comorbidities

Diabetes

26

18%

Cardiovascular disease

25

17%

Chronic pulmonary disease

28

19%

Liver disease

6

4%

Other comorbid conditions

7

5%

Tumour size at diagnosis, mm

0–29

24

17%

30–44

28

19%

45–59

30

21%

≥ 60

29

20%

Not available

34

23%


* Based on postcode of residence at time of diagnosis. † “Rural” includes outer regional, remote and very remote. ‡ Comorbidities not available for five people.

Trends in drug use among adolescents admitted to residential treatment in Australia

In Australia, trends in drug use are primarily measured through two population surveys.1,2 These show alcohol, cannabis and tobacco to be the most commonly used drugs among adolescents. The National Drug Strategy Household Survey found that methamphetamine use has remained very low (2%) and stable among 14–19 year olds, with no rise in methamphetamine use overall in the population; however, there was a change in the main form, with crystal (“ice”) replacing powder.2

Population-level surveys are not sensitive to changes in use of drugs, which have a low prevalence in the general population by different age groups. Our report examines trends in reported current drug use and drug of greatest concern among an adolescent population admitted to four residential treatment sites across New South Wales and the Australian Capital Territory from 2009 to 2014. These young people are likely to be excluded from population surveys.3

The study sample included 865 adolescents, aged 14–18 years, admitted to residential treatment between 1 July 2009 and 31 December 2014, representing a large proportion of the adolescent residential treatment population in NSW and the ACT.4 Analyses included log-binomial regression for trends by admission year and multiple log-binomial regression to control for changes over time in sociodemographic characteristics.

The mean age of the study population was 16.6 years and 72.6% were male (Box 1). Over a third (37.2%) were referred by juvenile justice staff or self-reported criminal activity. Methamphetamine was the only drug to show an upward trend in the reporting of drug of greatest concern (Box 2), from 10.8% in 2009 to 48.4% in 2014 (relative risk [RR] per year, 1.37; 95% CI, 1.27–1.47); and in current use of drug at admission, from 28.8% in 2009 to 59.4% in 2014 (RR per year, 1.15; 95% CI, 1.09–1.22). Trends in methamphetamine use remained significant after controlling for sociodemographic characteristics. Alcohol, cannabis and tobacco use remain high, with 64.1% of participants reporting currently using alcohol, 85.2% cannabis and 72.7% tobacco in 2014.

Among 321 participants reporting current methamphetamine use, those reporting inhaling smoke or vapour increased from 12.5% in 2009 to 85.5% in 2014 (RR per year, 1.21; 95% CI, 1.15–1.27). Different forms of methamphetamine were not recorded; however, ice is commonly inhaled, which suggests that the main form used by participants has changed. There were associations between methamphetamine use and number of places lived and enrolment in a special class at school, suggesting that young people who may have learning difficulties or unstable accommodation may be at a higher risk of methamphetamine use or that use may result in learning issues and unstable accommodation.

Although self-reporting is common in behavioural research, there may be some response bias. For example, recent media attention may have increased reporting of methamphetamine as the drug of greatest concern. Under-reporting of methamphetamine use may also have occurred due to stigma. However, we found similar trends on both measures. The questions used were drawn from scales in the Brief Treatment Outcome Measure, which was developed in six phases including testing psychometric properties with treatment clients, a 30-month clinical trial in selected rural and metropolitan health services and clinician feedback.5

In contrast to stable population-level trends, methamphetamine use among this adolescent population has increased substantially. To equitably address methamphetamine-related harms, population surveys and health campaigns should be supplemented by a targeted approach to monitoring, prevention and treatment of at-risk groups.

Box 1 –
Sociodemographic characteristics of participants (n = 865)*

Characteristic

No. of participants


Mean age, years (SD)

16.6 (1.0)

Male

628 (72.6%)

Ever suspended or expelled from school

725 (83.8%)

Ever enrolled in special class at school

340 (39.3%)

Places lived in previous 6 months

1

287 (33.2%)

2

235 (27.2%)

3

160 (18.5%)

≥ 4

183 (21.2%)

Arrests in previous 3 months

0

279 (32.3%)

1

241 (27.9%)

2–3

233 (26.9%)

≥ 4

112 (12.9%)


* Data are number and proportion of participants unless otherwise indicated.

Box 2 –
Trends in drug of greatest concern, by year of admission (n = 865)

Prescription drug monitoring in Australia: capacity and coverage issues

Recent years have seen increases in prescription of pharmaceutical opioids and benzodiazepines, and in the associated harms.1 This presents challenges for clinicians and governments regarding appropriate monitoring and responses. Real-time prescription drug monitoring programs (RT-PDMPs) are being considered in Australia2,3 to enable detection of drug diversion (when drugs are transferred from a licit to an illicit channel of distribution or use), and inappropriate prescribing or dispensing. RT-PDMPs are supported by professional bodies, but challenges exist for policy makers in terms of capacity and coverage.

Capacity

The success of RT-PDMPs requires clear delineation of what information will be collected, who will have access to it, and how long records will be kept to ensure patient and practitioner privacy. Tasmania’s RT-PDMP (currently the only Australian RT-PDMP) offers benefits over systems which do not provide real-time data,2 but other jurisdictional policy makers must determine whether their systems will be proactive (eg, identify those at risk of abuse), or reactive and rely on prescriber and dispenser requests once a patient is deemed at risk. There is also concern that patients with genuine needs may not receive appropriate prescriptions for fear that they, or the prescriber, may be flagged as a misuser.3,4

RT-PDMPs pose challenges regarding the capacity of health and/or law-enforcement departments to respond. In Australia, 55 000 people were identified as doctor-shoppers in 2005–06.1 The ability of the current system to meet these demands is lacking, with prescribers estimated to be notified in only 5% of doctor-shopper cases.5

An RT-PDMP will increase demand for professional development and specialist support for addiction and pain management, a particular challenge given the current gaps in training and significant shortages of relevant specialists. Potential RT-PDMP administrators, including health and law-enforcement bodies, will need capacity to analyse, interpret and disseminate findings through suitable channels, with necessary policies in place to facilitate appropriate responses.

Coverage

The proposed RT-PDMPs seek to monitor only S8 medications.2 Some opioids (eg, tramadol and codeine) and benzodiazepines (except alprazolam and flunitrazepam) will be excluded, despite their contribution to harm. Such reduction in capacity decreases the ability to investigate possible shifts in prescribing habits towards non-monitored medications. One solution involves staged inclusion of other drugs to respond to changes in prescribing trends, and as new drugs become available.3

To be effective, an RT-PDMP must collect Pharmaceutical Benefits Scheme and private prescription data, and flag potential misuse and diversion at the time of prescribing and dispensing. Diversion can also occur after dispensing (eg, drug sharing and online sales including cryptomarkets which enable online purchaser anonymity),6 but research in these areas is limited. Diversion cannot be entirely identified by RT-PDMP, which highlights the need for clinicians to adopt safe prescribing practices and communicate clearly with patients about their responsibilities.

RT-PDMP may become available outside Tasmania, but issues of coverage and capacity require policy maker attention before implementation to ensure more appropriate monitoring of prescription medications.3

Drug checking to improve monitoring of new psychoactive substances in Australia

Drug checking may need to play a part in future public health interventions

As has been reported previously in the Journal,1 novel psychoactive stimulant drugs are now increasingly prevalent in patients presenting to hospital emergency departments. A further cluster of 11 patients showing confusing hallmarks of sympathomimetic poisoning but no identifiable substance presented to St Vincent’s Hospital in Sydney over a public holiday weekend in April 2015. Also, the start to the 2015–2016 summer festival season has included multiple deaths and hospitalisations following drug use at festivals, leading to calls for novel actions to protect public health.2 Here, we take the opportunity to describe a method of harm minimisation that has been deployed in Europe and could potentially be deployed locally to tackle this problem.

Monitoring new psychoactive substances

New psychoactive substances (NPS) are emerging rapidly into the market, with more than 100 identified in the past year by European monitoring systems.3 Existing psychoactive drug monitoring systems have limited capacity to identify NPS. Their limitations are detailed as follows:

  • self-reports (eg, household surveys and regular interviews with sentinel groups, as reviewed by Burns et al4) can identify what users think they are taking, but not necessarily what they are actually taking;

  • web vendor monitoring (eg, analyses of surface web and dark web [also see Burns et al4]) can identify what vendors report they are selling, but not what is actually sold; and

  • pharmacological analyses (eg, wastewater analyses5) can provide more accurate information about what is actually being consumed, but not what people believe they are consuming.

These monitoring systems have been used to identify NPS and track their use in Australia, but they are not able to characterise the congruency between what people believe they are taking and what they are actually taking. Combining all three of these methods and providing an innovative drug-checking service would strengthen surveillance of drugs being used in festival settings. Accurate and tailored information can facilitate an open dialogue between health care providers and drug users at the point of consumption. Identifying emerging trends in NPS will provide opportunities to prevent harm, and enable our services to respond more effectively to the harms arising from both intentional and unintentional NPS use.

Drug-checking services

Several European countries now provide drug analysis services,6 whereby individuals submit samples of their drugs to have their contents identified and analysed for purity. The results are provided to the consumer. The analytical facility can be based either on-site (eg, at large parties or festivals) or off-site. In some of the European services, brief health interventions aimed at reducing harm are offered to consumers simultaneously. Fast turn-around drug analysis services may have reduced harms resulting from recent episodes of mass intoxications at festival settings by:

  • identifying the NPS and other contents of the pills or powders;

  • monitoring NPS availability and use trends to enable an effective public health response;

  • identifying emerging hazards from specific NPS and the formulations available;

  • improving the knowledge base for effective clinical management of acute and chronic presentations;

  • providing an opportunity for users to seek help, obtain health information to reduce potential harms and to offer options for individual behaviour change; and

  • providing intelligence that could influence supply dynamics.

The optimal method for providing analytical services will depend largely on the social and legal context. In Austria and Switzerland, field workers from a non-government organisation conduct on-the-spot drug analysis to patrons at dance parties via a field laboratory equipped with high-pressure liquid chromatography machines. Samples are received directly from consumers and results are available to them within 20 minutes, accompanied by a brief intervention with referral if required.7 In the United Kingdom, amnesty bins are placed in party venues and a private, not-for-profit laboratory undertakes the analyses to add to a library of NPS. In larger nightclubs, on-site field workers use infra-red mass spectrometry to compare the drugs received with the database. Local accords between police, public health officials and the nightlife venue operators are required to ensure successful integrated services. A network of 26 drug-checking sites in the Netherlands is incorporated into the Ministry of Health as part of a national surveillance system.8 This service offers immediate results of quick office tests to potential users, with intervention and referral if necessary. Subsequently, samples are sent for more accurate spectrometric analysis, and results are available within a week. Most importantly, results are incorporated into the national surveillance system and are monitored for trends in emerging substances, and results are used to inform public policy and practice. While the direct prevention of deaths has not been documented, dangerous pills or powders identified by checking systems in the Netherlands have quickly disappeared from the Dutch markets following the launch of warning campaigns.9

Discovering new compounds that endanger life is unlikely to benefit the user after he or she has taken the drug except in ruling out other causes for developing severe syndromes. However, as more becomes known about the psychopharmacology of specific compounds, best-practice treatment algorithms can be created. If backed up by a sensible brief intervention, such a service might see users of drugs more engaged in caring for their health, recognising problem substance use, and seeking help. From a public health perspective, information on new compounds can be used to monitor emerging trends and inform prevention activities.

Problems to overcome

Several hurdles need to be overcome before drug checking can be established in Australia. Drug sellers may view the service as an opportunity to have their drugs checked before they distribute them. As in Europe, drug-checking services would need to ensure they are not complicit in aiding drug distribution. There may also be a misconception among users of the service that by having their drugs “checked”, their use is condoned or seen as safe. Existing drug-checking services deal with this misconception through careful engagement with service users to explain that all drug use is risky and that the only completely safe option is to avoid drug use. This message is more likely to be heeded by users of drug-checking services who are receiving advice about harm reduction that is individually tailored to their personal characteristics and the known characteristics of the drugs they may consume.

As happens overseas, Australian drug-checking services will need to be provided in multiple sites in both metropolitan and regional locations. Transport problems would need to be solved to provide access to services outside metropolitan areas.

Effective laboratory testing is expensive; without adequate investment, the drug-checking service may be restricted to ad hoc sites or subject to unreliable testing techniques. Indeed, drug-checking interventions were conducted in Australia over a decade ago,10 but, at that time, on-site testing technology was restricted to colour reagent test kits, which are not reliable enough nor able to detect the larger number of substances currently available. In 2016, for an investment of under $200 000 (based on the costs of a high-performance liquid chromatography machine and employing a Scientist and Drug and Alcohol Counsellor), a mobile laboratory could be set up and attached to existing peer-run harm-reduction services, supported by existing full laboratories providing in-kind support. While there are expenses associated with the ongoing running of such a service, the costs of trialling this kind of intervention are relatively low with the use of currently available technology that has been field-tested in other countries.

In addition, handling materials that are suspected of being illegal substances is prohibited by law; there are harm-reduction services currently operating in Australia that have been provided with an exemption for service staff and clients, such as Sydney’s medically supervised injecting centre. Therefore, providing a drug-checking service would not require a radical shift in national drug policy, but would require cooperation between health and police stakeholders.

Conclusions

An important public health need in Australia could be met by providing an easily accessed drug-checking service that provides reliable and fast information to consumers about the content of drugs, along with non-judgemental harm-reduction advice. A further advantage is the ability of such a service to track the appearance of NPS on the market rapidly,8 which is helpful and sometimes necessary if we are to respond more effectively to NPS-related harm. Such a service could mitigate the severity and impact of situations that commonly overwhelm emergency departments around Australia by rapidly disseminating information about NPS to (a) potential consumers, warning them about specific products and batches, and (b) clinicians, guiding them on the predicted toxidrome and management of affected patients.

Concerns about the unintended consequences of providing a drug-checking service include legitimisation of the use of drugs, civil responsibility of the drug checkers towards consumers of tested drugs, and the use of the service by drug sellers as a quality control mechanism. Such concerns have not been supported by evidence in the European context.11 In Europe, the service is used in tandem with opportunistic brief interventions that provide a moment for education on health and harm reduction, and reduces the delay to treatment for problem drug use. Further experience with services of this kind is required to ascertain the feasibility, acceptability and effectiveness in inducing behaviour change of various models of drug checking in the Australian context, which is different from the Dutch context (eg, there is no threat of prosecution for using these drugs in the Netherlands). Therefore, it is very important that a high-quality research trial of drug checking in Australia be conducted.

[Editorial] Air pollution: consequences and actions for the UK, and beyond

“The time has now arrived to take air pollution, as currently encountered in the UK, much more seriously…It should be considered a major public health problem…It is our view that this requires urgent, determined, and multidisciplinary action that is long overdue. Indeed, if we do not act now, our children and generations to follow will be those who suffer from our failure to act.” So concludes Stephen Holgate, chair of the Royal College of Physicians/Royal College of Paediatrics and Child Health (RCP/RCPCH) Working Party on Air Pollution, in his preface to one of the clearest calls to action to advance the UK’s environmental health.

Zika virus may cause other birth defects, stillbirth: study

A case study of a Brazilian woman and her baby has pointed to the possibility that the Zika virus may cause birth defects other than microcephaly.

PLOS Neglected Tropical Diseases published the case study about a 20-year-old woman whose stillborn baby had signs of severe tissue swelling as well as central nervous system defects that caused the central hemispheres of the brain to be absent.

Albert Ko, M.D. of the Yale School of Public Health and Dr. Antônio Raimundo de Almeida at the Hospital Geral Roberto Santos in Salvador, Brazil led the research, saying it provides evidence that Zika infection may also be linked to hydrops fetalis, hydranencephaly and fetal demise.

Related: Qld to ramp up Zika testing after 8th case

The woman experienced a normal first trimester, however doctors started seeing abnormalities during the 18th week of pregnancy when the foetus’ weight was well below what it should have been.

In the 30th week, the foetus showed a range of birth defects including “severe microcephaly, hydranencephaly, intracranial calcifications and destructive lesions of posterior fossa, in addition to hydrothorax, ascites and subcutaneous edema”. Labour was induced at 32 weeks due to foetal demise.

Testing confirmed the presence of Zika virus in the foetus however the woman didn’t report any of the symptoms commonly associated with Zika prior to or during her pregnancy.

The researchers admit that it’s not possible to understand the overall risk for women exposed to the virus during pregnancy from just one single case.

“Given the recent spread of the virus, systematic investigation of spontaneous abortions and stillbirths may be warranted to evaluate the risk that ZIKV infection imparts on these outcomes,” they wrote.

Latest news: