Testicular germ cell tumours are at the crossroads of developmental and neoplastic processes. Their cause has not been fully elucidated but differences in incidences suggest that a combination of genetic and environment factors are involved, with environmental factors predominating early in life. Substantial progress has been made in understanding genetic susceptibility in the past 5 years on the basis of the results of large genome-wide association studies. Testicular germ cell tumours are highly sensitive to radiotherapy and chemotherapy and hence have among the best outcomes of all tumours.
Preference: Public and Environmental Health
964
Quality of care achievements of the Prostate Cancer Outcomes Registry–Victoria
Best practice guidelines assist clinicians and health services deliver optimal care to men diagnosed with prostate cancer (CaP),1–3 but little is known about whether optimal approaches to care have been delivered to patients with CaP in Australia. A large United States study that investigated compliance with structural and process of care quality indicators (QIs) highlighted considerable deficits across institutions in care provided to men with localised CaP.4
The Prostate Cancer Outcomes Registry–Victoria (PCOR-Vic), formerly the Victorian Prostate Cancer Clinical Registry (Vic PCR), was established with the aim of improving knowledge of patterns of care and outcomes for men diagnosed with CaP in Victorian hospitals.5 Since its inception in 2009, PCOR-Vic has progressively enlarged its recruitment scope: by 2013 the registry had collected data from 75% of the Victorian target population. To achieve its objectives, a set of QIs was developed after reviewing guidelines and published literature on CaP QIs, and through a consensus process by members of the PCOR-Vic Steering Committee.5 Data on these QIs are reported to contributing clinicians and health services every 6 months after the initial 12-month period following diagnosis.
The registry routinely reports on four outcome measures: patient-reported urinary, bowel and sexual bother, and survival. It also reports on three processes of care indicators. Firstly, it reports to hospitals and clinicians the percentage of men with established low risk disease who have received active treatment during the initial 12-month period after diagnosis (Indicator 1, QI-1). There is now good evidence that active surveillance (AS) is a more appropriate approach than immediate invasive treatment for many men with low risk CaP.6 The Prostate Cancer Research International Active Surveillance (PRIAS) project was initiated in 2006 to describe patterns of care for men on AS and to provide guidance about the AS regimen.7 The Urological Society of Australia and New Zealand has formally endorsed the PRIAS criteria for AS, and has supported the recruitment of patients for PRIAS since 2010.8 Participation in PRIAS is at the discretion of the clinician and patient and thus does not provide a community-based estimate of the uptake of AS.
PCOR-Vic also provides reports about men diagnosed with high risk and locally advanced CaP for whom active treatment was not initiated (Indicator 2, QI-2). The standard approach to treating high risk CaP in patients with an otherwise good life expectancy is prompt initiation of surgery or radiation therapy, the latter with androgen deprivation therapy.2 Delay from the date of biopsy to the date of surgery, particularly for high risk men, may be associated with poorer pathological outcomes.9 There is some evidence that delay in initiating appropriate treatment (based on the risk of disease progression) after the diagnosis of CaP can cause psychological distress.10 More recent evidence indicates that the risk of suicide immediately after diagnosis is 70% higher than for the general population, and that this risk is greatest for men with regionally advanced disease.11
The third process of care indicator routinely measured by the registry relates to risk-adjusted percentages of positive surgical margins (PSMs) following radical prostatectomy (Indicator 3, QI-3). PSM status is important in evaluating quality of care in managing CaP because it is associated with an increased risk of biochemical recurrence after radical prostatectomy12 and is a significant predictor of the need for additional radiotherapy and/or androgen deprivation therapy, even after taking stage of disease into account.13
Patients who are identified as meeting either QI-1 or QI-2 selection criteria are notified to their treating or diagnosing clinicians and hospitals. QI-3 is reported to hospitals and clinicians in the form of risk-adjusted funnel plots if there are more than 20 patients meeting the inclusion criteria. These funnel plots are de-identified with regard to other clinicians, and visually depict variations beyond the mean of two or three standard deviations. Funnel plots were chosen to allow clinicians and health services to compare their performances with those of other providers; to visualise variation in compliance with the indicator; and to stimulate competition in improving outcomes for men with CaP. As with QI-1 and QI-2, hospitals and clinicians are also provided with the names of patients who meet QI-3 criteria (constituting the numerator).
This article reports the overall performance of the Victorian health system over a 5-year period (2009–2013) according to the three processes of care indicators reported by the registry.
Methods
Study population
Men are eligible to be included in PCOR-Vic if they are diagnosed with CaP or treated for CaP at a recruiting hospital after ethics approval at the site; have pathologically confirmed CaP; and are treated by a clinician who has provided consent for patients to be approached and enrolled in the registry. Details of the number of hospitals recruited since 2009 and the average number of patients in each hospital are summarised in Box 1.
Recruitment
The recruitment strategy and data collection methodology of the PCOR-Vic have been previously described.5 In summary, all men identified as having pathologically confirmed CaP notified to the Victorian Cancer Registry and who have not died within 10 months of diagnosis are sent a letter inviting them to participate. We have ethics committee approval to waive patient consent to access management details for men who have died within 10 months; otherwise, an opt-off recruitment strategy is used. Data are collected from hospitals and private consulting suites by trained data collectors. Men are telephoned at 12 and 24 months to confirm that treatment details are accurate and up-to-date, and that they include the most recent prostate-specific antigen (PSA) result.
Statistical analysis
Patients classified as having low risk CaP (ie, if they met the selection criteria of the PRIAS protocol:7 clinical stage T1/T2, PSA ≤ 10 ng/mL, one or two positive biopsy cores, and prostate biopsy Gleason score ≤ 6 based on their most recent biopsy) were included in QI-1. “Most recent biopsy” was defined as the latest biopsy performed during the 12-month period following diagnosis or the initial biopsy at diagnosis if no subsequent biopsy was performed. Men whose initial biopsy or most recent biopsy indicated a higher risk of CaP (ie, no longer met all criteria of the PRIAS protocol) were not included in QI-1. PSA density was omitted in this classification, as the prostate volume (required to calculate PSA density) is not part of the PCOR-Vic minimum dataset.5 Men were deemed to be non-compliant with the PRIAS protocol if they were eligible for PRIAS based on their most recent biopsy and invasive treatment was undertaken within 12 months of diagnosis.
The National Comprehensive Cancer Network (NCCN) definition was used to assess appropriateness of care for high risk and locally advanced disease;1 ie, PSA > 20 ng/mL or Gleason score > 7 or clinical stage ≥ T3a, and not over 80 years of age at diagnosis. Men who met these criteria were included in QI-2, and were deemed to not be receiving appropriate care if active treatment had not been initiated within 12 months of definitive diagnosis of CaP.
Only patients with organ-confined disease (pathological T category 2) were included in the analysis of change in PSM rate over time. Margin status was unequivocal for 2313 patients (98.5%), but in 36 men (1.5%) a definitive status could not be established because the sample was insufficient (four patients), documentation was unclear (seven patients) or the margin status was not stated in the pathology report (25 patients). These cases were not included in further analyses.
Trend analysis was conducted to monitor performance with respect to QI-1, QI-2 and QI-3 for men diagnosed with CaP between 2009 and 2013. Autocorrelation of the month-year data was first assessed by plotting the partial autocorrelation function. We used the autoregressive integrated moving average (ARIMA) model to account for any inherent autocorrelation in the data when analysing the monthly incidence of each indicator. Differences in the annual figures for the indicators across years were also analysed by aggregating data by year and applying the ARIMA model. Data were analysed in Stata 13.0 (StataCorp); P < 0.05 was defined as statistically significant.
Ethics approval
This project received ethics approval from the human research ethics committees of Monash University (reference CF09/0931-2009000436), Cancer Council Victoria (reference 0908) and of each participating health service.
Results
A total of 4708 men were diagnosed with CaP in recruiting hospitals between 1 January 2009 and 31 December 2013 and met at least one of the QI-1, QI-2 or QI-3 inclusion criteria. The PCOR-Vic recorded an opt-off rate of 2.7% over the 5-year period. About 2% of men could not be recruited because their treating doctor had not provided consent for participating in the registry. The demographic and diagnostic details of the men contributing to each indicator are outlined in Box 2.
QI-1: Percentage of men with low risk disease receiving active treatment (non-compliance with PRIAS recommendations)
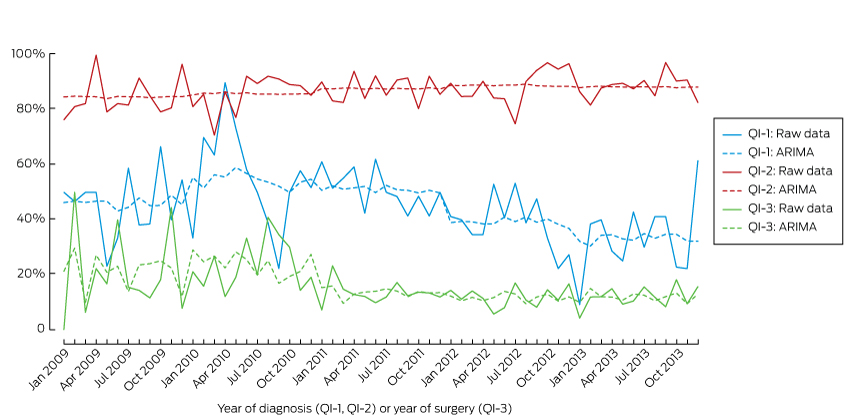
The proportion of men with low risk disease who underwent active treatment declined between 2009 and 2013. The mean percentage of PRIAS non-compliance had increased non-significantly from 45% in 2009 to 55% (2010) and 50% (2011), but a downward trend was evident in 2012 (40%) and 2013 (34%); this achieved statistical significance in 2013 (P = 0.024).
QI-2: Percentage of men with high risk or locally advanced disease receiving treatment within 12 months of CaP diagnosis
During the 5 years there was a gradual but statistically non-significant increase in the percentage of men with high risk or locally advanced disease receiving treatment within 12 months of diagnosis; 88% of men in these risk groups received immediate active treatment in 2009, rising to 89% in 2010, 91% in 2011 and 2012, and 93% in 2013.
QI-3: Percentage of PSMs for organ-confined pathological T2 disease
The PSM rate for men with organ-confined (pT2) CaP in 2009 was 24%, and rose slightly (by 3.4 percentage points) in 2010. A significant decline was first measured in 2011 (7 percentage point reduction in pT2 prostatectomy PSM; P = 0.031). Further significant improvements were measured for radical prostatectomies performed in 2012 and 2013, when the PSM rate remained steady at 12% (Box 3, Box 4).
Discussion
Given the prevalence of CaP,14 attention to the quality of CaP care has become an important health care issue not only for authorities and policy makers, but also for health service providers and patients. There is broad consensus on the need for regular assessment and monitoring of clinical performance, both for professional development and for quality improvement.15 National data on CaP treatment are limited, and PCOR-Vic was set up as a quality improvement project in 2009 to address this need.5
Our analysis found a downward trend over a 5-year period in the percentage of men with low risk disease who underwent active treatment, an upward trend in the percentage of those with high risk and locally advanced disease who received active treatment within 12 months of diagnosis, and a decline in PSM in men with pathological T2 disease after radical prostatectomy.
The decline in the proportion of men with low risk disease receiving active treatment predated the increased use of transperineal biopsies in Victoria from 2013. AS is a practicable and recommended strategy for reducing overtreatment of patients with low risk CaP.7 The overall level of surveillance of men with low risk CaP in 2012 and 2013 that we found (60%) was higher than that reported by the Michigan Urological Surgery Improvement Collaborative (US) registry which used the D’Amico classification to define low risk CaP (49%).16 Similarly, data from the CaPSURE registry (US) had shown that AS for low risk disease (as defined by the Cancer of the Prostate Risk Assessment [CAPRA] score) had increased sharply from 14.4% in 2009 to 40.4% in 2013.17
We also found that a larger proportion of men in the high risk and locally advanced disease groups were receiving prompt treatment in 2013 (93%) than 5 years previously (88%); the increase, however, was not statistically significant. A number of studies have found that active treatment, such as radical prostatectomy or a combination of external beam radiotherapy and androgen deprivation therapy, was associated with significant benefits in local disease control, reducing the development of metastases, and improving disease-free survival.18,19 Further, mortality among men aged 75 years or more with high risk tumours who receive local therapy is 46% lower than for those treated conservatively, after controlling for age, comorbidities, and risks.20
The change in PSM rate in our study (from 21% in 2009 to 12% in 2012) was similar in proportion to that reported by Cancer Care Ontario (from 37% in 2009 to 21% in 2012).21 Another study that exclusively examined outcomes for patients who had undergone robot-assisted laparoscopic radical prostatectomy procedures reported much lower pT2 prostatectomy margin positivity (4.5% in 2009; 3.0% in 2012)22 than the 12% we found. PCOR-Vic has progressively accrued hospitals, and the number of robot-assisted radical prostatectomy procedures has increased significantly compared with other surgical methods, from 15% of all procedures in 2010 to 60% in 2013. There is evidence that surgical technique, surgeon proficiency and clinical and pathological features of the cancer may affect the risk of a positive margin in patients undergoing radical prostatectomy.23,24
The overall improvements we report across the three QIs are likely to be due to a combination of factors, including an improved knowledge and acceptance of management for low and high risk CaP; technical advances and refinements in surgical technique; and possibly the feedback mechanism provided by the registry, providing hospitals and clinicians with benchmark reports on their performance relative to their peers.
A major strength of our analysis is that PCOR-Vic is a community-based comprehensive quality registry system that captures data about patterns of presentation, management of CaP, treatment procedures, interventions, and patient-reported outcomes related to quality of life, complications, and the effects of CaP treatment on daily living. The data collected by PCOR-Vic are increasingly valuable not only for policy makers and health care providers for guiding best clinical practices and processes and to improve quality of patient care, but also for researchers undertaking relevant investigations of CaP.
Several limitations affect the interpretation of our data. First, the improvement in QIs was detected using PCOR-Vic as a single population, but there may be institutional variations in quality improvement. Second, the process of engagement of hospitals with PCOR-Vic often took a number of months; each hospital started contributing data at different time points that depended on when their individual engagement process was completed. Third, our sample (health services participating in the PCOR-Vic) was restricted to about 75% of the target population, so that generalising our results to the entire target population could be difficult. However, the participating health services are spread broadly across the state and closely reflect the regional/metropolitan and public/private distribution of all CaP care in Victoria.
In conclusion, the community-based PCOR-Vic has identified an overall improvement in the three assessed QIs during its first 5 years of operation. Men in the low risk disease group are less likely to undergo active treatment, showing an increased awareness of adherence to PRIAS recommendations. At the other end of the spectrum, our analysis found that more men with high risk and locally advanced disease are receiving active treatment within 12 months of diagnosis. Finally, the proportion of men with organ-confined (pT2) CaP who had PSM after radical prostatectomy declined across the 5-year period.
Clinical QIs are valuable tools for linking quality registries to improve clinical outcomes. This performance analysis of historical trends in QIs will not only provide important insights into how the PCOR-Vic may have contributed to the outcomes of patients in Victorian hospitals with CaP during its first 5 years of operation, but will also provide the basis for further development of clinical indicators by the binational registry, the PCOR-ANZ,25 and for the implementation of specific evidence-based interventions for optimising CaP care in areas identified as needing improvement.
Box 1 –
Number of hospitals contributing to the Prostate Cancer Outcomes Registry–Victoria, 2009–2013
|
Year of authorisation* |
Number of hospitals (cumulative) |
Average number of consented patients in each hospital |
|||||||||||||
|
|
|||||||||||||||
|
2009 |
9 |
133 |
|||||||||||||
|
2010 |
15 |
91 |
|||||||||||||
|
2011 |
33 |
76 |
|||||||||||||
|
2012 |
33 |
77 |
|||||||||||||
|
2013 |
33 |
67 |
|||||||||||||
|
|
|||||||||||||||
|
* Each hospital has an authorisation date which signifies the earliest date at which a patient’s diagnosis date was considered eligible for participation. |
|||||||||||||||
Box 2 –
Demographic and clinical characteristics of men diagnosed with prostate cancer (CaP) in the Prostate Cancer Outcomes Registry–Victoria, 2009–2013
|
|
|
Low risk disease (Indicator 1) |
High risk and locally advanced disease (Indicator 2) |
Radical prostatectomy (Indicator 3) |
|||||||||||
|
|
|||||||||||||||
|
Total number of contributing men |
1117 |
1840 |
2349 |
||||||||||||
|
Age group |
≤ 55 years |
245 (21.9%) |
109 (5.9%) |
506 (21.5%) |
|||||||||||
|
|
56–65 years |
548 (49.1%) |
543 (29.5%) |
1147 (48.8%) |
|||||||||||
|
|
66–75 years |
307 (27.5%) |
886 (48.2%) |
684 (29.1%) |
|||||||||||
|
|
> 75 years |
17 (1.5%) |
302 (16.4%) |
12 (0.5%) |
|||||||||||
|
PSA at diagnosis |
≤ 4 ng/mL |
289 (25.9%) |
117 (6.4%) |
509 (21.7%) |
|||||||||||
|
|
4.01–10 ng/mL |
828 (74.1%) |
736 (40.0%) |
1584 (67.4%) |
|||||||||||
|
|
10.01–20 ng/mL |
NA |
421 (22.9%) |
193 (8.2%) |
|||||||||||
|
|
≥ 20.1 ng/mL |
NA |
549 (29.8%) |
35 (1.5%) |
|||||||||||
|
|
Unknown |
NA |
17 (0.9%) |
28 (1.2%) |
|||||||||||
|
Gleason score at diagnosis |
≤ 6 |
1117 (100%) |
112 (6.1%) |
856 (36.4%) |
|||||||||||
|
7 (3 + 4) |
NA |
185 (10.1%) |
957 (40.7%) |
||||||||||||
|
|
7 (4 + 3) |
NA |
178 (9.7%) |
315 (13.4%) |
|||||||||||
|
|
8–10 |
NA |
1357 (73.8%) |
209 (8.9%) |
|||||||||||
|
|
Unknown |
NA |
8 (0.4%) |
12 (0.5%) |
|||||||||||
|
Clinical T category |
T1–T2a |
1052 (94.2%) |
643 (34.9%) |
1570 (66.8%) |
|||||||||||
|
|
T2b–T2c |
65 (5.8%) |
370 (20.1%) |
256 (10.9%) |
|||||||||||
|
|
T3a |
NA |
445 (24.2%) |
30 (1.2%) |
|||||||||||
|
|
T3b–T4 |
NA |
82 (5.0%) |
1 (< 0.1%) |
|||||||||||
|
|
Unknown |
NA |
290 (15.8%) |
492 (20.9%) |
|||||||||||
|
NCCN risk group |
Low |
1047 (93.7%) |
NA |
563 (24.0%) |
|||||||||||
|
|
Intermediate |
70 (6.3%) |
NA |
1350 (57.5%) |
|||||||||||
|
|
High |
NA |
1748 (95.0%) |
256 (10.9%) |
|||||||||||
|
|
Locally advanced |
NA |
92 (5.0%) |
1 (< 0.1%) |
|||||||||||
|
|
Metastatic |
NA |
NA |
10 (0.4%) |
|||||||||||
|
|
Unknown |
NA |
NA |
169 (7.2%) |
|||||||||||
|
Diagnostic method |
Transrectal ultrasound (TRUS) |
1102 (98.7%) |
1692 (92.0%) |
2278 (97.0%) |
|||||||||||
|
|
Transperineal template biopsy |
15 (1.3%) |
35 (1.9%) |
19 (0.8%) |
|||||||||||
|
|
Transurethral resection of the prostate (TURP) |
NA |
100 (5.4%) |
42 (1.8%) |
|||||||||||
|
|
Transurethral resection of bladder tumour (TURBT) |
NA |
4 (0.2%) |
NA |
|||||||||||
|
|
Other |
NA |
3 (0.2%) |
4 (0.2%) |
|||||||||||
|
|
Unknown |
NA |
6 (0.3%) |
6 (0.3%) |
|||||||||||
|
Surgical approach |
Open prostatectomy |
NA |
NA |
1013 (43.1%) |
|||||||||||
|
|
Laparoscopic prostatectomy |
NA |
NA |
150 (6.4%) |
|||||||||||
|
|
Robot-assisted laparoscopic prostatectomy |
NA |
NA |
1179 (50.2%) |
|||||||||||
|
|
Other prostatectomy |
NA |
NA |
6 (0.3%) |
|||||||||||
|
|
Unknown type of prostatectomy |
NA |
NA |
1 (< 0.1%) |
|||||||||||
|
Number of men for year of diagnosis (Indicators 1 and 2) or surgery (Indicator 3) |
|||||||||||||||
|
|
2009 |
164 (14.7%) |
240 (13.0%) |
188 (8.0%) |
|||||||||||
|
|
2010 |
181 (16.2%) |
256 (13.9%) |
287 (12.2%) |
|||||||||||
|
|
2011 |
353 (31.6%) |
474 (25.8%) |
672 (28.6%) |
|||||||||||
|
|
2012 |
264 (23.6%) |
467 (25.4%) |
661 (28.1%) |
|||||||||||
|
|
2013 |
155 (13.9%) |
403 (21.9%) |
541 (23.0%) |
|||||||||||
|
|
|||||||||||||||
|
NA = not applicable; NCCN = National Comprehensive Cancer Network; PSA = prostate-specific antigen level. |
|||||||||||||||
Box 3 –
Changes in QI-1, QI-2 and QI-3 between 2009 and 2013, using an autoregressive integrated moving average (ARIMA) model
QI-1 = Men with low risk prostate cancer (CaP) who underwent active treatment; QI-2 = men with high risk or and locally advanced CaP who underwent active treatment within 12 months of diagnosis; QI-3 = positive surgical margins in organ-confined (pT2) disease.
Box 4 –
Changes in the three process quality indicators QI-1, QI-2 and QI-3 (baseline: 2009)
|
Year |
QI-1 |
QI-2 |
QI-3 |
||||||||||||
|
% |
Change since 2009 (95% CI) |
P* |
% |
Change since 2009 (95% CI) |
P* |
% |
Change since 2009 (95% CI) |
P* |
|||||||
|
|
|||||||||||||||
|
2009 |
45.1% |
|
|
88.3% |
|
|
20.9% |
|
|
||||||
|
2010 |
55.3% |
10.2 (–1.6 to 17.7) |
0.101 |
89.5% |
1.2 (–4.0 to 6.5) |
0.648 |
24.3% |
3.4 (–1.1 to 5.9) |
0.170 |
||||||
|
2011 |
50.4% |
5.3 (–10.4 to 20.0) |
0.536 |
90.7% |
2.4 (–2.2 to 8.3) |
0.251 |
13.8% |
–7.1 (–14.9 to –0.7) |
0.031 |
||||||
|
2012 |
39.8% |
–5.3 (–20.6 to 6.3) |
0.297 |
90.8% |
2.5 (–0.4 to 8.8) |
0.074 |
12.0% |
–8.9 (–17.2 to –2.2) |
0.012 |
||||||
|
2013 |
34.2% |
–10.9 (–23.4 to –1.7) |
0.024 |
92.8% |
4.5 (–1.7 to 9.1) |
0.181 |
11.7% |
–9.2 (–18.1 to –0.6) |
0.036 |
||||||
|
|
|||||||||||||||
|
QI-1 = Men with low risk prostate cancer (CaP) who underwent active treatment; QI-2 = men with high risk or and locally advanced CaP who underwent active treatment within 12 months of diagnosis; QI-3 = positive surgical margins in organ-confined (pT2) disease. * For change since 2009. |
|||||||||||||||
Lost in translation: the gap between what we know and what we do about cardiovascular disease
An estimated one million Australians at high risk may not have been receiving recommended preventive treatments
We still seem disappointingly distant from getting it right with disease prevention in Australia. An analysis of data from the 2011–12 Australian National Health Measures Survey reported in this issue of the MJA1 found that most respondents at high risk of cardiovascular disease (CVD) were not receiving the recommended combination of blood pressure-lowering and lipid-lowering medications. Applying these estimates to the general population, almost one million Australians at high risk may not have been receiving these treatments, although their use has long been recommended by the national peak body on the basis of level A evidence.
Perhaps the data are incorrect? While the response rate to the survey among those aged 45–74 years (47%) was lower than desirable, survey respondents would be expected to have better, not worse, treatment rates than non-respondents. It is also likely that self-reporting overestimates treatment levels. Perhaps the data reflect the prevalence of contraindications to recommended treatment? Again, this is unlikely: definite contraindications to lipid-lowering and blood pressure-lowering medications are very rare, and placebo-controlled trials have shown that only a small proportion of subjects taking statins experience symptomatic side effects.2
What is going wrong?
How much of the problem is related to physicians not prescribing medications in the first place, and how much is due to patients not continuing to use them in the long term? For people with an acute coronary syndrome, prescription rates at discharge have climbed steadily in recent years; the main challenge seems to be the steady drop-off in adherence in the months and years following the acute event.3 Both patient- and prescriber-related factors contribute to this drop-off. Patient-related factors include comorbidities, mental health problems, social context, and their perceptions of their illness; even those who have a heart attack underestimate their risk, and misperceptions are associated with the persistence of risk-elevating behaviours, including smoking and non-adherence to medication.4 The cost of drugs may play a bigger role in the Australian context than is recognised.5 Physicians may fail to recognise non-adherence or explain the need to continue therapy. Over-attribution of “side effects” to medication is also a factor,2 compounded in Australia by biased media coverage about statins.6
For people at high primary risk of CVD, we suspect the main problem is under-prescribing of medications that reduce the risk of CVD. A paradigm change is needed, and we have only begun to address this need. The dominant paradigm for many decades has been to prescribe these medications only for people with hypertension or dyslipidaemia; indeed, many drug labels still recognise only these indications. The compelling rationale that use of these drugs should instead be primarily targeted on the basis of high absolute risk of CVD has been plain for many years. The evidence for the benefits of blood pressure-lowering medications for people with non-optimal blood pressure but without hypertension has become even clearer in the past few months.7 Nevertheless, diagnosis and treatment practices for hypertension remain similar to those of several decades ago, when it was erroneously thought there was a threshold of hypertension below which lowering blood pressure conferred no benefit.
Do we need to try something new?
We clearly need to improve our strategies for addressing the evidence–practice gap in CVD risk management. This is part of a wider systemic problem in continuing medical education, our ability to translate large amounts of new research data into practice.
Should we be considering a public health and policy-driven approach? In the United Kingdom, the Quality and Outcomes Framework (QOF) annually rewards practices for their provision of quality care according to evidence-based indicators.8 For example, the indicators for the secondary prevention of coronary heart disease (CHD) include general practices maintaining a register of CHD patients and of the proportions prescribed angiotensin-converting enzyme inhibitors or angiotensin-receptor blockers, aspirin, β-blockers, and statins.8 A registry would enable practices to have annual recall programs for reviewing treatment of CHD patients. In Australia, the National Health and Medical Research Council has recently adopted implementing the absolute risk approach to primary prevention as a priority for research translation.9
Technology-based solutions may also help. Hospital medical records, patient-controlled e-health medical records, and general practice medical records could incorporate red flags for pre-specified indicators of prevention needs not being met. Electronic decision support studies support the potential effectiveness of these type of strategies.10 Other technology-based solutions could include smart pill boxes, pharmacy support programs, telehealth support, and automated text reminders.11 These strategies are all ready to roll now, whereas other innovations, such as polypills, may play a role in the near future.12 There is evidence that supports the efficacy of all these strategies, but none has yet been substantively employed.
CVD is our leading killer and cause of health care costs, but almost one million Australians at high risk may not have been receiving the basic recommended preventive medications. This is the low-hanging fruit in CVD control. A multifaceted approach is needed: patient-centred, evidence-based primary care will be the key.
Death in offshore detention: predictable and preventable
Asylum seeker Hamid Khazaei suddenly became ill last year from a leg infection which escalated to septicaemia. He needed rapid evacuation from Manus Island to receive appropriate specialist medical care. This was delayed by almost 30 hours, by which time he was gravely ill. He died a few days later.
The course of events leading up to Khazaei’s death, while harrowing, came as no surprise. Health professionals have long warned that conditions in offshore detention centres are inhumane, degrading and pose life-threatening risks to asylum seekers and refugees.
Monday’s ABC Four Corners program highlighted a disturbing litany of delays, poor judgement, ill-informed decisions and above all, the serious consequences of a detention system that neglects warnings and fails to heed clinical advice.
Offshore detention centres cannot provide quality health care. Their remote location prevents rapid and accessible specialist level care. Many health professionals have expressed concern about the standard of local health care provided and the absence of transparent, independent oversight.
Doctors’ responsibilities
Few issues have united the health profession as strongly as the dissatisfaction with our country’s response to people fleeing persecution. Australia’s asylum seeker policies prevent health professionals from treating all our patients with clinical excellence, dignity and respect.
The Royal Australasian College of Physicians advised the government in 2015 that:
asylum seekers seeking protection from Australia should not be transferred to, detained or resettled in regional processing countries.
Over the past year, many professional and religious organisations, public protests and social media campaigns have called on the government to “end detention” and expedite the processing of refugee claims in the community.
Under the Australian Border Force Act, health professionals, including those who spoke on the Four Corners program, can be jailed for speaking in public about conditions in immigration detention. This includes unmet health care needs, children suffering abuse, or even severe errors of judgement that could be regarded as criminal or negligent in Australia.
The options for health care professionals are limited: silently accept, speak out and be labelled “whistle-blowers”, or boycott, which presents its own health risks to patients.
The Border Force Act compels health professionals to be complicit with an inadequate and harmful system. It should be repealed without delay.
Harms of detention
Immigration detention is detrimental to the health of people of all ages, both in the short and long term.
A recent review of Australian government mental health screening data reveals that around half of the 215 adult detainees who completed the Harvard Trauma Questionnaire in 2014 had symptoms of post-traumatic stress disorder. On clinician-rated measures, one-third of adults and children had symptoms severe enough to require referral for specialist mental health assessment.
People detained for more than two years have particularly poor health, both mental and physical. Health problems in adults increase with the duration of detention, and include mental health and musculoskeletal problems, dental issues and lacerations.
The most extreme risk is to children. A review of the evidence over the last 15 years in Australia shows immigration detention has harmful health, developmental and psychological consequences for children. It also has negative impacts on parenting. Typical symptoms among children include developmental regression, nightmares, abnormal sleep and toileting, behavioural disturbance, self-harm, depression and anxiety.
Children who have been detained in immigration detention have higher rates of psychiatric disorders than children with similar pre-migration traumatic events who have not been detained.
There is a clear link between the duration of detention and developmental and psychological symptoms. However even brief periods in detention can affect children’s functioning.
Policy response
While we welcome the government’s recent decision to release children and their families from detention facilities in Australia, major issues are unresolved. Nearly 150 children and their families remain on Nauru.
At the end of February, 1,753 people were in mainland immigration detention facilities, and a further 1,379 in offshore facilities.
Those who are released into the community cannot be assured of permanent protection, but face years of uncertainty on temporary visas. These uncertain conditions are harmful to health, with those offered temporary protection experiencing worse health and mental health outcomes than those with permanent protection. This includes an increase in anxiety, depression and post-traumatic stress disorder.
It is not possible to provide high quality and timely health care in offshore detention. And health providers cannot address health issues inherently caused by detention offshore, such as self-harm, suicide or treatment delays caused by inadequate local health care systems. They also face the challenge of bureaucratic barriers over-riding their clinical decisions.
If quality health care in offshore detention cannot be provided, offshore detention simply needs to cease.
Hamid Khazaei’s friend told Four Corners that he “wanted to be a person that Australia would be proud of” and his death should prompt an independent high-level inquest.
We predict that in ten or 20 years there will inevitably be an inquiry to investigate the serious harms inflicted by immigration detention more broadly. We will listen to the stories people will tell and ask ourselves why “good people stood by”.
![]()
Karen Zwi, Paediatrician and Associate Professor, UNSW Australia and Nicholas Talley, Pro Vice-Chancellor, Global Research and Laureate Professor of Medicine, University of Newcastle
This article was originally published on The Conversation. Read the original article.
Other doctorportal blogs
- Blaming individual doctors for medical errors doesn’t help anyone
- Your season of birth is stamped on your DNA and can affect your risk of allergies
- Just get back on that horse
Note: Since this article was published in The Conversation, the Papua New Guinea Prime Minister Peter O’Neill has said the Manus Island regional processing centre will be closed following a ruling from the country’s Supreme Court. The Australian Government has been asked to make alternative arrangements for the asylum seekers.
Aileen Joy Plant
Professor Aileen Plant (1948–2007) was a renowned medical epidemiologist and an outstanding global public health leader

In mid-March 2003, hurrying through Perth Airport on her way to a World Health Organization assignment, Professor Aileen Plant paused to write out her will. She asked the airline staff to witness it before boarding a plane for Hanoi. Her task was to lead a team trying to bring Vietnam out of its sudden nightmare of the deadly disease of severe acute respiratory syndrome (SARS), an illness that no one knew the cause of, nor how it spread. The person she was replacing, Dr Carlo Urbani — who had identified the new syndrome — lay sickened by it in a hospital in Bangkok.
Aileen knew that speed was essential. The effectiveness of the tasks of early detection and prevention of transmission would require a cohesive and willing team, which in turn would require the trust of the Vietnamese Ministry and the Vietnamese health care workers. This, she achieved.
On 29 March, Dr Carlo Urbani died. Dr Katrin Leitmeyer, virologist, recalls how Aileen rallied everyone, “gluing extreme characters from all around the world together under difficult psychological circumstances”.
The 3-week mission became 11 weeks. Vietnam had 69 cases of SARS and five deaths, mostly in staff and patients of the Hanoi French Hospital. During this time, Aileen’s sister, Kaye, became gravely ill in Perth. Aileen was desperate to be with her but knew that, even if she did return to Australia, she would not be allowed into any hospital.
Under her leadership, the Hanoi team characterised the clinical features of the disease, its incubation period and possible routes of transmission, and made important observations about the effectiveness of case isolation and infection control in halting transmission. On 28 April, Vietnam was declared SARS-free, the first country to eradicate the disease. The Vietnamese government awarded Professor Plant its highest award, the National Medal of Honour.
Aileen said of her experience that two things stood out. The first was that the Vietnamese government agreed that external help should be sought — an extraordinary admission in communist Vietnam at that time. The second was the dedication of the Vietnamese staff, who quarantined themselves in the hospital and worked with little in the way of modern technology or resources. Aileen thought they should have been awarded the Medal, rather than her. Her own keen sense of family no doubt contributed to her great respect for the grief and isolation of any individual. Finally, in June, Aileen was able to return home to her recovering sister.
Other WHO assignments in which Aileen was involved included investigating an HIV outbreak in children in Libya, childhood dermal fibromatosis in Vietnam, yellow fever outbreaks in Africa, tuberculosis trends in Indonesia and the emergence of avian influenza in Asia. She also began seminal work with the WHO on the International Health Regulations (IHR), to frame the relationship between countries and the WHO in regard to preparation and response for public health events of international concern, and continued work on the Global Outbreak and Alert Response Network (GOARN), which she had helped establish in 2000. Both are key tools in global biosecurity today.
Aileen came from a large family and left school at the age of 15 to work on her parents’ farm in Denmark, Western Australia. She became interested in infectious diseases, telling her father that an animal had died of eastern equine encephalitis. This became a family joke, as the animal in question was a cow. She took up work as a bank teller for 5 years but became determined to study medicine, putting herself though technical school and gaining entrance to the University of Western Australia.
Her early years as a resident doctor in the Northern Territory sparked her interest in Aboriginal health. She became firm in her belief that it was essential for the overall health of humanity to understand and care for vulnerable populations. Already evident to her colleagues by this time were her razor-sharp “bullshit detector”, her interest in all matters and her keen sense of humour.
Professor Aileen Plant with Professor Lance Jennings on a World Health Organization mission to investigate a cluster of H5N1 influenza cases in Vietnam in 2005.
Aileen went on to study at the London School of Hygiene and Tropical Medicine. On returning to Australia, she obtained a Master of Public Health at the University of Sydney, eventually joining the faculty as a lecturer, while also working with the New South Wales Department of Health.
In 1989, Aileen took up the position of Chief Health Officer in the NT. Although frustrated by politics, she kept her focus on Aboriginal health, pointing out the flaws in census methods and analysing a decade of data demonstrating health trends and causes of premature mortality in Aboriginal communities.1,2 Her 1995 report called for a whole-of-community and government approach to the poor health trends in Aboriginal and Torres Strait Islander populations.1
Among Aileen’s gifts was the ability to see the truth, or the way to the truth, in science, diplomacy and politics. Science was her bedrock, and diplomacy she saw as an everyday necessity from which wonderful friendships could grow. Bad science and politics tired her, perhaps due to the famous bullshit detector constantly being triggered.
In 1992, Aileen took up the position of Director of the Master of Applied Epidemiology (MAE) Program at the Australian National University, a program she had played a key role in initiating and developing. During her 3 years there, she completed her own PhD, guided many masters and doctoral students, and worked with her colleagues to develop a program on Indigenous health and in attracting Indigenous students. She convinced a colleague in the NT, Dr Mahomed Patel, to join her, developing pathways for international students and obtaining overseas placements for Australian trainees, including deployments with the WHO and establishing MAE-like programs in India, China, Malaysia and Vietnam.
The MAE Program has served the world exceedingly well, with many of its students, staff and graduates contributing to the control of SARS, avian influenza and other public health emergencies. Many of Aileen’s students are now leaders in public health, nationally and internationally.
In 1995, Aileen moved back to Perth to be with her much loved extended family. She worked initially as a senior lecturer at the University of Western Australia before becoming professor of international health at Curtin University in 2000. Together with Professor John Mackenzie, a world-renowned virologist, she compiled an ambitious bid to establish a cooperative research centre (CRC) with a focus on emerging infectious diseases. After two arduous attempts, their bid was successful. The Australian Biosecurity CRC for Emerging Infectious Disease was established in 2003, bringing animal, human and environmental disciplines together in research. Over 7 years, the CRC had many high-impact achievements, including extensive research into the ecology of disease emergence, the development and application of diagnostic tools and systems, and important work on Hendra virus, coronaviruses and influenza viruses. Translational research — taking research into action and policy — was a centrepiece. The CRC awarded over 60 postgraduate scholarships to students in Australia and South-East Asia.
During this time, Aileen continued to assist the Australian Government Department of Health and Ageing, including in emergencies such as the Asian tsunami, where her ability to see the path forward encompassed areas beyond public health. In 2008, the Department named its new crisis response centre the Aileen Plant National Incident Room.
Aileen’s comments usually went to the heart of the matter. Radio host Phillip Adams, interviewing Aileen on ABC RN Late Night Live, asked her whether authoritarian or democratic governments would be better at handling outbreaks. She replied that it depended on the characteristics of the disease and its transmission mode. Diseases like SARS, she noted, are shown to be well handled by authoritarian governments if backed up by a good public health system, but something like HIV–AIDS, which requires behavioural change, is better handled by democracies. She repeated the point, “Wherever they are, infectious diseases always make poor people poorer”.3
Aileen continued to work with the WHO on finalising the IHR, which were endorsed in 2005 and are now signed by over 190 countries. Many of the articles of the IHR reflect the cooperation and information exchange exemplified by Aileen’s time in Vietnam.

Professor Aileen Plant with Professors John Mackenzie (Curtin University), Mal Nairn (Charles Darwin University) and Charles Watson (Curtin University) at the opening of the Queensland node of the Australian Biosecurity Cooperative Research Centre in 2004.
In addition to 90 scientific articles and numerous book contributions, Aileen co-authored a book on the impact of SARS and another on the approach to communicable diseases.4,5 Aileen’s delight was to do projects with her friends and family, and their interests were hers, be they research projects, scientific books, teaching friends’ children to swim, writing creative fiction or designing tree farms.
Aileen died suddenly at Jakarta Airport on 27 March 2007, while travelling home from a WHO meeting, where she had helped to bring about consensus on the issues of sharing avian influenza viruses and access to influenza vaccine for developing countries.
Her spirit and values live on in her colleagues and her students. The Australian Science Communicators honoured Professor Plant as the 2007 Unsung Hero of Australian Science. The University of NSW introduced the yearly Aileen Plant Memorial Prize in Infectious Diseases Epidemiology, an honour for emerging researchers. The Public Health Association of Australia, together with three other peak public health bodies, awards the Aileen Plant Medal for Contributions to Population Health at every Population Health Congress (4-yearly), and Curtin University grants Aileen Plant Memorial Scholarships for Indigenous students and conducts an annual oration, the Aileen Plant Memorial Lecture.
Aileen’s sister Teen, arriving at Jakarta Airport in 2007, remarked, “This is where Aileen died”. Another sister, Caro, replied, “No, she was in departures”. Even in their deep sorrow, they both laughed, as they realised how much Aileen would have liked that quip.
Editor’s note: We hope you are enjoying our series on remarkable and talented Australian medical women. We would love to hear your suggestions about subjects for future articles. Please email your ideas to us at mja@mja.com.au.
Trends and patterns in vaccination objection, Australia, 2002–2013
Considerable media and public attention has been focused in recent years on the refusal by some parents to vaccinate their children as recommended by health authorities. Vaccination coverage has often been purported to be declining nationally as a result, particularly in more affluent inner-city suburbs (for example, 1).
Until the end of 2015, the Australian Childhood Immunisation Register (ACIR) recorded registered objection to vaccination based on personal, philosophical or religious beliefs. Registration of objection required a vaccination provider to complete a conscientious objection form; this was necessary only when the parents wished to remain eligible for family assistance payments from the federal government or, in some states, to be able to enrol their child in childcare. It is therefore likely that ACIR data have not captured all instances of parental objection to vaccination.
Only one published Australian study has reported an in-depth analysis of vaccination objections, a national survey conducted in 2001.2 Our study aimed to examine trends in registered vaccination objection and differences in the geographic and demographic distribution of objection across Australia, and to assess the contribution of unregistered objection to incomplete vaccination.
Methods
The ACIR was established in 1996 by incorporating demographic data recorded by Medicare for all enrolled children under the age of 7 years.3 Children not enrolled in Medicare can also be added to the ACIR with a supplementary number. “Fully vaccinated” status is assessed at three key milestones: 12 months of age (for vaccines due at 2, 4 or 6 months); 24 months of age (for vaccines due at 12 or 18 months); and 60 months of age (for vaccines due at 48 months). The algorithms used for calculation of fully vaccinated status at these milestones have been described previously.4 We defined “partially vaccinated” children as those with one or more vaccinations recorded, but who were not fully vaccinated with respect to the vaccines due at the relevant schedule points.
We examined the following four subgroups of children, defined according to ACIR data:
-
objection to vaccination and no vaccinations recorded;
-
objection to vaccination and one or more vaccinations recorded;
-
no objection to vaccination and no vaccinations recorded; and
-
no objection to vaccination and partially vaccinated.
We examined trends over time for cohorts aged 12 months to less than 7 years for the period 2002–2013. Children under 12 months old were excluded to allow time for parents to have registered an objection to vaccination. We analysed the 2013 data further, mainly for children born 1 January 2007 – 31 December 2012.
The area of residence of children was defined as “major cities”, “inner regional”, “outer regional”, “remote” or “very remote” according to the Accessibility/Remoteness Index of Australia (ARIA+).5 We combined the inner and outer regional categories into a single “regional” category, and the remote and very remote categories into a single “remote” category.
If a child was registered with Medicare later than 365 days after birth, we assumed that they had been born overseas.
We compared children living in postcodes in the bottom and top 10% of all postcodes with regard to economic resources, according to the Socio-Economic Indexes for Areas: Index of Economic Resources.6 For small area analyses, we used Australian Bureau of Statistics (ABS) Statistical Area 3 (SA3) areas.7 Maps were created using MapInfo version 12.0 (Pitney Bowes) and ABS census boundary information. The ABS Postal Area to SA3 Concordance 20118 was used to match ACIR postcodes to SA3.9 If a postcode was matched to more than one SA3, the SA3 with the greatest proportion of the population of that postcode was used.
Due to the extremely large number of children included in this study, statistical comparisons were unnecessary.
Ethics approval
Ethics approval was not required for this study, as de-identified population-based data were used only for routine public health surveillance.
Results
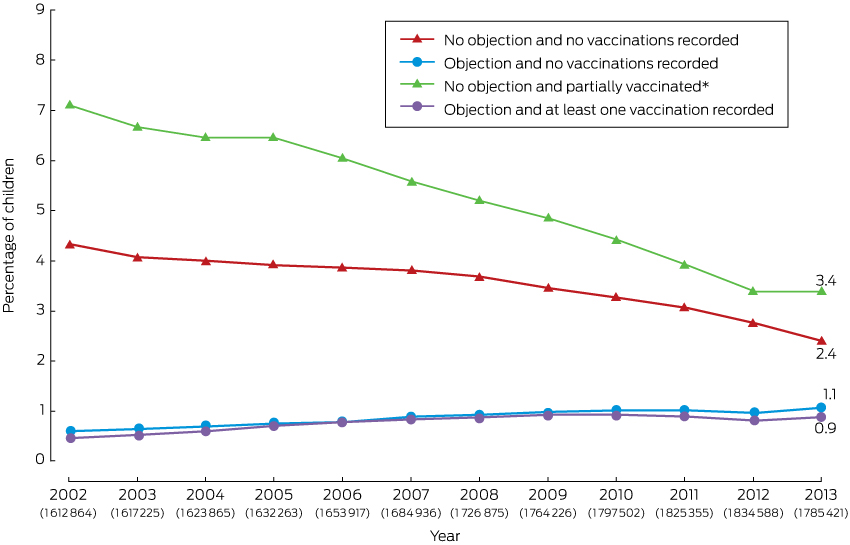
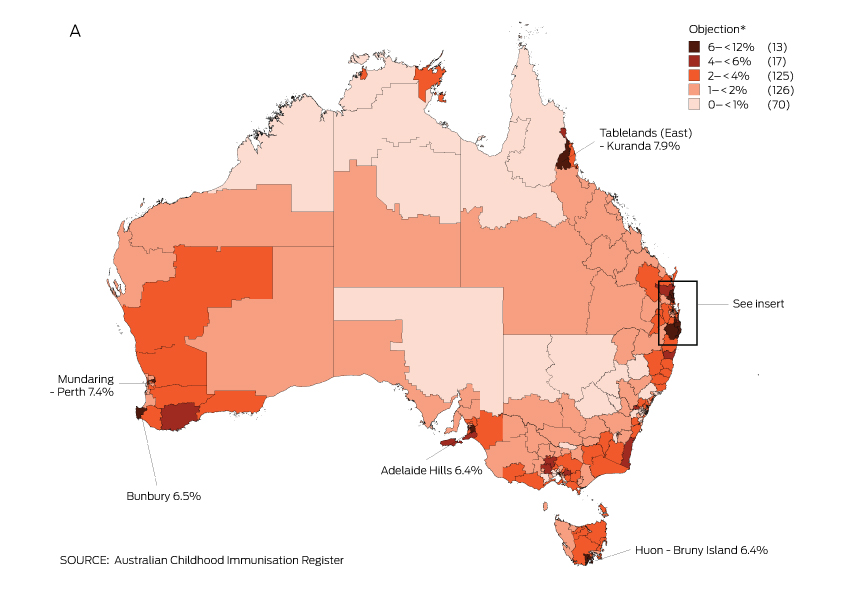
The percentage of children aged 1–6 years with a vaccination objection recorded on the ACIR increased from 1.1% (17 430 of 1 612 864 children) in 2002 to 2.0% in 2013 (1.1% [19 244/1 785 421] with no vaccinations recorded; 0.9% [15 917/1 785 421] with one or more vaccinations recorded; Box 1).
In contrast, the percentage of children for whom neither vaccinations nor an objection were recorded decreased from 4.3% (69 684/1 612 864) in 2002 to 2.4% (42 578/1 785 421) in 2013. The percentage of children who were partially vaccinated with respect to vaccines scheduled at 2, 4 and 6 months of age and for whom no objection was recorded also declined, from 7.1% (114 221/1 612 864) in 2002 to 3.4% (60 094/1 785 421) in 2013 (Box 1).
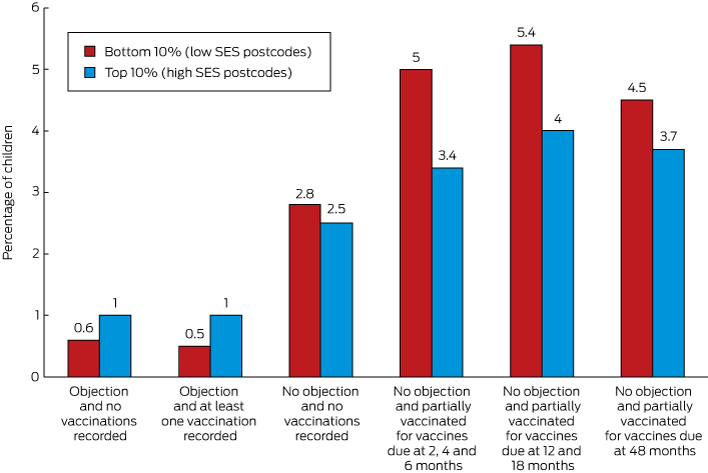
In 2013, the proportion of children with a recorded vaccination objection living in the lowest 10% of postcodes with regard to economic resources was about half that of those living in the highest 10% (1.1% [1664/152 279] v 1.9% [4598/236 649]; Box 2).
The proportion of children in the lowest socio-economic decile who were partially vaccinated and for whom there was no recorded objection was 50% higher than for those living in the most advantaged decile for vaccinations due at 2, 4 and 6 months of age (5.0% [7644/152 279] v 3.4% [8016/236 649]), 35% higher for vaccines due at 12 and 18 months of age (5.4% [6677/124 271] v 4.0% [7909/198 126]), and 20% higher for vaccines due at 48 months of age (4.5% [2023/44 897] v 3.7% [2807/75 890]).
The percentage of children with a vaccination objection recorded on the ACIR was 2.5% (11 342/462 237) in regional areas, 1.8% [22 973/1 268 599) in major cities, and 1.4% (536/39 062) in remote areas.
Children likely to have been born overseas (using the proxy measure of late Medicare registration) were less likely to have a recorded vaccination objection than other children (1.4% [1754/123 469] v 2.0% [33 407/1 661 952]), but much more likely to have neither an objection nor any vaccinations recorded (17.1% [21 134/123 469] v 1.2% [19 619/1 661 952]), or to have no recorded objection but to be partially vaccinated with respect to vaccines due at 2, 4 and 6 months of age (19.6% [24 241/123 469] v 2.1% [35 205/1 661 952]). Seventy-five per cent (145 091/194 757) of proxy overseas-born children lived in major cities, compared with 71% of other children (1 123 799/1 576 567); they comprised 52% of children with neither an objection nor any vaccinations recorded (21 134/40 753).
Some children with a vaccination objection documented on the ACIR were recorded as being fully vaccinated at the relevant age milestones. At 12 months of age, 23% of all children with a recorded objection (7946/35 161) were fully vaccinated; in 90% of these cases, the objection had been registered after receiving the third dose of the diphtheria–tetanus–pertussis vaccine. At 24 months of age, 15% of all children with a recorded objection (4606/30 910) were fully vaccinated; in 78% of these cases the objection had been registered after receiving the first dose of the measles–mumps–rubella (MMR) vaccine. At 60 months of age, 12% of all children with a recorded objection (3685/31 228) were fully vaccinated; in 25% of cases, the objection had been registered after receiving the second dose of the MMR vaccine (data not shown).
The proportion of children with an objection to vaccination recorded on the ACIR varied substantially at the small area level. Most areas with high levels of recorded objection were in regional zones, with marked clustering in northern New South Wales and south-east Queensland (Box 3).
Discussion
Registered objection to vaccination in Australia, as a percentage of the total population aged from 12 months to less than 7 years, increased by less than one percentage point between 2002 and 2013. During this period, the percentage of children with no recorded objection but incompletely vaccinated (either no vaccinations or only some scheduled vaccinations recorded) decreased, while vaccination coverage remained relatively high and stable.4,9 Contrary to frequent claims in the media, this suggests that overall levels of objection (registered and unregistered) have not changed, and increases in registered objection may have been driven by increased awareness that registration preserved eligibility for family assistance payments, which rose in value during this period.10
Among the 5.8% of children in 2013 who were incompletely vaccinated but with no recorded objection, potential explanatory factors include unregistered objection, reporting and recording errors, and problems of access, opportunity and logistics.
Our data show that for 2.4% of children there was no recorded objection but also no scheduled vaccinations recorded on the ACIR; of these children, 52% were likely to have been born overseas. This is consistent with findings from a recent study in Western Australia which found that 44% of children with no recorded objection or vaccinations had been born and vaccinated overseas; only 28% involved an unregistered objection.11,12 Extrapolating from these data, we estimate that the proportion of children in our study with no recorded vaccinations because of an unregistered objection was about 0.7% (ie, 28% × 2.4%; Box 4). Our finding that the percentage of children with no recorded objection and no recorded vaccinations is highest in major cities and lowest in regional areas is consistent with the greater proportion of overseas-born children in major cities.13 Estimation of true vaccination coverage needs to take overseas-born status into account, particularly at the small area level in major city locations, where recording and reporting errors may explain reports of apparently lower coverage.14,15
Another important subgroup of incompletely vaccinated children includes the 3.4% of children for whom there was no recorded objection, but who were only partially vaccinated with respect to vaccines due at 2, 4 and 6 months of age. This group included a substantially higher proportion of children living in the bottom 10% of socio-economic status postcodes, suggesting delayed vaccination caused by problems related to disadvantage, logistic difficulties, access to health services, and missed opportunities in primary, secondary and tertiary health care. Incomplete vaccination has previously been associated with socio-economic factors in Australian and overseas studies.16,17
In the absence of alternative data, we assumed that the ratio between the proportions of children affected by registered objection with some and no vaccinations (ie, 0.9:1.1) was similar to that for partially unvaccinated and completely unvaccinated children with unregistered objection. We consequently estimated that the proportion of children who were partially vaccinated as the result of an unregistered objection was about 0.6%. The estimated total proportion of children affected by a registered or unregistered objection to vaccination, ranging from those who have received no vaccinations to those who have received some or delayed vaccinations, was thus 3.3% (Box 4).
This figure includes fully vaccinated children with a registered objection. Our findings indicate that, at earlier vaccination milestones, the objection was typically registered after scheduled vaccinations were given. At the 60 months’ milestone, however, appropriate vaccinations had usually been given after the objection had been registered, which may reflect a change of mind by the parent(s) and subsequent (ie, delayed) vaccination.
The distribution of recorded vaccination objection shows marked geographical clustering, posing a risk of local disease outbreaks.18–21 Teasing out the various issues contributing to incomplete vaccination will be particularly important now that data on registered objection is no longer collected: from 1 January 2016, philosophical and religious beliefs are no longer legally valid reasons for exemption from vaccination requirements for receiving family assistance payments.22 Our findings provide a baseline against which to track trends in objection, although limitations include our use of ACIR data without directly interviewing parents, and the limited nature of recent information on the completeness and accuracy of ACIR data. The most recent national survey of parents of incompletely vaccinated children estimated in 2001 that 2.5–3.0% of the annual birth cohort were affected by parents who had registered an objection or had significant concerns about vaccination.2,23 Our estimate (3.3%) was only slightly higher, suggesting that there has been little change in the overall impact of vaccination objection since 2001. A national survey, focusing on incompletely vaccinated children, equipped to evaluate data quality, and using personal interviews to assess parental attitudes, would allow verification of our findings.
In light of our conclusions, primary care clinicians should pay close attention to ensuring that the vaccination history of overseas-born children is correctly recorded in the ACIR. Clinicians should also be on the alert for appropriate catch-up opportunities for partially vaccinated children, as in most cases they are probably not up to date for reasons other than parental objection.
Box 1 –
Trends in recorded vaccination objection status and vaccination status of children aged from 12 months to less than 7 years, Australia, 2002–2013
* For vaccines due at 2, 4 and 6 months of age. The number of children in each annual cohort is given below the respective year number.
Box 2 –
Recorded vaccination objection status by socio-economic status of area of residence and vaccination status, children aged 12 months to less than 7 years, Australia, 2013 (cohort born 1 January 2007 – 31 December 2012)*
* No objection and partially vaccinated with respect to vaccines due at 12 and 18 months: cohort born 1 January 2007 – 31 December 2011; no objection and partially vaccinated with respect to vaccines due at 48 months: cohort born 1 January 2007 – 31 December 2008. Addition of percentages may result in apparent discrepancies because of rounding.
Box 3 –
Recorded vaccination objection by Statistical Area 3 (SA3), for children from 12 months to less than 7 years old, in (A) Australia and (B) south-east Queensland and northern New South Wales, 2013 (cohort born 1 January 2007 – 31 December 2012)
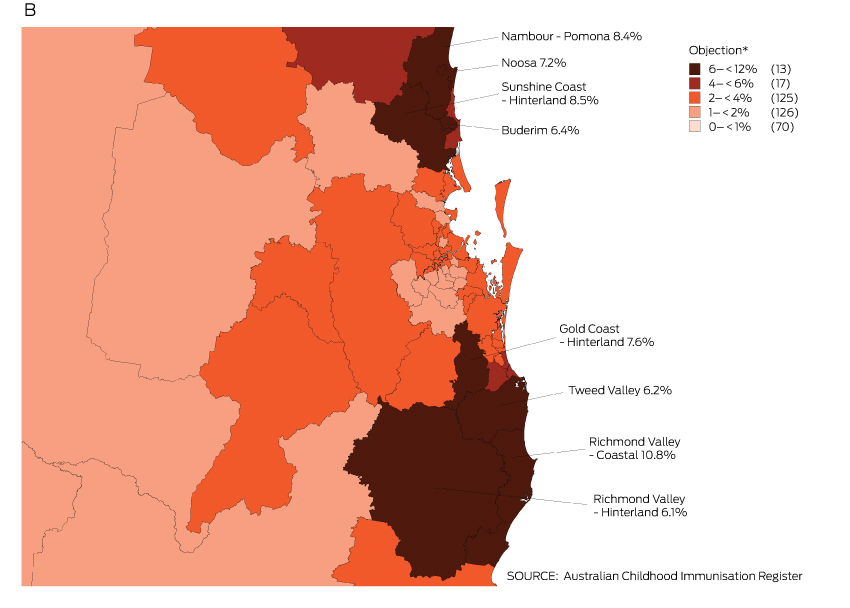
* Number of SA3s in each category in parentheses; SA3s in 6–< 12% category are named on the map.
Box 4 –
Estimates of the proportions of children aged from 12 months to less than 7 years affected by registered and unregistered vaccination objection, Australia, 2013
|
Objection/immunisation status |
Proportion of child population |
Proportion of child population affected by objection |
|||||||||||||
|
|
|||||||||||||||
|
A. Objection and no vaccinations recorded |
1.1% |
1.1% |
|||||||||||||
|
B. Objection and one or more vaccinations recorded |
0.9% |
0.9% |
|||||||||||||
|
C. No objection and no vaccinations recorded |
2.4% |
0.7%* |
|||||||||||||
|
D. No objection recorded and partially vaccinated |
3.4% |
0.6%† |
|||||||||||||
|
|
|
Total: 3.3% |
|||||||||||||
|
|
|||||||||||||||
|
* Assumption: 28% of total proportion (ie, 0.28 × 2.4%) are affected by unregistered objection (based on Western Australian study11,12). † Assumption: the ratio of children affected by unregistered objection who are partially vaccinated [D] and children affected by an unregistered objection for whom no vaccinations are recorded [C, adjusted] is similar to the ratio of children with a registered objection for whom some vaccinations are recorded [B] and those for whom no vaccinations are recorded [A]; ie, D = [B]/[A] × [C, adjusted] = 0.9/1.1 × 0.7%). |
|||||||||||||||
Rising incidence of invasive meningococcal disease caused by Neisseria meningitidis serogroup W in Victoria
Invasive meningococcal disease (IMD) caused by Neisseria meningitidis is one of the most rapidly progressive sepsis syndromes, often resulting in significant morbidity and mortality. Since the introduction of meningococcal C conjugate vaccine in 2003, IMD in Victoria has decreased from 2.5/100 000 to 0.6/100 000 population.1 Epidemiological typing of N. meningitidis isolates is by serogroup, multilocus sequence typing and finetyping.
In Victoria, from January 2014 to September 2015, the number of cases of IMD caused by N. meningitidis serogroup W (MenW) increased. Previously uncommon (< 5% of IMD overall in the period from 2008 to 2013 [n = 260]), MenW as a proportion of IMD has increased: four of 33 cases in 2014 and 12 of 41 cases in 2015 (Microbiological Diagnostic Unit, University of Melbourne, unpublished data). Over this period, the median age of cases was 55 years, compared with 19 years for serogroup B, with many non-classical presentations including pneumonia, epiglottitis, septic arthritis and pericarditis. There has been one death in a healthy young adult. No epidemiological links between cases have been observed (Victorian Government Department of Health and Human Services [DHHS], unpublished data).
Globally, MenW has been responsible for an increasing proportion of IMD since outbreaks associated with the Hajj pilgrimage in 2000.2 Large outbreaks predominantly due to MenW strain type P1.5-2: F1-1: ST11 have been reported in South America and the United Kingdom.2,3 In the UK, MenW cases doubled year on year from < 2% of IMD prior to 2009–10 to 25% in 2014–15, prompting a change in vaccination guidelines.4 Initially, almost 25% of these IMD cases were older adults with non-classical presentations.3,4
From 1 January 2014 to 30 September 2015, molecular characterisation, including whole-genome sequencing (WGS), of Victorian MenW strains was undertaken at the Microbiological Diagnostic Unit. Of the 16 MenW isolates, 11 were strain type P1.5-2: F1-1: ST11; two were ST184; one was ST22; one was a new type; and one was polymerase chain reaction-positive only and thus unable to undergo WGS. Comparison of these 11 isolates with international strains using the PubMLST Neisseria database (http://pubmlst.org/neisseria) revealed that the Victorian isolates fall within a cluster formed by UK–South American outbreak strains and are distinct from Hajj outbreak strains (Box). Within the UK–South American cluster, nine Victorian isolates appear as an exclusive group of taxa. The close genetic relationship between the nine isolates, long branch length compared with other UK–South American cluster isolates, and lack of identified epidemiological links between cases suggest that these isolates may be representative of a N. meningitidis clone arising from a single introduction event that is undergoing widespread endemic transmission in Victoria. The location of the remaining two UK–South American cluster isolates in the tree indicates independent introduction events into Victoria.
While IMD due to MenW in Victoria remains low in absolute case numbers, the rise in incidence is concerning. The Victorian DHHS has instigated enhanced surveillance measures with full molecular characterisation of future isolates to inform ongoing public health responses. National surveillance with enhanced molecular characterisation will improve understanding of the current epidemiology of meningococcus in Australia.
Box –
Phylogenetic tree for Victorian and international meningococcal isolates
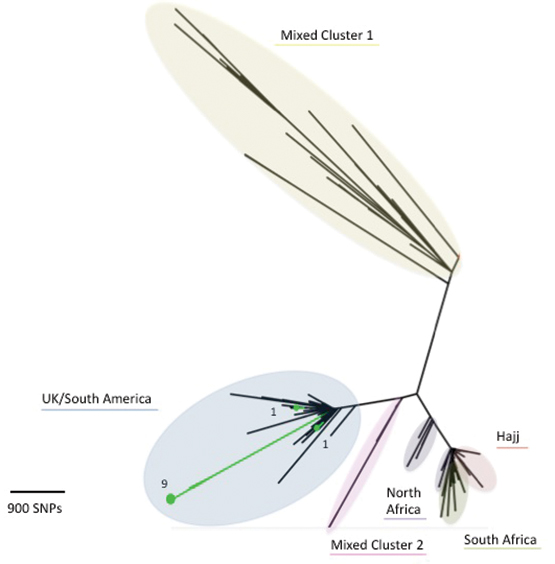
The diagram illustrates the phylogenetic relationship between isolates based on core genome single nucleotide polymorphisms (SNPs). Victorian MenW ST11 isolates demonstrate region-specific clustering, and the close relationship of Victorian MenW strains (in green) to the United Kingdom–South American cluster is shown. (Numerical values for the Victorian isolates represent the number of isolates, while the underlined description refers to geographical origin of isolates.) Note: Mixed Cluster 1 refers to isolates from the UK 1975–2007 and South Africa 2003–2013; Mixed Cluster 2 refers to isolates from UK 1996–2000, South Africa 2003–2004 and North Africa 1996–1999.
Immunisation for medical researchers: an ethical and practical imperative
Participants in medical research are the most valuable resource within health research, and their wellbeing must be regarded as paramount. Australia’s national statement on ethical conduct in human research1 establishes that the burden is on researchers to safeguard the health, wellbeing and autonomy of their research participants. We argue that additional guidance is required in an area that has not been widely considered in the ethical research literature and policy: immunisation coverage of the research team.
It is acknowledged that health care workers with immunisation-preventable diseases infect their patients.2,3 There is no reason to believe that researchers are exempt from transmitting these diseases to their participants. There are national guidelines4 that provide evidence-based recommendations on immunisation for people at occupational risk, but this guidance does not specifically refer to researchers.
We present a case study to illustrate the issue. We undertook a cross-generational longitudinal study examining environmental, lifestyle and genetic factors influencing health and wellbeing across the lifespan. The study, based at a medical research institute, involved recruiting pregnant women in collaboration with the local health district. University researchers sought honorary appointments for recruitment and data collection in the hospital setting, with the expectation that we would be required to prove immunisation currency, according to relevant state health policy.5 When the resultant honorary researcher appointment applications were approved, we were not required to show any immunisation status. There may be several reasons for this: first that individuals classifying risk may interpret the rules differently; and second, employment status in clinical research studies with multiple researchers from different organisations is complex.
The study researchers reviewed the university immunisation guidelines and found that those on clinical placements in state health facilities required immunisation coverage, but for all others, including researchers, immunisation was voluntary. After careful consideration, we decided that ensuring the research team was fully immunised was the most ethical way to approach our research. In consultation with an infection control specialist at the local health district, we agreed on several immunisations or evidence of serological immunity.
To fulfil our responsibilities as ethical researchers, we believe it is essential that all researchers who have direct contact with participants are fully immunised, using national guidelines, against relevant diseases. The prevention of avoidable harm appears to be an ethical imperative, but we can find no consistent guidance in this area for researchers at a national or international level. We suggest that it is appropriate for the National Health and Medical Research Council to consider guidance on immunisation coverage of researchers who have direct contact with participants, rather than leaving it to individual research ethics committees.
Ebola outbreak in West Africa: considerations for strengthening Australia’s international health emergency response
It is time for a common vision and strategy for deploying Australian expertise to international public health emergencies
An effective response to health emergencies such as the Ebola virus disease outbreak in West Africa relies on global capacity to rapidly surge the supply of skilled workers, particularly when they are limited in affected countries and increasingly depleted during the emergency. Before the Ebola outbreak, health professionals in West Africa were already scarce; for example, in Liberia the doctor-to-population ratio was 1:70 000, compared with 1:300 in Australia.1,2 In addition to clinicians, an effective response to a large outbreak of Ebola virus disease in resource-limited settings requires international technical support across a range of public health and other disciplines, including infection prevention and control, epidemiology, laboratory diagnostics, communication, mental health, anthropology, social mobilisation, logistics, security and coordination.
Early in the Ebola virus disease outbreak in West Africa, many international non-government organisations (NGOs) and several governments established treatment centres and sent public health professionals to provide clinical care and augment control efforts. Timely public health interventions in Ebola-affected rural communities achieved crucial reductions (about 94%) in Ebola transmission.3 The Centers for Disease Control and Prevention (CDC) in the United States is a case study in how governments can deploy significant public health staff to countries affected by health emergencies. At time of writing, the CDC had effected 2206 staff deployments since July 2014 to support the public health response in Ebola-affected countries across a wide range of areas including surveillance, contact tracing, database management, laboratory testing, logistics, communication and health education.4 Most CDC public health staff were deployed into roles with a low risk of Ebola virus infection (ie, non-patient care roles) and none have become infected. In assessing the CDC’s exemplary response, it is important to note its pre-existing Global Health Strategy that clearly articulates the CDC’s vision, rationale, role, strategy, funding, partnerships, staff and areas of expertise for working in international public health, including in health emergencies such as Ebola virus disease.5
In contrast, nearly 6 months into the outbreak — when almost 5000 deaths had already been recorded — the Australian Government was being criticised by public health experts for its lack of substantive assistance to Ebola-affected countries.6 The Public Health Association of Australia called on the government to help strengthen the medical and public health capacity in the region by deploying an Australian Medical Assistance Team (AUSMAT), and by supporting Australians who wanted to volunteer their services through the World Health Organization or international NGOs by encouraging their employers to provide special leave and continuation of entitlements.6 Ultimately, the Australian Government declined to deploy AUSMAT resources, stating it would not consider sending people to Ebola-affected countries until it could get assurances from developed countries closer to West Africa that Australians would be able to be evacuated for treatment in the event they became infected.7 Instead, the Australian Government chose to fund a private contractor to staff a single treatment centre built by British army engineers in Sierra Leone. To date, anecdotal reports suggest no public health professionals have been deployed to Ebola-affected countries by the Australian Government, although the risk of infection is low.
The current and all previous Australian governments have not clearly articulated a vision for providing public health support during an international health emergency. AUSMATs are multidisciplinary health teams of doctors, nurses, paramedics, firefighters (logisticians) and allied health staff such as environmental health workers, radiographers and pharmacists8 who provide timely acute medical relief immediately after disasters in Australia and overseas. Staff of state and territory governments can be members of AUSMATs, and these agencies are reimbursed by the federal government for the salaries of staff who deploy through this mechanism. AUSMATs have a relatively small number of public health professionals on a roster largely drawn from staff of state and territory health authorities, but this list includes only a limited number with relevant outbreak response skills. While AUSMATs have a proven track record in providing emergency medical care in post-disaster settings, they are not currently designed to support the public health response required for a large outbreak.
The decision not to use AUSMAT assets and the lack of federal support for other Australian health professionals who wanted to volunteer to help contain the Ebola outbreak transferred the pressure to institute human resource policies (ie, special leave and continuation of entitlements) to state and territory health authorities. Without the type of financial arrangements that the AUSMATs afford state and territory health authorities, and with a general lack of jurisdiction-funded strategies for their staff engaging in emergency responses overseas, the environment for staff deploying independently was not always supportive.
Despite the challenges, many public health professionals from state and territory health authorities and academic institutions in Australia deployed as volunteers for NGOs or United Nations agencies, including about 15% of the Australian National University Master of Applied Epidemiology (MAE) program’s alumni since 1991 (Martyn Kirk, MAE Program Director, Australian National University, personal communication). Still, only one current Australian MAE participant was deployed, with Médecins Sans Frontières (as of January 2015), compared with 97 from a similar program in the US (the CDC’s Epidemic Intelligence Service), highlighting the missed opportunity for Australia’s next generation of outbreak control experts to get invaluable field experience while providing much needed support.
Now that the Ebola virus disease outbreak is over, Australia needs to examine how well it performed in assisting the WHO to respond to this significant threat to global health, as it was declared by the International Health Regulations Emergency Committee in August 2014.9 We believe it is time for the Australian Government, in consultation with state and territory health authorities and public health training institutions, to establish a common vision and strategy for deploying Australian expertise to international public health emergencies, including Ebola virus disease outbreaks. If AUSMATs (currently the only funded mechanism) are Australia’s preferred approach to responding to international health emergencies, their capacity to support a major public health response should be expanded by including more professionals in relevant disciplines. To maximise the impact of public health professionals deployed through AUSMAT arrangements, personnel should be made available at the beginning of future health emergencies. In addition, formalising support arrangements with members of the Australian Response MAE (ARM) Network10 (created by academic institutions in response to gaps in the coordination of Australia’s public health surge capacity) may be a way for the government to effectively mobilise skilled public health professionals for deployment overseas in response to disease outbreaks. Consideration should also be given to expanding the AUSMAT roster of public health professionals and integrating structures like the ARM Network into the response framework.
The Australian Government missed an important opportunity to contribute timely, valuable technical assistance to Ebola-affected countries; support that was essential to stopping the outbreak at its source at a time when it was needed most. In the end, many Australians stepped up as volunteers in the fight to extinguish this global threat to public health. Australian federal authorities should reflect on this experience and consider it an opportunity to strengthen Australia’s response to future health emergencies and demonstrate leadership on the global stage.
Zika preparedness in Australia
Our comprehensive national response encompasses prevention and surveillance, as well as monitoring and controlling Aedes aegypti in Australia

The spectrum of clinical illness for Zika virus infection is generally not severe — about 80% of cases are asymptomatic1 — and the infection was not previously thought to be cause for serious public health concern. There is no specific treatment for, nor a vaccine against, a Zika infection.
Recent disquiet has been raised by emerging evidence of possible vertical transmission of Zika, the development of severe congenital abnormalities, including microcephaly,2,3 and of a possible link to fetal deaths.4 In addition, a possible link to Guillain–Barré syndrome has been reported.5,6 The World Health Organization declared the clusters of microcephaly and neurological disorders a Public Health Emergency of International Concern on 1 February 2016.7 Knowledge about any causal link between Zika virus and effects in utero is still evolving; however, given the serious implications, should there be one, Australian guidance for managing pregnant women returning from Zika-affected areas and for preventing the spread of the disease has been prepared.
In almost all cases, the Zika flavivirus is transmitted by mosquitoes (particularly by Aedes aegypti). The Zika virus was first isolated from a monkey in Uganda in 1947,8 and serological evidence of past infections in humans has been reported since 1952 in Africa and since 1981 in South-East Asia.9,10 Outbreaks in the Pacific Islands were first reported in Yap State, Micronesia, in 20071 and in French Polynesia from 2013,11 with spread to many Pacific islands between 2013 and 2016.12,13 Zika has spread rapidly across the Americas since late 2015, after being first confirmed in Brazil in 2015.14 In November 2015 the international community was alerted to the possibility of severe congenital malformations, with an International Health Regulations notification about an increase in cases of microcephaly in Brazil with geographical and temporal links to Zika.15 At that time, further information was also provided by health authorities in French Polynesia about congenital malformations, also with geographical and temporal links to Zika.15
In Australia, sporadic cases of Zika have been detected since 2012 in 35 returning travellers (to 29 February 2016), and there is a continuing risk of imported Zika infections from overseas. With the number of affected overseas areas increasing, as is greater awareness among the public and health professionals, an increase in the detection of imported cases could be expected.
The low risk of local transmission of Zika in Australia is restricted to areas of Queensland where the most suitable vector, A. aegypti, is continually present. Queensland has well developed and practised plans and resources for controlling dengue (also carried by the A. aegypti mosquito) that are also applicable to Zika. Through routine vector monitoring and control activities, and the deployment of Dengue Action Response Teams (DARTs), the Queensland government has prevented dengue from becoming endemic, despite regular importations. The Queensland government recently announced a package of measures to strengthen preparedness, including enhanced laboratory capacity in Townsville. Queensland Health remains on the alert for imported cases and subsequent local transmission.
A program of mosquito surveillance and control, coordinated by the federal Department of Agriculture and Water Resources, is in place at Australia’s air and sea ports to prevent incursions of exotic mosquitoes from overseas. While foreign mosquitoes are detected during the summer months, well established programs prevent their establishing breeding populations. There is also a specific program conducted by Queensland Health in the Torres Strait for controlling A. albopictus (a potential alternative vector for the Zika virus16), active in this area since 2005. The program has been successful in preventing its spread to the mainland and in reducing the numbers of A. albopictus and, at the same time, of A. aegypti in the transport hubs of the Torres Strait.
In February 2016, the Australian Health Protection Principal Committee issued advice on the management of pregnant women returning from Zika-affected countries and on preventing sexual transmission of Zika. A public health guideline on Zika is being finalised, and advice for travellers was issued in January 2016.17 Until more is known about the link between the virus and microcephaly, Australia recommends that women who are pregnant or planning to become pregnant should consider postponing travel to areas with ongoing transmission of Zika. If they do decide to travel, they should consistently adhere to mosquito avoidance measures. This recommendation is in line with major public health agencies around the world.
The Interim recommendations for assessment of pregnant women returning from Zika virus-affected areas18 encourage health care providers to ask all pregnant women about their recent travel history. Those who have travelled to a Zika-affected country during their pregnancy should be evaluated and tested. Any woman who tests positive for Zika virus should be referred for specialist obstetric care. The Royal Australian and New Zealand College of Obstetricians and Gynaecologists has issued guidance on the care of women with confirmed Zika virus infection during pregnancy in Australia.19
Further concerns for pregnant women and their unborn babies have been triggered by the possibility of sexual transmission of Zika virus. Initially, two instances of likely sexual transmission were reported internationally, one in 2008 and the other in 2016,20,21 and two instances of Zika virus being detected by polymerase chain reaction in semen — including one 62 days after the onset of symptoms — although virus isolation was not performed, so that it was not determined whether viable virus was present.22,23 There is evidence from the United States that sexual transmission of Zika may be more common than previously reported.23 To date, all reports of suspected or confirmed sexual transmission of Zika have involved a symptomatic man transmitting the virus to a woman. It is still unknown how long the virus can persist in semen, or how infectious this may be. Mosquitoes remain the overwhelmingly predominant mode of transmission. The Australian advice, Interim recommendations for reducing the risk of sexual transmission of Zika virus,25 recommends that men with a confirmed Zika virus infection and whose partner is pregnant should abstain from sex or consistently use a condom during sex for the duration of the pregnancy. Men with a confirmed Zika infection who do not have a pregnant partner should abstain from sex or consistently use a condom during sex for 3 months after leaving a Zika-affected country.
All recommendations about travel, testing and management require definition of the countries that have current local transmission. The list of affected countries is assessed daily by the Department of Health, based on agreed criteria. This, however, is not straightforward, and differences between overseas surveillance systems mean that a variety of sources must be checked to assess whether local transmission of Zika virus is happening in a particular country.
While unease about Zika is high, there remains a lack of high quality evidence for a causative link between infection and the development of microcephaly, and there is a general lack of data on the pathogenesis and epidemiology of the disease. Further studies are urgently required, and are underway. The need to formulate recommendations despite a paucity of data and evidence is not new in public health. However, it does pose particular challenges and risks, in that we may have to modify recommendations frequently. Expert consultations and the experiences and recommendations of other agencies internationally are important in the development of such recommendations. A key component of preparedness for communicable disease outbreaks in Australia is developing nationally consistent advice across the states and territories, and harnessing the expertise that is present throughout our country.
Australia has robust systems in place that can be adapted as required to enable a rapid response to communicable diseases such as Zika, with excellent laboratory capacity, public health response capability and communicable disease surveillance systems, as well as established vector surveillance and control programs. As the situation evolves, ongoing monitoring will continue, with information and recommendations updated as necessary. Zika is the latest communicable disease threat to challenge us. Each new threat offers an opportunity for enhancing core elements of communicable disease control and for ensuring readiness for the next emerging infectious disease.