The incidence of type 1 diabetes has risen considerably in the past 30 years due to changes in the environment that have been only partially identified. In this Series paper, we critically discuss candidate triggers of islet autoimmunity and factors thought to promote progression from autoimmunity to overt type 1 diabetes. We revisit previously proposed hypotheses to explain the growth in the incidence of type 1 diabetes in light of current data. Finally, we suggest a unified model in which immune tolerance to β cells can be broken by several environmental exposures that induce generation of hybrid peptides acting as neoautoantigens.
Preference: Public and Environmental Health
964
Trends in severe traumatic brain injury in Victoria, 2006–2014
Traumatic brain injury (TBI) is the most significant cause of death and severe disability resulting from major trauma.1 The economic burden of TBI is significant, with estimated annual hospital costs of $184 million in Australia.2 Although severe TBI constitutes a small proportion of all TBI,3 these injuries are a significant public health problem, associated with high mortality, profound long term disability, and significant long term health care costs.4,5
While there is evidence that mortality associated with severe TBI has not changed since 1990,6 data on temporal trends in the incidence and causes of severe TBI are limited. Understanding the epidemiological patterns of severe TBI is necessary for developing targeted interventions and evaluating injury prevention strategies. This is particularly important given the worldwide focus on the prevention of falls and road trauma, the major causes of severe TBI.5,7,8
The aim of this study was therefore to examine trends in the incidence and causes of hospitalisations for severe TBI across a statewide population (Victoria) over a 9-year period (2006–2014).
Methods
A retrospective review of severe TBI cases was conducted, using data from the Victorian State Trauma Registry (VSTR) for the period 1 January 2006 – 31 December 2014.
Victorian State Trauma Registry
The VSTR is a population-based registry that collects data about all patients hospitalised in Victoria with major trauma.9 A case is included in the VSTR if any of the following criteria are met:
-
the injury results in death;
-
an injury severity score greater than 12 is determined using the Abbreviated Injury Scale (2005 version, 2008 update = AIS 200810);
-
the patient is admitted to an intensive care unit for more than 24 hours and mechanical ventilation is required for at least part of this stay; or
-
the patient undergoes urgent surgery.
Definition of severe TBI
Severe TBI was defined as trauma with an AIS (2005 version, 2008 update) score for the head region of at least 3 and a Glasgow Coma Scale11 (GCS) score of 3 to 8. A head region AIS score of 3 or more indicates an anatomical injury with a rating of serious or higher; a GCS score in the range 3 to 8 is often used as the criterion for severe brain injury.5,7 The combination of anatomical and physiological measures to define severe TBI avoided including patients whose low levels of consciousness were not caused by a head injury, but by alcohol or drug intoxication, for example. Injury diagnoses coded before the introduction of the AIS 2008 were mapped from the AIS 1990, 1998 version to the AIS 2008 using a validated map.12 When possible, the GCS score was recorded on arrival at the hospital to which the patient was initially transported (this occurred for 716 patients, or 35% of all cases analysed in our study). If this was unavailable, the pre-hospital GCS score recorded by paramedics (1080 patients, 52%) was used, or the GCS score recorded on arrival at the definitive hospital (the hospital at the highest service level in the tiered trauma system structure at which the patient was treated: six patients, 0.3%). The GCS score was coded as 3 when pre-hospital, primary hospital and definitive hospital GCS scores were all unavailable because the patient had been intubated (260 patients, 13%). Pre-hospital deaths and events experienced by patients outside Victoria subsequently transported to Victorian hospitals were excluded from analysis.
Procedures
Severe TBI cases were stratified by intent of the event causing the injury (those resulting from unintentional or intentional events), as the strategies for preventing TBI are different for these two categories. Unintentional events were classified as transport-related (involving motor vehicles, motorcycles, pedestrians or cyclists), falls (low falls from standing or no more than one metre, or unintentional high falls from a height of greater than one metre), or other. Intentional severe TBI cases were classified as interpersonal violence or self-harm events. Patient age was categorised into five bands (0–4, 5–14, 15–34, 35–64 and ≥ 65 years). Event locations were mapped to Victorian Government Department of Health regions13 and classified as metropolitan or rural.
Statistical analysis
Population-based incidence rates and 95% confidence intervals (95% CIs) were calculated for each calendar year. Population estimates for Victoria for each year were obtained from the Australian Bureau of Statistics.14 Comparisons of crude and age–sex-standardised incidence rates (standardised according to the five age categories) found substantial concordance (overall severe TBI incidence: Lin concordance correlation coefficient ρ = 0.999 [95% CI, 0.999–1.000; P < 0.001]). Crude incidence rates are therefore reported. Poisson regression was used to determine whether the incidence rate increased or decreased over the 9-year period. A check for potential overdispersion of the data was performed to ensure that the assumptions of a Poisson distribution were met. The incidence rate ratio (IRR) and 95% CIs were calculated, and P < 0.05 was deemed statistically significant. Stata 13 (StataCorp) was used for all analyses.
Ethics approval
The VSTR has approval from institutional ethics committees of all 138 hospitals receiving patients who have suffered a trauma (Department of Health Human Research Ethics Committee; reference, 11/14) and the Monash University Human Research Ethics Committee (MUHREC; reference, CF13/3040-2001000165). This study was approved by the MUHREC (reference, CF12/3965-2012001903).
Results
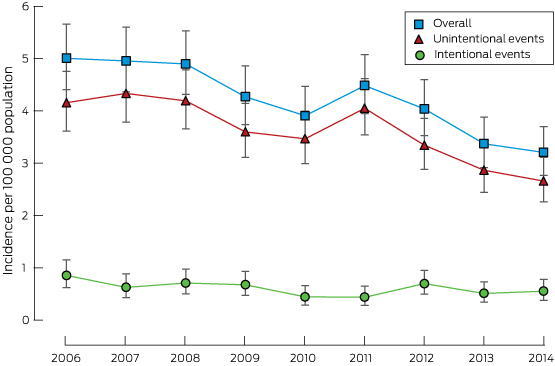
There were 2062 hospitalisations for severe TBI in Victoria during the 9-year study period, comprising 9% of all major trauma cases. Most patients were men, and 40% were aged 15–34 years; most incidents occurred in metropolitan areas (65%) and were the result of unintentional events (86%) (Box 1). The overall incidence of severe TBI was 4.20 cases per 100 000 population per year, with a significant decrease over the study period from 5.00 to 3.20 cases per 100 000 population per year (IRR, 0.95; 95% CI, 0.93–0.96; P < 0.001; Box 2). The overall proportion of patients who died in hospital was 42.5%, and was highest in those aged over 64 years (78%; Box 3). Annual incidence rates are provided in the Appendix.
Unintentional events
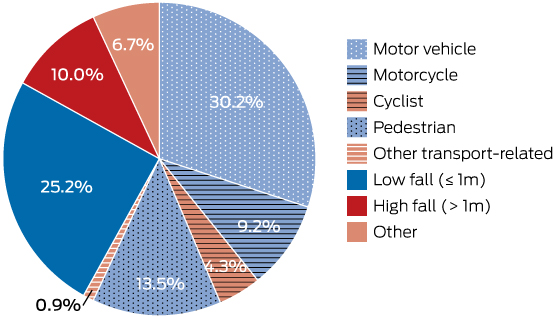
The overall incidence of severe TBI resulting from unintentional events was 3.60 cases per 100 000 population per year, and the incidence decreased 5% per year during the study period (IRR, 0.95; 95% CI, 0.93–0.96; P < 0.001; Box 2). The major causes of injury resulting from unintentional events were transport-related (58.1%) and falls (35.2%) (Box 4). Transport-related severe TBI involving motor vehicle crashes (51.9%) and pedestrians (23.3%) were the most frequent types (Box 3).
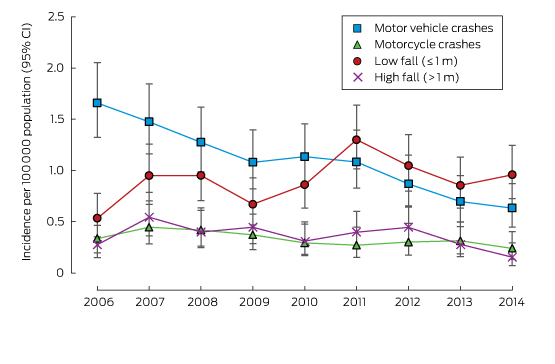
Severe TBI resulting from motor vehicle crashes (Box 5) was most frequent in the 15–34-year-old age group (64.7%; Box 3). The incidence of severe TBI involving motor vehicle occupants declined over the study period (IRR, 0.89; 95% CI, 0.86–0.92; P < 0.001), as did those of severe TBI involving cyclists (IRR, 0.88; 95% CI, 0.80–0.96; P = 0.003) or pedestrians (IRR, 0.95; 95% CI, 0.90–1.00; P = 0.04). The incidence of severe TBI in motorcyclists declined by 6% per year, but this was not statistically significant (IRR, 0.94; 95% CI, 0.89–1.00; P = 0.06).
Seventy-two per cent of fall-related severe TBIs were the result of a fall from standing or from no more than one metre. The incidence of severe TBI from low falls increased over the study period (IRR, 1.04; 95% CI, 1.00–1.08; P = 0.03), while the incidence of severe TBI caused by high falls decreased (IRR, 0.94; 95% CI, 0.89–1.00; P = 0.04). Low falls were most frequent among people aged 65 years or more (68.1%; Box 3).
Intentional events
The overall incidence of severe TBI resulting from intentional events was 0.60 cases per 100 000 population per year (Box 2); this declined across the study period (IRR, 0.95; 95% CI, 0.91–1.00; P = 0.03). Intentional events resulting in severe TBI were classified as interpersonal violence (64.9%) or self-harm events (35.1%). Annual numbers in these subgroups were too small for analysing trends. The most common causes of severe TBI caused by self-harm were high falls (31.7%), transport-related events (26.9%), asphyxiation (19.2%), and firearm use (19.2%). The most common cause of severe TBI resulting from interpersonal violence was being struck by a person or object (84.9%).
Discussion
Our study investigated trends in the incidence and causes of severe TBI leading to hospitalisation over a 9-year period. The incidence of severe TBI resulting from unintentional and intentional events decreased by 5% per year. The reduction in severe TBI resulting from unintentional events was predominantly driven by reductions in transport-related severe TBI. Over the same period, the incidence of low falls-related severe TBI increased, and these injuries were mainly sustained by older adults.
This study is the first to specifically focus on the incidence of severe TBI in Australia across all age groups. The rates reported by the few studies that have examined the incidence of severe TBI have varied (cases per 100 000 population per year: Norway, 4.1;7 Switzerland, 10.6;15 Canada, 11.4;5 France, 17.38). The overall incidence of severe TBI found by our study (4.20 cases per 100 000 population per year) was similar to that in the Norwegian study, which investigated patients hospitalised with severe TBI during 2009–2010, but was lower than in most other studies. This is at least partly explained by differences in the inclusion criteria applied; most studies used head AIS8,15 scores alone to define severe TBI, whereas our study and the Norwegian investigation employed a combination of head injury classification (AIS scores or International Classification of Diseases, revision 10 codes) and GCS score. There may also be genuine differences between countries in the incidence of severe TBI resulting from differing exposures to high risk activities. We found a decline in the incidence of severe TBI over the 9-year period. This contrasts with earlier studies that included all degrees of TBI severity,5,16 which found no significant changes in incidence. However, these studies were conducted over shorter time periods5 or only at two time points,16 potentially explaining the lack of detectable trends.
Falls and transport-related events were the most common causes of severe TBI, and this is consistent with Australian17 and international data.5,7,8,16 It is notable that the incidence of severe TBI resulting from motor vehicle crashes declined over the study period. This reduction is possibly explained by continued improvements in vehicle safety, as well as road safety mass media campaigns. Active safety design measures, such as electronic stability control (ESC) and autonomous emergency braking substantially reduce crash risk;18 ESC has been a mandatory safety feature in new vehicles sold in Victoria since 2011. Similarly, passive safety features, such as curtain airbags, substantially reduce head injuries in side impact crashes.19
Declines in the incidence of severe TBI in pedestrians and cyclists were also noted. These declines may be associated with improvements to road infrastructure, such as pedestrian zones with lower speed limits, and separated bike lanes and paths. Continued efforts to improve infrastructure (including separating pedestrians and cyclists from motor vehicles) and safety (such as increasing helmet use and improving vehicle design to mitigate pedestrian injury) may lead to further declines in the incidence of severe TBI in these vulnerable road users.
There was also a decline in the incidence of severe TBI in motorcyclists, but this was not statistically significant. A review of motorcycle fatalities in Australia indicated that risky riding behaviour (excessive speed, the influence of alcohol and drugs, disobeying traffic control laws) was involved in 70% of events.20 Interventions targeting these behaviours, including mass media campaigns and increased law enforcement, may further reduce severe TBI rates. Consideration should also be given to active safety features in motorcycles, such as antilock braking systems.
Falls were the second most common cause of severe TBI in our study. The incidence of severe TBI from low falls, which occurred mainly in those aged 65 years or more, increased between 2006 and 2014. Increases in this group have also been observed in New South Wales21 and internationally.5 This may be a result of ageing populations, increased rates of comorbidities, and more widespread use of anticoagulant and antiplatelet drugs.16,21 These medications are effective in preventing stroke and thrombo-embolism,22 but increase the complexity of managing trauma patients; further studies examining the incidence of trauma-related complications are needed. The proportion of the Australian population aged 65 years or more is expected to double between 2005 and 2050,23 and our results and international data3 show that TBI outcomes are noticeably worse in older than in younger people. It is therefore clear that further research is required to reduce the incidence of severe TBI in older people. While an overall increase in the incidence of severe TBI resulting from falls was observed across the entire study period, a decline was observed for 2011–2014. This suggests that recent fall prevention programs may have been effective, although further data are needed to explain this trend.
The incidence of severe TBI resulting from intentional events (14.4% of all severe TBI) was similar to that reported by an American study (17.8%).24 We found that this incidence declined during the study period. Interpersonal violence was the primary cause of severe TBI resulting from intentional events, and this has been strongly associated with alcohol intoxication;25 continuing targeted interventions for limiting alcohol consumption through education and by tighter controls at licensed venues may reduce its incidence. Self-harm events accounted for 35.1% of severe TBI resulting from intentional events, but numbers for this group were insufficient for assessing trends. Australian data indicate that suicide rates declined from 1999–2000 to 2010–11, but the incidence of hospitalisation after intentional self-harm remained steady.26 While the number of patients hospitalised with severe TBI resulting from self-harm is small relative to that related to unintentional events, self-harm remains a significant public health problem, and further efforts to improve mental health care and provide early interventions are needed.
The major strength of our study was the use of the population-based VSTR to provide a comprehensive overview of the incidence of severe TBI. However, a number of limitations are acknowledged. Our study was observational, so that identifying causal explanations for the reported trends is beyond its scope; we can only postulate that certain factors may explain these trends. The denominator used to calculate crude incidence was the population of Victoria during the relevant year; we do not have data on the number of people undertaking specific activities (such as cyclists or pedestrians) or the actual time they were at risk of injury. Using the catchment population as the denominator, however, is a widely employed approach.5,7,8,16 Pre-hospital deaths were excluded from this study, so that the true incidence of severe TBI may have been underestimated. Additionally, our analysis was under-powered for assessing combined age- and event-specific trends over time. Further research is needed to understand the mortality and functional outcomes for patients with severe TBI.
Conclusion
Given the devastating consequences of severe TBI, efforts in both primary and secondary prevention are critical to reducing mortality and non-fatal injury burden. In this study of patients hospitalised with major trauma between 2006 and 2014, the incidence of severe TBI resulting from motor vehicle crashes declined, while severe TBI resulting from falls increased over time. Ongoing efforts to reduce road trauma, interpersonal violence and intentional self-harm injury are warranted, while increased efforts to reduce falls-related injuries and injuries to vulnerable road users are needed.
Box 1 –
Profile of patients with severe traumatic brain injury in Victoria, 2006–2014, stratified by unintentional and intentional causal events
|
|
All cases |
Unintentional events |
Intentional events |
||||||||||||
|
|
|||||||||||||||
|
Total number |
2062 |
1766 (85.6%) |
296 (14.4%) |
||||||||||||
|
Sex |
|
|
|
||||||||||||
|
Male |
1482 (71.9%) |
1236 (70.0%) |
246 (83.1%) |
||||||||||||
|
Female |
580 (28.1%) |
530 (30.0%) |
50 (16.9%) |
||||||||||||
|
Age |
|
|
|
||||||||||||
|
0–4 years |
74 (3.6%) |
57 (3.2%) |
17 (5.7%) |
||||||||||||
|
5–14 years |
86 (4.2%) |
84 (4.8%) |
2 (0.7%) |
||||||||||||
|
15–34 years |
827 (40.1%) |
673 (38.1%) |
154 (52.0%) |
||||||||||||
|
35–64 years |
585 (28.4%) |
475 (26.9%) |
110 (37.2%) |
||||||||||||
|
≥ 65 years |
490 (23.8%) |
477 (27.0%) |
13 (4.4%) |
||||||||||||
|
Region |
|
|
|
||||||||||||
|
Metropolitan |
1338 (64.9%) |
1124 (63.7%) |
214 (72.3%) |
||||||||||||
|
Rural |
724 (35.1%) |
642 (36.4%) |
82 (27.7%) |
||||||||||||
|
Maximum head AIS score |
|
|
|
||||||||||||
|
AIS 3 |
385 (18.7%) |
328 (18.6%) |
57 (19.3%) |
||||||||||||
|
AIS 4 |
588 (28.5%) |
498 (28.2%) |
90 (30.4%) |
||||||||||||
|
AIS 5 |
1051 (51.0%) |
911 (51.6%) |
140 (47.3%) |
||||||||||||
|
AIS 6 |
7 (0.3%) |
6 (0.3%) |
1 (0.3%) |
||||||||||||
|
AIS 9* |
31 (1.5%) |
23 (1.3%) |
8 (2.7%) |
||||||||||||
|
Outcome |
|
|
|
||||||||||||
|
In-hospital mortality |
877 (42.5%) |
757 (42.9%) |
120 (40.5%) |
||||||||||||
|
|
|||||||||||||||
|
AIS=Abbreviated Injury Scale. All percentages are column percentages, except first row (“total number”). *An AIS score of 9 indicates that there was not enough information for more detailed coding. |
|||||||||||||||
Box 3 –
Profile of patients with severe traumatic brain injury in Victoria, 2006–2014, by age group and cause of injury*
|
|
Age group |
All |
|||||||||||||
|
0–4 years |
5–14 years |
15–34 years |
35–64 years |
≥65 years |
|||||||||||
|
|
|||||||||||||||
|
Unintentional events† |
|
|
|
|
|
|
|||||||||
|
Transport-related |
|
|
|
|
|
|
|||||||||
|
Motor vehicle crashes |
17 (3.2%) |
22 (4.1%) |
345 (64.7%) |
123 (23.1%) |
26 (4.9%) |
533 (51.9%) |
|||||||||
|
Motorcycle crashes |
0 |
10 (6.2%) |
94 (58.0%) |
55 (34.0%) |
3 (1.9%) |
162 (15.8%) |
|||||||||
|
Cyclist |
0 |
10 (13.0%) |
24 (31.2%) |
34 (44.2%) |
9 (11.7%) |
77 (7.5%) |
|||||||||
|
Pedestrian |
12 (5.0%) |
23 (9.6%) |
84 (35.1%) |
63 (26.4%) |
57 (23.8%) |
239 (23.3%) |
|||||||||
|
Other transport-related |
0 |
2 (13.3%) |
8 (53.3%) |
1 (6.7%) |
4 (26.7%) |
15 (1.5%) |
|||||||||
|
Falls |
|
|
|
|
|
|
|||||||||
|
Low (≤ 1 m) |
13 (2.9%) |
5 (1.1%) |
29 (6.5%) |
95 (21.3%) |
303 (68.1%) |
445 (71.7%) |
|||||||||
|
High (> 1 m) |
0 (0.0%) |
6 (3.4%) |
50 (28.4%) |
59 (33.5%) |
61 (34.7%) |
176 (28.3%) |
|||||||||
|
Intentional events |
|
|
|
|
|
|
|||||||||
|
Interpersonal violence |
17 (8.9%) |
0 |
110 (57.3%) |
60 (31.3%) |
5 (2.6%) |
192 (64.9%) |
|||||||||
|
Self-harm |
0 |
2 (1.9%) |
44 (42.3%) |
50 (48.1%) |
8 (7.7%) |
104 (35.1%) |
|||||||||
|
Outcomes‡ |
|
|
|
|
|
|
|||||||||
|
In-hospital mortality |
24 (32.4%) |
16 (18.6%) |
231 (27.9%) |
225 (38.5%) |
381 (77.8%) |
877 (42.5%) |
|||||||||
|
|
|||||||||||||||
|
*All percentages are row percentages (ie, contribution of each age group to each cause category), except the final column (“All”), in which the contribution of each subcategory to transport-, fall- or intentional event-related traumatic brain injury is given. †Unintentional events resulting from “other” injury causes (not transport- or fall-related: 119 cases) are not included in this table. ‡For all severe traumatic brain injury. |
|||||||||||||||
Margaret Anne Burgess
A remarkable paediatrician who pioneered research into vaccines and vaccine-preventable diseases in Australia
Margaret Burgess (nee Menser, 1937–) was born in Sydney, and it is Sydney alone that can claim credit for her education and the achievements of a career spanning, unusually, laboratory, clinical and population-based research. Her contributions to medicine are of international importance to our understanding of congenital rubella and its prevention, and to clinical and public health aspects of the control of vaccine-preventable disease more generally. With more than 250 published articles and 20 book chapters, and an Order of Australia for services to public health, Margaret can rightly be considered a pre-eminent paediatric researcher of her generation.
Margaret’s intellectual and personal qualities first became evident as captain of Fort Street Girls High School in 1954. She went on to study medicine at the University of Sydney, where she was active in the University Women’s Union. On graduating in 1961, she won the Dagmar Berne Prize for first place among women candidates and was first in the year in surgery. The link with Dagmar Berne, who was the first woman to enrol in medicine in Australia in 1885, but who needed to transfer to London to evade obstruction to her graduation in Sydney, is apposite. In 1964, Margaret became the first woman appointed as a medical or surgical registrar at the Royal Prince Alfred Hospital (RPAH) since the end of World War II, and had to deal with a number of obstacles on her path — but more of this later.

Margaret Burgess, Director of the National Centre for Immunisation Research and Surveillance of Vaccine-Preventable Diseases, 2003.
Her inclination towards paediatrics and child health began when she was a medical student. This was prompted first by the tragic but expected death of her sister Lynette, after surgery for cyanotic congenital heart disease, and second by the inspirational teaching of Australia’s first Professor of Paediatrics, Sir Lorimer Dods. He encouraged her to stay at RPAH to study for membership of the Royal Australasian College of Physicians (MRACP), as there was no separate paediatric examination, and Margaret qualified as MRACP in 1965. She immediately began research work with Lorimer Dods at the Children’s Medical Research Foundation (CMRF) and began a lifelong association with the Royal Alexandra Hospital for Children.
The year 1965 was a propitious one to commence a paediatric research career. There was a rubella outbreak in Sydney, which followed epidemics in the United States. The large number of newborns in the US with severe sequelae, such as blindness, deafness and congenital heart disease, together with the isolation of the rubella virus in 1962, galvanised efforts to develop a vaccine to prevent rubella infection. Sydney already had a strong association with rubella. In 1941 ophthalmologist (later Sir) Norman Gregg had noted that mothers of infants with cataract frequently gave a history consistent with rubella (then believed to be no more than a mild illness with rash) during their pregnancy. Thus, Margaret could draw on a cohort of congenital rubella survivors for study, starting with those from 1941.
Her first article on the late sequelae and associations of rubella appeared in The Lancet in 1966, and described “renal artery stenosis in the rubella syndrome”.1 After publishing seven additional articles in The Lancet, including landmarks such as the isolation of the rubella virus from the lens of a child with cataract,2 Margaret, with medical school friend Jill Forrest and husband John Burgess, reported the propensity of congenital rubella survivors to develop diabetes.3 This important article was published in 1971, the year she was awarded her Doctor of Medicine (MD) degree.
During this period of great research productivity, Margaret married endocrinologist John Austin Burgess in 1968, and had given birth to their two sons, Michael (1970) and David (1972). David was delivered at home after an unexpectedly rapid labour while his father was, by his own account, “still looking for the textbook”. Careers for married women, and certainly for those with children, were a novelty in the Australia of the 1960s. For Margaret, time out after the birth of her sons was limited to accumulated leave.
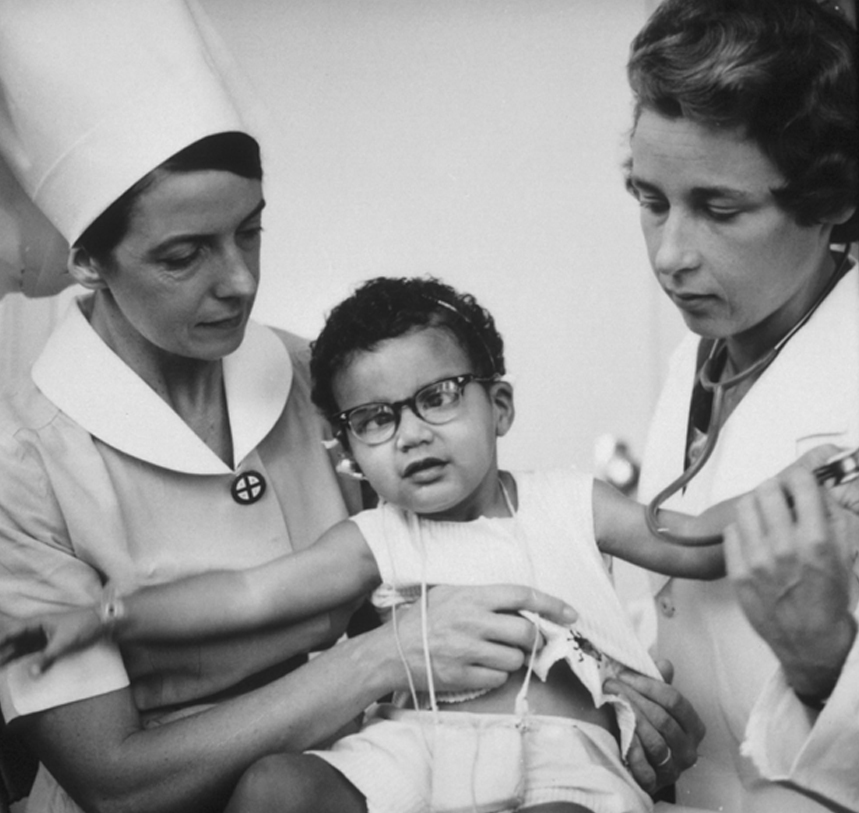
Margaret with a congenital rubella patient at the Royal Alexandra Hospital for Children, 1967.
In 1968, an opportunity arose — which combined Margaret’s awareness of the needs of deaf children through her congenital rubella work and of the needs of professional women — to advocate for a childcare centre at the University of Sydney. The Shepherd Centre for education of the deaf (named after orthopaedic surgeon Bruce Shepherd and his wife Annette who had two deaf children), was being planned, and there was room on the ground floor for a childcare centre. An appointment was arranged to the see the University Registrar, who listened to the four women in the delegation with studied disinterest before declaring “I see no more reason why the University should provide a childcare centre than a petrol station”. This kindled both anger and — in the tradition of Dagmar Berne — a steely determination to overcome the insolence of office. Margaret and her co-conspirators were put in touch with the wife of Vice-Chancellor (Sir) Bruce Williams (who had five daughters) and the childcare centre was born in 1970.
Later in the 1970s, while her children were still young, the next phase of Margaret’s career began — conducting clinical trials of rubella vaccine allied with epidemiological and public health aspects of vaccines and vaccination programs. Her work on the rubella vaccine expanded over the next 30 years to include vaccines against measles, mumps, pertussis, varicella, hepatitis B and rotavirus, to name only some. In 1978, Margaret published a trial of a new rubella vaccine in schoolgirls and seroprevalence studies in The Medical Journal of Australia, and in 1984, she reported the impact of rubella vaccine in Australia in The Lancet,4 all while working on a busy roster in clinical oncology. There were competing approaches to rubella vaccination at the time. Australia, like the United Kingdom, gave rubella vaccine only to girls in early high school whereas the United States gave rubella vaccine to young children. Later, it became apparent that both strategies in both sexes were needed to eliminate the indigenous transmission of rubella, thus minimising risks to the developing fetus.5
Eliminating measles — an even greater challenge than rubella — was tackled through the national Measles Control Campaign (MCC) of 1998, which provided combined measles, mumps and rubella (MMR) vaccine to all Australian primary school children.6 The MCC had been preceded in 1997 by the Immunise Australia Program or “Seven Point Plan”, which had as one of its seven points the establishment of a National Centre for Immunisation Research and Surveillance of Vaccine-Preventable Diseases (NCIRS). Margaret led the successful tender, becoming the founding Director of NCIRS in August 1997 and Professor of Paediatrics and Preventive Medicine at the University of Sydney in 1998. This late recognition reflects the slow ascension of women to higher academic appointments of the time — Margaret had attained the rank of Clinical Associate Professor only in 1992, despite academic achievements many years previously that today would justify full professorial appointment.
As a key component of the bid for the NCIRS, Margaret, in collaboration with Lyn Gilbert at the Institute of Clinical Pathology and Medical Research, proposed the now regular national serosurvey, which examines age-specific prevalence of protective levels of antibodies to vaccine-preventable diseases at a population level. The national serosurvey proved to be a critical component of the evaluation of the MCC, demonstrating its success in increasing population immunity.5 This evidence later underpinned the declaration of elimination of indigenous transmission of measles and rubella in Australia. Margaret’s tenure as Director of NCIRS from 1997 to 2003 coincided with an enormous expansion of immunisation programs in Australia, with national funding for the purchase of vaccines increasing more than tenfold. Margaret played a large role in paving the way for the addition of varicella vaccine (in 2005) and rotavirus vaccine (in 2007) to the National Immunisation Program.
Less well known is Margaret’s vision in drawing attention to the need for strengthened monitoring and reporting of vaccine safety in the 1990s,7 a time when this was not a popular cause. She emphasised the special importance of safety monitoring during national campaigns — groundwork that proved vital when Australia had challenges relating to the safety of vaccines against human papillomavirus in 2007 and influenza in 2010.
Despite (or perhaps aided by) her personal modesty, others have recognised the calibre of Margaret’s achievements. In Australia, she was awarded the Queen Elizabeth II Silver Jubilee Medal for services to the community in 1997 and the Howard Williams Medal of the Royal Australasian College of Physicians in 2006. Internationally, she was invited to join the Strategic Advisory Group of Experts (SAGE) of the World Health Organization’s Department of Vaccines and Biologicals in 2001, and was awarded an Order of Australia in 2003 for her services to public health in Australia and overseas, particularly through providing policy advice to government and research into vaccine-preventable diseases. In his foreword to the NCIRS biennial report in 2006, Sir Gustav Nossal commented that Margaret’s “legacy is evident underlying the productivity of NCIRS through its team spirit, flexibility of work practices and mutual supportiveness, which takes a long time to nurture”.
Perhaps the greatest testimony to Margaret’s personal and professional qualities is the universal regard she engendered in so many who were in positions elevated and humble, academic and at the coalface. Those treated to dinner at their Killara home remember with enormous affection the hospitality and unfailing courtesy of both Margaret and her late husband John, who sadly passed away in 2010. A giant photograph of Margaret and John adorned billboards outside the Chris O’Brien Lighthouse at RPAH during its construction. Margaret is actively engaged in the lives of her twin grand-daughters, Eleanor and Jacqueline, and although steadfastly maintaining she is retired, still reads The Lancet and New England Journal of Medicine every week. She leaves a lasting legacy to the fields of paediatrics, immunisation and public health. As a role model, to borrow the words of Kathryn North, a paediatrician who trained at the Royal Alexandra Hospital for Children and who is now Chair of the National Health and Medical Research Council Research Committee: “Margaret is a fabulous mentor — she leads by example, she listens, she cares. She has been an amazing role model for so many. I want to be just like her when I grow up”.
[Health Policy] The World report on ageing and health: a policy framework for healthy ageing
Although populations around the world are rapidly ageing, evidence that increasing longevity is being accompanied by an extended period of good health is scarce. A coherent and focused public health response that spans multiple sectors and stakeholders is urgently needed. To guide this global response, WHO has released the first World report on ageing and health, reviewing current knowledge and gaps and providing a public health framework for action. The report is built around a redefinition of healthy ageing that centres on the notion of functional ability: the combination of the intrinsic capacity of the individual, relevant environmental characteristics, and the interactions between the individual and these characteristics.
The Port Arthur massacre and the National Firearms Agreement: 20 years on, what are the lessons?
Twenty years after the Port Arthur massacre and the National Firearms Agreement (NFA), it is timely to examine how assertive national firearms regulation has prevented firearm mortality and injuries, and gun lobby claims that mental illness underpins much gun violence.
On 28 April 1996, Martin Bryant, a lone gunman using semi-automatic weapons killed 35 people at Port Arthur, Tasmania. In response, the Australian Prime Minister, John Howard, negotiated strict national gun control laws, banning automatic and semi-automatic rifles and shotguns, and introducing uniform stringent firearms licensing, a waiting period, security and storage requirements, sales regulation, and instituting compulsory buybacks of the banned weapons. Licensing required a proven genuine reason, with prohibition or cancellation for violence, apprehended violence or health reasons. The Commonwealth, states and territories implemented the NFA in 1996 and the National Handgun Control Agreement in 2002 with bipartisan support. In their wake, the national firearms stockpile reduced by one-third and public mass shootings have so far ceased. Although total homicides have declined since 1969, stabbings exceed shootings (more lately increasingly [http://www.aic.gov.au/statistics/homicide/weapon.html]), and hanging may later have substituted for gun suicides, rates of total gun deaths, homicides and suicides have at least doubled their rates of decline, suggesting that comprehensive gun control measures were responsible.1,2 A 2010 evaluation found that the reforms were averting at least 200 deaths per year and saving around $500 million annually.3
Community reactions to maintaining public memorial services after 20 years reveal the massacre’s long-term traumatic impacts. The anniversary highlights disparate issues: remembering forgotten (especially Indigenous) massacres; firearm availability; debatable relationships between mental illness, violence, guns and indiscriminate media reporting; and future actions to support rather than erode public health gains.
Following recent mass shootings in the United States, gun lobbyists claim that mentally ill people cause gun violence (http://www.theguardian.com/world/2012/dec/21/nra-full-statement-lapierre-newtown) whereas gun control advocates, including President Barack Obama, have invoked the Australian model.
The relationship of psychosis or serious mental illness and violence has been thoroughly reviewed elsewhere.4–6 Various methodological considerations (eg, institutional versus community samples, definitions of mental illness, temporal relationship of illness and violence) influence conclusions.5 However, from the US Epidemiologic Catchment Area (ECA) Study in 1990 onward, numerous international population studies have confirmed a modest but significant link between mental disorders and community violence (4% 1-year population-attributable risk [PAR] in the ECA study).4 Risks of violence for psychoses are 2–10% PAR compared with the general community, 20% PAR for personality disorders (including antisocial personality disorder), and 25% PAR for substance misuse.4 Odds are higher for homicide; Australian statewide data- and case-linkage studies indicate that people with schizophrenia perpetrated violence five times more often7 but homicide 13 times more often8 than the general community. Some studies show the relationship to be fully mediated by dispositional, situational and disinhibitory factors, including substance misuse;9 others find that substance misuse attenuates, not cancels, the relationship.7,8 Untreated active psychotic symptoms10 and past violence play key roles. Risk for violence in psychosis and schizophrenia may predate active symptoms or result from active illness or treatment. Developmental difficulties, impulsivity and anger, antisocial behaviours, social disadvantage or subculture, and substance use mediate these risks. High risk groups are generally identifiable and most violent acts should be preventable.6
Such studies confirm that most violent individuals do not have mental illness, and that the vast majority of individuals with mental illness are not violent. They are more likely to be victims not perpetrators of violence.11 Media portrayal of violence by people with mental illness reinforces public perception of their dangerousness, further stigmatising and endangering them.4 Almost half of those who die at the hands of US police have some kind of disability.12 Crucially, mental illness is strongly associated with suicide — with PARs ranging from 47% to 74%.4
Individuals who do not have mental illness perpetrate more than 95% of gun homicides.13 Rather than armed civilians reducing crime and homicide, extensive studies show that US gun availability, household gun ownership and diluting gun laws increase firearm homicide14 and suicide.15 In 27 developed countries, gun ownership strongly and independently predicted firearm homicide and suicide, whereas the predictive capacity of mental illness was of borderline significance.16
Although mass murderers who seize media attention often seem to suffer from psychosis, no research clearly verifies that most are psychotic or even suffering from severe mental illness.17 One recent analysis of mass shootings in the US reported that in 11% of cases, prior evidence of concerns about the shooter’s mental health had been brought to medical, legal or educational attention.18 Reports that 43%19 and 56%20 of US mass killers have serious mental illness may be confounded by primary diagnostic reliance on internet, law database and newspaper searches, an apparent dearth of reliable information about psychopathology and authorities’ knowledge of illness, and complications for retrospective analysis of murder–suicide or “suicide by cop”. Of 130 victims of mass gun killings in Australia and New Zealand from 1987 to 2015, 78% were slain by someone without a known history of mental illness, 88% by someone without a history of violent crime, and 56% by someone legally possessing firearms (http://www.gunpolicy.org/documents/5902-alpers-australia-nz-mass-shootings-1987-2015). Thus, the mass killer is frequently until that moment a law-abiding owner of a lawfully held gun.
Mass murder is an almost exclusively male phenomenon that is frequently planned in advance as retribution for perceived wrongs,17 to vindicate, and to potentially overcome hopelessness and invisibility with instant fame and omnipotent destruction. Many have maladaptive (eg, paranoid, sadistic, narcissistic, antisocial) personality configurations.17 Martin Bryant’s trial judge, relying on four forensic psychiatrists’ reports, noted Bryant was not suffering from mental illness but a personality disorder with limited intellectual and empathic capacities (http://www.geniac.net/portarthur/sentence.htm).
Also critical to vindictive or alcohol (or other drug) related gun violence are precipitating and background factors — situations such as domestic conflict and violence, school or work grudges, toxic social networks, and isolation.17 Whether media reporting of other mass murders primes potential perpetrators with instructions and the above incentives21 requires further investigation.
Firearm suicide, overshadowed in public debate but contributing 77% of total gun deaths in Australia in 2014 (http://www.gunpolicy.org/firearms/region/australia#number_of_gun_suicides), is of especial concern. In Queensland, the firearm suicide rate among people with a current licence far exceeded that of those with no licence.22 General rural suicide rates are roughly twice city rates. Farmers may need guns, but safe storage and removal of the weapons at vulnerable periods of life are vital to prevent suicide.
So 20 years later, what are the lessons?
The NFA, which reduced firearm deaths, particularly suicides but also homicides and mass shootings, mirrors similar benefits of comprehensive gun control measures elsewhere.23 However, prevention of firearm injury and mortality intersects with other pressing public and mental health challenges such as domestic violence and suicide, and therefore needs multidisciplinary coordinated efforts.
Following recent US gun massacres, there have been calls for better resourcing of mental health services to help identify and respond to those at risk and to regulate firearms access.24 Because people with mental illness are not categorically dangerous, and because sensitivity and specificity problems with screening for violence mean that psychiatrists are no better than laypeople or chance at prediction,4 using strategies such as screening mentally ill populations for violence risk is misguided (not to mention costly, burdensome and infringing rights). However, clinicians have a key role in monitoring and assisting regulation of firearm access, especially for high risk populations (eg, children, adolescents, suicidal people, domestic violence victims and perpetrators, farmers and rural residents, police, and security employees). Their work with legal authorities regarding time-sensitive and situation-specific risks needs further exploration.4 Legal measures include penalising alcohol intake around firearm usage; keeping guns from domestic violence and drink-driving offenders; requiring licensed shooters to surrender guns during periods of vulnerability due to anger, threats and suicidality; and a lower threshold for permanent removal of guns and gun licences. Implications for patient confidentiality, the therapeutic alliance and informed consent, also require examination. As with suicide, responsible media reporting should apply to mass violence.
The national weapons stockpile has now returned to pre-1996 levels (http://www.theconversation.com/if-lawful-firearm-owners-cause-most-gun-deaths-what-can-we-do-48567), highlighting the need to maintain and strengthen the national regulatory regime. Complacency has somewhat eroded the NFA. For example, in New South Wales, the pro-gun lobby succeeded in weakening the regulation of pistol clubs — arguably causing at least one homicide.25 NFA opponents hope to overturn the ban on semi-automatic long arms.
The NFA banned semi-automatic rifles and shotguns, but not semi-automatic handguns (pistols), which are permitted for pistol club members. The logic of stringent restrictions on rapid-fire weapons is equally applicable to handguns, which although currently accounting for few gun deaths, are the concealable weapon of choice for criminals. The medical community has long supported bans for semi-automatic handguns. We need a review, revision and tightening of existing laws and more effective restrictions and controls on possession, import and sales of handguns and other firearms, especially via the internet and by illicit imports.
In the US, the National Rifle Association insists it is not guns that kill but only bad and unhinged people (http://www.theguardian.com/world/2012/dec/21/nra-full-statement-lapierre-newtown). Yet evidence suggests that for some people who are indistinguishable within the general public, including some with interpersonal and personality issues, having easy, legal access to guns is lethal, resulting in avoidable excesses of both domestic and mass killings. Clinicians may offer much to firearm risk management yet must remain ambivalent about targeting those with mental illness for gun intervention if this is not complemented by wider gun control measures.4 The campaign to deflect social concern over firearms availability into a debate about whether people with mental illness histories should access such weapons should be exposed as a calculated appeal to prejudice.
How are tobacco smokers using e-cigarettes? Patterns of use, reasons for use and places of purchase in New South Wales
Electronic cigarettes, or e-cigarettes, are battery-powered devices that produce a vapour (often containing nicotine) which the user inhales, simulating the act of cigarette smoking. Invented in 2003,1 their popularity in the United States and Europe has soared over the past decade.2,3 The public health community has divergent views on the role of e-cigarettes in tobacco control. Proponents argue that they could greatly reduce tobacco harm as a smoking cessation aid, and should therefore be widely available and accessible.4,5 Others question their safety and efficacy as a cessation aid, highlighting their unknown long term health effects, and are concerned that e-cigarettes could re-normalise smoking and, through dual use, reduce the motivation of smokers to quit smoking.6,7 The Australian National Health and Medical Research Council (NHMRC) position statement on e-cigarettes recommends that health authorities should “act to minimise harm until evidence of safety, quality and efficacy can be produced”.8
Although there is increasing international evidence about e-cigarette use, Australian data remain scarce. Recent estimates suggest that 30% of tobacco smokers in the US are currently using e-cigarettes,2,9 and 20% in the United Kingdom,10 reflecting widespread marketing in these countries. The most common reason given for using e-cigarettes is as an aid in quitting smoking,9 despite limited evidence about the effectiveness of e-cigarettes as cessation aids,6,11 especially when compared with more extensively studied options.
Data from the International Tobacco Control (ITC) surveys show that e-cigarette use among current and former Australian smokers increased from 0.6% in 2010 to 7% in 2013.12 In 2014, 8.4% of the New South Wales population had tried e-cigarettes and 1.3% were current users, with smokers being more likely than non-smokers to be users.13 There is no evidence to date, however, about which Australian tobacco smokers are using e-cigarettes, why they are using them, or where they are purchasing them. There is an urgent need for reliable local data that can inform the public health debate, assist in policy development, and guide the development of information for consumers and health practitioners.
E-cigarette regulations concern the product itself, the retail environment in which it is sold, its marketing, or the application of smoke-free policies.14 In Australia, there is currently no national regulation of the ingredients of e-cigarette products, with laws relating to poisons and therapeutic goods applying. Nicotine is legally classified as a dangerous poison,15 and each state and territory has local regulations for the sale of such substances (eg, the NSW Poisons and Therapeutic Goods Regulation 2008).16 As e-cigarettes containing nicotine have not yet been approved by the Therapeutic Goods Administration (TGA), their sale is currently illegal in all Australian jurisdictions; only non-nicotine-containing e-cigarettes can be lawfully sold and used. Each Australian state and territory has differing regulations relating to e-cigarette sales, marketing, and use in smoke-free areas. Amendments to the NSW Public Health (Tobacco) Act17 were passed in June 2015 to include bans on retail displays, print advertising, promotions and sponsorships, and to prohibit supplying of e-cigarettes to minors, harmonising the laws covering e-cigarettes with the relevant tobacco legislation.
Our study assessed how adult tobacco smokers and recent quitters in NSW are using e-cigarettes, tracking changes over an 18-month period in 2014–2015, during which there were no specific NSW regulations relating to the sale, promotion, or use of e-cigarettes. We aimed to identify demographic and smoking-related characteristics of e-cigarette users, to ascertain reasons for using e-cigarettes and commonly reported points of purchase.
Methods
Study design and participants
The Cancer Institute Tobacco Tracking Survey (CITTS) is a serial cross-sectional telephone survey, with 40 interviews conducted in NSW each week. The CITTS monitors smoking-related cognitions and behaviours among adult (18 years and older) current tobacco smokers and recent quitters (quit in the past 12 months). Computer-assisted telephone interviews were conducted using a dual-frame survey design incorporating samples generated by random digit dialling to landline and mobile phone numbers (50/50 split). When calling a landline, a random selection procedure was used to recruit participants within households (selecting the nth oldest eligible adult). When calling a mobile phone, the individual answering the call was considered the target for screening. The screening procedure includes questions relating to current and past smoking. Current smokers are defined as those who currently smoke cigarettes, pipes or other tobacco products daily, at least weekly, or less often than weekly. Recent quitters are those who smoked tobacco products in the past 12 months, but who no longer smoke. Analyses for this study were limited to respondents interviewed between January 2014 and June 2015. The study was funded by the Cancer Institute NSW.
E-cigarette use
All respondents were read a description of e-cigarettes and asked, “How often, if at all, do you currently use e-cigarettes?” (response options: daily, weekly, monthly, less than monthly, not at all). E-cigarette use was coded both as a binary variable (no use v any use) and as a three-level variable (no use, infrequent use [monthly or less often], or frequent use [weekly/daily]). E-cigarette users were asked, “What are the main reasons you currently use e-cigarettes?”, with the response options (a) to cut down on the number of cigarettes I smoke; (b) to help me quit cigarettes; (c) they taste better than cigarettes; (d) they are not as bad for your health as cigarettes; (e) they are cheaper than cigarettes; and (f) so I can smoke in places where smoking cigarettes is not allowed. Multiple responses were allowed. There was also an “other” option, for which responses were recorded verbatim and back-coded to the original code-frame if possible. Users were asked where they bought their last e-cigarette cartridge or liquid, with the options (a) tobacconist; (b) internet; (c) convenience store or petrol station; (d) somewhere else.
Covariates
Data on sex, age and education (low = did not complete high school; moderate = high school diploma or vocational college; high = tertiary education) were included. Postcodes were used to code socio-economic status according to the Socio-Economic Indices for Areas (SEIFA) derived at the 2011 census by the Australian Bureau of Statistics;18 quintiles 4–5 were coded as low socio-economic status, quintiles 1–3 as moderate to high socio-economic status. Postcodes were also used to determine metropolitan or non-metropolitan area of residence. Current tobacco smokers were classified as daily or non-daily smokers, and average daily cigarette consumption and time to first cigarette were combined in the validated Heaviness of Smoking Index (HSI) scores.19
Statistical analyses
We tested for an increase in any and in frequent e-cigarette use across the study period using χ2 tests for linear trends in proportions. To investigate differences in e-cigarette use according to demographic and smoking characteristics, we conducted logistic regression analyses predicting any e-cigarette use (v no use), and frequent use (v infrequent use). For each outcome, two analyses were undertaken. The first used the full sample of smokers and quitters, including demographic characteristics and smoking status as predictors (Model 1). The second used the smoker sample only, and included demographic data, smoking frequency, and HSI scores as predictors (Model 2). The results for demographic predictors were the same for Models 1 and 2; we therefore report the results for smoking characteristics from Model 2 only.
We calculated the proportions of the sample who cited each reason for using e-cigarettes, and of the places of purchase mentioned (with 95% confidence intervals). We used χ2 analyses to assess differences in these responses by subgroups found in previous studies to differ in their patterns of use or their reasons for using e-cigarettes: subgroups defined by age, smoking status, and frequency of use.2,10,13,20 In light of the small number of older adult e-cigarette users, age was categorised in these analyses as 18–29 years v 30 years or older.
Stata 11 (StataCorp) was used for all analyses. Statistical significance was defined as P < 0.05 (two-sided), and was adjusted for multiple comparisons in the subgroup analyses using Bonferroni correction. Because of the slight over-representation of men and mid-aged respondents in the CITTS sample compared with the general NSW population,21 weights were constructed for age, sex, and region of residence. Data weights also accounted for a participant’s relative chance of inclusion in the landline or mobile phone sample frame, their chance of selection based on the number of landlines in each household, and the number of in-scope people per household. Weights were applied in logistic regression analyses as p-weights.
Ethics approval
The CITTS is approved by the NSW Population Health Services Research Ethics Committee (reference HREC/10/CIPHS/13).
Results
Over the study period, 283 489 telephone numbers were randomly selected for the survey, 136 392 (48%) were assessed for eligibility (there was no response at the other numbers, or they were non-contactable), and 3345 (2%) of these reached an individual eligible for the study. Of these, 2966 (89%) consented to participate (Box 1).
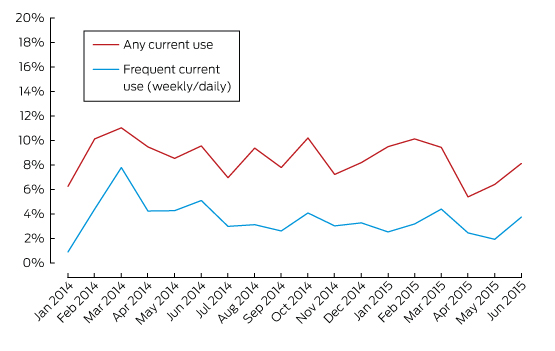
Over the 18 months, 254 respondents reported any current use of e-cigarettes (9% of the sample; 95% CI, 7–10%). Ninety-eight respondents used them less often than monthly, 52 used them monthly, 38 weekly, and 66 daily; that is, infrequent use was more common (57%; 95% CI, 50–64%) than frequent use (43%; 95% CI, 36–49%). Box 2 shows monthly rates of use; trend analyses found no changes in rates of any use (χ2 test for linear trend: P = 0.287) or frequent use (P = 0.130).
Box 3 shows the results of logistic regression analyses predicting e-cigarette use on the basis of demographic and smoking characteristics. Sixteen percent of younger adults (18–29 years) reported being current e-cigarette users; both mid-aged and older adults were less likely to be current users than younger adults (each, P < 0.001). Current smokers were more likely to be users than recent quitters (adjusted odds ratio [aOR], 1.55; P = 0.039). Mid-aged and older users were more likely to be frequent users than younger adults (55 years and older v 18–29 years: aOR, 4.43; P = 0.002), and current smokers were less likely than recent quitters to be frequent users (aOR, 0.38; P = 0.020).
Reasons for using e-cigarettes are shown in Box 4. The most common were “to help me quit smoking” (32%) and “to cut down on the number of cigarettes I smoke” (26%). Frequent users were significantly more likely than infrequent users to report that they used e-cigarettes to help them cut down (P = 0.002). Older users were more likely than younger users to report that they were using e-cigarettes to quit or cut down (each, P < 0.001). Smokers were significantly more likely than quitters to be using e-cigarettes to cut down (P = 0.002). The most common “other” reason for using e-cigarettes was curiosity or novelty (eg, “just to try it”), offered by 18 respondents.
Box 5 summarises responses regarding places of purchase for e-cigarette users’ most recent cartridge or vial. The most common sources were over the internet (29%) and tobacconists (27%), with a small proportion purchasing from convenience stores or petrol stations (8%). A large proportion of respondents did not know from where their last vial came (13%) or named a type of outlet specifically mentioned by less than 2% of respondents (23%). Frequent e-cigarette users were significantly more likely to have purchased over the internet than infrequent users (P < 0.001). There were no significant differences in places of purchase according to age or smoking status.
Discussion
This study is one of the first to explore patterns of e-cigarette use among tobacco smokers and recent quitters in Australia. Current use of e-cigarettes was reported by 9% of the sample, comparable with the 7% reported by the 2013 Australian ITC.12 Despite the fact that e-cigarette companies are currently prohibited from marketing their products as cessation aids (as none are approved by the TGA), the results of this study suggest that tobacco smokers are principally using e-cigarettes to help them quit. Clinicians and cessation services should be aware of smokers’ interest in e-cigarettes as cessation aids; the most recent guidance from the NHMRC encourages consumers to seek further information about e-cigarettes from reliable sources, including their general practitioner.8
Despite the fact that many e-cigarette users reported using them to assist quitting, most users in this sample were dual users, continuing to use conventional cigarettes as well as e-cigarettes. Many reported that they used e-cigarettes to cut down on the number of cigarettes they smoked. For avoiding the risks of smoking-related premature death, however, reducing cigarette numbers is much less effective than quitting,22 and future research should investigate whether tobacco smokers using e-cigarettes to cut down are doing so as part of a cessation strategy or in the hope of reducing smoking-related harm.
In this study, the rate of current e-cigarette use was highest (16%) among people aged 18–29 years. Younger users were more likely than older users to use e-cigarettes infrequently, and they were less likely than older users to use them to help quit or cut down on cigarettes. Future research should monitor patterns of use in this group to determine whether patterns of dual use persist, or if e-cigarettes have a role to play in cessation by young tobacco smokers.
In NSW, e-cigarettes are not currently covered by the Smoke-free Environment Act 2000.23 Concern has been expressed by some commentators that using e-cigarettes in smoke-free public places might diminish the impact of smoke-free policies on smoking rates by reducing the incentive for smokers to quit and by re-normalising smoking.7 In our study, about 10% of e-cigarette users reported that they used them to circumvent smoking restrictions in public places. Future research should monitor e-cigarette use in smoke-free environments, as well any impact this has on smokers’ quitting motivations.
The current study provides the first evidence about places where Australian tobacco smokers purchase their e-cigarettes. Infrequent users were more likely than frequent users to have obtained e-cigarettes in commonly visited retail environments, such as tobacconists or small retailers. There were no restrictions on the display and promotion of e-cigarettes in those retail environments at the time of this study, but recently passed amendments to the NSW Public Health (Tobacco) Act17 include such a ban. Investigating changes in how smokers purchase and use e-cigarettes following the implementation of this policy will be important. Frequent users were more likely than infrequent users to purchase e-cigarettes over the internet. An increase in internet advertising for e-cigarettes has been noted,24 but the extent to which Australian smokers are exposed to these advertisements — and their impact on beliefs about and the use of e-cigarettes — is still unknown. The large proportion of users purchasing their e-cigarettes online means that they have access to an almost unrestricted market. Although e-cigarettes sold in Australia cannot legally contain nicotine, the availability of nicotine-containing e-cigarettes online poses a complex challenge for enforcing supply regulations, making initiatives focused on educating consumers particularly important.
This study did not assess whether individuals were using nicotine-containing e-cigarettes; ITC data show that 21% of Australian e-cigarette users did not know whether their brand contained nicotine or not.12 Future research on e-cigarette use in Australia should explore whether patterns of use and reasons for using nicotine- and non-nicotine-containing e-cigarettes differ. It should be noted that no data were collected on whether some smokers transitioned from using e-cigarettes to smoking tobacco, another pattern that should be monitored in an Australian sample. The e-cigarette users in this study were likely to reflect the prevalence of e-cigarette use in this community, but the low overall prevalence limited our ability to undertake some subgroup analyses.
Strengths of this study include our use of recent data, with a large and representative sample of tobacco smokers and recent quitters. The inclusion of mobile phones in the sampling method helped minimise concerns about sampling bias. This study expands the knowledge base provided by a recent report from NSW13 by monitoring changes in e-cigarette use over an 18-month period, including data on e-cigarette use among recent quitters. This delivers detailed data on the frequency of e-cigarette use among users, and we explored reasons for using e-cigarettes as well as places of purchase.
Although overall use of e-cigarettes in NSW remains low, this study highlights problems related to higher rates of use among younger people, dual use of e-cigarettes and tobacco, and the use of e-cigarettes to cut down or quit tobacco cigarettes. The use of e-cigarettes by tobacco smokers attempting to reduce harm means that physicians, cessation services and public health authorities should be aware of tobacco smokers’ interest in e-cigarettes for harm reduction, inform smokers that e-cigarettes are currently unregulated and untested as cessation aids,8 and continue to provide evidence-based recommendations to smokers wanting to quit.
Box 1 –
Characteristics of the 2966 participants in the Cancer Institute Tobacco Tracking Survey (CITTS), January 2014 – June 2015
|
|
Number (unweighted) |
Percentage (weighted*) |
|||||||||||||
|
|
|||||||||||||||
|
Sex |
|
|
|||||||||||||
|
Women |
1324 |
51% |
|||||||||||||
|
Men |
1642 |
49% |
|||||||||||||
|
Age |
|
|
|||||||||||||
|
18–29 years |
638 |
22% |
|||||||||||||
|
30–55 years |
1391 |
44% |
|||||||||||||
|
≥ 55 years |
937 |
34% |
|||||||||||||
|
Education |
|
|
|||||||||||||
|
Low |
743 |
26% |
|||||||||||||
|
Moderate |
1467 |
50% |
|||||||||||||
|
High |
726 |
24% |
|||||||||||||
|
Region |
|
|
|||||||||||||
|
Non-metropolitan |
1182 |
39% |
|||||||||||||
|
Metropolitan |
1784 |
61% |
|||||||||||||
|
Socio-economic status |
|
|
|||||||||||||
|
Low |
1015 |
35% |
|||||||||||||
|
Moderate or high |
1951 |
65% |
|||||||||||||
|
Smoking Status |
|
|
|||||||||||||
|
Recent quitter |
524 |
18% |
|||||||||||||
|
Current smoker |
2442 |
82% |
|||||||||||||
|
Smoking frequency† |
|
|
|||||||||||||
|
Less than daily |
335 |
13% |
|||||||||||||
|
Daily |
2107 |
87% |
|||||||||||||
|
Heaviness of Smoking Index score† |
|
|
|||||||||||||
|
Low |
791 |
33% |
|||||||||||||
|
Moderate |
1021 |
44% |
|||||||||||||
|
High |
561 |
24% |
|||||||||||||
|
|
|||||||||||||||
|
* Percentages are weighted for telephone status, age, sex, and regional residence. † Indicator available only for smokers. |
|||||||||||||||
Box 2 –
Prevalence of e-cigarette use among 2966 participants in the Cancer Institute Tobacco Tracking Survey (CITTS), in New South Wales, January 2014 – June 2015 (tobacco smokers and quitters)
Box 3 –
Patterns of e-cigarette use and results of multivariable logistic regression analyses predicting any use and frequent use
|
|
Current e-cigarette use (n = 2947) |
Frequency of use (n = 254) |
|||||||||||||
|
No use |
Any use |
aOR (95% CI) |
P |
Infrequent |
Frequent |
aOR (95% CI) |
P |
||||||||
|
|
|||||||||||||||
|
Total number |
2693 |
254 |
|
|
150 |
104 |
|
|
|||||||
|
Sex |
|
|
|
|
|
|
|
|
|||||||
|
Women |
93% |
7% |
1 |
|
55% |
45% |
1 |
|
|||||||
|
Men |
90% |
10% |
1.22 (0.91–1.64) |
0.185 |
60% |
40% |
0.90 (0.50–1.61) |
0.719 |
|||||||
|
Age |
|
|
|
|
|
|
|
|
|||||||
|
18–29 years |
84% |
16% |
1 |
|
70% |
30% |
1 |
|
|||||||
|
30–55 years |
92% |
8% |
0.48 (0.35–0.66) |
< 0.001 |
54% |
46% |
1.92 (0.99–3.71) |
0.053 |
|||||||
|
≥ 55 years |
96% |
4% |
0.24 (0.16–0.36) |
< 0.001 |
35% |
65% |
4.43 (1.69–11.62) |
0.002 |
|||||||
|
Education |
|
|
|
|
|
|
|
|
|||||||
|
Low |
93% |
7% |
1 |
|
56% |
44% |
1 |
|
|||||||
|
Moderate |
91% |
9% |
1.02 (0.70–1.50) |
0.903 |
59% |
41% |
1.13 (0.43–2.98) |
0.809 |
|||||||
|
High |
90% |
10% |
1.21 (0.78–1.87) |
0.399 |
56% |
44% |
1.16 (0.40–3.35) |
0.784 |
|||||||
|
Region |
|
|
|
|
|
|
|
|
|||||||
|
Non-metropolitan |
93% |
7% |
1 |
|
57% |
43% |
1 |
|
|||||||
|
Metropolitan |
91% |
9% |
1.32 (0.97–1.81) |
0.078 |
58% |
42% |
0.81 (0.41–1.60) |
0.546 |
|||||||
|
Socio-economic status |
|
|
|
|
|
|
|
|
|||||||
|
Low |
91% |
9% |
1 |
|
59% |
41% |
1 |
|
|||||||
|
Moderate or high |
92% |
8% |
0.78 (0.57–1.06) |
0.109 |
56% |
44% |
1.25 (0.67–2.33) |
0.484 |
|||||||
|
Smoking status |
|
|
|
|
|
|
|
|
|||||||
|
Recent quitter |
93% |
7% |
1 |
|
35% |
65% |
1 |
|
|||||||
|
Current smoker |
91% |
9% |
1.55 (1.02–2.36) |
0.039 |
61% |
39% |
0.38 (0.16–0.86) |
0.020 |
|||||||
|
Smoking frequency* |
|
|
|
|
|
|
|
|
|||||||
|
Less than daily |
89% |
11% |
1 |
|
81% |
19% |
1 |
|
|||||||
|
Daily |
91% |
9% |
1.14 (0.71–1.83) |
0.586 |
57% |
43% |
2.31 (0.79–6.75) |
0.125 |
|||||||
|
Heaviness of Smoking Index score* |
|
|
|
|
|
|
|
|
|||||||
|
Low |
90% |
10% |
1 |
|
63% |
37% |
1 |
|
|||||||
|
Moderate |
91% |
9% |
1.19 (0.79–1.77) |
0.404 |
60% |
40% |
0.79 (0.35–1.76) |
0.561 |
|||||||
|
High |
94% |
6% |
0.83 (0.51–1.34) |
0.442 |
54% |
46% |
1.02 (0.40–2.59) |
0.970 |
|||||||
|
|
|||||||||||||||
|
aOR = adjusted odds ratio. Multivariable logistic regression Model 1 included demographic factors (sex, age, education, socio-economic status) and smoking status; Model 2 also included smoking frequency and Heaviness of Smoking Index score. * Results from Model 2 for the smoker sample only; all other results are for Model 1. |
|||||||||||||||
Box 4 –
Reasons for using e-cigarettes given by 218 tobacco smokers and 36 recent quitters in New South Wales
|
|
To help me quit smoking |
To cut down on the number of cigarettes I smoke |
Not as bad for your health as cigarettes |
So I can smoke where smoking cigarettes is not allowed |
Taste better than cigarettes |
Cheaper than cigarettes |
|||||||||
|
|
|||||||||||||||
|
Total (n = 254) |
32% (26–39%) |
26% (21–33%) |
20% (15–26%) |
11% (8–16%) |
7% (4–12%) |
8% (5–13%) |
|||||||||
|
Frequency of use |
|
|
|
|
|
|
|||||||||
|
Infrequent (n = 150) |
28% (21– 37%) |
19% (13–27%) |
20% (14–28%) |
15% (10–21%) |
9% (5–15%) |
10% (6–17%) |
|||||||||
|
Frequent (n = 104) |
37% (28–48%) |
36% (27–47%) |
20% (13–30%) |
7% (3–15%) |
5% (2–12%) |
6% (3–12%) |
|||||||||
|
P (χ2 test) |
0.088 |
0.002 |
0.525 |
0.060 |
0.141 |
0.170 |
|||||||||
|
Age |
|
|
|
|
|
|
|||||||||
|
18–29 years (n = 99) |
18% (11–28%) |
14% (9–23%) |
25% (17–36%) |
14% (8–23%) |
13% (7–22%) |
9% (4–16%) |
|||||||||
|
30–54 years (n = 155) |
42% (34–50%) |
35% (27–43%) |
16% (11–23%) |
10% (6–16%) |
3% (1–9%) |
8% (4–14%) |
|||||||||
|
P (χ2 test) |
< 0.001 |
< 0.001 |
3.49 (0.045) |
0.229 |
0.005 |
0.486 |
|||||||||
|
Smoking status |
|
|
|
|
|
|
|||||||||
|
Recent quitter (n = 36) |
36% (21–54%) |
6% (2–18%) |
36% (20–56%) |
7% (1–27%) |
12% (4–33%) |
15% (6–32%) |
|||||||||
|
Smoker (n = 218) |
32% (25–39%) |
30% (23–37%) |
17% (13–23%) |
12% (8–17%) |
6% (4–11%) |
7% (4–12%) |
|||||||||
|
P (χ2 test) |
0.397 |
0.002 |
0.018 |
0.233 |
0.214 |
0.116 |
|||||||||
|
|
|||||||||||||||
|
Percentages are weighted for telephony status, age, sex, and regional residence; 95% CIs are given in parentheses. Bonferroni-adjusted P < 0.003 defined as statistically significant. |
|||||||||||||||
Box 5 –
Places of purchase for e-cigarette liquids and vials for e-cigarette users in New South Wales
|
|
Tobacconist |
Internet |
Convenience store or petrol station |
Other or “don’t know” |
|||||||||||
|
|
|||||||||||||||
|
Total (n = 254) |
27% (22–33%) |
29% (23–35%) |
8% (5–12%) |
23% (18–29%) |
|||||||||||
|
Frequency of use |
|
|
|
|
|||||||||||
|
Infrequent (n = 150) |
27% (20–35%) |
17% (12–25%) |
12% (7–19%) |
24% (18–32%) |
|||||||||||
|
Frequent (n = 104) |
28% (19–38%) |
44% (33–54%) |
3% (1–7%) |
21% (14–31%) |
|||||||||||
|
P (χ2 test) |
0.480 |
< 0.001 |
0.006 |
0.356 |
|||||||||||
|
Age |
|
|
|
|
|||||||||||
|
18–29 years (n = 99) |
28% (19–38%) |
23% (14–34%) |
11% (6–19%) |
24% (16–34%) |
|||||||||||
|
30–54 years (n = 155) |
27% (20–35%) |
33% (25–41%) |
6% (3–11%) |
22% (16–30%) |
|||||||||||
|
P (χ2 test) |
0.508 |
0.070 |
0.124 |
0.435 |
|||||||||||
|
Smoking status |
|
|
|
|
|||||||||||
|
Recent quitter (n = 36) |
27% (14–45%) |
29% (5–47%) |
8% (2–27%) |
19% (9–36%) |
|||||||||||
|
Smoker (n = 218) |
27% (21–34%) |
29% (22–36%) |
8% (5–12%) |
23% (18–30%) |
|||||||||||
|
P (χ2 test) |
0.584 |
0.517 |
0.514 |
0.345 |
|||||||||||
|
|
|||||||||||||||
|
Percentages are weighted for telephony status, age, sex, and regional residence; 95% CIs are given in parentheses. Bonferroni-adjusted P < 0.004 defined as statistically significant. |
|||||||||||||||
E-cigarettes should be regulated
They pose many risks for tobacco control and health, and any possible benefits are few and uncertain
As reported in this issue of the MJA,1 Australia, with the world’s lowest rates of smoking among adults2 and adolescents,3 is seeing nascent, modest growth in e-cigarette use, despite having some of the strongest restrictions on their marketing and sales. Manufacturers, now including all major tobacco corporations, have spent large sums publicising their brands, using tactics that have promoted cigarettes so successfully, but boosted by the added reach of the internet. They are ahead of the regulatory curve, adopting imagery, messages and tactics prohibited in cigarette promotions, such as the sponsorship of youth events.4 They have spiced their products with a bewildering array of flavourings that in many countries would be illegal in cigarettes, and have garnered vocal support from those who see any restriction on the use of e-cigarettes by governments as a threat to individual freedom. Some aspects of these developments are, however, surprising.
The first is that, despite intensive marketing, the use of e-cigarettes in some countries now seems to be plateauing,5 suggesting that their much vaunted appeal for smokers and the talk of mass migration to e-cigarettes has been exaggerated.
The second is the naive embrace of the e-cigarette and tobacco industries by some in tobacco control. Public Health England extensively promoted a message that e-cigarettes were “95% safer” than combustible cigarettes,6 a claim based not on empirical evidence but upon a single reference to a meeting7 that was attended by researchers who were mostly known supporters of e-cigarettes, and partially funded by an organisation with links to the tobacco industry.8,9
This is despite hundreds of articles documenting the malfeasance of the tobacco industry, as recognised in the World Health Organization Framework Convention on Tobacco Control, which explicitly advises against engagement with the industry. Some of those investigating e-cigarettes are even receiving funding from tobacco manufacturers, now seeking to represent themselves as “part of the solution”10 while continuing their concerted opposition to measures effective in tobacco control.
In Australia, anyone considering importing or supplying e-cigarettes as a cessation aid must submit an application to the Therapeutic Goods Administration (TGA) with evidence of their safety and efficacy.11 The TGA then considers the evidence before determining whether the product may be sold, and, if so, under what conditions. The TGA website notes that “no assessment of electronic cigarettes has been undertaken and, therefore, the quality and safety of electronic cigarettes is not known”. Further, nicotine is, appropriately, classified as a poison except when formulated in low doses in some smoking cessation products (or when supplied in tobacco, an historical anomaly common to all countries). Recent research has identified the role of nicotine in promoting angiogenesis and thus the spread of tumours,12 and the risks it poses to adolescent brain development.13 Further, there have been several reports about the use of e-cigarette liquids in suicide attempts.14,15
These and other concerns about safety were reviewed in detail by Pisinger and Døssing16 in an article that, remarkably, was not cited in the Public Health England review of the evidence about e-cigarettes, despite being published in a leading international journal. The authors concluded that there was no such thing as a standard e-cigarette, so that studies on one brand could not be extrapolated to others. They reported that many studies have found evidence that the inhaled products contained harmful substances, some of which do not occur in tobacco smoke, while the levels of substances common to both were found to vary wildly, and in some cases were higher than in tobacco smoke.
For a product promoted by some as a game-changer in quitting smoking, it has been remarkably difficult to obtain evidence that e-cigarettes are any more effective than unassisted cessation or conventional nicotine replacement therapy.17 A Cochrane review reported the evidence as being of “low/very low quality”,18 and a recent meta-analysis concluded that they, in fact, reduced the probability of quitting.19 In these circumstances, it seems prudent to adopt the precautionary principle and to carefully monitor emerging evidence on their safety and cessation efficacy, the uptake of vaping and smoking by young people, and any further relevant developments.20
E-cigarettes have at least two distinct roles. The first is as products that may assist in smoking cessation, with possible but as yet unproven benefits that surpass those of existing methods. Second, they are a means for the tobacco industry to circumvent restrictions on promoting both their image and their tobacco products. This dual role implies the need for parallel regulatory tracks. The first involves the application of existing provisions for the authorisation, marketing (eg, claims regarding effectiveness as quitting aids) and sales of therapeutic goods. The second involves applying existing controls on all promotions that may encourage smoking, including exposure of children and young people to advertising and other forms of promotion and to any other use of smoking or tobacco-related imagery.
This twin-track approach offers a means for evaluating and maximising any potential benefits while minimising risks of harm. In the meantime, Australian governments and health authorities should not be distracted from existing approaches to reducing smoking, which are bringing such encouraging results.
To screen for depression or not?
Screening may be appropriate to reconsider once we can ensure adequate response to any identified potential cases
Depression presents a significant public health challenge for both the community and the medical profession. In Australia, depression and anxiety affect a substantial proportion of the population (4.8% of men and 10% of women) and is responsible for 8% of the total loss in disability-adjusted life years.1 It is the top-ranking cause of non-fatal disease in the Australian community for women,2 and is also associated with an increased risk of ischaemic heart disease and suicide, both causes of early death.
Depressive disorders present diagnostic challenges, not least because in some cases depression is the first presentation of bipolar disorder. Further, treatment may be complicated and limited owing to the symptomatic heterogeneity of depression; complex comorbidities with anxiety, substance abuse, physical health problems or other factors; and the ongoing stigma that hinders many individuals from openly discussing their mood problems. As a result, rates of detection, diagnosis based on clinical presentation, and sufficient intervention remain inadequate. Indeed, a recent meta-analysis from the United Kingdom suggests that the diagnosis was only correct in 47% of cases presenting in primary care.3 This does not account for those cases that fail to present in the first place, supporting calls to consider widespread screening for depression, especially in primary care settings where the majority of depressive disorders are treated. But is screening for depression in primary care a useful and viable option?
In January 2016, the United States Preventive Services Task Force published its latest recommendation statement in relation to screening for depression in adults.4 The statement recommended that sufficiently reliable self-report tools are now available to make screening for depression feasible and reliable in primary care. The task force further opined that screening leads to accurate diagnosis and treatment in this setting. Clearly, the latter component is critical to render screening valuable, and the authors drew heavily on the developing evidence around models of collaborative care and depression care management.5,6 The task force recommended use of the Patient Health Questionnaire-9 (PHQ-9), but as noted in an accompanying editorial,7 the statement acknowledged that the positive predictive value of the PHQ-9 is only 50%, and that it cannot be considered a replacement for appropriate clinical assessment. In other words, screening is important but it cannot be relied upon.
The idea of screening-led prevention and early intervention is inherently attractive. Within Australia, efforts thus far have focused on high-risk groups such as pregnant or perinatal women and Aboriginal and Torres Strait Islander populations.8,9 However, a pragmatic perspective that acknowledges the limitations of current mental health service delivery for broader treatment of depression would also have to recognise that international evidence for broad primary care population screening is mixed.
After several years of research and development, the Royal Australian and New Zealand College of Psychiatrists clinical practice guidelines for mood disorders were released in late 2015.10 The guidelines conceptualise both depression and bipolar disorder along a spectrum with considerable overlap, and discuss in detail the diagnosis and management of both conditions. The guidelines do not specifically recommend screening in primary care or other settings. This is because self-assessment via the internet and other self-report screening measures is likely to raise concerns but not necessarily identify those who need help or ensure that they seek proper advice. Once suspicion of depression has been raised by a clinician, the use of a standardised psychiatric measure is preferable but the question remains as to whether general practitioners should initially use their clinical judgement or a screening tool to identify depressive illness. To this end, they can be equipped with measures that corroborate key symptoms but reliance should never rest solely on self-report measures.
Historically, depression has been underdiagnosed, and the stigma of its incidence remains a challenge to encouraging patients to access treatment. We can anticipate increased capacity for the treatment of depression in the new world of integrated mental health service delivery promised in the Australian government’s response to the National Mental Health Commission review of mental health programs and services. The stepped care model has the potential to provide optimal support for people with a major depressive disorder. Once these initiatives are established and further data have been gathered as to their suitability and appeal, perhaps then it will be time to revisit the recommendations regarding screening. However, at this point in time there does not appear to be sufficient evidence of pragmatic value to warrant the burden that implementation and continuous screening for depression in primary care would impose.
5th case of Legionnaires identified in Sydney
Two more people have been diagnosed with the potentially deadly Legionnaires’ disease after another outbreak was announced last week.
The men in their 40s and 50s were in the CBD at the same time as the other three patients identified.
The original cases included two women and an elderly man. A woman in her 30s is still in a critical condition in hospital.
According to the director of the NSW Health Communicable Diseases Branch, Dr Vicky Sheppeard, five cooling towers have tested positive to legionella however it’s possible that the actual source of the outbreak won’t be found as they may have already cleaned the building prior to authorities gaining access.
Related: Legionnaires strikes Sydney again
“We’ve already taken regulatory action against those five towers and ordered cleaning and disinfection,” Dr Sheppeard said. “We don’t believe there is an ongoing risk in the city of Sydney.”
The five people all spent time in the area of the city bordered by Market, George, King and Kent streets since Anzac Day.
Legionnaires is an infection of the lungs (pneumonia) that is caused by bacteria of the Legionella family which is caused by when a person breathes in the affected bacteria. Legionnaires disease most often affects middle-aged and older people, those who are heavy smokers or who have a chronic lung disease. People with suppressed immunity are also more at risk.
Latest news:
[Perspectives] Maria Neira: no limits to public health
In the league table of all-embracing job titles, Maria Neira’s at WHO in Geneva is hard to beat: Director of the Department of Public Health and the Environmental and Social Determinants of Health. As if to underline the extent of this role she also adopts a broad working definition of the term environment: “all that is not me”. But does she not feel overwhelmed by the literally global scope of this brief? She laughs. “Yes, a little bit. But it’s all so connected. If you love public health there are no limits.”