A set of Sustainable Development Goals (SDGs) was adopted by the UN General Assembly in September, 2015. The Arab world, alongside other regions, has problems of poverty, poor health, and substantial environmental degradation—ie, the kind of problems that the SDGs aim to address.1–5 Evidence of persistent infectious disease in low-income and middle-income Arab countries exists, alongside increased prevalence of non-communicable diseases in all Arab countries,6,7 high out-of-pocket health expenditure,8 poor access to safe water, as well as violent conflict, persistent foreign interventions, and high levels of social and political fragmentation that result in weak health systems and diminished rights to health.
Preference: Public and Environmental Health
964
No strong evidence bicycle helmet legislation deters cycling
A focus on helmet legislation detracts from concerns about cycling infrastructure and safety
Opponents of helmet legislation often argue that mandatory bicycle helmet legislation (MHL) is the primary impediment to an increase in cycling.1 The public debate regarding MHL recently flared up with the Leyonhjelm Senate inquiry2 and the Australian Capital Territory proposing a relaxation of their MHL in low speed areas.3 As there are numerous health and social benefits to cycling, such arguments need to be evaluated with rigour against the highest quality evidence available.
Victoria was the first jurisdiction in the world to adopt MHL in July 1990. Other Australian states and territories adopted similar legislation by July 1992. Around this time, the governments of New South Wales, Queensland, South Australia, Victoria and Western Australia commissioned research to assess the impact of their state-specific laws on helmet wearing.4–8 In SA and WA, stratified random sampling surveys were employed to estimate cycling frequencies before and after the introduction of MHL.6,8 The results of these surveys suggest that there was no real impact on cycling frequencies following MHL (Box 1). Cycling frequencies were not estimated for NSW, Queensland or Victoria.
Recent evidence suggests that active travel modes (ie, walking, cycling and public transportation) steadily declined following World War II because more Australians used cars as their primary transportation mode.9 In a 2011 survey regarding barriers to cycling, over 50% of the responses from current cyclists and non-cyclists related to lack of cycling infrastructure and concerns about safety (Box 2).10 Dislike of helmets constituted only 6% of the responses for both groups and was the tenth and 13th most cited response among cyclists and non-cyclists respectively. Yet, MHL is sometimes proposed as a major barrier to cycling.11
Complex study designs, such as the stratified random samples discussed above, are essential for estimating cycling frequencies to ensure that the sample is representative of the population. Stratified random sampling surveys have long been used in countries with an entrenched cycling culture, such as the Netherlands,12 and also recently in Australia since 2011 through the National Cycling Participation Survey conducted by Australian Bicycle Council (http://www.bicyclecouncil.com.au/publication/national-cycling-participation-survey-2015). There is a lack of international evidence using such methods to support the case that MHL acts as a deterrent to cycling. A Canadian study, in which participants were randomly identified from three sampling frames with elements of stratification and clustering, found no evidence that MHL deters cycling.13
Although complex survey designs are important for obtaining reliable data, they also require many resources and are not always feasible. On the other hand, convenience sampling often requires fewer resources, making it attractive for some studies. However, the cost of convenience is a biased sample. In NSW and Victoria, convenience sampling was used to collect data at various roadside locations in each state over one time period before the introduction of MHL and multiple time periods after its introduction. In addition to bias from convenience sampling, these studies were designed to estimate helmet wearing not cycling frequency. Nonetheless, some authors have used the cyclist counts from these surveys to demonstrate a reduction in the number of cyclists following the introduction of helmet legislation. There is an argument that convenience samples taken over time are representative of population trends; however, such an argument involves many assumptions that are almost always violated.14
In summary, there are reports indicating a decline in cycling based on convenience sampling data following the introduction of helmet legislation in Australia. However, there is also evidence based on better quality data which shows no significant impact on cycling participation. When faced with conflicting evidence, it is important to consider differences in study design and data quality. When these parameters are taken into account, the best evidence suggests that MHL has never been a major barrier to cycling in Australia. In addition, the focus on helmet legislation detracts from more important discussions around the uptake of cycling. These include concerns for personal safety, which can be addressed by the construction of dedicated cycling infrastructure,15 education of all road users, and supportive legislation to protect cyclists, such as minimum passing distances.16
Box 1 –
Frequency of cycling before and after the introduction of helmet legislation in South Australia and Western Australia, according to stratified random sampling surveys6,8
|
|
Frequency |
1990 |
1993 |
||||||||||||
|
|
|
1989 |
1993 |
||||||||||||
|
|
|||||||||||||||
|
South Australia |
At least weekly |
21.8% |
21.0% |
||||||||||||
|
At least monthly |
5.2% |
6.0% |
|||||||||||||
|
At least every 3 months |
3.9% |
4.4% |
|||||||||||||
|
Less often or never |
69.1% |
68.6% |
|||||||||||||
|
Western Australia |
At least weekly |
26.6% |
27.7% |
||||||||||||
|
At least every 3 months |
11.1% |
11.6% |
|||||||||||||
|
At least once per year |
10.3% |
11.5% |
|||||||||||||
|
Never |
52.0% |
49.2% |
|||||||||||||
|
|
|||||||||||||||
|
|
|||||||||||||||
Box 2 –
Percentage of responses for reasons for not riding a bike for transport more frequently (current cyclists) or for transport (non-cyclists), 2011*
|
Response category |
Current cyclists (n = 158/386) |
Non-cyclists (n = 515/1289) |
|||||||||||||
|
|
|||||||||||||||
|
Lack of infrastructure† |
30.6% |
25.0% |
|||||||||||||
|
Concerns about safety‡ |
27.7% |
25.8% |
|||||||||||||
|
Uncontrollable issues§ |
26.9% |
24.4% |
|||||||||||||
|
Do not like wearing a helmet |
6.5% |
6.3% |
|||||||||||||
|
Miscellaneous¶ |
8.3% |
18.6% |
|||||||||||||
|
|
|||||||||||||||
|
* Adapted with permission from the National Heart Foundation of Australia (numbers of respondents/responses).10 † Speed/volume of traffic, lack of bicycle lanes/trails, no place to park/store bicycle, no place to change/shower, nowhere to store clothes. ‡ Unsafe road conditions, do not feel safe riding, do not feel confident riding. § Weather conditions, destinations too far away, too hilly, not enough time, health problems. ¶ Not fit enough, none, unsure of best route, other, do not own a bicycle, need to transport other people (eg, children), do not know how to ride a bike. |
|||||||||||||||
[Seminar] Schizophrenia
Schizophrenia is a complex, heterogeneous behavioural and cognitive syndrome that seems to originate from disruption of brain development caused by genetic or environmental factors, or both. Dysfunction of dopaminergic neurotransmission contributes to the genesis of psychotic symptoms, but evidence also points to a widespread and variable involvement of other brain areas and circuits. Disturbances of synaptic function might underlie abnormalities of neuronal connectivity that possibly involves interneurons, but the precise nature, location, and timing of these events are uncertain.
Are Indigenous mortality gaps closing: how to tell, and when?
Lags between policy and outcomes mean it is important to have good metrics and the right expectations about timelines
It is well known that the health of Australia’s Aboriginal and Torres Strait Islander people is considerably poorer than that of their non-Indigenous counterparts.1 Strategies, policies, programs and funding over many years have been targeted toward improving the health of Indigenous Australians and closing the gap in health status between Indigenous and non-Indigenous Australians. In this article, we review trends in key mortality rates for both populations and two complementary indices of the gap between them, both of which are essential to understanding progress or otherwise in closing the mortality gaps. Importantly, we also discuss the time required until the impact of policy changes can be assessed.
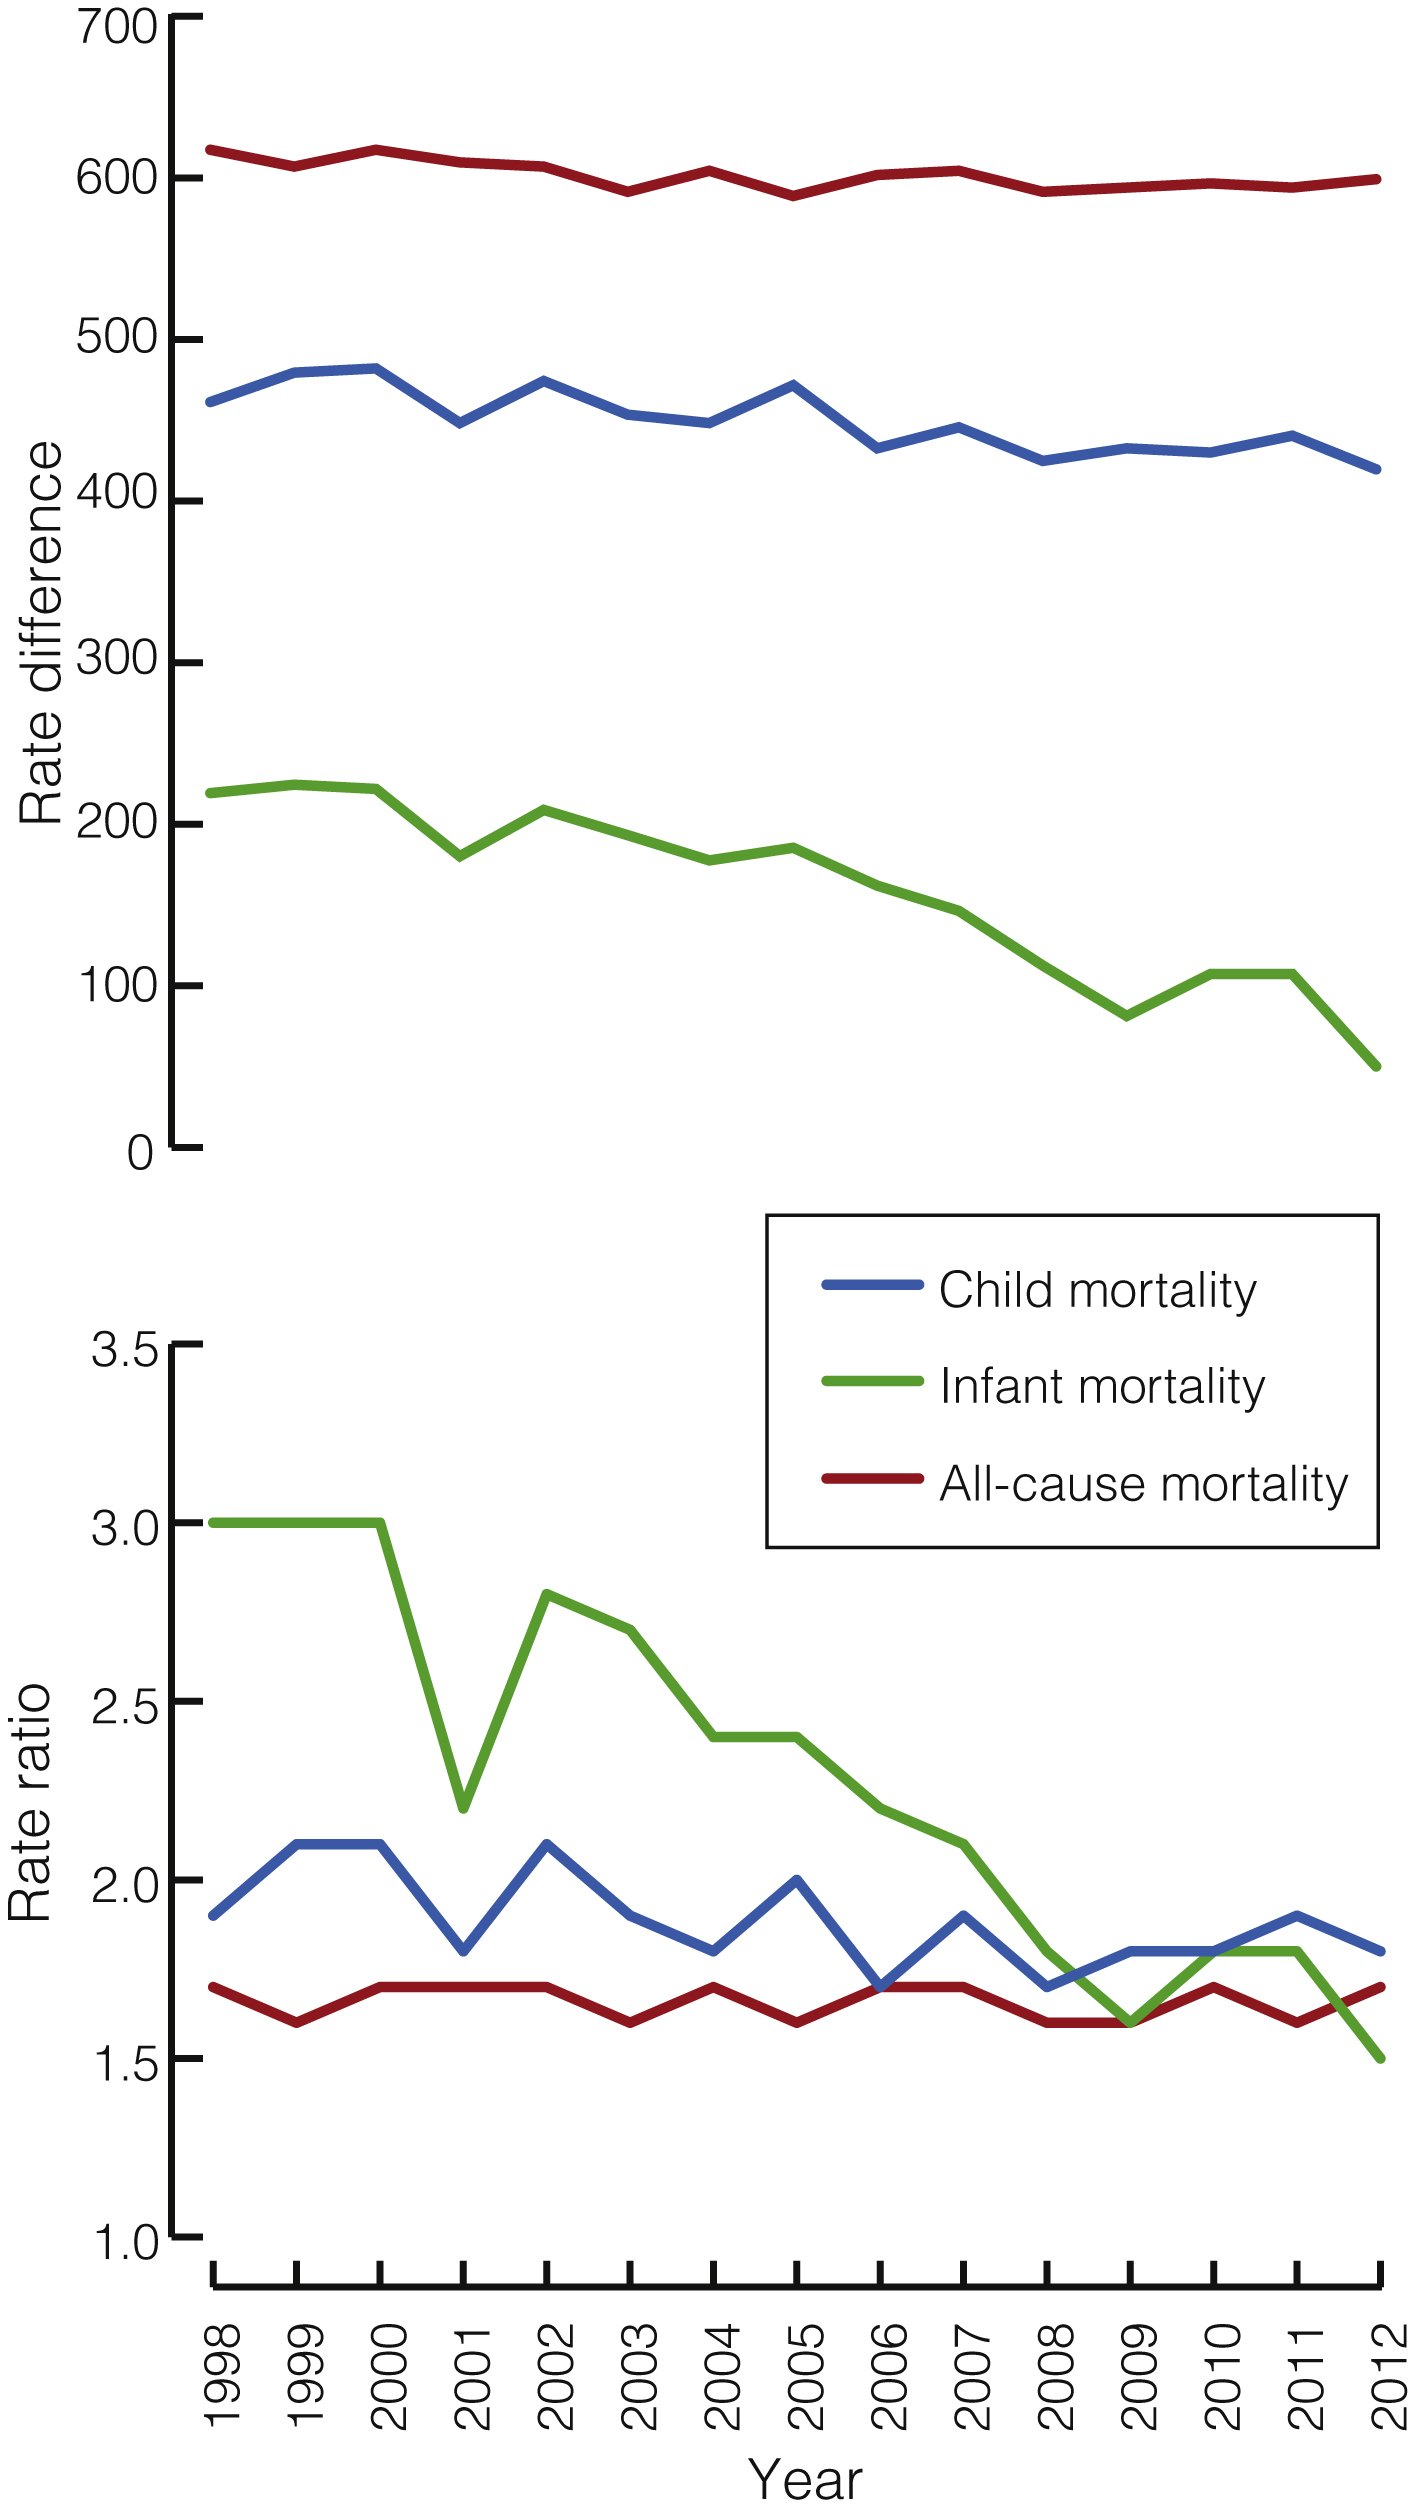
Measures of “the gap”
An understanding of changes in mortality over time requires: (i) graphing the non-Indigenous and Indigenous rates to see whether they are declining, remaining stable or increasing; (ii) showing trends in the rate difference (obtained by subtracting the non-Indigenous rate from the Indigenous rate) to indicate movement in the absolute size of the difference and the magnitude of improvement required for the gap to close; and (iii) showing trends in the rate ratio (obtained by dividing the Indigenous rate by the non-Indigenous rate) to indicate whether the relative rate of improvement in Indigenous mortality is faster than for non-Indigenous mortality — the fundamental requirement for the “gap” to finally close.
Are the gaps closing?
Analysis of data from the Aboriginal and Torres Strait Islander Health Performance Framework 2014 report shows that the overall difference in death rates between Indigenous and non-Indigenous Australians during 2008 to 2012 was 389 deaths per 100 000, with a rate ratio of 1.7.2 The Box shows rate differences and rate ratios for mortality from all causes, child mortality and infant mortality among Indigenous and non-Indigenous Australians from 1998 to 2012.
There have been significant declines in the all-cause mortality rate for both Indigenous and non-Indigenous Australians from 1998 to 2012 (of 13.2 and 7.5 deaths per 100 000 per year respectively; both P < 0.001). The rate difference also declined significantly, by 5.8 deaths per 100 000 per year (P = 0.004). The rate ratio, however, did not decline significantly (P = 0.62), with Indigenous rates remaining about 70% higher than non-Indigenous rates throughout the period.
For cardiovascular disease, there have been significant declines in the mortality rate for both Indigenous and non-Indigenous Australians (of 12.3 and 7.7 deaths per 100 000 per year respectively; both P < 0.001). The rate difference also declined significantly, by 4.6 deaths per 100 000 per year (P < 0.001), but the rate ratio, although showing a slight downward trend, did not decline significantly (P = 0.64).
For cancer, there was a significant decline in the mortality rate for non-Indigenous Australians (of 1.3 deaths per 100 000 per year; P = 0.009) but a significant increase in the Indigenous mortality rate (of 2.1 deaths per 100 000 per year; P < 0.001). The rate difference therefore widened significantly by 3.4 deaths per 100 000 per year (P < 0.001). The rate ratio also increased significantly (by 0.02 per year; P < 0.001).
For child mortality, there was a significant decrease in the mortality rate for both Indigenous and non-Indigenous children (of 5.5 and 2.1 deaths per 100 000 per year respectively; both P < 0.001), a significant decrease in the rate difference (by 3.4 deaths per 100 000 per year; P < 0.001) and a small but significant decrease in the rate ratio (by 0.02 per year; P = 0.03).
Most childhood deaths (around 80%) occur in the first year of life.1 Between 1998 and 2012, Indigenous infant mortality rates declined more quickly than non-Indigenous rates (0.7 and 0.1 deaths per 1000 live births per year respectively; both P < 0.001), and so the gap is closing. In 2012 Indigenous infant mortality was 5.0 per 1000 live births, compared with 3.3 for non-Indigenous infant mortality, a gap of 1.7 deaths per 1000 live births. The rate ratio in 2012 was 1.5.
The rate difference and rate ratio provide different but complimentary perspectives on changes in the gap over time. When the Indigenous rate is much higher, a larger (in absolute terms) reduction in the Indigenous rate is required to achieve the same proportionate reduction as an equivalent relative change in the non-Indigenous rate. This means that the rate difference can decline while the rate ratio remains relatively constant, as with cardiovascular disease.
Should the gaps be closing yet?
A wide range of strategies, policies and programs aimed at improving Indigenous health have been implemented over many years, from the establishment of Aboriginal health units in several states in the late 1960s and the initiation of the first Aboriginal Medical Service in Redfern in 1971, to the development of a National Aboriginal Health Strategy in the late 1980s, the establishment of the Healthy for Life program in the mid-2000s, through to the Closing the Gap targets on life expectancy and childhood mortality set by the Council of Australian Government (COAG) in 2008, and beyond. With any policy, however, there is a lead time between when the policy is announced and when it is fully implemented through programs and interventions on the ground. Significant lead and lag times can occur between:
-
the policy announcement and the full implementation of the program;
-
program implementation and improvements in health;
-
improvements in health and the consequent reduction in mortality; and
-
when a death occurs and the data become available.
An analysis of the expected length of time required to implement programs designed to promote maternal and child health, the resultant improvements in birth outcomes and infant and child health, the consequent reduction in child mortality and the availability of data to confirm this reduction estimated there would be a lag of about 10 years between implementation of a program and the ability to measure its effects.3 A number of intermediate measures that are available in shorter time frames can be used to indicate whether or not infant and child health are improving. These include the take up of antenatal care programs, the prevalence of smoking and alcohol use during pregnancy, breastfeeding and vaccination rates, the incidence of low birth weight, pre-term births and infant and childhood disease, and neonatal and infant mortality.3
The mortality outcomes shown in this article are at least in part the result of policies and programs implemented many years ago. It is likely that the added effect of the COAG child and maternal health initiatives announced in 2008 will not show up in mortality data until around 2018, which will be available for reporting in 2020.
Similarly, it is likely that the additional effects of the COAG smoking initiatives announced in 2008 might be assessed from changes in smoking rates from 2014 onwards, measured in national survey data collected in the financial year 2017–18, with consequent reductions in smoking-related cardiovascular and respiratory mortality from 2018 onwards, reported from 2020 onwards. The much longer lag times for lung cancer could mean that the first effects of the COAG smoking initiatives on cancer mortality may not be seen until 2030.
Implications
Australian governments have made major commitments to tackling critical areas in Indigenous health to close the health gap between Indigenous and non-Indigenous Australians. While changes to these indicators cannot be attributed to the policy context alone, ongoing monitoring of relevant indicators and the size of the gap, and assessment of whether it is changing over time, is required to further inform policy and program direction.
The different perspectives of the rate ratio and the rate difference provide useful information regarding whether the gap is closing. The rate ratio assesses the relative rates of improvement for Indigenous and non-Indigenous populations, while the rate difference provides information about the size of the task to be achieved. Both measures, set in the context of the observed rates, provide information on the closing or widening of the health gap. For all measures apart from cancer, the rate differences are declining significantly, but for the gaps to ultimately close, improvements in Indigenous rates need to occur significantly faster than in the non-Indigenous population, as is happening for infant mortality and, to a much lesser degree, for child mortality.
The changes in mortality rates we describe reflect, at least in part, the cumulative effects of many years of policies and programs aimed at improving Indigenous health, and were occurring before the effects of the Closing the Gap initiatives had sufficient time to appear in currently available data. At this stage it is too early to see whether the health gaps are closing because of the added effect of the Closing the Gap programs. Lags between policy decisions, the implementation of programs and policies aimed at reducing the gap, the effects on risk factors and health-related outcomes, and the availability of data to monitor these outcomes mean that the additional impact on mortality of the Closing the Gap agenda and related initiatives will not be able to be assessed until 2018 onwards.
Towards an integrated model for child and family services in central Australia
An innovative model for the delivery of child and family services
The Central Australian Aboriginal Congress is a large Aboriginal community-controlled health service based in Alice Springs in the Northern Territory. Since the 1970s, Congress has developed a comprehensive model of primary health care delivering evidence-based services on a foundation of cultural appropriateness.
In recent years, the community-elected Congress Board has focused on improving the developmental outcomes of Aboriginal children. This has led to the development of an innovative model for the delivery of child and family services, based on the belief that the best way to “close the gap” is to make sure it is not created in the first place.
Early childhood development
It is well established that social and environmental influences in early childhood shape health and wellbeing outcomes across the life course. Adverse childhood experiences are correlated with a wide range of physical health problems and with increased levels of depression, suicide attempts, sexually transmitted infections, smoking and alcoholism.1
The pathways for these effects are complex; however, we know that during the first few years of life, the interactions between genetics, environment and experience have a dramatic impact on brain development. During this critical period, children need stimulation and positive relationships with caregivers to develop the neural systems crucial for adult functioning.2
This evidence indicates that we should not wait to intervene until a child is ready for school at around 5 years of age. By this stage, children have passed many developmental gateways for language acquisition, self-regulation and cognitive function, and their developmental trajectories are set. Of course, developmentally challenged children must be provided with appropriate services during their school years and later in life, but such interventions require increasing amounts of resources (Box 1)3 and produce diminishing returns as the child gets older.4
Governments and policy makers have now widely recognised the importance of investing in the early years.5 The Organisation for Economic Co-operation and Development has advised that investing in early childhood is the most important measure that Australia can take to grow the economy and be competitive in the future.6
Successful programs
There are well evidenced programs for young children and their families that significantly improve health, educational and social outcomes throughout the life course, and which are highly cost-effective compared with later interventions (or with doing nothing, which is the most expensive option).
Congress has taken particular interest in two preventive programs that have been successfully implemented in disadvantaged communities overseas. These are the Nurse–Family Partnership (NFP) and the Abecedarian approach to educational day care. Both programs work with caregivers and children before developmental problems arise, providing children with the stimulation, quality relationships and access to the services they need for healthy development.
The NFP is a program of nurse home visitation which begins during pregnancy and continues until the child’s second birthday. Pioneered in the work of Olds and colleagues,7 trained nurses use a structured program to address personal and child health, quality of caregiving for the infant, maternal life course development and social support. Special attention is given to establishing a safe, nurturing and enriched parent–infant relationship. Over many years of working with low income, socially disadvantaged families in the United States, the NFP has achieved improvements in women’s prenatal health8 and reductions in child abuse and neglect, maternal use of welfare, substance misuse, and contact with the criminal justice system.9 Children who participated in the program showed long term benefits, such as reduced antisocial behaviour and substance misuse during young adulthood.10
The Abecedarian approach provides a centre-based preventive program for children who are at high risk of developmental delay. It has three main elements — learning games, conversational reading and enriched caregiving — with a priority on language acquisition. The approach has been rigorously evaluated, and longitudinal studies that followed children into adulthood found that participants did better at school; gained more years of education; had better employment outcomes;4 showed reduced rates of smoking, drug use and teen pregnancies and led a more active lifestyle.11 There is also evidence of a significantly lower prevalence of risk factors for cardiovascular and metabolic disease for participants (particularly men) when they reach their mid-30s.12 These effects work against the social gradient, with children from more disadvantaged environments benefitting the most,13 which makes the approach a potentially powerful contributor to social equity.
The situation in central Australia
While the cultures and histories of Aboriginal communities in central Australia make them unique, they share many characteristics with communities in which these programs have been effective.
In particular, many Aboriginal children in and around Alice Springs grow up in an environment marked by poverty, substance misuse and lack of responsive care, with low levels of formal education and school attendance coupled with economic marginalisation and social exclusion.
This is reflected in figures from the Australian Early Development Census (AEDC), which show that by the time they start school, 43% of Indigenous children in the Alice Springs region are vulnerable on two or more of five developmental domains. This is six times the rate for non-Indigenous children (7%) (NT AEDC Manager, Early Childhood Education and Care, NT Department of Education, personal communication, 1 April 2016).
Responding to the developmental needs of Aboriginal children
The Congress integrated model for child and family services is the culmination of its efforts to develop an innovative service response to these challenges based on the best available evidence (Box 2).The key elements of the model include nurse home visitation through the Australian Nursing Family Partnership Program (ANFPP); the Preschool Readiness Program (PRP); the Healthy Kids Clinic; family support services, such as Targeted Family Support and Intensive Family Support; and the Child Health Outreach Program. Congress also runs a childcare centre.
As part of this model, Congress has delivered two short-term programs drawing on the Abecedarian approach. The first was an intensive intervention run through the PRP in 2011 and 2012.14 In the second, Congress is collaborating with the University of Melbourne to assess the impact of a limited implementation of the Abecedarian approach with children attending the Congress childcare centre.
The importance of integration
The Congress model is founded on a long term population health approach that is expected to deliver results in health and wellbeing across the life course. Integration of services under a single provider is the key to achieving this potentially transformative change, enabling children and families to be referred seamlessly to the services that best meet their needs. Such integration is now recognised as a crucial reform needed to increase the cost-effectiveness of services and improve access and outcomes for children and their families.15
The advantages of the Congress integrated model are that:
-
it supports a consistent approach to screening, allowing children and families to be referred to the programs that best meet their needs;
-
it allows internal efficiencies between programs to enhance services, thus making a better use of available resources;
-
it is built on the existing relationships that Congress has with Aboriginal families in Alice Springs through the delivery of culturally appropriate primary health care;
-
it allows a common evidence-based approach, modified to meet the cultural and social needs of our clients;
-
it may provide secondary gains for other health programs (eg, working with client families on healthy lifestyles or addiction problems); and
-
it encourages partnerships with researchers to evaluate progress and with other service providers for follow-up of clients.
Promising early results
This integrated model for child and family services may take many years to show all its benefits. Nevertheless, the early signs are promising.
While maintaining engagement with any disadvantaged population is a challenge, the ANFPP shows a high level of client acceptance, largely due to the inclusion of Aboriginal community workers alongside the nurses. This is reflected in good retention rates: the attrition rate before the child reaches 1 year of age is 44.1%, lower than in the overseas implementations where it is 49.5%. Moreover, a preliminary analysis shows an infant mortality rate of 8.3 per 1000 live births for the 240 infants whose mothers have been on the Congress program, which compares favourably with the NT rate of 13.7 infant deaths per 1000 live births. While these small numbers must be interpreted with caution, they are consistent with the reductions in infant mortality demonstrated in randomised control trials in the US.16
The PRP, which incorporated the Abecedarian approach, also showed positive results even with a limited program delivery. This included developmental gains in expressive language and social skills,17 higher preschool attendance rates and improvements in confidence and school readiness.15
While the data from the collaboration between Congress and the University of Melbourne to implement the Abecedarian approach at the Congress childcare centre are not yet available for publication, an early analysis suggests that they will also show significant benefits in children’s language acquisition and attention.
Conclusions
The integrated model implemented by Congress is already yielding some important lessons on addressing early childhood development in Aboriginal Australia.
First, there is a need for an evidence-based approach adapted to local social and cultural conditions. This requires fidelity to the original program design allied with the local knowledge that Aboriginal community-controlled health services such as Congress have built up over the years. We contrast this approach of responsible innovation with reckless innovation, which ignores what has already been achieved and proceeds on the basis of little or no evidence.
Second, there are the benefits of integrated solutions before school age being provided through the primary health care sector where possible. It is this sector which, through its delivery of antenatal and perinatal care, establishes supportive relationships with mothers, families and children in the period from conception to 3 years of age. Thereafter, the education sector should continue to take responsibility for preschool and primary education.
Box 1 –
Rates of return for human capital investment for disadvantaged children
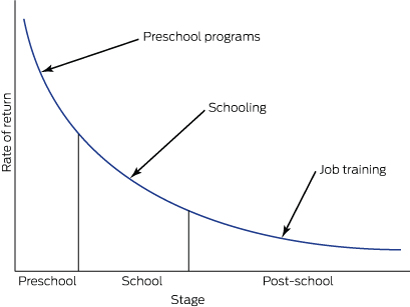
Modified from Heckman and Masterov3
Box 2 –
Central Australian Aboriginal Congress integrated model for child and family services
|
|
Description |
Primary prevention* |
Secondary prevention† |
||||||||||||
|
Child focus |
Carer focus |
Child focus |
Carer focus |
||||||||||||
|
|
|||||||||||||||
|
Centre based |
Most work is done at a centre where a child or families come in to access service |
Abecedarian educational day care; immunisations; child health checks; developmental screening |
Health advice to parents in clinic (eg, nutrition, brushing teeth, toilet training) |
Child-centred play therapy; therapeutic day care; Preschool Readiness Program; antibiotics |
Filial therapy; circle of security; parenting advice/programs; parent support groups |
||||||||||
|
Home visitation |
Most work is done in the homes of families where staff outreach to children and families |
Mobile play groups |
Nurse home visitation; families as first teachers (home visiting learning activities) |
Child Health Outreach Program; ear mopping |
Targeted Family Support; Intensive Family Support; case management models for children at risk; Parents under Pressure |
||||||||||
|
|
|||||||||||||||
|
* The primary prevention targets children with no current problems, but who are at risk of developing them — the identified risk is usually based on low socio-economic status or maternal education level. † The secondary prevention targets children with current problems identified early in life when they are most likely to respond to intervention and before the problems get worse — it is determined by screening or referral to services. |
|||||||||||||||
Kimberley suicide rate highest in the world
There needs to be more innovative approaches to preventing suicide in Indigenous populations, experts say, with suicide rates in the Kimberley region among the highest in the world.
A report in the Medical Journal of Australia found that there were 125 suicides in the region between 2005 and 2014. 102 of those were Indigenous people.
“As the Kimberley Indigenous population was 13 918 at the 2011 census, this equates to an age adjusted suicide rate of 74 per 100 000 per year in this population,” the authors wrote.
Most of those people were male and less than 30 years old. 70% were not known by the district’s mental health service.
There were 476 Indigenous people who presented with deliberate self-harm or suicidal intention in 2014.
Related: Coping with patient suicide
The authors wrote that collective trauma and ongoing socio-economic deprivation were the drivers of high self-harm and suicide rates.
In an article in MJA InSight, Suicide prevention researcher and director of humanitarian projects at the Institute of Social Justice and Human Rights, Mr Gerry Georgatos said that a Royal Commission was needed into this “catastrophic humanitarian crisis”.
“A royal commission can shift the national consciousness, educate the nation as to the underlying issues while also smashing myths and stereotypes. [This] has the strongest prospect of galvanising the ways forward,” he said.
One of the authors of the MJA paper, Dr Murray Chapman, told MJA InSight that local communities need to be able to develop their own services based on their needs.
“It’s about empowerment and capacity building in communities – as opposed to imposing on the communities,” he said.
Latest news:
Time for a shift in focus to improve food affordability for remote customers
People living in remote communities in Australia pay the highest average prices in the nation for food, and this affects their access to healthy food and drink. Affordability continues to decline, with an increasing gap in food prices between remote stores and urban supermarkets,1 probably associated with deals between supermarkets and manufacturers.
The price differences between remote stores and urban supermarkets are published annually for a small range of products in the Northern Territory, and less frequently in some other states. We recently published information on the price differences for a larger range of foods commonly purchased in remote NT communities, and found that the greatest proportion of food spending is for packaged groceries.2 Packaged, fresh, healthier and less healthy categories of foods were all more expensive in remote stores than in urban supermarkets. Packaged products as a category were considerably more expensive; the price difference (67%) was almost twice that for fresh products (36%). The differences for packaged groceries were lower if prices were compared with non-discounted prices in urban supermarkets, indicating the role that promotional pricing plays in driving food prices.2 Further analysis using our original methods and based on a modified star rating system3 found that the average price difference between remote stores and urban supermarkets for healthier products was 47%; this was a significant disparity, although lower than that for less healthy products (74%). This is especially important for remote store customers, as in our study 74% of healthier products were packaged.2
Factors considered to drive high food prices in remote stores include small community size, transport costs, and store management practices.4 We propose that it is time to add to these discussions the cost of food to the store itself. The Australian Competition and Consumer Commission drew attention to the challenge for independent supermarkets in competing with major supermarkets on packaged grocery prices.5 Our study suggests that remote stores are also less able to compete with urban supermarkets on the price of packaged groceries.2
To close the Indigenous health gap, part of the solution must be to close the food price gap. A multifaceted approach is needed. Strategies to improve the affordability of healthier foods must be expanded to include the relationship of manufacturers and wholesalers with remote stores. Solutions need to be bold and innovative, and are more likely to fit a corporate responsibility model than a commercially driven one. Supporting Indigenous communities has made it onto the agenda of Big Food in Australia.6 Genuine community benefit can be achieved by bringing manufacturers and wholesalers into the picture. This could include manufacturers offering promotional deals to remote stores on healthier packaged grocery products similar to those offered to urban supermarkets, and wholesalers leading initiatives for better pricing of healthier packaged grocery products for remote stores. Unless the price inequity is redressed by reducing the cost of food to the store, or there are dramatic increases in income for remote Indigenous Australians, food affordability will continue to affect their access to healthy food and drink.
Estimating eligibility for lung cancer screening in an Australian cohort, including the effect of spirometry
Lung cancer causes more deaths than any other cancer, and is a leading cause of disease-related burden in Australia.1 The United States National Lung Screening Trial (NLST) showed that screening high risk current and former smokers for lung cancer with low dose chest computed tomography (LDCT) can significantly reduce lung cancer mortality.2 LDCT lung cancer screening is recommended in the US for eligible individuals.3
Unlike other cancer screening programs that select participants according to the risk factors of age and sex, eligibility for lung cancer screening is more complex. The current US screening criteria, as defined by the US Preventive Service Task Force (USPSTF), are that current or former smokers are eligible if they are aged 55–80 years, have a smoking history of at least 30 pack-years, and, if a former smoker, have quit less than 15 years ago.3 However, this approach is not necessarily the most efficient for identifying those who may benefit from screening.4 Using probabilistic multivariate lung cancer risk prediction models to select individuals for screening may improve overall efficiency and cost-effectiveness, and are recommended by international organisations.5–7
The PLCOm2012 lung cancer risk model was developed during the US Prostate, Lung, Colorectal, Ovarian Screening (PLCO) Trial, and has been validated in the NLST cohort.8 This model uses data on age, smoking status, duration and intensity, family history, body mass index (BMI), and comorbidities (including self-reported chronic obstructive pulmonary disease [COPD], chronic bronchitis and emphysema) to estimate an individual’s risk of developing lung cancer within 6 years.8 A PLCOm2012 lung cancer risk of greater than 1.5% has been proposed as an alternative lung cancer screening eligibility criterion.9
COPD is an independent risk factor for the development of lung cancer, and self-reported, doctor-diagnosed COPD and chronic bronchitis or emphysema are included in the PLCOm2012 risk prediction model (but not in the USPSTF eligibility criteria).8 There are, however, significant differences in the proportions of individuals who report a diagnosis of COPD, who have symptoms consistent with COPD, or who have airflow obstruction detectable by spirometry.10 Including airflow obstruction improves the accuracy of a lung cancer risk prediction that does not incorporate self-reported COPD.11 Incorporating spirometry results into eligibility assessment for lung cancer screening has been suggested, but the impact of adding spirometry-defined COPD to the existing eligibility criteria of self-reported COPD or symptoms consistent with COPD is not known.12
In Australia, about 2.2 million people aged 55–75 years are current or former smokers, but the proportion of those eligible for lung cancer screening, using either USPSTF or PLCOm2012 criteria, is unknown.13 Estimating the proportion of people eligible for lung cancer screening will both aid policy makers when planning future capacity and assessing infrastructure requirements, and help estimate screening participation rates.
The aims of this study were to estimate the proportion of an Australian cohort that is eligible for lung cancer screening, and to examine the utility of including spirometry-defined COPD as part of screening eligibility assessment.
Methods
The Busselton Healthy Ageing Study (BHAS) is a cross-sectional study of adults born between 1946 and 1964 who live in the Busselton Shire of Western Australia.14 Participants were recruited sequentially at random between 2010 and 2013 from the electoral roll; the participation rate was greater than 80% of contacted individuals. Participants completed a self-administered questionnaire and physical assessments, including spirometry. The upper age limit of participants included in our study (68 years) was determined by the BHAS design.
Smoking status, duration and intensity were self-reported. Ever-smokers responded positively to “Have you ever smoked cigarettes?” Current smokers responded positively to “Do you currently smoke manufactured or hand-rolled cigarettes?”, and former smokers responded negatively. Pack-years of smoking were determined by multiplying the duration of smoking in years by the number of 20-cigarette packs smoked each day. Personal history of any cancer other than non-melanomatotic skin cancer, family history of lung cancer, and other demographic information were self-reported.
BMI was calculated from the measured height and weight. Pre- and post-bronchodilator forced expiratory volume in one second (FEV1) and forced vital capacity (FVC) were measured using an EasyOne spirometer (NDD Medical Technologies) before and after administration of 200 μg of inhaled salbutamol with a metered dose inhaler and spacer. Participants were asked to withhold any bronchodilator medication, if possible, for 12 hours before testing.
Individuals were excluded from the analysis if they had a history of lung cancer, if BMI or demographic data were missing, or there was insufficient data on smoking duration or intensity to calculate the number of pack-years.
Lung cancer risk was calculated with the PLCOm2012 6-year lung cancer risk prediction model.8 For the purposes of this model, COPD was defined in three ways:
-
self-reported, doctor-diagnosed COPD, defined as a positive response to “Has your doctor ever told you that you had COPD?”;
-
symptoms consistent with COPD, defined as a positive response to “Do you cough on most days for as much as 3 months each year?” or “Do you bring up phlegm from your chest on most days for as much as 3 months each year?” or “Has your chest made a wheezing or whistling sound in the last 12 months?”; and
-
spirometry-defined COPD, defined by the presence of post-bronchodilator airflow obstruction (FEV1/FVC ratio < 0.7), excluding those with more than 12% improvement in FEV1 or FVC after bronchodilator medication.
Eligibility for lung cancer screening was based on two criteria: the current USPSTF recommendation3 and a PLCOm2012 6-year lung cancer risk of > 1.5%, as recommended by Tammemägi and colleagues.8 To estimate the proportion of the Australian population who are eligible for screening, an estimate of 2.2 million Australians aged 55–75 years who are current or former smokers13 was multiplied by our estimate of the proportion of potentially eligible ever-smokers in the Busselton population according to USPSTF criteria.
Statistical analyses were performed in SPSS 22 (IBM); 95% confidence intervals for proportions were calculated using continuity adjustment. Comparisons of the proportions of independent and dependent samples were performed with χ2 and McNemar tests respectively. Independent sample t tests compared the means of independent samples. Statistical significance was defined as P < 0.05.
Ethics approval
The BHAS and the reported study received human research ethics approval from the University of Western Australia Human Research Ethics Committee (references RA/4/A/2203, RA/4/1/7891).
Results
Of all 3586 BHAS participants aged 50–68 years, 1903 (53.1%) were current or former smokers. Of these ever-smokers, 36 were excluded (16 had incomplete smoking information, 15 reported smoking less than one cigarette per day, one had prior lung cancer, and demographic or BMI data were missing for four), leaving 1867 participants for the analysis. In the 55–68-year-old age group, 1260 (49.9%) were ever-smokers (including 240 [6.7%] current smokers), 1241 (49.2%) were never-smokers, and 22 (0.9%) had incomplete smoking data.
The demographic details of all BHAS ever-smokers in two age groups, 50–68 years and 55–68 years, are summarised in Box 1. The 55–68-year-old age group was selected as corresponding to the age cohort currently eligible for lung cancer screening in the US.
Eligibility for lung cancer screening
Of ever-smokers aged 55–68 years, 254 (20.1%; 95% CI, 17.9–22.3%) would be eligible for screening according to USPSTF criteria. Using the PLCOm2012 criteria with self-reported COPD, fewer people (225, 17.9%) would be eligible (95% CI, 15.8–20.0%; P = 0.004).
The proportion of ever-smokers eligible for screening increased with age in the PLCOm2012 model, but was stable when using USPSTF criteria (Box 2). Of the entire age-defined cohort, 2.6% would be eligible using PLCOm2012 criteria but not according to USPSTF criteria, and 4.9% would be eligible using USPSTF criteria but not PLCOm2012 criteria; 15.2% would be eligible according to both criteria sets (Box 3). This suggests that about 450 000 individuals in Australia may be eligible for lung cancer screening.
Effect of COPD definition on lung cancer risk and eligibility
Of the ever-smokers in the BHAS population, 1191 had concurrent spirometry, of whom 782 were aged 55–68 years. Using the PLCOm2012 criteria, the proportion eligible for screening was 16.4% (using self-reported COPD), 18.8% (symptoms consistent with COPD), or 17.5% (airflow obstruction on spirometry) (Box 4). Fewer people were eligible for screening using self-reported than spirometry-defined COPD (P < 0.01); there was no statistical difference between the proportions of eligible participants when spirometry-defined or symptom-defined COPD was used (P = 0.06). When spirometry-defined COPD was added to symptom-defined COPD to determine PLCOm2012 risk, an additional seven participants (0.9%) would have been eligible for screening. If normal spirometry was used to exclude COPD in those who reported symptoms of COPD, 17 participants (2.1%) would be deemed ineligible for screening.
Of the 409 ever-smokers aged 50–55 years (and therefore ineligible for screening according to current criteria) with spirometry data, 18 (4.4%; 95% CI, 2.8–6.9%), 36 (8.8%; 95% CI, 6.4–11.9%) or 25 (6.1%; 95% CI, 4.2–8.9%) would have been eligible based on a PLCOm2012 risk greater than 1.5% when COPD was defined by doctor diagnosis, symptoms, or spirometry respectively.
Discussion
Our study suggests that 17.9% (PLCOm2012) to 20.1% (USPSTF criteria) of current or former smokers aged 55–68 years in Busselton would be eligible for lung cancer screening, corresponding to 8.9% (PLCOm2012) and 10% (USPSTF) of all those in the BHAS cohort aged 55–68 years. This is the first time that the proportion of ever-smokers eligible for lung cancer screening has been estimated in an Australian population. While small studies have shown the feasibility of lung cancer screening in Australia, significant hurdles remain before screening is endorsed locally.15–18
Our finding that the USPSTF criteria identified a higher proportion of eligible individuals than the PLCOm2012 criteria is consistent with previous reports.9 Our study could not validate the predictive performance of each criterion because mature lung cancer outcomes were not available. Retrospective studies suggest that the PLCOm2012 model performs better than the USPSTF criteria in identifying high risk individuals, but prospective impact analyses in screening cohorts are required to determine which eligibility criteria should be preferred in the Australian context.
There have been four previous estimates of the proportion of the US population who would be eligible for screening (Box 5).9,19–21 Three of these studies estimated that 18.8–24.4% of ever-smokers and 10.5–14.3% of all individuals in the respective age cohorts were eligible for screening according to USPSTF criteria.19–21 These estimates are broadly comparable with our estimates of the proportion of eligible individuals in the BHAS. On the other hand, fewer BHAS ever-smokers would be eligible for screening than estimated for the PLCO intervention arm ever-smokers (17.9% v 34.6%; P < 0.001).9 This observation may partly be explained by differences in tobacco exposure between the cohorts; the proportion of current and former smokers were similar, but BHAS participants reported lower smoking intensity (mean pack-years, BHAS v PLCO: current smokers, 32.1 v 40.8, P < 0.001; former smokers, 17.8 v 25.8; P < 0.001).22
There are two possible explanations for the lower smoking intensity in the BHAS cohort. The first relates to historical trends in smoking. Enrolment for the PLCO trial occurred between 1993 and 2001, whereas BHAS enrolment commenced in 2010.14,23 Smoking consumption in Australia declined significantly between 2001 and 2010 among both men and women.24 The second explanation is a potential healthy community effect after repeated cross-sectional health surveys in the Busselton community since 1966.14
The current study has highlighted the known challenges in defining and diagnosing COPD. Only 1% of 55–68-year-old BHAS ever-smokers reported being diagnosed with COPD, whereas 13.8% met the spirometric definition of COPD and 35.0% reported symptoms consistent with the disease. A similar discrepancy was previously described in a larger Australian study.10 Airflow obstruction on spirometry is not only crucial to diagnosing COPD, but is an independent predictor of increased lung cancer incidence in screening studies, and may predict overdiagnosis.12 Incorporating spirometry into screening eligibility assessment has been suggested, but this would require direct patient contact.12 Our results suggest that performing spirometry is unlikely to meaningfully improve the identification of eligible individuals, with just one additional individual from every 100 ever-smokers assessed becoming eligible. We therefore contend that, in the absence of more epidemiological data comparing the relative lung cancer risks associated with airflow obstruction and with symptoms or self-reported COPD, defining COPD on the basis of symptoms is an appropriate surrogate measure for spirometry.
Policy makers in jurisdictions that recommend population-based cancer screening, such as Australia, are faced by significant implementation challenges.15,25 No state or federal database contains the necessary data for directly identifying the estimated 10% of the age-defined population eligible for screening. Population-based recruitment strategies for lung cancer screening must therefore currently engage with and assess the eligibility of a broader population of ever-smokers, the majority of whom will be ineligible. The feasibility and unintentional impact of this recruitment approach is not known.
Smoking cessation in one lung cancer screening study reduced all-cause mortality by up to 43%.26 Almost half of BHAS current smokers (42.9%; 103 of 240 current smokers) were ineligible for screening, regardless of the criteria used. Providing smoking cessation support without LDCT screening to ineligible current smokers who engage with a screening program may be a pragmatic way to combine primary prevention and early detection of lung cancer.
Of the BHAS ever-smokers aged 50–55 years, 4.4–8.8% had PLCOm2012 lung cancer risk sufficient to potentially benefit from screening, depending on the definition of COPD used. This may represent an additional population at risk who may benefit from lung cancer screening at a lower age threshold than currently recommended, although internationally there is little prospect of such a change.27
There are several potential limitations to this study. The upper age limit of our BHAS participants was 68 years, younger than the maximum recommended screening age of 80 years.3 This study may therefore have underestimated the proportion of the population potentially eligible for screening, as PLCOm2012 risk increases with age.21 Ethnic background has an impact on lung cancer risk, and the BHAS participants were almost exclusively European in origin, which is not representative of the broader Australian population, although the Busselton population age distribution and smoking demographic can be broadly generalised to the wider Australian population. Other lung cancer risk prediction models are being used to select individuals for lung cancer screening studies, but it was not possible to assess them, as they include variables (such as asbestos exposure) not recorded by the BHAS.6 The definition of COPD in the PLCOm2012 model is self-reported COPD, chronic bronchitis or emphysema, more inclusive than the definition used in the BHAS. We were unable to validate the PLCOm2012 model, as 6-year lung cancer outcomes are not available.
In conclusion, we estimate that between 17.9% and 20.1% of all current or former smokers aged 55–68 years in the BHAS population would be eligible for lung cancer screening, depending on the criteria applied. Symptom-defined COPD may be an appropriate surrogate measure for spirometric testing for determining the presence of COPD as part of the assessment of lung cancer screening eligibility.
Box 1 –
Demographic characteristics of ever-smokers in the Busselton Healthy Ageing Study
|
|
50–68 years old |
55–68 years old |
|||||||||||||
|
|
|||||||||||||||
|
Number |
1867 |
1260 |
|||||||||||||
|
Age (years), mean ± SD |
58.0 ± 4.8 |
60.7 ± 3.4 |
|||||||||||||
|
Sex (women) |
927 (49.7%) |
603 (47.9%) |
|||||||||||||
|
Ethnic background |
|
|
|||||||||||||
|
European |
1848 (99.0%) |
1249 (99.1%) |
|||||||||||||
|
Asian |
12 (0.6%) |
5 (0.4%) |
|||||||||||||
|
Aboriginal and/or Torres Strait Islander |
6 (0.3%) |
5 (0.4%) |
|||||||||||||
|
Māori or Pacific Islander |
1 (0.1%) |
1 (0.1%) |
|||||||||||||
|
Body mass index (kg/m2), mean ± SD |
28.46 ± 4.90 |
28.70 ± 4.95 |
|||||||||||||
|
Smoking status |
|
|
|||||||||||||
|
Current |
368 (19.7%) |
240 (19.0%) |
|||||||||||||
|
Former |
1499 (80.3%) |
1020 (81.0%) |
|||||||||||||
|
Total pack-years, mean ± SD |
|
|
|||||||||||||
|
Ever-smokers |
19.2 ± 19.6 |
20.5 ± 20.7 |
|||||||||||||
|
Current smokers |
31.5 ± 20.0 |
32.1 ± 19.3 |
|||||||||||||
|
Former smokers |
16.2 ± 18.4 |
17.8 ± 20.1 |
|||||||||||||
|
Highest education level obtained |
|
|
|||||||||||||
|
Did not complete high school |
36 (1.9%) |
27 (2.1%) |
|||||||||||||
|
High school |
1000 (53.6%) |
702 (55.7%) |
|||||||||||||
|
TAFE or other college |
555 (29.7%) |
352 (27.9%) |
|||||||||||||
|
University |
276 (14.8%) |
179 (14.2%) |
|||||||||||||
|
Previous cancer (excluding non-melanomatotic skin cancer) |
155 (8.3%) |
122 (9.7%) |
|||||||||||||
|
Family history of lung cancer |
146 (7.8%) |
106 (8.4%) |
|||||||||||||
|
Chronic obstructive pulmonary disease (COPD) |
|
|
|||||||||||||
|
Self-reported COPD |
16 (0.9%) |
13 (1.0%) |
|||||||||||||
|
Symptoms consistent with COPD |
617 (33.0%) |
441 (35.0%) |
|||||||||||||
|
Spirometry-defined COPD |
179/1191 (15.0%) |
108/782 (13.8%) |
|||||||||||||
|
|
|||||||||||||||
|
TAFE = Technical and Further Education. |
|||||||||||||||
Box 2 –
Eligibility for lung cancer screening of 1260 55–68-year-old ever-smokers in Busselton, according to USPSTF and PLCOm2012 criteria*
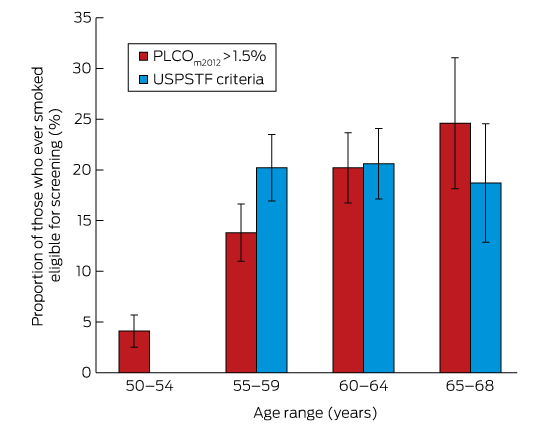
PLCO = Prostate, Lung, Colorectal, Ovarian Screening Trial; USPSTF = US Preventive Service Task Force. * Calculated using doctor-diagnosed chronic obstructive pulmonary disease, with 95% confidence intervals.
Box 3 –
Schematic representation of the proportion of current and former smokers eligible for screening
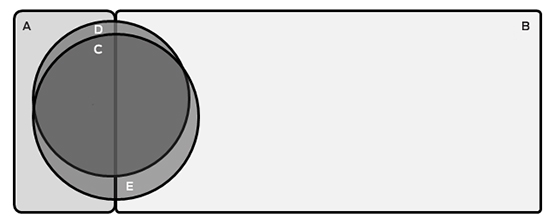
A = Ineligible current smokers (n = 103; 8.2%); B = Ineligible former smokers (n = 870; 69.0%); C = Individuals eligible on both USPSTF and PLCOm2012 criteria (n = 192; 15.2%); D = Individuals eligible only on PLCOm2012 criteria (n = 33; 2.6%); E = Individuals eligible only on USPSTF criteria (n = 62; 4.9%). The areas of the components of this figure are approximately proportional.
Box 4 –
Proportions of 782 ever-smokers aged 55–68 years eligible for screening based on PLCOm2012 criteria, using different definitions of chronic obstructive pulmonary disease (COPD)
|
COPD definition for estimating PLCOm2012 lung cancer risk |
PLCOm2012 risk > 1.5% |
P* |
|||||||||||||
|
|
|||||||||||||||
|
Self-reported COPD |
128 (16.4%; 95% CI, 13.8–19.0%) |
< 0.01 |
|||||||||||||
|
Symptom-defined COPD |
147 (18.8%; 95% CI, 16.1–24.5%) |
0.06 |
|||||||||||||
|
Spirometry-defined COPD |
137 (17.5%; 95% CI, 14.8–20.2%) |
— |
|||||||||||||
|
|
|||||||||||||||
|
* v spirometry-defined COPD (McNemar test). |
|||||||||||||||
Box 5 –
Summary of studies reporting proportions of the population aged 55 years or more who are eligible for lung cancer screening
|
|
BHAS |
US Health and Retirement Study19 |
US National Health Interview Survey20 |
US National Health and Nutrition Examination Survey18 |
|||||||||||
|
|
|||||||||||||||
|
Sample size |
2523 |
77 445 |
16 901 |
7138 |
2562 |
||||||||||
|
Recruitment period |
2010–2013 |
1993–2001 |
2012 |
2011 |
2007–2012 |
||||||||||
|
Age range, years |
55–68 |
55–74 |
55–80 |
55–74 |
55–77 |
||||||||||
|
Smoking status |
|
|
|
|
|
||||||||||
|
Never |
49.2% |
45.1% |
42.5% |
NR |
NR |
||||||||||
|
Current |
9.5% |
10.4% |
14.4% |
NR |
NR |
||||||||||
|
Former |
40.4% |
42.0% |
39.6% |
NR |
NR |
||||||||||
|
Missing or incomplete |
0.9% |
2.5% |
3.5% |
NR |
NR |
||||||||||
|
Eligible individuals as proportion of entire cohort |
|||||||||||||||
|
USPSTF criteria |
10.0% |
19.6% |
10.5% |
14.3% |
NR |
||||||||||
|
PLCOm2012 > 1.5% |
8.9% |
17.9% |
NR |
NR |
NR |
||||||||||
|
Eligible individuals as proportion of cohort of all ever-smokers |
|||||||||||||||
|
USPSTF criteria |
20.1% |
38.0% |
18.8% |
NR |
24.4% |
||||||||||
|
PLCOm2012 > 1.5% |
17.9% |
34.6% |
NR |
NR |
9–35%, depending on ethnicity* |
||||||||||
|
|
|||||||||||||||
|
BHAS = Busselton Healthy Ageing Study; NR = not reported; PLCO = Prostate, Lung, Colorectal and Ovarian Trial; USPSTF = United States Preventive Services Task Force. * Extrapolated from figure 1 in reference . |
|||||||||||||||
Financial toxicity in clinical care today: a “menu without prices”
Out-of-pocket costs are rising rapidly and can influence treatment decisions and health outcomes
Australia delivers health outcomes that rank well internationally, with per capita spending demonstrably less than that of the United States. Of concern, Australia’s out-of-pocket costs for health care are sixth highest among Organisation for Economic Co-operation and Development countries,2 despite universal health insurance. These out-of-pocket expenses accounted for 57% of non-government health expenditure in 2011–12, or over 17% of all health care expenditure.3 Health care costs in Australia continue to rise well above the consumer price index. The net burden of costs are reported by clinicians to influence some decisions that patients make, with the potential for detrimental health outcomes for individuals and for Australia’s health as a whole.
The average equivalised weekly disposable household income in 2013–14 was $998, with a median of $844.4 About half of all households therefore have a weekly net income of less than $844, yet that income has to support out-of-pocket health expenses. There are also limits to what is covered under different aspects of the safety net. Further, many aspects of community-based care are associated with part or all of the cost being borne by the patient, in many cases with no safety net provisions (wound dressings, incontinence pads, community nursing and allied health visits).
In cancer care, patients often face tough decisions as new unsubsidised therapies become available. An ageing population, innovations (some with very marginal benefits) and the risk that some procedures are overused or harmful all contribute to unnecessary financial (and emotional) pressure on patients and their families. Procedures and interventions, at times with marginal health gains, are being promoted actively, frequently with high costs and little meaningful benefit in terms of quality of life or survival. In the context of ongoing outcome disparities based on socio-economic status, our aim must be timely access to world class care for all Australians, regardless of financial circumstances.
In the Australian context, financial disclosure is not only how much a procedure will cost but, crucially, whether there are alternatives that offer similar benefits at less cost to the patient. This may be as important to the patient as the side effects or risks of an intervention. Most starkly, the omission of information from a private clinician regarding options in the public sector reduces informed financial choice and increases the potential for significant financial and health disadvantages.
Failing to inform patients about comparative waiting times in public and private systems falls short of fully informed (financial) consent. Indeed, national data demonstrate that public surgical waiting times for a sample of cancers are very short.5 Publicly available data on waiting times and service quality are critical for supporting informed treatment decisions, especially when out-of-pocket expenses can vary from zero to tens of thousands of dollars for the same procedure.
Value in health care is defined as outcomes relative to cost.6 In considering this from a patient’s perspective, it is imperative to not only question outcomes but to understand the true cost for the whole episode of care — the out-of-pocket expenses, the contribution made by the community through Medicare, and any supplementary private insurance. Informed choice should be based on more than the costs charged by an individual practitioner and those incurred by related pathology, imaging and anaesthetics. Informed choice now needs also to account for the extreme variations in the prices charged by identically credentialed practitioners within Australia undertaking the identical procedure.7
International data suggest that the consequences of high out-of-pocket costs include the potential for poorer compliance with ideal care, including prescribed medications that are necessary for best outcomes.8,9 To make decisions about what is often a long treatment pathway across multiple modalities, patients need a comprehensive and early understanding of the financial impacts of treatment, time away from work and other costs, and the opportunity to seek financial advice and assistance early as needed. Indeed, in one survey, people only sought help when the financial burden was starting to cause significant difficulties.9
Arguably, failure by medical practitioners to disclose all of the financial costs affecting patients’ decisions is a cause of avoidable suffering for tens of thousands of households across Australia each year.10 A new standard for financial disclosure is required — a standard that moves beyond disclosure of the costs of a single procedure to one that accounts for the costs of a full pathway of treatment and all the alternatives open to the patient. The issue of financial toxicity in Australian health care requires open debate supported by population- and individual-level data on rapidly rising out-of-pocket costs, and advocacy that places patients’ outcomes at the centre of any debate about the profession’s increasing demands on patients’ wallets.
Diabetes drug lowers risk of heart attack, stroke
A glucose-lowering drug has been shown to safely lower the overall risk of heart attack, stroke or cardiovascular death among type 2 diabetes patients.
Patients who were at risk for cardiovascular disease were found to have a 13% lower risk of cardiovascular death, non-fatal heart attack or non-fatal stroke when they took the drug Liraglutide compared to those who took placebo.
The randomised, double-blind study assigned patients either liraglutide or placebo and followed them for an average of 3.8 years.
Study results found a 22% lower risk of cardiovascular mortality, 15% risk of all-cause mortality and 22% lower risk of new evidence of advanced diabetic kidney disease.
Related: Call for gastric surgery to treat diabetes
“It is exciting to see such a broad-based benefit for patients who took liraglutide because most prior trials of diabetes medications have not shown such benefits,” lead investigator John B. Buse from the University of North Carolina School of Medicine said.
“Our results should give patients and providers comfort that liraglutide can safely improve outcomes beyond the core treatment of type 2 diabetes.”
The results were presented at the American Diabetes Association’s 76th Scientific Sessions in New Orleans over the weekend and were published in the New England Journal of Medicine.
In another study presented published in NEJM, it was found that empagliflozin was associated with slower progression of kidney disease and lower rates of clinically relevant renal events in patients with type 2 diabetes at high risk for cardiovascular event.
Latest news: