×

Vaccine myopia: adult vaccination also needs attention

Time to increase our focus on immunising adults

In recent years, there has been increasing attention on parents who actively refuse to vaccinate their children. Successive federal governments have increased the amount of family assistance payments at stake for those who do not vaccinate, and removed most incentives for providers to vaccinate.1 In 2016, the federal government removed vaccine objection as an alternative to vaccination for eligibility to receive family assistance payments. Two states — Victoria and Queensland — introduced legislation to allow the exclusion of unvaccinated children from child care, with no exemption for objectors. The abolition of the conscientious objection process has been championed in sections of the media2 and by some advocacy groups. Responses to people expressing dissenting views have sometimes been vitriolic.3

These measures, however, do not address the vast numbers of undervaccinated adults. We estimate that there are about 4.1 million undervaccinated Australians each year; that is, people who are eligible to receive free vaccine(s) under the National Immunisation Program (NIP) but do not receive them (Box). Of these, the children of parents with ideological objections to vaccination are a small subset; the vast majority are adults.

Many vaccines are officially recommended for Australians in a range of circumstances, at full cost to the individual, at a subsidised cost or free of charge.4 The latter category are vaccines that have been added to the NIP Schedule for eligible groups, following expert advice that they should be provided free of charge, based on an analysis of the disease burden, vaccine efficacy, safety and cost. In this article, we specifically discuss NIP vaccines and eligible groups.

Undervaccinated children

There are about 1.8 million children aged over 6 years in Australia.5 Vaccination coverage rates in children are high by international standards — over 90% of children have received all recommended vaccines by the age milestones of 12, 24 and 60 months.6 It has been estimated that about 150 000 (8.1%) were recorded as having not received one or more recommended doses in 2013. About 37 000 of these, or 2.0% of children, were registered as having a conscientious objection.6 Of the remaining 6.1%, most were incompletely vaccinated or unvaccinated owing to difficulties accessing immunisation services, false contraindications, or having parents who had concerns but did not report an objection.6 A proportion were in fact vaccinated but the information had not been reported or transmitted to the Australian Childhood Immunisation Register (ACIR).

Undervaccinated adolescents

In contrast to high rates of early childhood immunisation coverage, three-dose completion of the HPV vaccine course in adolescent girls is currently 73%.7 Coverage for other adolescent vaccines is not collected at the national level but is estimated to have been lower for some other NIP vaccines for this age group.8 Based on HPV coverage for adolescent girls and applying that to a 2-year cohort of both sexes, we estimate that there are currently about 150 000 undervaccinated adolescents aged 13–14 years. The likely major contributors are difficulty in obtaining informed consent, school attendance rates and limited facility for catch-up vaccination.8

Undervaccinated adults

The vaccines currently on the NIP for adults are influenza vaccine (since 1999), 23-valent pneumococcal polysaccharide vaccine (23vPPV; since 2005) and herpes zoster (since November 2016). Influenza is estimated to be responsible for 300 000 general practitioner consultations, 18 000 hospital admissions9 and 3000 deaths4 each year in Australia. Annually, there are about 360 cases of invasive pneumococcal disease due to serotypes included in the 23vPPV in people aged ≥ 65 years, including at least 45 deaths.10 Low vaccination coverage is a substantial contributor to these continuing disease burdens. Improved performance in program delivery to this group is required, especially given the addition of zoster vaccine at 70 years of age from November 2016, and perhaps 13-valent pneumococcal conjugate vaccine at 65 years and pertussis vaccine for pregnant women, following recent Pharmaceutical Benefits Advisory Committee recommendations.11 There are about 3.5 million Australians aged ≥ 65 years,5 all of whom are eligible for pneumococcal and annual influenza vaccines. Yet only 51% of this population had received both vaccines when last measured, reflecting a large gap between funded infant and adult vaccine programs.12 The most important factor influencing vaccination uptake in older patients is a recommendation from a health professional.12 Perceptions about the severity of influenza disease, the effectiveness of the currently available vaccines, and the severity of side effects are also associated with the likelihood of being vaccinated.12 Further, there is good evidence on a wide variety of effective measures to improve coverage rates in the older population, including reminders for patients and providers, educational interventions and incentives.13

For programs targeted at high risk individuals, mostly adults, the situation is even less satisfactory. The dilemma of these programs is that, while they target individuals at highest risk and with the most to gain from immunisation, they routinely achieve lower coverage than programs with simpler age-based recommendations.14 This is likely to be due to the greater difficulty in identifying and reaching eligible people, and missed opportunities to vaccinate during other health care encounters. Since 2010, influenza vaccine has been available under the NIP for all people aged ≥ 6 months who are medically at risk of severe complications following influenza infection. A quarter of the adult population (aged ≥ 18 years) falls into this category.12 The coverage achieved by this program since its introduction is not known — we have used an estimate of 36% from 2009,12 or about 1.8 million unvaccinated adults each year. The World Health Organization recommends pregnant women as the highest priority to receive influenza vaccine. In a 2015 study from Western Australia, 41% of pregnant women had received the vaccine,15 and unpublished data indicate this to be rising.16 For Aboriginal and Torres Strait Islander people aged 15–49 years with medical risk factors, the most recent pneumococcal coverage estimate is an unacceptable 13%.14 Concerted efforts — over and above those required for age-based programs — are required to achieve good coverage in these programs. In addition to the measures mentioned above, population-based data and the ability to follow up unvaccinated eligible individuals are required but are more difficult to implement than for age-based programs. Improving access through nurse immunisers, flexible clinic hours,17 performance measures18 and active individual case management19 have all been successful in hard-to-reach and high risk populations.

The reasons for the neglect of adult immunisation are multifactorial and are not limited to Australia. In the United States, where vaccination coverage in adults is also suboptimal, an estimated 70 000 adults die from vaccine-preventable diseases each year.20 Lack of provider confidence in adult vaccines, value judgements on prevention in older people and lack of an adult vaccination register may all contribute to this gap21. The ACIR supports the improvement of childhood vaccination coverage in a range of critical ways, including the documentation of immunisation for parents and providers, administering immunisation incentives for parents and providers, timely and accurate coverage estimates for providers and program managers, capacity to implement reminder systems, and performance indicators for program managers. In contrast for adults, the most recent coverage data are from 2009,12 and none of the other supporting mechanisms listed above are available. The 2015 federal Budget announcement that the ACIR would be expanded across the lifespan is a welcome development but is not in itself sufficient. Capturing the relevant data and providing all this functionality for adolescents, older Australians and risk-based programs will be a greater challenge than establishing the ACIR. Adult vaccination includes a wider range of immunisation providers and subpopulations of vaccines, such as those with medical risk factors. It will require substantial support, resourcing and ongoing consultation.

Conclusion

Achieving high vaccination coverage in adults is challenging, given their greater mobility and diversity of settings. However, this is likely to be more successful in preventing disease than policies that sanction vaccine-hesitant parents. There is a need for governments, the media, providers and individuals to direct more attention towards the large numbers of adults who are unnecessarily susceptible to vaccine-preventable disease each year. Immunisation is just as important for adolescents, older people, those with medical risk factors, pregnant women and other high risk groups as it is for children.

Box –
Number of Australians eligible for vaccination under the National Immunisation Program, by age group and vaccination status, each year5,7,12,14


* Medically at-risk children aged 6 months to 17 years are also funded but are not included in these numbers.

[Editorial] Phasing out harmful use of pesticides

“If we are going to live so intimately with these chemicals—eating and drinking them, taking them into the very marrow of our bones—we had better know something about their nature and their power”, wrote environmentalist Rachel Carson in 1962 in her book Silent Spring, which hauntingly described the damaging effects of indiscriminate pesticide use in agriculture on animals and people in the USA. 55 years later, a new report by the UN Special Rapporteur on the right to food and the UN Special Rapporteur on toxics, presented to the Human Rights Council on March 7, details the health and environmental effects of excessive pesticide use globally.

Human papillomavirus vaccination and genital warts in young Indigenous Australians: national sentinel surveillance data

The known The Australian HPV vaccination program has led to significant declines in a number of HPV-related conditions, including diagnoses of genital warts in young women and heterosexual men at sexual health clinics. 

The new We found marked declines in the proportions of young Indigenous women and men attending sexual health clinics for the first time who were diagnosed with genital warts following introduction of the HPV vaccination program, similar to declines among non-Indigenous young women and men. 

The implications Sustained high HPV vaccine coverage rates and monitoring are needed to close the gap between Indigenous and non-Indigenous Australians in the rates of cervical and other HPV-related cancers in older women. 

The Australian national human papillomavirus (HPV) vaccination program commenced in April 2007. Free vaccination was provided to 12–13-year-old girls in schools; this was supplemented by a 3-year catch-up program for 13–18-year-old girls in schools and for 18–26-year-old women through family doctors in July 2007.1 In 2013, boys were added to the program, providing free HPV vaccination to 12–13-year-old boys in schools and, for 2 years, a catch-up program for 14–15-year-old boys. Australia uses the quadrivalent HPV vaccine (Gardasil), protecting against HPV types 6 and 11, which cause ano-genital warts, and HPV types 16 and 18, which cause cancer.2,3

The Australian HPV vaccination program has had very promising results. High coverage rates among vaccine-eligible girls have been achieved, 73% receiving all three doses in 2010.4 Significant reductions in the prevalence of HPV-related conditions have been seen; diagnoses of genital warts in young women and heterosexual men at sexual health clinics,5,6 inpatient treatment of genital warts at private hospitals,7 hospital admissions for genital warts,8 the prevalence in young women of HPV types targeted by the quadrivalent vaccine,9,10 and the incidence of high grade cervical abnormalities11 have all declined.

Measuring the impact of the HPV vaccination program in Aboriginal and/or Torres Strait Islander (Indigenous) people is important because cervical cancer rates among Indigenous women are twice as high as among non-Indigenous women.12 Similar findings have been reported overseas; a meta-analysis of data from 35 studies found that indigenous women had elevated risks of invasive cervical cancer and related mortality (pooled risk ratios, 1.72 and 3.45 respectively).13 Indigenous Australians experience poorer outcomes than non-Indigenous people for a range of conditions,14 including some sexually transmissible infections (STIs).1517 In response to these inequities, the Australian Government initiated the Closing the Gap program in 2008,18 followed in 2014 by the Fourth National Aboriginal and Torres Strait Islander Blood-borne Viruses and STI Strategy, 2014–2017, which includes the aim of achieving high rates of HPV vaccination.19

Despite their disproportionately high rates of cervical cancer, there is a lack of information on HPV vaccination and its impact, including on the prevalence of genital warts, in indigenous populations around the world. A recent systematic review20 did not find any studies that reported the effect of HPV vaccination programs in indigenous populations. The aim of our study was therefore to examine the effect of the HPV vaccination program on diagnoses of genital warts in Indigenous Australians, and to compare this with data for non-Indigenous Australians.

Methods

Routinely collected de-identified data were collated from 39 clinics in the Genital Warts Surveillance Network (http://kirby.unsw.edu.au/projects/genital-warts-surveillance-network). The network, including 47% of all sexual health clinics in Australia, was established in 2008 to measure the effects of the Australian HPV vaccination program on the prevalence of genital warts. The participating clinics, all of which have computerised medical records systems, are the largest such clinics by patient volume, accounting for more than 90% of all sexual health clinic consultations in Australia. Patient demographic and behavioural data (age, sex, Indigenous status, country of birth, sex of their sexual partners) and data on the clinical diagnosis of genital warts were collated.

Data analysis

Australian-born patients who attended one of the clinics for the first time between January 2004 and December 2014 were included in the study. Analysis was restricted to Australian-born patients because the HPV vaccine is available free of charge only to Australian permanent residents and citizens (residency status is not routinely collected at clinics), and to first visits to exclude patients with recurrent genital warts diagnoses. Patients of unknown Indigenous status were excluded. Men who reported having sex only with men or with both men and women in the past 12 months were classified as men who have sex with men (MSM), and men who reported having sex only with women as heterosexual.

The study period was divided into a pre-vaccination period (2004–2007) and a vaccination period (2008–2014). All data from 2007 were included in the pre-vaccination period. The proportion of patients diagnosed with genital warts was calculated by dividing the number of new diagnoses by the number of patients seen, and the relative percentage change in proportion over time was calculated.

The pattern of change in diagnoses was described using univariate Poisson regression models, with the number of diagnoses as the outcome and the calendar year as the independent variable. Results are presented as average annual trends (average annual proportional change in rates; eg, for 10% average increase, average annual trend = 1.10). Models were separately fitted for the pre-vaccination and vaccination periods; the pre-vaccination period was assessed to identify any changes related to factors other than vaccination. Model fit was assessed in Pearson χ2 tests and by visually comparing it with the observed proportions (online Appendix, figures 1–3).

The average difference between the pre-vaccination and vaccination periods in the proportions of patients diagnosed with genital warts was analysed in univariate Poisson models, with the number of diagnoses as the outcome and the vaccination period as the binary independent variable. Results are presented as summary rate ratios (SRRs).

The magnitude of the difference between Indigenous and non-Indigenous people in rate change was quantified in a bivariate Poisson model, using the number of diagnoses as the outcome, including an interaction term for Indigenous status and year. Results are presented as the ratio of the SRRs for diagnoses in non-Indigenous and Indigenous people to account for potential differences in patient numbers by vaccination period for each group.

A sensitivity analysis that excluded the 2007 data was conducted with the same methods to allow a wash-in period for the intervention. Results were qualitatively compared with those of the primary analyses to assess any reduction in the proportion of diagnoses during 2007 associated with vaccinations during the second half of 2007.

Analyses for three age groups were conducted: people under 21 (all women in this age group were eligible to receive free HPV vaccination, but boys aged 12–15 years were only eligible to receive it from early 2013), people aged 21–30 years (most women in this age group were eligible to receive free HPV vaccination, and all women by the end of the study period), and those over 30 (few women in this age group were eligible to receive free HPV vaccination). No men over 21 had been eligible for free vaccination at any time. Analyses for MSM were not stratified by age because of the small number of observations.

All analyses were conducted in Stata 13.1 (StataCorp).

Ethics approval

Ethics approval for the study was provided by the Aboriginal Health and Medical Research Council (reference, 1099/15), the St Vincent’s Hospital Sydney Human Research Ethics Committee (reference, 08/051), by the state-based human research ethics committees, and by the governance offices overseeing each participating clinic.

Results

A total of 220 761 Australian-born patients were seen at the participating sexual health clinics for the first time between 2004 and 2014. 5162 records (2.3%) were excluded because information on Indigenous status was missing; of the remaining 215 599 patients, 15 638 (7.3%) identified themselves as Indigenous and 91 689 (42.5%) were women. The median age of the 215 599 patients was 27 years (interquartile range [IQR], 21–36 years); the median age of the Indigenous patients was 22 years (IQR, 18–32 years).

Women

The rates of diagnosis of genital warts were consistently lower for Indigenous women than non-Indigenous women in each age group (Box 1; online Appendix, table 1).

Average annual trend

There was no trend in annual diagnosis rates for the pre-vaccination period. During the vaccination period, the annual diagnosis rate declined for both Aboriginal and non-Aboriginal women aged 30 years or less, but not for women over 30 (Box 2).

Vaccination v pre-vaccination periods

The average annual rates of diagnosis declined significantly between the pre-vaccination and vaccination periods for both Indigenous (SRR for Indigenous women under 21, 0.12; 95% confidence interval [CI], 0.07–0.21; P < 0.001; for 21–30-year-old women, 0.41; 95% CI, 0.27–0.61 P < 0.001) and non-Indigenous women under 30 years of age (SRR for non-Indigenous women under 21, 0.21; 95% CI, 0.19–0.24; P < 0.001; for 21–30-year-old women, 0.43; 95% CI, 0.40–0.46; P < 0.001) (Box 2).

Ratio of SRRs

The reduction in the proportion of clinic patients diagnosed with genital warts associated with the vaccination period was similar for Indigenous and non-Indigenous women, and the fall was significantly greater only for Indigenous women under 21 (SRR ratio, 1.72; 95% CI, 1.72–2.91; P = 0.043) (Box 2).

Heterosexual men

The rates of diagnosis of genital warts were consistently lower for Indigenous men than Australian-born non-Indigenous men in each age group (Box 3; online Appendix, table 2).

Average annual trend

There was an increase in annual diagnosis rates during the pre-vaccination period for both Indigenous and non-Indigenous men under 21 (each P < 0.05), but no statistically significant change for those aged 21–30 years, nor for Indigenous men over 30. There was, however, a decline in rate for non-Indigenous men over 30 during this period (P = 0.001). During the vaccination period, there was no change in diagnosis rates among younger Indigenous men but a decline in those over 30 (P = 0.04). There was a decline in diagnosis rates among all non-Indigenous men, with the greatest decline among those under 21 (P < 0.001) (Box 2).

Vaccination v pre-vaccination periods

The average annual rates of diagnosis were statistically significantly lower during the vaccination period than the pre-vaccination period for younger Indigenous men (SRR for Indigenous men under 21, 0.25; 95% CI, 0.12–0.49; P < 0.001; for 21–30-year-old men, 0.56; 95% CI, 0.35–0.90; P = 0.016), but not for those over 30; the reductions were significantly lower for all non-Indigenous men (SRR for non-Indigenous men under 21, 0.33; 95% CI, 0.28–0.39; P < 0.001; for 21–30-year-old men, 0.60; 95% CI, 0.56–0.63; P < 0.001; for those over 30, 0.83; 95% CI, 0.78–0.89; P < 0.001) (Box 2).

Ratio of SRRs

The level of change in the proportion of clinic patients diagnosed with genital warts associated with the vaccination period was similar for Indigenous and non-Indigenous men in all age groups (Box 2).

Men who have sex with men

The rates of diagnosis of genital warts were similar for Indigenous and non-Indigenous MSM (Box 4; online Appendix, table 3).

Average annual trends

There was no trend in the diagnosis rates for Indigenous or non-Indigenous MSM during the pre-vaccination period. Similar reductions in rate were measured in both groups during the vaccination period, but the change was not statistically significant for Indigenous MSM (Box 2).

Vaccination v pre-vaccination periods

There was no significant change in the average annual rate of diagnosis for Indigenous MSM (SRR, 0.74; 95% CI, 0.40–1.36; P = 0.33), but the rate declined significantly among non-Indigenous MSM (SRR, 0.64; 95% CI, 0.59–0.70; P < 0.001) (Box 2).

Ratio of SRRs

The reduction in the proportion of MSM diagnosed with genital warts associated with the vaccination period was not significantly different for Indigenous and non-Indigenous men (Box 2).

Sensitivity analysis

The results of the sensitivity analysis were qualitatively similar to those of the primary analysis. Trend results were attenuated by the reduced time frame and need to be interpreted with caution, but there was no significant downward trend in rate during the pre-vaccination period. SRRs were similar to those in the primary analysis, but were influenced slightly by the reduced time frame (online Appendix, tables 4 and 5).

Discussion

We found that there have been marked declines since the introduction of the national HPV vaccination program in the proportions of Indigenous and non-Indigenous women under 21 attending sexual health clinics for the first time who are diagnosed with genital warts. The decline for Indigenous women under 21 was higher than for non-Indigenous women of the same age. Marked decreases were also found for young Indigenous heterosexual men and non-Indigenous heterosexual men of all ages. The decline in heterosexual men is probably due to herd protection, as it is too early to expect any substantial direct effect of the vaccination of boys. The declines in the proportions of diagnoses in older Indigenous men were not statistically significant, probably because of the small number of patients in this group (online Appendix, table 2).

The reductions in the proportions of Indigenous and non-Indigenous young people attending sexual health clinics diagnosed with genital warts are remarkable; in recent times, very few interventions have achieved such dramatic declines in an STI, with the exception of donovanosis.16 While the number of genital warts diagnoses has been declining since 2007, those of chlamydia has been increasing. Data from the Australian Collaboration of Coordinated Enhanced Sentinel Surveillance study, which includes the same clinics as our study, reported that the proportion of Indigenous women attending these clinics who were chlamydia-positive had risen from 14.4% in 2006 to 19.8% in 2011 (for trend, P = 0.01); the rate in young Indigenous men was stable (2006, 15.8%; 2011, 16.2%; P = 0.23).21

We found no significant difference between the rates of decline in genital wart diagnoses in Indigenous and non-Indigenous women — except among those under 21, for whom the decline was greater among Indigenous women — nor between those for Indigenous and non-Indigenous heterosexual men or MSM. In contrast, data from the HPV vaccination catch-up program for Indigenous women in Queensland and Northern Territory indicated that coverage rates were lower among Indigenous women than non-Indigenous women in Queensland, particularly for the third dose; in the Northern Territory in 2011, however, completion rates for the three doses were similar for the two populations.22 The clinics included in our study included only a subset of Indigenous people in each state and territory, so it is possible that some differences may have been masked.

The proportion of MSM diagnosed with genital warts declined significantly among non-Indigenous but not among Indigenous patients. MSM presumably do not benefit from the herd protection achieved by the HPV vaccination program, and the decline in the diagnosis rate among non-Indigenous MSM is probably explained by the increasing number of MSM seen at sexual health clinics in the past decade (Appendix, table 3). MSM have been encouraged to attend sexual health clinics more frequently for asymptomatic screening, whereas asymptomatic Indigenous men have always been a priority population.23

This study has several strengths. First, it is the first to examine trends in the diagnoses of genital warts in Indigenous people attending sexual health clinics. Second, these data come from a national surveillance network with wide geographic coverage. Third, retrospective data were available, so we could compare the number of diagnoses of genital warts during the vaccination and pre-vaccination periods. There are three main limitations to our study. First, it was an ecological study, and the falls in the proportions of clinic patients diagnosed with genital warts cannot be directly attributed to the HPV vaccination program. However, the sudden fall in diagnosis rates after its commencement and the dose–response relationship (that is, the number of diagnoses of genital warts fell as the number of people vaccinated increased) support a causal association. Second, the Indigenous patients included in our study are not representative of all Indigenous people because sexual health clinics see patients who are at higher risk of STIs than the general population;24 for some states a smaller proportion of Indigenous people was included, so that there may be local differences; and many Indigenous people receive health care from the Aboriginal and Community Controlled Health Services and other primary health services.25 Third, the numbers of patients in some groups were small, so that the 95% CIs for trends and SRRs were wide.

Current levels of HPV vaccination coverage among young Indigenous Australians of vaccine-eligible age are providing them with the same benefit as non-Indigenous Australians, closing the gap with respect to genital warts in young women. Older Indigenous women still have disproportionately high rates of cervical pathology and cancer, so that cervical cancer screening coverage for these women should be increased. Sustaining high HPV vaccination rates and monitoring coverage in Indigenous communities should also close the gap for cervical and other HPV-related cancers.

Box 1 –
Proportion of Indigenous and non-Indigenous Australian-born women diagnosed with genital warts at first visit to a sexual health clinic, 2004–2014*


* The vertical lines indicate the start of the HPV vaccination programs for girls (2007) and boys (2013).

Box 2 –
Average annual trends in the diagnosis of genital warts at 39 Australian sexual health clinics, with summary rate ratios (SRRs), 2004–2014

Sex

Age (years)

Indigenous status

Pre-vaccination period (2004–2007)


Vaccination period (2008–2014)


Vaccination v pre-vaccination


SRR ratio, non-Indigenous v Indigenous patients

P

Average annual trend (95% CI)*

P

Average annual trend (95% CI)*

P

SRR (95% CI)

P


Women

12–20

Indigenous

1.18 (0.93–1.49)

0.16

0.69 (0.52–0.92)

0.010

0.12 (0.07–0.21)

< 0.001

non-Indigenous

1.04 (0.99–1.1)

0.14

0.69 (0.64–0.74)

< 0.001

0.21 (0.19–0.24)

< 0.001

1.72 (1.02–2.91)

0.043

21–30

Indigenous

0.87 (0.66–1.13)

0.30

0.84 (0.73–0.96)

0.010

0.41 (0.27–0.61)

< 0.001

non-Indigenous

1.01 (0.98–1.05)

0.45

0.80 (0.78–0.83)

< 0.001

0.43 (0.40–0.46)

< 0.001

1.05 (0.69–1.59)

0.83

> 30

Indigenous

1.01 (0.75–1.37)

0.94

1.07 (0.93–1.24)

0.33

0.84 (0.51–1.36)

0.47

non-Indigenous

1.03 (0.96–1.10)

0.40

0.98 (0.95–1.01)

0.14

1.05 (0.94–1.16)

0.39

1.25 (0.76–2.06)

0.38

Men

12–20

Indigenous

1.73 (1.10–2.71)

0.017

0.78 (0.61–1.01)

0.057

0.25 (0.12–0.49)

< 0.001

non-Indigenous

1.14 (1.02–1.26)

0.019

0.71 (0.66–0.77)

< 0.001

0.33 (0.28–0.39)

< 0.001

1.34 (0.66–2.74)

0.42

21–30

Indigenous

1.33 (0.92–1.94)

0.13

1.02 (0.88–1.18)

0.80

0.56 (0.35–0.90)

0.016

non-Indigenous

1.01 (0.98–1.05)

0.47

0.83 (0.82–0.85)

< 0.001

0.60 (0.56–0.63)

< 0.001

1.06 (0.66–1.69)

0.82

> 30

Indigenous

1.22 (0.86–1.74)

0.26

0.88 (0.78–0.99)

0.040

0.67 (0.42–1.08)

0.10

non-Indigenous

0.93 (0.89–0.97)

0.001

0.97 (0.95–0.99)

0.008

0.83 (0.78–0.89)

< 0.001

1.24 (0.77–2.01)

0.38

MSM

All

Indigenous

0.77 (0.48–1.24)

0.28

0.88 (0.75–1.02)

0.09

0.74 (0.40–1.36)

0.33

non-Indigenous

0.96 (0.90–1.02)

0.205

0.88 (0.85–0.90)

< 0.001

0.64 (0.59–0.70)

< 0.001

0.87 (0.47–1.61)

0.66


MSM = men who have sex with men; SRR = summary rate ratio. * Average annual change in notification rate, based on univariate Poisson models with diagnoses as dependent variable and calendar year as independent variable. † Vaccination v pre-vaccination period SRR, based on univariate Poisson models with diagnoses as dependent variable and vaccination period as independent variable. ‡ Ratio of SRRs, based on Poisson models with diagnoses as dependent variable and with Indigenous status and vaccination period and associated interaction term as independent variables. Results may differ when calculated directly from table SRRs because of rounding.

Box 3 –
Proportion of Indigenous and non-Indigenous Australian-born men diagnosed with genital warts at first visit to a sexual health clinic, 2004–2014*


* The vertical lines indicate the start of the HPV vaccination programs for girls (2007) and boys (2013).

Box 4 –
Proportion of Indigenous and non-Indigenous Australian-born men who have sex with men diagnosed with genital warts at first visit to a sexual health clinic, 2004–2014*


* The vertical lines indicate the start of the HPV vaccination programs for girls (2007) and boys (2013).

Flu vaccine not available until April 2017

The Federal Government has announced that the quadrivalent influenza vaccine stocks won’t hit GPs until mid-April this year.

According to a Health department spokeswoman, “The vaccine companies are finding it harder each year, with some many strain changes, to produce enough vaccine for mass distribution before April.“

Although flu vaccines are being administered in some chemists from mid March, there is an advantage to a slightly later vaccination date.

According to Australian Technical Advisory Group on Immunisation (ATAGI) advice, “Recent evidence suggests protection against influenza may start to decrease from 3 to 4 months following vaccination and early vaccination needs to be balanced with this.”

The peak month for influenza in Australia is August and it’s estimated to be responsible for more than 5000 hospitalisations and almost 170 deaths each year.

Related: MJA – Influenza vaccine effectiveness in general practice and in hospital patients in Victoria, 2011–2013

The strains covered in this year’s vaccination are:

  • A (H1N1): an A/Michigan/45/2015 (H1N1)pdm09* like virus
  • A (H3N2): an A/Hong Kong/4801/2014 (H3N2) like virus
  • B: a B/Brisbane/60/2008 like virus
  • B: a B/Phuket/3073/2013 like virus

Typically, people most commonly affected are young children and older adults with pregnant women particularly high risk of becoming seriously ill.

The immunisation vaccine is funded under the National Immunisation Program for certain at risk groups. They are:

  • Aboriginal and/or Torres Strait Islander children between 6 months and 5 years and 15 years and over,
  • Anyone 65 years and over,
  • Anyone 6 months and over who have certain medical conditions including severe asthma, lung or heart disease, low immunity or diabetes,
  • Pregnant women.

For more information, visit the: Australian Technical Advisory Group on Immunisation (ATAGI) advice for immunisation providers regarding the administration of seasonal influenza vaccines in 2017 and the updated Australian Immunisation Handbook 10th edition.

Latest news

Thirty years of the World Health Organization’s target caesarean section rate: time to move on

The 2009 edition of the World Health Organization Monitoring emergency obstetric care handbook was the first since 1985 not to recommend a maximum caesarean section (CS) rate of 15%.1 In its place was the statement, “there is no empirical evidence for an optimum percentage or range of percentages”, and a concession that “what matters most is that all women who need caesarean sections actually receive them”. Despite this change, a perception remained that CSs above such a “target” rate were unnecessary.2

In 2015, a new WHO standalone policy statement was released, restating that “every effort should be made to provide caesarean sections to women in need, rather than striving to achieve a specific rate”.3 However, the document justified a return to the old recommendation, recognising that “the international community has increasingly referenced the need to revisit the 1985 recommended rate”:

Since 1985, the international healthcare community has considered the ideal rate for caesarean sections to be between 10% and 15% … there is no evidence showing the benefits of caesarean delivery for women or infants who do not require the procedure … caesarean sections are associated with short and long term risk which can extend many years beyond the current delivery and affect the health of the woman, her child, and future pregnancies. These risks are higher in women with limited access to comprehensive obstetric care.3

The WHO’s original 1985 consensus opinion arose from the observation that certain countries with low perinatal mortality rates had CS rates of less than 10%.4 Thus, “CS rates above a certain limit have not shown additional benefit for the mother or the baby, and some studies have even shown that high CS rates could be linked to negative consequences in maternal and child health”.2,511 But is it really possible to prescribe a target CS rate applicable to all 194 WHO member countries?

In this narrative review, we have used original papers and review articles from the past 30 years to formulate an overview of this topic, which is fundamental to the provision of women’s health care in Australia, and to put the WHO recommendation in perspective using Australian data.

Is an international caesarean section target rate realistic?

In Australia at present, almost a third of all births are caesarean deliveries: close to 100 000 CSs are performed each year.12 Consider the differences between Australia and our nearest neighbour, Papua New Guinea (PNG), where the CS rate is estimated to be less than 5%.13 In Australia, the median maternal age at first birth is 29 years, and the median number of births a woman will have is two — less than 5% of Australian women will have more than three children.12 The only situation in which Australian women do not have a skilled attendant present at birth is by choice or accident.

In contrast, the median maternal age at first birth in PNG is 20 years, with about one woman in six having her first baby before the age of 18 years; the average number of births per woman is 4.6.14 The maternal mortality rate has been estimated at 500 per 100 000 (compared with 7.1 per 100 000 in Australia) and the perinatal mortality rate at about 66 per 1000 births (10 per 1000 in Australia).12,15 Less than 40% of births are attended by skilled attendants. Are Australia and PNG sufficiently comparable in terms of the demographics of mothers and access to health care that the same recommendations should apply to both countries?

The studies on which the WHO based the 15% recommendation 30 years ago were “limited by either having incomplete data or relying on averaged cesarean delivery rates from multiple years without accounting for year-to-year variation in these estimates”.16 To address such differences, Molina and colleagues conducted a study in 2012 using data from the World Bank’s World Development Indicators database and other reliable sources to compare neonatal and maternal mortality among the 194 WHO member states.16 To account for differences in demographics and access to health care, they adjusted their analyses for potentially influential factors such as total population, life expectancy at birth, remoteness and urbanisation, gross domestic product per capita, total health expenditure per capita, total fertility rate and national birth rate. The study’s findings suggested that the optimal international CS rate was about 19%; the global CS rate was estimated to be 19.4%.

The authors concluded that the focus of discussion about CS rates should be on “supporting safe and appropriate provision of cesarean delivery … with the intent of reducing maternal and neonatal mortality without causing overuse of procedures”.16 However, it was also clear that there is a “complex interplay between overall maternal health resources, emergency obstetrical services, and other factors”, meaning that “the [study’s derived] optimal cesarean delivery rate … may not apply to all countries because a certain level of nationally available resources may be required”.

An editorial accompanying this study commented that:

Cesarean delivery rates have long been viewed as a marker of quality, but viewed in isolation they provide inadequate information regarding the quality of practice in a health care system … rates should be considered to be only one of a number of quality criteria used to evaluate an individual or institution, and the primary goal of all obstetric services should be that of patient safety.17

Influence of demographic changes on caesarean section rates

Notwithstanding the WHO recommendation, attempts to reduce CS rates in developed countries have not worked very well,18 begging the question of why rates increased in the first place.12,1923 Purported explanations include reluctance on the part of obstetricians to manage complex vaginal births24,25 and greater numbers of women requesting caesarean delivery.26,27 More importantly, over the past two decades, there have been major changes in the demographics of women.

Of Australian women having their first child in 1993, only 26% were aged 30 years or older, and a mere 6% were aged at least 35 years. By 2013, the proportion of women having their first baby at age 30 or older had reached 45%, and 14% of first-time mothers were aged 35 years or older.12 A study of first births in South Australia over a 20-year period found that the adjusted odds for emergency caesarean delivery increased multiplicatively by more than a third for every 5-year increase in maternal age.19 The authors concluded that increasing maternal age at first birth contributed to almost 75% of the observed increase in CS and instrumental delivery. A study from Scotland reported that 38% of the increase in primary caesarean delivery from 1980 to 2005 was explained by increases in the age of women having their first baby.20 Similar findings have been reported from elsewhere in the United Kingdom21 and Europe.22 Studies undertaken in developed countries at the time the WHO recommendation was extant showed that the strongest predictor of caesarean delivery of the first baby for “low risk” women was maternal age.23 Among women whose first birth is vaginal, the rate of caesarean delivery for the next baby is around 7%,28 so primary CS rates are the single largest determinant of CS in subsequent pregnancies.29,30 For this reason, age at first birth strongly influences the overall rate of caesarean delivery for a country.

Of the 40 nations included in Molina and colleagues’ study where the mean age at first birth was 20 years or younger, 85% had an estimated CS rate below 15%.16 Unsurprisingly, of countries with a CS rate greater than 15%, less than a quarter (37 of 154) had a mean age at first birth below 20 years. In Australia, less than 5% of all births are to teenaged women, and the rate of CS in this group was 15% or less until 2002; since then, the rate has averaged 17.4%, with no significant increase since 2005 (P = 0.27) (Box 1). This is good news for teenaged mothers, because Australian women whose first birth is vaginal are overwhelmingly likely to have vaginal deliveries of all subsequent children.31 Women who have a primary caesarean delivery, however, are most likely to have all subsequent children by repeat caesarean delivery.32

The other influential demographic change is the increasing rate of obesity in women. During 2013 in Australia, in pregnancies where maternal body mass index (BMI) was recorded, more than 20% of women had a BMI of 30 kg/m2 or greater.12 Maternal obesity affects the outcome of labour and increases the risk of caesarean delivery.33,34

A longer term outlook

The outcomes informing the WHO recommendation — primarily maternal and perinatal mortality — are short term and severe. What is not considered are the longer term effects of birth on women; in particular, pelvic organ prolapse (POP) and urinary incontinence (UI) in later life. Some potential risk factors for POP and UI, such as the number of babies a woman has, the size of her babies and the woman’s BMI, are difficult to change. The most important potentially modifiable risk factor is mode of delivery. Recent estimates from the United States suggest that women face a lifetime risk of surgery for either POP or UI of 20%.35 Pelvic floor surgery for POP and UI is normally undertaken after menopause, when women are less fit for surgery, and the rate of complications for primary native tissue repair of POP has been reported to be about 15%, with an emergency reoperation rate of 1%.36 Longer term reoperation rates have been estimated to be as high as 8.9%.37

Women who have only given birth by caesarean delivery have a markedly reduced risk of objectively measured POP (5% compared with 29% after one or more vaginal births)38 and are much less likely to be symptomatic for prolapse.39 Compared with women having exclusively caesarean deliveries, women who have had their babies vaginally face a hazard ratio of 9.2 (95% CI, 7–12.1) for risk of surgery for POP.40 The hazard ratio increases to 20.9 (95% CI, 5.5–79.9) for women who have undergone a forceps vaginal delivery. Notably, as caesarean delivery has become more common in Australia, the rate of forceps vaginal delivery has decreased (Box 2). Women who have only given birth by caesarean delivery have rates of UI that are reduced by as much as half.41,42

Vaginal birth complicated by POP and UI in later life consigns women to symptoms that are often miserable to endure, last for many years, interfere markedly with quality of life and commonly lead to surgical treatments associated with much greater rates of complications and reoperation than with an initial CS. Yet the WHO documents do not refer to these outcomes at all. As the rate of caesarean delivery has increased in Australia, the incidence rate of surgery for POP and UI in women has gradually decreased (Box 3).

Another severe adverse outcome of vaginal birth is obstetric fistula. Fistula is a major public health problem in developing countries, with an incidence rate of up to one in 500 births, of which 80% result from obstructed labour.43,44 In Australia, such fistulae are almost unheard of, and the incidence rate of surgical repair for vaginal fistula, always low, is now two per 100 000 women per year, and falling (Box 4). Similarly, the rate of neonatal brachial plexus injury (Erb–Duchenne palsy) has fallen significantly in Australia, and this fall is closely correlated with caesarean delivery.45

A major concern for women is the possibility of adverse consequences in subsequent pregnancies after a caesarean delivery. In particular, complications such as placenta accreta and percreta become more common with repeat caesarean deliveries. The incidence of morbidly adherent placentation has been estimated at about one in 10 000 births in Australia, and it appears to be increasing.46 Large prospective studies have reported that increases in the odds for these and other serious complications of repeat caesarean delivery reach statistical significance at the third or subsequent caesarean delivery.4749 However, parity continues to decrease in Australia, and third or subsequent births occur for only about 20% of women (Box 5). This is not the case in most developing countries, where attempting a vaginal birth after a previous caesarean delivery has the potential to be lethal, so care to avoid unnecessary primary caesarean delivery takes on a special importance.

Conclusion

It is now clear that an idealised and universal maximum CS rate of 15% is too low. The demographic profile of Australian women makes such an achievement highly unlikely and, were it to be achieved, it would expose more women to the risk of surgery in later life. Rather than seeking to work to such a goal in Australia, we should be aiming to provide CS to all women in need and to continue including women themselves in the conversation about the benefits and disadvantages, both short and long term, of birth by caesarean delivery.

Box 1 –
Rates of caesarean delivery in Australia for women aged < 20 years compared with women aged ≥ 20 years, 1994–2013*


WHO = World Health Organization. * Shading indicates WHO-recommended caesarean section rate. Data source: Australian Institute of Health and Welfare, Australia’s mothers and babies series, http://www.aihw.gov.au/mothers-and-babies/ (accessed Dec 2016).

Box 2 –
Rates of caesarean delivery and forceps vaginal delivery in Australia, all women, 1991–2013*


* Data source: Australian Institute of Health and Welfare, Australia’s mothers and babies series, http://www.aihw.gov.au/mothers-and-babies/ (accessed Dec 2016).

Box 3 –
Incidence rates of surgical procedures for vaginal prolapse and urinary incontinence for women aged 50–69 years in Australia, 2000–2013*


* There were significant decreases in incidence rate for both categories of procedure in the period to 2013 (prolapse procedures: R = 0.72, aR2 = 0.48, P = 0.005; incontinence procedures: R = 0.88, aR2 = 0.75, P < 0.005). Data source: Australian Institute of Health and Welfare, Procedures data cubes, http://www.aihw.gov.au/hospitals-data/procedures-data-cubes/#pdc (accessed Dec 2016).

Box 4 –
Incidence rate of surgical repair for vesicovaginal and rectovaginal fistula repair in women aged 20–45 years in Australia, 2001–2013


Data source: Australian Institute of Health and Welfare, Procedures data cubes, http://www.aihw.gov.au/hospitals-data/procedures-data-cubes/#pdc (accessed Dec 2016).

Box 5 –
Parity at birth: proportion of third and fourth births in Australia, 1992–2013*


* There have been significant falls (P < 0.005) in both groups. Data source: Australian Institute of Health and Welfare, Australia’s mothers and babies series, http://www.aihw.gov.au/mothers-and-babies/ (accessed Dec 2016).

Is wearable technology an activity motivator, or a fad that wears thin?

Activity monitors may be useful for encouraging healthier lifestyles in people of all ages

In this issue of the MJA, Ewald and his co-authors report on the association between increases in daily step counts and the reduced need for hospital care among older Australians.1 Their findings confirm something international experts widely acknowledge: increasing population levels of physical activity is critical for reducing the global burden of diseases such as coronary heart disease, type 2 diabetes, and breast and colon cancers.2 With fewer than 50% of Australian adults meeting current physical activity guidelines of at least 150 minutes of moderate intensity activity per week,3 the biggest challenge faced by clinical and public health practitioners is how to increase activity levels in our largely sedentary population.

Wearable technology (eg, activity monitors such as Fitbit, Garmin, iWatch etc.) may provide the motivation needed to increase physical activity, especially among those at risk of hospitalisation. Twenty per cent of the Australian adult population (10% of those aged 65 or more) own some form of wearable technology.4 The popularity, mass market appeal, pervasiveness, and widespread availability of wearable devices, combined with their decreasing cost, provide significant opportunities for promoting physical activity in the broader community.

But can these devices increase and maintain physical activity levels in the long term? One-third of American consumers who own wearable technology stop using it after 6 months, but the underlying reasons are poorly understood.5 Did the wearers meet their goals, or did they have trouble using the technology? Most research has focused on device validity and reliability when measuring physical activity, energy expenditure and sleep in younger adult populations; a good level of validity for step measurements has been reported.6 One review that identified 11 studies in which wearable technologies have been used in physical activity interventions reported significant increases in overall activity levels.7

However, the overall effect of such devices on the health and physical activity levels of older adults is largely unknown. Wearable activity monitors are perceived as acceptable and useful by adults aged 70 or more, and older people and those with chronic illnesses are able to use these devices.8 While users may need help with setting up their device and understanding the data it collects,8 initially focusing on step data may help older adults to familiarise themselves with their operation.

Wearable technology provides a ready means for self-monitoring of clinical and behavioural data in real time,7 long regarded by health behaviour change scientists as critical for the adoption (or cessation) of particular behaviours. Researchers have integrated these technologies into different interventions to increase activity levels. A comparison of three intervention strategies (activity monitor, monitor plus cash incentives, monitor plus charity incentives) in 800 Singapore workers found that the activity monitor alone and the monitor plus charity incentives groups were significantly more active (37 and 32 minutes/week respectively) than a control group (no tracker or incentives).9 In contrast, a 24-month randomised control trial in the United States involving 471 adults compared weight loss and changes in body composition, fitness, physical activity, and dietary intake after randomisation to one of two interventions; each included group and telephone counselling, text message prompts, and website study materials. After 12 months, all participants commenced self-monitoring on a website of their diet and physical activity, while the “enhanced intervention” group also received a wearable device. Both groups experienced significant weight loss (3.5 kg and 5.9 kg in the enhanced and standard intervention groups respectively) and increased physical activity levels, but there were no significant differences between the two groups, possibly because both had employed self-monitoring, albeit in different forms.10

Several important messages are currently emerging from physical activity and health research. While individuals will monitor their own activity over time with wearable technology,7 which is important for their adopting a new physical activity or exercise regimen, the devices also have the potential to enhance the likelihood of maintaining increases in physical activity in the longer term. Features that may facilitate sustained improvement include:

  • an accompanying app that enables the wearer to easily track their activity and to receive feedback relevant to set goals;

  • social support from family and health professionals;

  • opportunities to motivate, educate and individually tailor programs;

  • prompts for desirable activity behaviours; and

  • the ability to track other health behaviours and outcomes (eg, diet, weight, heart rate).

Further investigation of wearable technology is needed, particularly in different population groups, with the aim of identifying the key factors for enhancing sustained changes in physical activity. We need to identify how these devices can be integrated into clinical practice in order to improve health outcomes. But for health practitioners with sedentary patients looking for assistance with becoming more active, a wearable activity monitor would be a good first step.

Reducing alcohol-related violence and other harm in Australia

We need to increase alcohol taxation and reduce hours of sale to reduce alcohol-related harms

Alcohol can harm drinkers and non-drinkers as a result of the acute effects of alcohol intoxication (eg, injuries, car crash deaths, assaults and suicides) and the effects of sustained heavy drinking (alcohol dependence, liver disease, heart disease, strokes and cancers). In the most recent study of the behavioural risk factors that contribute to the Australian burden of disease, alcohol was the third most important (5.1%) after tobacco smoking (9%) and high body mass (5.5%). It accounted for 28% of road traffic crash burden of disease, 24% of chronic liver disease and 23% of self-inflicted injury.1

Community concern about alcohol in recent years in Australia has focused on violence and injury in the wake of several high profile deaths of young men killed by the punches of intoxicated assailants. The efforts of parents, public health advocates and medical professionals who have to deal with alcohol-related violence have led several state governments to introduce a suite of policies to reduce alcohol-related violence. These have included legislating for shorter trading hours and the timing of last drinks in hotels and nightclubs in city entertainment precincts.2,3 There is good evidence to support some of these approaches. They ideally should be part of a package of public health-oriented policies that could substantially reduce all forms of alcohol-related harm. Critically, this includes reforming Australia’s incoherent alcohol taxation system and setting a minimum price per unit of alcohol sold.4

Earlier closing times and lockout laws have been strenuously opposed by the alcohol industry and its partners.5 Their main claim has been that these measures have restricted the personal enjoyment of the well-behaved majority, while negatively affecting responsible drinkers and small businesses in entertainment districts.6 The industry opposes any policy that reduces their profits, although there is disagreement on the extent to which early closing laws have done so.5

The hotel and nightlife industry minimises the causal role of licensed alcohol sales in producing violence.7 Its representatives have argued that alcohol-related injury and assaults are attributable to illicit drug use7 and pre-loading.6 Illicit drug users are participants in the night time economy and they are more likely to engage in violence than peers who do not use these drugs, but illicit drug use is nowhere near as prevalent as drinking to intoxication as a causal factor in violence.8,9 Illicit drug use is also much less amenable to regulation than alcohol use.

Pre-loading is undoubtedly a factor in violence around licensed premises. Many patrons of licensed premises drink to intoxication before entering an entertainment precinct, usually by purchasing cheap alcohol from bottle shops and consuming this in their homes and elsewhere before venturing out.6 Australian research has shown that pre-loading is the norm among drinkers entering entertainment precincts in New South Wales, Victoria, south-east Queensland and Western Australia.9,10

The motives for pre-loading are primarily economic; namely, drinkers aim to reduce the cost of an evening’s drinking because of the high price of drinks in licensed venues.10 Research on blood alcohol concentration in patrons of these precincts finds higher concentrations among patrons later in the evening.11 This suggests that alcohol-related harm is elevated in entertainment precincts as a result of both pre-loading and continued drinking in licensed venues.

The high prevalence of pre-loading does not mean that we should abolish laws requiring earlier venue closing. Patrons report that licensed venues contribute to pre-loading by the high prices they charge for drinks.10 These venues also contribute to alcohol-related assaults by continuing to serve intoxicated customers into the early hours. This is most clearly shown by research evidence on the public health benefits of earlier closing of licensed venues.5,12

Experience in the central area of Newcastle and in Sydney’s Darlinghurst and Kings Cross clearly shows that reducing trading hours substantially reduced violence and assaults in these areas. This was achieved without evident displacement of violence into other areas.5 The policy has also improved community amenity and as such now enjoys majority support in community surveys, including in the age group most likely to visit entertainment precincts (18–24-year-olds).13

Pre-loading, and risky drinking more generally, needs to be addressed in another way. There is considerable evidence in favour of a low cost and very efficient policy approach12 that uses taxation to increase the average price of alcohol and the lowest price of the cheapest types of alcohol sold at discounts to heavy drinkers.

This goal can be achieved by raising alcohol taxes on beverages in proportion to their alcohol content (a volumetric tax) and setting a minimum price per standard unit of alcohol. The benefits of this policy will extend beyond reducing violence in entertainment precincts; it is likely to reduce all types of alcohol-related harm in Australia.4

Contrary to a common alcohol industry argument, a volumetric alcohol tax does not punish the majority of drinkers in order to deter the minority who drink hazardously. It is a user-pays tax that has the greatest effect on heavy drinkers because they drink the most and spend the largest amount of their income on alcohol. A volumetric tax thereby extracts compensation for taxpayers for the social costs of alcohol from drinkers directly in proportion to the amount of alcohol that they consume.4

Setting a minimum unit price on alcohol prevents the alcohol industry from undermining the benefits of a volumetric tax by discounting cheap forms of alcohol that are most attractive to heavy drinkers. Alcohol taxes provide funds to offset the adverse effects that heavy drinkers have on non-drinkers via alcohol-related accidents, assaults, neglect of children, and the costs of policing drunken behaviour in public places.

It is politically unrealistic to expect that the alcohol industry will change its priorities and practices to reduce the damage caused by easy access to and heavy promotion of alcohol. The alcohol industry’s approach to public education about alcohol emphasises individual responsibility and choices. This is exemplified in the work of the industry-funded organisation — DrinkWise (https://www.drinkwise.org.au). This approach allows the industry to take credit for seemingly positive health messages while continuing to maximise their profits by promoting their product to heavy drinkers using price discounts.14

Both state and federal governments have a responsibility to reduce alcohol-related harms in Australia. The Commonwealth can and should use its taxation powers to increase the costs of alcohol and thereby reduce all types of alcohol-related harm in Australia.15 Raising alcohol prices is the most cost-effective strategy. Sadly, it remains politically unpalatable because of powerful alcohol industry opposition, especially from the South Australian wine industry, which benefits from a de facto tax subsidy in the form of an ad valorem tax on Australian wine. The export success of the Australian wine industry indicates that this form of subsidy should be phased out in the same way — over 5–10 years — that tariffs were reduced on imported motor vehicles.

The Commonwealth also has the power to more effectively regulate the advertising and promotion of alcohol via sports sponsorship and alcohol advertising during popular sporting events. The current system of so-called self-regulation of alcohol advertisements is pervaded by conflict of interest because the alcohol and advertising industries control the process of adjudicating on complaints made about advertisements. The current Alcohol Beverage Advertising Code Scheme (http://www.abac.org.au) specifically excludes sports sponsorships, and remains resistant to external criticism or complaint about alcohol sponsorship during televised sporting matches.

State governments should also make more effective use of their powers to regulate the trading hours of retail liquor outlets. The latter are now much more important than licensed premises because they sell 80% of all alcohol that is consumed,4 often at a considerable discount to the heaviest drinkers.

Australia needs a nationally coherent alcohol policy if we are to substantially reduce alcohol-related harm. This should combine cost-effective policies at both state and federal levels. State governments should use their regulatory powers to reduce bottle shop trading hours to substantially reduce all types of alcohol-related harm, including that of most public concern — alcohol-related violence in licensed venues and entertainment precincts. The federal government should discourage heavy alcohol consumption by using its taxation powers to enact a combination of a volumetric alcohol tax and a minimum unit price for alcohol.

The obesity epidemic and sugar-sweetened beverages: a taxing time

Government action is essential to improve diet

Obesity is a major and costly public health epidemic, and an Australian national health priority that requires urgent action. While obesity is a complex condition with many contributing factors, a relative excessive kilojoule intake is a major driver of weight gain. Sugar-sweetened beverages (SSBs) contribute to this excess energy intake in children and adults, are linked with obesity, diabetes and dental caries, and are an increasing focus of public health attention.

The World Health Organization guidelines recommend reducing the free sugars intake in adults and children to less than 10% of the total energy intake, and to less than 5% for best health outcomes.1 Half of the Australian population, almost 75% of people aged 9–18 years and 35% of people aged 51–70 years exceed the WHO recommendation.2 In 2011–12, Australians consumed an average of 60 g of free sugars per day (equivalent to 14 teaspoons of white sugar), with 52 g (12 teaspoons) coming from added sugars consumed through energy-dense, nutrient-poor discretionary foods and beverages.2 Males aged 14–18 years averaged 92 g (21 teaspoons) of free sugars daily, with 10% consuming 160 g (38 teaspoons), equivalent to 23% of their daily energy intake.2 Over half of free sugars come from SSBs, led by soft drinks and electrolyte and energy drinks.2 Australia is among the highest global markets for SSBs and in 2011–12, 47% of children and 31% of adults consumed them. The average daily SSB intake in male consumers aged 4–30 years was 750 mL (equivalent to two standard cans).3

Proposed regulatory interventions to reduce SSB consumption include increasing taxes, limiting advertising, health warning labelling, and reformulation to reduce sugar content. Among these, an SSB tax has received the most attention and has been implemented in a number of countries, amid strong support and equally strong opposition. So is it time to introduce an SSB tax in Australia?

Health harm

Accumulating evidence supports a substantial risk of weight gain, diabetes and dental caries with increasing consumption of SSBs. In initially non-obese adults, each daily increase of one 355 mL serving of SSB was associated with 0.5 kg greater weight gain every 4 years,4 and women with high SSB consumption gained 5.0 kg more over 8 years compared with women who decreased their SSB intake.4 Health harm of SSBs equates to 8.5 million disability-adjusted life years worldwide through adiposity-related cardiovascular diseases, cancers and diabetes.5 While this evidence is challenged by some, conclusions on SSB health harms are associated with disclosure of conflicts of interest, with authors sponsored by food companies being five times more likely to conclude no association between SSB consumption and obesity risk (in children) compared with those without industry sponsorship.6

Individual not government responsibility

A key philosophical argument centres on the consumption of SSBs as being a matter of individual choice, and regulatory intervention fostering a nanny state. However, if followed logically, such thinking calls into question government intervention to control tobacco and alcohol or promote road safety through seat belts and speed restrictions. Government intervention in these areas is often justified on the basis of limiting personal behaviours that may harm others, but there are many examples of current interventions, particularly in children and adolescents, which are implemented to protect the person, rather than to protect others. Individual rights can be equally violated if government fails to take effective and proportionate measures to remove health threats from the environment in the cause of improving population health.7 Government pays for health services and consequently has a right and duty to address externalities to promote and protect public health. Moreover, government intervention on health risks, including foods, can be justified from an economic perspective when the burden of diseases is mostly paid by society. Finally, how much autonomy do we really have in our food choices? There are numerous examples of these choices being constrained through the industry actions. Over many years, food manufacturers have increased the size of a standard SSB drink by about three-fold, knowing that larger containers alter the norm of an appropriate portion size and increase consumption.8

Opposition to taxing food is also framed in the context that food is not uniformly harmful, unlike other public health threats. In this respect, an SSB tax is best compared with alcohol taxes, since alcohol is also not uniformly harmful, with health harm related to heavy or excessive consumption, while limited consumption may pose little health risk.

Effects of an SSB tax

An SSB tax aims to encourage a healthier diet by reducing SSB consumption and promoting a shift to untaxed healthier substitutes. It may also incentivise industry to reformulate to reduce SSB sugar content. A number of countries have introduced an SSB tax. The United Kingdom intends taxing SSBs from 2018, and the Australian Greens Party committed to an SSB tax in the 2016 federal election.

Taxes are an effective public health strategy for reducing consumption and are commonly used in tobacco and alcohol control. Introduced in January 2014, Mexico’s SSB tax resulted in a 6% decline in purchases of taxed beverages over 2014 compared with pre-tax levels, reaching a 12% reduction in December 2014. This was accompanied by a 4% increase in purchases of untaxed beverages, mainly bottled water.9 The ongoing impact of this tax has been challenged with new data suggesting a small increase in sales of SSBs in 2015, but still lower than the increase in pre-tax sales. This has been reported as “a bright spot for an industry that has feared it could be cast as the next tobacco”.10 Arguments that an SSB tax is an ineffective means to reduce consumption are inconsistent with food industry claims of potential damage and job losses, which instead may point to the industry believing that a tax would substantially impact consumption.

There are concerns that an SSB tax will unfairly disadvantage lower socio-economic groups, who will continue to consume SSBs, but pay more. A recent review found the monetary impact of an SSB tax to be small, with relatively minor differences between higher and lower income households.11 The analysis of the Mexico tax found that while all socio-economic groups purchased fewer taxed beverages, the reductions were higher in low socio-economic households.9

The potential impact of an SSB tax has also been challenged on the basis that consumers will substitute SSBs with cheaper and equally unhealthy options. There is little direct evidence on substitution, and data rely on models based on self-reported consumer purchase information and price elasticity. As exemplified by Zhen and colleagues,12 overall, these studies find a reduction in energy intake and weight, with no evidence of substitution with other sugary beverages, but almost half the reduction in SSB calories may be compensated for by an increase in fat intake.

In favour of a tax are the combined health and fiscal benefits, with revenue hypothecated for promoting healthy lifestyles and obesity prevention and care. Opinion polls suggest greater population acceptability of food taxes when the health benefits are emphasized and the use of the revenue is directed to health-promoting programs.13

A recent Australian study, which modelled the long term effects of an additional 20% SSB tax, reported significant benefits on health and a reduction in health expenditure.14

The way forward

Obesity is a major health problem impacting individuals, families and society. With two in three Australians being overweight or obese, current preventive interventions centred on education to encourage voluntary individual action have failed in our pervasive obesogenic environment. Food products such as SSBs were not primarily developed to cause harm, but when harm is demonstrated, it is often denied or challenged by those with vested interests. The excessive consumption of SSBs — a high energy-dense discretionary food with no nutritional benefit, which can harm health — cannot be justified. Increasing the cost through taxation reduces consumption, no matter the product. An SSB tax alone is unlikely to be sufficient to curb obesity, but needs to be included in a multicomponent strategy.13 This is similar to tobacco control and road safety, where no single measure achieved the desired outcome.

There are considerable challenges to introducing regulatory measures to curb the obesity epidemic. Our complex and multilayered system is often used as an excuse for inaction. Industry opposition is understandable and reminiscent of the opposition to interventions to reduce tobacco consumption. In the face of the powerful industry lobby, governments are reluctant to take a decisive action, opting for ineffective soft options. Voluntary action alone will not solve this problem. There are numerous examples of government health interventions that are accepted by the public, despite strong industry opposition.

Improving the diet of Australians and reducing the intake of discretionary foods, especially those high in added sugars, will require stronger government action and leadership. An SSB tax would send a strong message that government is serious about obesity and the harms of unhealthy diets.

International organizations are increasingly acknowledging taxation as an important tool in tackling unhealthy diets.15 The 2016 report of the WHO Commission on Ending Childhood Obesity recommended implementing an SSB tax.16 It is time for a decisive government intervention, and for Australia to have an informed and comprehensive dialogue on a range of regulatory intervention to deal with the obesity epidemic. An SSB tax should be high on the list of priorities.

A sugary drinks tax could recoup some of the costs of obesity while preventing it

Obesity is a major public health problem In Australia. More than one in four adults are now classified as obese, up from one in ten in the early 1980s. And about 7% of children are obese, up from less than 2% in the 1980s.

Obesity not only affects an individual’s health and wellbeing, it imposes enormous costs on the community, through higher taxes to fund extra government spending on health and welfare and from forgone tax revenue because obese people are more likely to be unemployed.

In our new Grattan Institute report, A sugary drinks tax: recovering the community costs of obesity, we estimate community or “third party” costs of obesity were about A$5.3 billion in 2014/15.

We propose the government put a tax on sugar-sweetened beverages to recoup some of the third-party costs of obesity and reduce obesity rates. Such a tax would ensure the producers and consumers of those drinks start paying closer to the full costs of this consumption – including costs that to date have been passed on to other taxpayers. There is the added benefit of raising revenue that could be spent on obesity-prevention programs.

The scope of our proposed tax is on non-alcoholic, water-based beverages with added sugar. This includes soft drinks, flavoured mineral waters, fruit drinks, energy drinks, flavoured waters and iced teas.

While a sugary drinks tax is not a “silver bullet” solution to the obesity epidemic (that requires numerous policies and behaviour changes at an individual and population-wide level), it would help.

Why focus on sugary drinks?

Sugar-sweetened beverages are high in sugar and most contain no valuable nutrients, unlike some other processed foods such as chocolate. Most Australians, especially younger people, consume too much sugar already.

People often drink excessive amounts of sugary drinks because the body does not send appropriate “full” signals from calories consumed in liquid form. Sugar-sweetened beverages can induce hunger, and soft drink consumption at a young age can create a life-long preference for sweet foods and drinks.

We estimate, based on US evidence, about 10% of Australia’s obesity problem is due to these sugar-filled drinks.

Many countries have implemented or announced the introduction of a sugar-sweetened beverages tax including the United Kingdom, France, South Africa and parts of the United States. The overseas experience is tax reduces consumption of sugary drinks, with people mainly switching to water or diet/low-sugar alternatives.

There is strong public support in Australia for a sugar-sweetened beverages tax if the funds raised are put towards obesity prevention programs, such as making healthier food cheaper. Public health authorities, including the World Health Organisation and the Australian Medical Association, as well as advocates such as the Obesity Policy Coalition, support the introduction of a sugar-sweetened beverages tax.

What the tax would look like

We advocate taxing the sugar contained within sugar-sweetened beverages, rather than levying a tax based on the price of these drinks, because: a sugar content tax encourages manufacturers to reduce the sugar content of their drinks, it encourages consumers to buy drinks with less sugar, each gram of sugar is taxed consistently, and it deters bulk buying.

The tax should be levied on manufacturers or importers of sugar-sweetened beverages, and overseas evidence suggests it will be passed on in full to consumers.

We estimate a tax of A$0.40 per 100 grams of sugar in sugary drinks, about A$0.80 for a two-litre bottle of soft drink, will raise about A$400-$500 million per year. This will reduce consumption of sugar-sweetened beverages by about 15%, or about 10 litres per person on average. Recent Australian modelling suggests a tax could reduce obesity prevalence by about 2%.

Low-income earners consume more sugar-sweetened beverages than the rest of the population, so they will on average pay slightly more tax. But the tax burden per person is small – and consumers can also easily avoid the tax by switching to drinks such as water or artificially sweetened beverages.

People on low incomes are generally more responsive to price rises and are therefore more likely to switch to non-taxed (and healthier) beverages, so the tax may be less regressive than predicted. Although a sugar-sweetened beverages tax may be regressive in monetary terms, the greatest health benefits will flow through to low-income people due to their greater reduction in consumption and higher current rates of obesity.

The revenue could also be spent on obesity programs that benefit the disadvantaged, reducing the regressivity of the tax.

While the beverage and sugar industries are strongly opposed to any tax on sugar, their concerns are overblown. Most of the artificially sweetened drinks and waters, which will not be subject to the tax, are owned by the major beverage companies.

A sugar-sweetened beverages tax will reduce domestic demand for Australian sugar by around 50,000 tonnes, which is only about 1% of all the sugar produced in Australia. And while there may be some transition costs, this sugar could instead be sold overseas (as 80% of Australia’s sugar production already is).

A tax on sugary drinks is a public health reform whose time has come.The Conversation

Stephen Duckett, Director, Health Program, Grattan Institute and Trent Wiltshire, Associate, Grattan Institute

This article was originally published on The Conversation. Read the original article

Latest news

Young-onset colorectal cancer in New South Wales: a population-based study

The known The incidence of young-onset colorectal cancer (yCRC) is increasing in developed countries. 

The new The incidence of yCRC is currently stable in NSW. Rectal and distal colon cancer is more common in younger patients. Cancer-specific survival is better for younger than for older patients, despite more advanced disease at diagnosis. 

The implications 6% of all CRC occurs in people under 50 years of age, who are not eligible for the National Bowel Cancer Screening Program. Health professionals should be alert to alarm symptoms in younger patients that would allow earlier detection and treatment of CRC. 

In 2012, more than 1.3 million people had colorectal cancer (CRC) worldwide, and there were 694 000 associated deaths.1 While the incidence of CRC is increasing rapidly in countries with transitioning economies, probably because of increased exposure to risk factors associated with rising prosperity, including dietary and lifestyle factors,2 it appears to have plateaued in developed countries.3,4 However, recent studies in the United States and Europe57 have identified an alarming increase in incidence among adults under 50 years of age; indeed, 2–9% of all new cases of CRC worldwide are diagnosed in people under 50.4,8 In the US, certain ethnic groups, including African Americans and Hispanics, are disproportionately represented in this age group.9,10

Australia, which shares a similar Western lifestyle with the US and Europe, has the highest incidence of CRC in the world.1 However, population-based data on incidence trends and outcomes for patients under 50 years of age in Australia are limited. Conflicting findings have been reported from studies that have evaluated different time periods, and that were limited by their use of aggregated data11 or the lack of survival outcomes.12 Therefore, our aim was to conduct a population-based study that assessed the incidence of CRC in younger adults in New South Wales, the demographic and clinico-pathological characteristics of these patients, and their survival.

Methods

Study population

The study population included all cases of adenocarcinoma of the colon and rectum diagnosed in NSW (resident population [2008], 7 million) between 1 January 2001 and 31 December 2008.

Data sources

Data on newly diagnosed cases of CRC were obtained from the NSW Central Cancer Registry, a statutory registry that contains information on patient demographic characteristics, cancer diagnosis, and date and cause of death for each new case of cancer diagnosed in NSW, based on mandatory notifications by public and private hospitals. At the time of extraction in 2012, complete data were available only for 2001–2008. Mortality data were obtained from death registrations by the NSW Registry of Births Deaths and Marriages to 2012, allowing calculation of 5-year survival for the entire cohort. The diagnosis, topography and morphology for each cancer diagnosis were coded according to the International Classification of Diseases, version 10, Australian modification (ICD-10-AM) and the third edition of the World Health Organization International Classification of Diseases for Oncology (ICD-O-3).

Study outcomes and factors

The primary outcomes of interest were the incidence of CRC, trends in incidence, cancer spread at presentation, and cancer-specific survival. The main study factor of interest was age at diagnosis, dichotomised into patients under 50 years of age (young-onset colorectal cancer, yCRC) and patients aged 50 years or more. Explanatory variables examined included CRC, stratified into cancers of the colon (ICD-10-AM C18.0, C18.2–C18.9; with right colon defined as caecum [C18.0], ascending colon [C18.2] and hepatic flexure [C18.3]), the rectosigmoid (ICD-10-AM C19.9), and the rectum (ICD-10-AM C20.9); age at diagnosis; sex; country of birth; socio-economic status; and geographic remoteness. Socio-economic status, based on the postcode of residence, was derived from the Australian Bureau of Statistics’ Index of Relative Socio-economic Disadvantage13 and aggregated into quintiles, ranging from “least disadvantaged” (quintile 1) to the “most disadvantaged” (quintile 5). Similarly, area of residence was assigned to one of five categories (major cities, inner regional, outer regional, remote and very remote), based on the Accessibility and Remoteness Index of Australia (ARIA+).14 Disease spread, defined as the maximum extent of disease at diagnosis, was assessed; spread at diagnosis was defined as the maximum extent of disease, and is reported as localised, regional, distant (metastatic), or unknown.

Statistical analyses

Overall age-specific CRC incidence rates were calculated, stratified by age group and CRC type. Rates were then standardised to the NSW population at 30 June 2001 and expressed as numbers per 100 000 people. Poisson regression assessed the average annual linear trend in incidence rates of CRC by diagnosis age group, corrected for overdispersion. Crude associations between diagnosis age group and each potential risk factor for cancer were assessed in cross-tabulations and χ2 tests. Unadjusted median and 5-year survival estimates for cancer-specific mortality were determined, and presented as product limit Kaplan–Meier survival curves. The association between age at time of diagnosis and cancer-specific mortality was assessed by multivariable Cox regression, adjusted for potential confounding by explanatory variables. Proportional hazards assumptions were assessed graphically and statistically, including testing time-dependent covariates, with final models satisfying the assumptions. Adjusted hazard ratios (aHRs) and 95% confidence intervals [CIs] were calculated. Analyses were conducted in SAS 9.4 (SAS Institute) and Stata/IC 13.0 (StataCorp). P < 0.05 was deemed statistically significant.

Ethics approval

This study was approved by the NSW Population and Health Services Research Ethics Committee (reference, 2012-06-020).

Results

Demographic characteristics of the study population

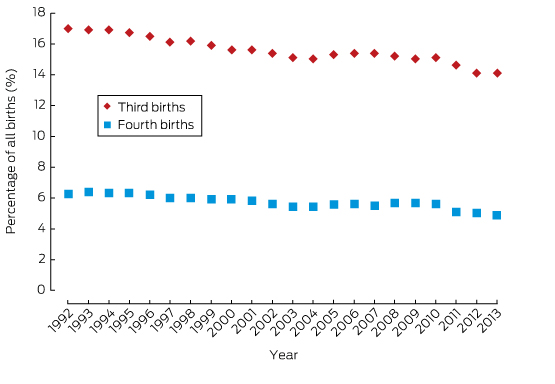
A total of 32 178 new cases of colorectal adenocarcinoma were diagnosed in NSW during 2001–2008. At diagnosis, 2001 patients (6.2%) were under 50 years of age (including 1491 [74.5%] aged 40–49 years); 30 177 patients (93.8%) were 50 years old or more. Most patients in each age group were men, and their proportion was greater among the older patients (≥ 50 years, 55.7%; < 50 years, 51.5%). A greater proportion of patients with yCRC lived in the city (72.1% v 66.9% for older patients), were born outside Australia (31.1% v 28.9%), and lived in postcodes in the lowest socio-economic quintile (19.5% v 18.1%; Box 1).

Trend in incidence of CRC

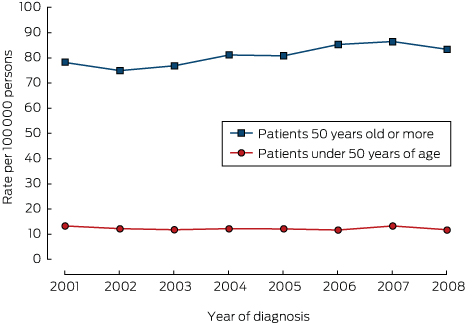
There was no significant change in the overall incidence of yCRC (2001, 13.7 cases per 100 000 population; 2008, 11.8 per 100 000; P = 0.26; Box 2). Further, there was no change in incidence in younger subsets of the yCRC cohort (under 40 years of age, P = 0.17; 40–49 years of age, P = 0.59; data not shown). For people over 50 years of age, there was a small increase in the incidence of CRC, from 79.0 per 100 000 population in 2001 to 83.4 per 100 000 in 2008 (P = 0.045; Box 2). There were no significant changes in the incidence of CRC in specific locations over time (colon, P = 0.21; rectosigmoid, P = 0.44; rectum, P = 0.85; data not shown).

Tumour site, spread and histopathology

In patients with yCRC, most tumours were in the distal colon and rectum; 71.5% of tumours were located distal to the splenic flexure. Rectal cancer was more common in those with yCRC than in older patients (34.4% v 26.0%). In contrast, tumours in the right colon were more frequent in patients over 50 years of age (28.4% v 19.3%). A higher proportion of patients with yCRC had advanced disease; distant disease was more common than in patients over 50 years of age (21.2% v 15.3%), and localised disease more frequent in patients older than 50 years (35.3% v 28.6%; Box 1).

Survival

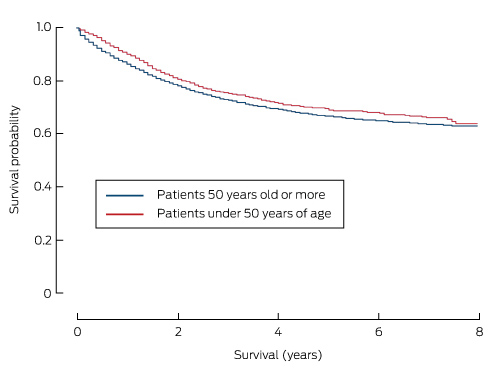
Death attributed to CRC was the most common cause of death in both age groups (Box 1). Overall 5-year survival was significantly higher for patients with yCRC (67.1% [95% CI, 64.5–69.6%] v 55.8% [95% CI, 55.0–56.4%] for those over 50 years of age; P < 0.001). As a result, patients with yCRC had a 33% lower risk of dying from their disease than those over 50 years of age (adjusted hazard ratio [aHR], 0.67; 95% CI, 0.61–0.74). Additionally, 5-year cancer-specific survival was also slightly higher for patients with yCRC (68.8% [95% CI, 66.2–71.2%]) than for those over 50 years of age (66.3% [95% CI, 65.6–67.0%]; P < 0.001; Box 3), but was similar to 5-year cancer-specific survival for patients aged 50–59 years (69.7%; 95% CI, 68.0–71.3%).

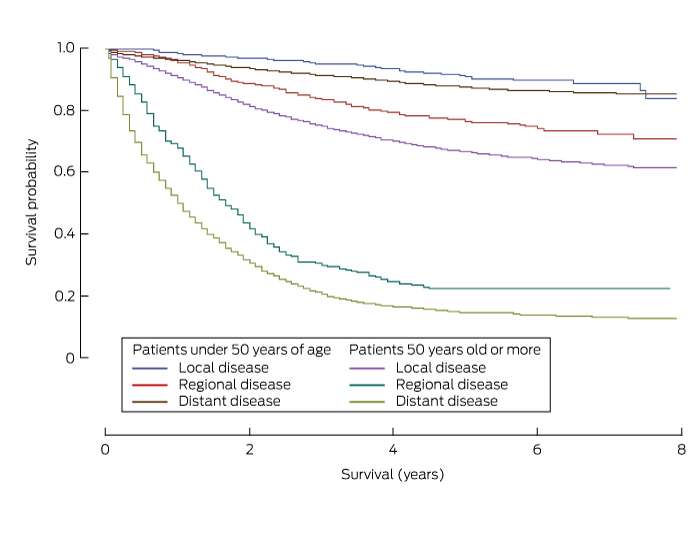
Five-year survival was consistently higher for patients with yCRC than for patients aged 50 years or more for each of the clinical, demographic and pathological parameters analysed (Box 4). Survival was also greater for patients with colon cancer than for those with rectosigmoid cancer, survival with which was in turn higher than that for patients with rectal cancer (Box 4). Additionally, 5-year survival varied significantly with spread of disease; it was highest for those with localised cancer (yCRC, 90.9% [95% CI, 87.2–93.5%]; over 50 years of age, 87.6% [95% CI, 86.7–88.4%]) than for those with regional disease (yCRC, 76.6% [95% CI, 72.7–80.0%]; over 50 years of age, 66.7% [95% CI, 65.6–67.8%]) or distant disease (yCRC, 22.3% [95% CI, 17.5–27.5%]; over 50 years of age, 14.6% [95% CI, 13.3–16.0%]) (Box 4, Box 5).

Factors associated with cancer-specific mortality in patients with yCRC

In patients with yCRC, cancer-specific mortality was higher for those from disadvantaged areas (quintile 1 v quintiles 2–4: aHR, 1.39; 95% CI, 1.16–1.92), those with increased spread of disease (regional spread v localised: aHR, 2.97; 95% CI, 2.07–4.24; distant spread v localised: aHR, 17.60; 95% CI, 12.49–24.81), and those who did not undergo surgery within 3 months of diagnosis (aHR, 1.88; 95% CI, 1.53–2.29) (Box 6). In contrast, cancer-specific mortality was lower for patients with yCRC who were born outside Australia (aHR, 0.80; 95% CI, 0.66–0.98) (Box 6).

Discussion

This population-based study shows that there was no increase during 2001–2008 in the incidence of CRC in patients less than 50 years of age. Young patients with CRC were more often from disadvantaged and urban backgrounds and born overseas than older patients with CRC, and they presented more frequently with left-sided and rectal cancers, with greater spread at diagnosis than those aged 50 years or more. However, adjusted 5-year survival for patients with yCRC was better than for older patients, and the risk of cancer-specific mortality was also significantly lower.

The overall incidence of CRC has plateaued in many developed countries.4 Indeed, both incidence and mortality have fallen in the US, and this has been attributed to screening programs, reducing exposure to risk factors, and better treatment.15 Despite these improvements, the incidence of yCRC is rising in the US5 and Europe,6 perhaps the consequence of young people being increasingly exposed earlier in life to known risk factors, including obesity, inactivity, fast food consumption, and diabetes.4,7

Australia has the highest incidence of CRC in the world1 and its urban lifestyle is similar to that of the US and Europe. Nevertheless, we did not find an increase in the incidence of yCRC across the study period. Our finding is consistent with that of another, smaller population-based study in Victoria, which found that 7% of all cases of colorectal cancer diagnosed during 2000–2010 were in people under 50 years of age, and that there had been no increase in incidence.12 In contrast, a recent analysis of aggregated 5-year data from both the National and the South Australia Cancer Registries found an increase in incidence in subgroups of patients with yCRC; specifically, an increase was noted for patients under 40 years of age, although the incidence was stable or falling in those over 40 years of age.11 This difference in reported trend is probably explained by differences in the baseline incidence rate during the two relevant study periods (1990–2010 in the South Australian study, 2001–2008 in our study).

The apparent lack of an increase in the incidence of yCRC in NSW cannot be explained by information available to our study. However, the impact of rising rates of obesity and diabetes in Australian children16 on the incidence of CRC in young adults may yet to be realised. Further, certain ethnic groups are disproportionately represented among American patients with yCRC,9,10 but differences in immigration patterns mean that the ethnic make-up of the Australian population is different.

In our study, a higher proportion of patients with yCRC than of older patients lived in cities and in lower socio-economic status postcodes. Low socio-economic status and urban residence, in addition to migration to high risk countries, have all been identified as risk factors for CRC.3,17 Patients with yCRC were more likely to present with greater spread of disease at diagnosis, with 22% having distant disease, consistent with studies that also found that younger patients had often had symptoms for several months.18,19 We were unable to determine the prevalence of symptoms in patients with yCRC, but more than 70% of tumours were distal to the splenic flexure and 34% were in the rectum, consistent with findings of previous studies,7 including one in Australia.10 Large population studies have identified that survival is poorer for patients with rectal cancers than for those with right colon tumours.20

The screening of asymptomatic individuals over 50 years of age has been credited with reducing the incidence and mortality of CRC,15 and it has been argued that screening programs should be expanded to include younger adults.21 However, we found that the rates of CRC in Australia are much lower in adults under 50 years of age (12 per 100 000 population in 2008) than in those over 50 years of age (83 per 100 000). The cost of screening for CRC in Australia is estimated to be $25 000–$41 667 for each year of life gained.22 However, the cost of each life year gained would be higher were screening extended to 40–49-year-old people, as there is a lower incidence of adenoma in younger patients.23

yCRC has been described as having a particularly aggressive phenotype, with adverse pathological features and lower survival.18,24 We found, however, that stage-adjusted cancer-specific survival in patients with yCRC was better than for older patients. Indeed, the risk of CRC-related death was 33% lower, and 5-year survival was greater. Increased survival may be the result of otherwise better general health than in older patients, or of the greater likelihood of being selected for and completing adjuvant chemotherapy treatment.17 Although encouraging, longer term (10-year) survival data are needed to confirm that this benefit is sustained, particularly as many patients with yCRC have advanced disease at diagnosis, and their condition may subsequently deteriorate if disease recurs after more than 5 years.25

The strength of our investigation was that it was a large population-based study of almost 7 million people over nearly a decade, employing robust data collection methods and long term survival data. However, there were some limitations. We did not have detailed clinical or pathology reports for each patient, and we were not able to determine the contribution of genetic conditions to CRC in the younger patients. Although major genetic components are implicated in fewer than 5% of all CRC cases, this proportion may be higher for patients with yCRC.

In conclusion, the incidence of yCRC in NSW did not increase during 2001–2008. Patients with yCRC accounted for 6% of all CRC cases; they presented with distal tumours and advanced disease more often than did older patients with CRC. People under 50 years of age are not eligible for the National Bowel Cancer Screening Program, so health professionals should be alert to alarm symptoms in younger patients (eg, persistent unexplained bleeding per rectum or change in bowel habit) that would allow earlier detection and treatment of CRC.

Box 1 –
Demographic characteristics of the study population, and clinico-pathologic characteristics of newly diagnosed cases of colorectal cancer, New South Wales, 2001–2008, by age group

Demographic and clinical characteristics

Less than 50 years old


50 years old or more


P

Total


Number

%

Number

%

Number

%


Total number of patients

2001

30 177

32 178

Age group

< 30 years

109

5.5%

109

0.3%

30–39 years

401

20.0%

501

1.2%

40–49 years

1491

74.5%

1491

4.6%

50–59 years

4747

15.7%

4747

14.8%

60–69 years

8619

28.6%

8619

26.8%

70–79 years

10 127

33.6%

10 127

31.5%

80–89 years

6003

19.9%

6003

18.7%

≥ 90 years

681

2.3%

681

2.1%

Sex

0.002

Male

1030

51.5%

16,810

55.7%

17 840

55.4%

Female

971

48.5%

13,367

44.3%

14 338

44.6%

Country of birth

0.008

Australia

1378

68.9%

21 438

71.0%

22 816

70.9%

Outside Australia

623

31.1%

8739

28.9%

9362

29.1%

Geographic remoteness

< 0.001

Major cities

1443

72.1%

20 202

66.9%

21 645

67.3%

Inner regional

414

20.7%

7442

24.7%

7856

24.4%

Outer regional

131

6.6%

2381

7.9%

2512

7.8%

Remote/very remote

13

0.6%

152

0.5%

165

0.5%

Socio-economic status (quintiles)

< 0.001

1 (least disadvantaged)

392

19.6%

6118

20.3%

6510

20.2%

2

423

21.1%

5206

17.3%

5629

17.5%

3

366

18.3%

6334

21.0%

6700

20.8%

4

430

21.5%

7064

23.4%

7494

23.3%

5 (most disadvantaged)

390

19.5%

5455

18.1%

5845

18.2%

Spread at diagnosis

< 0.001

Localised

572

28.6%

10 651

35.3%

11 223

34.9%

Regional

861

43.0%

12 605

41.8%

13 466

41.8%

Distant

444

21.2%

4621

15.3%

5065

15.7%

Unknown

124

6.2%

2300

7.6%

2424

7.5%

Tumour location

< 0.001

Colon

Right colon

386

19.3%

9029

28.4%

8967

27.9%

Transverse

104

5.2%

2284

7.1%

2260

7.0%

Left colon

120

6.0%

1885

5.9%

1898

5.9%

Sigmoid

420

21.0%

6415

19.9%

6426

20.0%

Unspecified

80

4.0%

1425

4.5%

1425

4.4%

Rectosigmoid

203

10.1%

2476

8.2%

2679

8.3%

Rectal

688

34.4%

7835

26.0%

8523

26.5%

Cause of death

< 0.001

Missing/alive

1490

74.5%

19 541

64.8%

21 031

65.4%

Colon cancer

259

12.9%

5121

17.0%

5380

16.7%

Rectal cancer

225

11.2%

2555

8.5%

2780

8.6%

Other cancer

7

0.4%

647

2.3%

654

2.0%

Non-cancer death

13

0.7%

2194

7.7%

2207

6.9%

Unknown cause of death

7

0.3%

119

0.4%

126

0.4%


Box 2 –
Incidence of colorectal cancer, New South Wales, 2001–2008, by age group


For colorectal cancer in persons under 50 years of age, each extra year was associated with an estimated 2.6% reduction in incidence (Poisson regression test for trend: exp[β] = 1.026; 95% CI, 0.985–1.068; P = 0.26); for colorectal cancer in persons aged 50 years or more, each extra year is associated with an estimated 5.0% increase in incidence (exp[β] = 1.050; 95% CI, 1.010–1.096; P = 0.045).

Box 3 –
Cancer-specific survival curves for patients with colorectal cancer, New South Wales, 2001–2008, by age group

Box 4 –
Five-year survival rates for patients with colorectal cancer, New South Wales, 2001–2008

Demographic and clinical characteristics

Five-year survival (95% CI)


P

Less than 50 years old

50 years old or more


Age group

< 0.001

< 30 years

65.6% (52.6–75.8%)

30–39 years

70.1% (64.3–75.1%)

40–49 years

68.6% (65.5–71.4%)

50–59 years

69.7% (68.0–71.3%)

60–69 years

70.2% (69.0–71.5%)

70–79 years

66.6% (65.4–67.8%)

80–89 years

58.8% (57.1–60.5%)

≥ 90 years

45.1% (38.9–51.1%)

Sex

0.03

Male

67.7% (63.9–71.1%)

65.8% (64.9–66.8%)

Female

69.2% (65.6–72.7%)

66.9% (65.9–67.9%)

Country of birth

< 0.001

Australia

66.9% (63.7–69.9%)

65.6% (64.8–66.4%)

Outside Australia

72.9% (68.4–76.9%)

68.1% (66.8–69.3%)

Geographic remoteness

< 0.001

Urban

69.6% (66.6–72.4%)

66.9% (66.0–67.7%)

Rural

66.1% (61.1–70.7%)

65.3% (64.0–66.4%)

Socio-economic status

< 0.001

Quintile 1 (least disadvantaged)

73.4% (67.6–78.3%)

68.8% (67.3–70.2%)

Quintiles 2–5

67.6% (64.7–70.3%)

65.7% (64.9–66.4%)

Cancer type

0.007

Colon

69.9% (66.4–73.0%)

66.5% (65.6–67.3%)

Rectosigmoid

67.7% (58.5–75.4%)

66.9% (64.5–69.3%)

Rectal

66.0% (61.2–70.3%)

65.7% (64.3–67.1%)

Spread at diagnosis

< 0.001

Localised

90.9% (87.2–93.5%)

87.6% (86.7–88.4%)

Regional

76.6% (72.7–80.0%)

66.7% (65.6–67.8%)

Distant

22.3% (17.5–27.5%)

14.6% (13.3–16.0%)

Colorectal surgery within 3 months of diagnosis

< 0.001

Yes

73.0% (70.2–75.6%)

70.0% (69.2–70.7%)

No

53.4% (47.4–59.1%)

52.8% (51.3–54.3%)


Box 5 –
Cancer-specific survival curves for patients with colorectal cancer, New South Wales, 2001–2008, by stage of diagnosis and age group

Box 6 –
Factors associated with cancer-specific mortality for patients with young-onset colorectal cancer, New South Wales, 2001–2008

Demographic and clinical characteristics

Deaths


Hazard ratio (95% CI)


Number

%

Crude

Adjusted*


Number of patients

481

Age group (years)

< 30 years

27

5.6%

1.11 (0.75–1.65)

1.26 (0.85–1.86)

30–39 years

98

20.3%

0.99 (0.79–1.24)

0.94 (0.75–1.17)

40–49 years

356

74.0%

1

1

Sex

Male

250

52.0%

1.02 (0.86–1.22)

1.07 (0.90–1.29)

Female

231

48.0%

1

1

Country of birth

Australia

349

72.6%

1

1

Outside Australia

132

27.4%

0.81 (0.66–0.99)

0.80 (0.66–0.98)

Geographic remoteness

Urban

337

70.1%

1

1

Rural

144

29.9%

1.14 (0.93–1.38)

0.95 (0.75–1.14)

Socio-economic status

Quintile 1 (least disadvantaged)

78

16.2%

1

1

Quintiles 2–5

403

83.8%

1.33 (1.05–1.70)

1.39 (1.16–1.92)

Cancer type

Colon

258

53.6%

1

1

Rectosigmoid

47

9.8%

0.97 (0.71–1.33)

0.82 (0.60–1.13)

Rectal

176

36.6%

1.09 (0.90–1.32)

1.18 (0.97–1.44)

Spread at diagnosis

Localised

38

7.9%

1

1

Regional

146

30.4%

2.83 (1.98–4.04)

2.97 (2.07–4.24)

Distant

271

56.3%

17.9 (12.7–25.2)

17.6 (12.5–24.8)

Colorectal surgery within 3 months of diagnosis

Yes

320

66.5%

1

1

No

161

33.4%

2.16 (1.78–2.61)

1.88 (1.53–2.29)


* Adjusted for all other factors listed in the first column. † P < 0.05.