×

Estimating the number of regular and dependent methamphetamine users in Australia, 2002–2014

During 2015, reports of problems arising from the use of the crystalline form of methamphetamine known as “ice” or “crystal” have attracted increased media, community and policy attention in Australia.1,2 There were substantially more seizures of methamphetamine at the border during this time,3 and the media reported these developments in terms of an “epidemic” of methamphetamine use. Researchers and law enforcement officials have disagreed about whether its use has increased; household survey data on the prevalence of use in the past year and surveys of drug users have been interpreted as showing that methamphetamine use has, in fact, been stable.4,5

We need credible estimates of the number of regular and dependent methamphetamine users in Australia. It is these patterns of use that are of greatest concern from both the public health and public order points of view. These groups include the users most likely to experience harms such as psychoses and serious medical problems that require hospital treatment. People who use illicit drugs heavily are not well captured in household surveys, in which less frequent use is typically reported; in the most recent national household survey, for instance, 48% of those who had used methamphetamine in the past year in Australia had used it only once.6

Our study assessed the current extent of problematic methamphetamine use in Australia by estimating the numbers of regular and dependent methamphetamine users in Australia. We used indirect prevalence estimation methods that have been widely applied in illicit drug epidemiology to estimate the size of more hidden and stigmatised groups of illicit drug users.710 Specifically, we aimed to generate:

  • annual estimates of the numbers of users and of population rates of regular and dependent methamphetamine use for the period 2002–2014; and

  • age-specific estimates of the numbers of users and of population rates of regular methamphetamine use and methamphetamine dependence over the same period.

Methods

We estimated the sizes of two populations of methamphetamine users in Australia:

  • the number of regular users: those who used the drug at least once a month during the past year;

  • the number of dependent methamphetamine users: those who have impaired control of their use, and who continue to use the drug despite the health and other adverse consequences that they might be experiencing (as defined in the World Health Organization’s International Classification of Diseases [ICD]).

It is important to note that these two populations of methamphetamine consumers overlap (with dependent users being a subgroup of those who use the drug regularly). Estimates of the sizes of these two populations of users are therefore not additive (see the section on multipliers below).

We applied indirect methods of estimation.7,8 These methods draw on different sources of data to indirectly estimate the total number of drug users.7 One indirect approach is the multiplier method; for example, multiplying the number of people who received drug treatment during a particular year (an indicator or benchmark for use) by an estimate of the proportion of dependent drug users who received treatment during the year (the multiplier) to produce an estimate of the total size of the dependent drug-using population. A worked example of an estimate generated using the multiplier method is presented in Box 1. These methods have been widely applied in research into illicit drug use to estimate relatively hidden or stigmatised patterns of illicit drug use. Their strengths and limitations have been discussed at length elsewhere.7,8

Following an extensive investigation of the most robust multipliers that could be used to estimate the number of regular and dependent methamphetamine users in Australia in 2004 (see Appendix), multiple estimates were made according to the approach described by McKetin and colleagues.11

Data sources

A number of data types were explored as potential sources of benchmark data: hospital admissions data, drug dependence treatment data, arrest data, emergency department admissions data, and ambulance service data. Of these, amphetamine dependence treatment episodes and amphetamine-related hospital separations were the only data that enabled methamphetamine-related cases to be clearly identified, and were therefore the sole data we used to generate estimates. The same conclusion was drawn in a previous Australian investigation.11 Further details on the selection of data sources are presented in the online Appendix. Analysis of benchmark data was restricted to incidents in people aged 15–54 years, the same age range covered by the data sources used to calculate the multipliers.

Treatment episodes for amphetamine use

We obtained data on publicly and non-government-funded specialised closed amphetamine treatment episodes, which are compiled by the National Minimum Data Set for Alcohol and Other Drug Treatment Services (NMDS-AODTS). We obtained data on episodes in which the main drug of concern was listed as “amphetamines” (which includes amphetamine and methamphetamine).

This dataset does not include treatment episodes undertaken in halfway houses and sobering-up shelters, correctional institutions, health promotion services (eg, needle and syringe exchange programs), acute care and psychiatric hospitals that only treat admitted patients, or private treatment agencies that do not receive government funding. Further details on the nature of the data included in the NMDS-AODTS are reported elsewhere.12

Hospital separations for amphetamine use

Hospital separations included those for a primary stimulant-related diagnosis. This included the diagnoses of “Mental and behavioural disorders due to use of other stimulants, including caffeine” (ICD-10 codes, F15.X) and “Poisoning by psychotropic drugs, not elsewhere classified — Psychostimulants with potential for use disorder” (ICD-10 code, T43.6).

Multipliers

Ideally we would have used multipliers compiled on an annual basis, but major limitations in each of the data sources we investigated for deriving multipliers prevented this, as discussed in the Appendix. Our multipliers were therefore derived from a survey of 310 regular methamphetamine users recruited from across Sydney during 2002–03 who used methamphetamine at least once a month during the 6 months prior to the interview.11 They were recruited both through advertisements and through outpatient community health services to avoid oversampling methamphetamine users in treatment or in hospital. Multipliers were also adjusted for the number of hospital and treatment events per person during the past year (that is, the annual rate of events), and were restricted to those events that would have been recorded in the benchmark data sources (Box 2).

An additional set of multipliers was calculated for the subset of 166 participants who were both regularly using and dependent on methamphetamine during the past year. Dependence was defined as having a score of 4 or greater on the Severity of Dependence Scale, which corresponds to a Diagnostic and statistical manual of mental disorders (DSM-III-R) diagnosis of severe methamphetamine dependence.13 Most dependent methamphetamine users injected the drug (76%), and were more likely to have a history of heroin use than their non-dependent counterparts (72% v 58%: odds ratio [OR], 1.9; P = 0.007).

Analyses

Multipliers were applied to the benchmark data for each financial year for which data were available (2002–03 to 2013–14). As we used two sources of benchmark data (treatment episodes and hospital separations), we obtained two estimates of the numbers of regular and dependent methamphetamine users for each financial year. We pooled these two estimates using fixed effects meta-analysis methods in Stata 13 (StataCorp).14 As the confidence intervals were skewed, we log-transformed the estimates and their confidence intervals (CIs) for the meta-analysis, and then back-transformed the estimates to obtain summary results. Finally, we generated rates per 100 population from the Australian Bureau of Statistics estimates of the resident population on 30 June for each year.

Ethics

Ethics approval for access to hospital and treatment data to generate these estimates was obtained under the National Illicit Drug Indicators Project (UNSW Human Research Ethics Committee; reference, HC13081).

Results

The pooled estimates of the numbers of regular and dependent methamphetamine users varied during the study period, but were all higher in the most recent years. It was estimated that in 2013–14 there were 268 000 regular (at least monthly) methamphetamine users (95% CI, 187 000–385 000), and 160 000 dependent users (95% CI, 110 000–232 000) aged 15–54 years (Box 3). This equates to population rates of 2.09% (95% CI, 1.45–3.00%) for regular and 1.24% (95% CI, 0.85–1.81%) for dependent use (Appendix, Figure A1; Box 4). The estimated rate in 2013–14 was higher than in 2009–10, when the rate was 0.74%, and also higher than the previous peak, 1.22% in 2006–07. The Appendix presents the estimates based on the individual data sources.

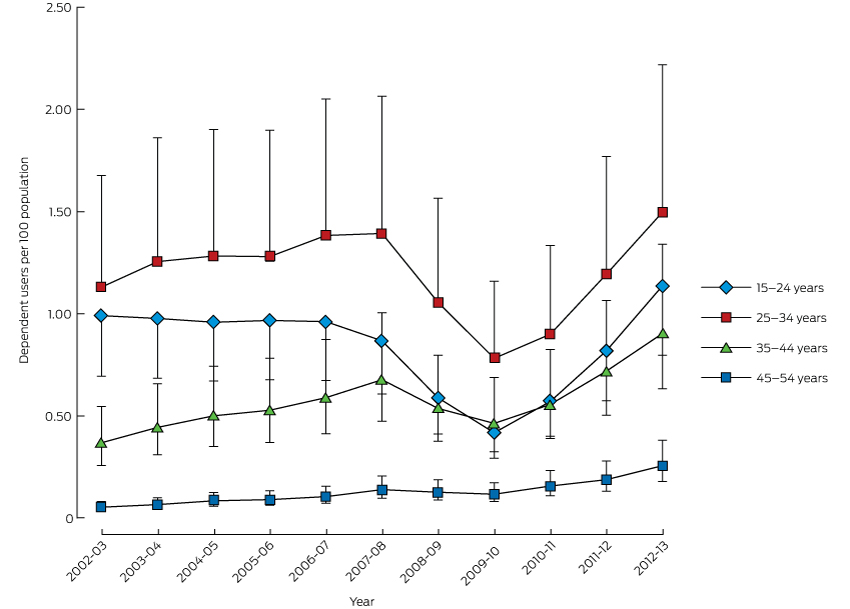
Estimates of the rates of regular and dependent use varied with age and over time (Box 5). The highest rates of use were consistently among those aged 25–34 years. In 2012–13, the estimated rate of methamphetamine dependence in this age group was 1.50% (95% CI, 1.05–2.22%). It is also important to note the recent increase in estimated dependent use among those aged 15–24 years; in 2012–13 the rate was estimated to be 1.14% (95% CI, 0.80–1.69%).

Discussion

There was a clear increase in our estimates of the numbers of dependent and regular methamphetamine users in Australia since 2010, with the largest increases in the 25–34 and 15–24-year-old age groups.

Patterns of stimulant use often show a rapid uptake among new users who initially report extremely rewarding effects that they advertise to their peers, thereby recruiting further new users. There is often a swift development of problem use among heavy users, whose doses escalate as tolerance develops; these problems typically include psychoses and dependence, and arrests for drug possession and supply. The emergence of these problems produces a rapid decline in new recruits as the high visibility of these harms becomes apparent to non-using peers.15

Recent surveys suggest that this phenomenon has occurred in Australia. Findings from the internet-administered Global Drug Survey (http://www.globaldrugsurvey.com) suggest that methamphetamine may have acquired a negative reputation among older drug users, who report lower use; the same may be true among regular ecstasy users surveyed in Australian capital cities.16 A recent analysis of Australian household surveys of drug use over the past two decades further supports the view that methamphetamine use has become increasingly stigmatised, with fewer people admitting to having used the drug, suggesting that these surveys underestimate an increasingly stigmatised form of substance use.17

Rapid uptake of methamphetamine use may still be occurring outside the largest cities, especially in regional centres where young people without prior experience of methamphetamine may be exposed to it. The available data, together with findings reported in this article, suggest a sharp increase in problematic methamphetamine use among particular subgroups (particularly young people) in Australia. These problem users require targeted and specific policy and treatment responses.

Clinical implications

There is a need for both more health services and better engagement with and retention of clients in treatment services. There are no effective pharmacotherapy options for the treatment of methamphetamine dependence.18 Best practice in treatment involves intensive application of structured psychological and behavioural therapies, such as cognitive behavioural therapies and contingency management,19 but this is not well translated into practice.20 For more entrenched dependent users, long-stay residential treatment options can produce positive short term outcomes (compared with no treatment),21 although high relapse rates after one to three years indicate that methamphetamine dependence can become chronic and relapsing.21 Ongoing engagement in treatment and improved access to evidence-based treatment options are essential for improving the health of dependent methamphetamine users.

Limitations

The use of multipliers from 2002–03 may be questioned because of changes in the type of drug used and the types of users, namely:

  • large increases in the purity of crystal methamphetamine;

  • changes in the route of administration (smoking has become the predominant route used by newer users, rather than injecting, the primary route in 2002–03); and

  • recruitment of a new cohort of younger users whose patterns of use (primarily smoking) differs from that of older injecting drug users and regular stimulant users.

These changes may have increased the rate of dependence among users, and thus increased the proportion of methamphetamine users who become regular or dependent users. Research suggests that crystal methamphetamine users are nearly twice as likely to develop dependence as those using other forms of methamphetamine.22 The same seems to be true of those who smoke rather than snort or swallow the drug.23

What effects might these changes have on the estimated number of users? For example, increased smoking of crystal methamphetamine during the past decade among people with no history of regular or problematic drug use may have increased the number of regular or dependent smokers of crystal methamphetamine who seek treatment. If so, our treatment-based multiplier, which was based on a sample of methamphetamine users who had high rates of injecting drug use and a long history of polydrug use, may overestimate the true population multiplier.

On the other hand, some treatment services report that crystal methamphetamine smokers are less likely to undergo treatment (unpublished data from the Methamphetamine Treatment Evaluation Study21). More research is needed to examine this question. If the proportion of methamphetamine users who smoke crystal methamphetamine is increasing, then our multiplier for treatment access, derived from a sample of people who mostly inject methamphetamine, may be too low. If this is the case, we have underestimated the number of problem methamphetamine users.

It might also be argued that multipliers based on surveys of methamphetamine users in Sydney are not representative for all users in Australia. For example, treatment is more available in major capital cities than in regional or remote areas, or in a smaller capital city. Our estimates of the proportion of users who are treated would then be higher in Sydney than elsewhere, making the multiplier smaller than it should be for other areas. If, for example, 10% of users in Sydney received treatment in the past year, but only 5% did so in rural centres, the Sydney multiplier would be half what it would have been in regional areas (10 in Sydney, 20 in other areas). This would mean that our estimates are conservative estimates of the national population of regular or dependent methamphetamine users.

Finally, it is important to note that there were no changes in the methods or quality of data collection during 2009–10; the reduced numbers of treatment and hospital episodes were consistent with indicators of availability and harm related to amphetamines in that period.24

Conclusions

Our estimates suggest that there have been substantial increases over the past 5 years in the numbers of regular and dependent methamphetamine users in Australia. The estimated levels of regular and dependent methamphetamine use during 2012–13 are the highest for the period examined. These increases have been most marked among young adults aged 15–34 years. The increased number of problem methamphetamine users indicates a need to expand services to redress the health problems associated with regular methamphetamine use.

Box 1 –
Hypothetical example of the estimation of the number of dependent amphetamine users based on the number of treatment episodes for amphetamine dependence


Benchmark data: the number of episodes across Australia in a given year for the treatment of amphetamine dependence.

Multiplier: the inverse of the proportion of users who are amphetamine-dependent and who received treatment in a given year.

In this hypothetical example, data suggest that 20 000 Australians received treatment for amphetamine dependence in a given year. Surveys of dependent amphetamine users indicate that 10% received treatment in this year, giving a multiplier of 10.

The estimated total number of dependent amphetamine users is the product of the benchmark data and the multiplier; ie, 20 000 Ă— 10 = 200 000 dependent users.


Box 2 –
The rate of benchmark events per 100 persons per year, and multipliers for regular and dependent methamphetamine use

Rate (95% CI)

Multiplier (95% CI)


Methamphetamine treatment

Regular users

10.8 (7.4–15.2)

9.3 (6.6–13.6)

Dependent users

18.1 (12.2–25.8)

5.5 (3.9–8.2)

Methamphetamine-related hospitalisation

Regular users

3.7 (1.9–6.6)

26.9 (15.0–53.9)

Dependent users

4.2 (1.7–8.7)

23.7 (11.5–59.0)


Derived from the study by McKetin and colleagues11 that measured the rate of key events in the previous year among regular and dependent methamphetamine users.

Box 3 –
Pooled estimates of the numbers of regular and dependent methamphetamine users aged 15–54 years in Australia, 2002–2014 (with 95% confidence intervals)*


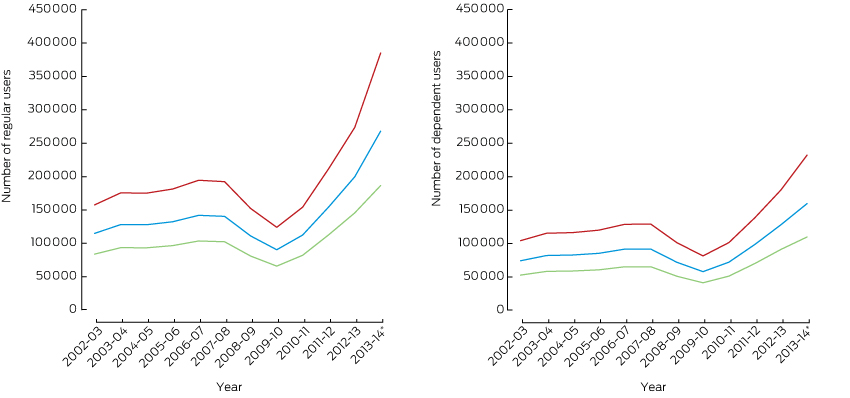
* The estimates for 2013–14 are based on indirect estimates generated from treatment data alone. Please see the Appendix for the estimates based on individual data sources. Note that the estimates of the number of people using methamphetamine regularly and the number of people dependent upon methamphetamine are not additive, as there is substantial overlap between the two populations (dependent users are a subset of the regular use group).

Box 4 –
Pooled estimates of the numbers of regular and dependent users of methamphetamine per 100 persons aged 15–54 years in Australia, 2002–2014

Regular users


Dependent users


Rate

95% CI

Rate

95% CI


2002–03

1.03

0.75–1.41

0.66

0.47–0.93

2003–04

1.14

0.83–1.56

0.73

0.52–1.02

2004–05

1.12

0.82–1.54

0.73

0.52–1.02

2005–06

1.15

0.84–1.58

0.74

0.53–1.05

2006–07

1.22

0.89–1.67

0.79

0.56–1.11

2007–08

1.19

0.86–1.62

0.78

0.55–1.09

2008–09

0.92

0.67–1.26

0.60

0.42–0.84

2009–10

0.74

0.54–1.01

0.47

0.34–0.67

2010–11

0.91

0.66–1.24

0.58

0.41–0.82

2011–12

1.23

0.90–1.69

0.79

0.56–1.11

2012–13

1.57

1.15–2.15

1.01

0.72–1.42

2013–14*

2.09

1.45–3.00

1.24

0.85–1.81


* The estimates for 2013–14 are based on indirect estimates generated from treatment data alone. Note that the estimates of the number of people using methamphetamine regularly and the number of people dependent upon methamphetamine are not additive, as there is substantial overlap between the two populations.

Box 5 –
Estimates of the numbers of dependent methamphetamine users per 100 population, by age group, in Australia, 2002–2013*


* These estimates are based upon indirect estimates generated from treatment data.

Therapeutic advances and risk factor management: our best chance to tackle dementia?

An update on research advances in this field that may help tackle this growing challenge more effectively

Increasing life expectancy has fuelled the growth in the prevalence of dementia. In 2015, there were an estimated 47 million people with dementia worldwide (including 343 000 in Australia), a number that will double every 20 years to 131 million by 2050 (900 000 in Australia).1 The global cost of dementia in 2015 was estimated to be US$818 billion.1 Low-to-middle income countries will experience the greatest rate of population ageing, and the disproportionate growth in dementia cases in these nations will be exacerbated by a relative lack of resources.

The diagnostic criteria for dementia (relabelled “major neurocognitive disorder”) of the American Diagnostic and Statistical Manual of Mental Disorders, fifth edition (DSM-5)2 include a significant decline in one or more cognitive domains that is clinically evident, that interferes with independence in everyday activities, and is not caused by delirium or other mental illness. Whether the new diagnostic label catches on remains to be seen. The most common type of dementia is Alzheimer’s disease (AD) (50–70% of patients with dementia), followed by vascular dementia (10–20%), dementia with Lewy bodies (10%) and fronto-temporal dementia (4%).3 These percentages are imprecise, as patients often present with mixed pathology.

Our discussion will focus on AD because it receives significant research attention as the most common cause of dementia. The two hallmark pathological changes associated with neuronal death in AD are deposition of β-amyloid plaques, and tau protein neurofibrillary tangles. Understanding this process has been enhanced by prospective cohort studies, such as the Australian Imaging Biomarkers and Lifestyle (AIBL) study.4 As shown in the Box, the results of this research indicate that the degree of β-amyloid deposition exceeds a predefined threshold about 17 years before the symptoms of dementia are detectable. In the absence of an alternative model, the amyloid cascade remains the most compelling hypothesis for the pathogenesis of AD. This is supported by the fact that early onset familial AD is caused by mutations in chromosome 21 that result in the production of abnormal amyloid precursor protein (APP), or by mutations in chromosomes 1 or 14 that result in abnormal presenilin, each of which increase amyloid deposition. The extra copy of chromosome 21 in Down syndrome also leads to faster amyloid deposition and the earlier onset of AD. Further, the symptoms of AD are correlated with imaging of amyloid in the living brain and with cerebrospinal fluid biomarkers that are now included in new diagnostic criteria for AD and which will enable suitable participants to be selected for trials of drugs that may prevent or modify the disease,2 in particular to determine whether anti-amyloid agents are useful for delaying or treating AD.

At present, cholinesterase inhibitors (donepezil, galantamine and rivastigmine) and the N-methyl-D-aspartate (NMDA) receptor antagonist memantine are licensed for treating AD dementia, and produce modest but measurable benefits for some patients. These medications are thought to work by increasing cholinergic signalling and reducing glutamatergic activity respectively, partially redressing neurochemical abnormalities caused by the amyloid cascade.5 More than 200 other drugs advanced to at least Phase II development between 1984 and 2014, but none has yet entered routine clinical use.6 Lack of efficacy in clinical trials may be the result of their being introduced at a rather late stage of the disease process; hippocampal damage is so profound by the time individuals present with AD dementia that attempting to slow their decline with an anti-amyloid agent may be analogous to starting statins in patients on a heart transplantation waiting list. As it provides the most compelling hypothesis for AD, the amyloid cascade remains the main target for developments in treatment. Treatment trials in people with preclinical or prodromal AD will in due course determine its validity.

Recent developments include promising results for treating prodromal AD with passive vaccines containing monoclonal antibodies directed against β-amyloid, such as solanezumab and aducanumab. This may point the way to treatments in the next decade that delay the onset of dementia in people with developing AD pathology.7,8

The identification of risk factors for AD may lead to risk reduction strategies. Recent randomised controlled trials of multidomain interventions, such as the Finnish Geriatric Intervention Study to Prevent Cognitive Impairment and Disability (FINGER) study (a 2-year program including dietary, exercise, cognitive training and vascular risk monitoring components), show that such interventions could improve or maintain cognition in at-risk older people in the general population.9 Greater risk reduction might be attained by intervening 10 to 20 years before the first clinical signs of cognitive impairment are presented. A recent review of 25 risk and protective factors associated with AD concluded that “the evidence is now strong enough to support personalized recommendations for risk reduction by increasing levels of education in young adulthood, increasing physical, cognitive and social activity throughout adulthood, reducing cardiovascular risk factors including diabetes in middle-age, through lifestyle and medication, treating depression, adopting a healthy diet and physical activity, avoiding pesticides and heavy air pollution and teaching avoidance of all potential dangers to brain health while enhancing potential protective factors”.10 These risk factors, and particularly vascular risk factors, are implicated in neurodegeneration pathology in a number of dementia processes.

While the search for effective preventive strategies and access to evidence-based pharmacological treatments and psychosocial interventions are critical, there are still delays in diagnosis and a failure to utilise existing available resources.1,3 The introduction of the federal government-funded, state-based Dementia Behaviour Management Advisory Services (DBMAS), the initiation of severe behaviour response teams, and increased funding for research should be applauded, but there needs to be greater coordination of service delivery systems for patients and carers at every stage, from prevention through to end-of-life care, and the medical profession needs to do more to ensure that all existing and trainee practitioners are well informed about what we can do for people with dementia right now.

Box –
Relationship of ß-amyloid deposition with other parameters in Alzheimer disease


Aß-amyloid = ß-amyloid; CDR = Clinical Dementia Rating. Reproduced with permission from Villemagne et al (2004).4

High fail rate raises training doubts

Assessment standards for aspiring psychiatrists are under scrutiny after less than a quarter of trainees passed a new written test.

AMA Vice President Dr Stephen Parnis has written to the Royal Australian and New Zealand College of Psychiatrists urging it to review new training and assessment arrangements after just 23 per cent of psychiatry trainees undertaking the Modified Essay Question Written Exam in August last year were awarded a pass mark.

Dr Parnis told the College the AMA had been contacted by several trainees who were “very distressed”, and had expressed significant concerns about very low pass rates for the first two groups of students sitting exams under the competency-based training program introduced in 2012.

“I understand this pass rate is much lower than experienced under the former training program,” Dr Parnis wrote, noting widespread concern among trainees that they had received insufficient support in meeting the new assessment standards, and questioning whether the exams had been “appropriately calibrated”.

“With any major overhaul of a training program, the AMA believes that it is very important for colleges to be sensitive to emerging issues, and seek to address them as a matter of urgency,” the AMA Vice President said.

Trainees complained that supervisors and Directors of Training appeared unsure about the appropriate time to sit exams, what the newly-imposed standard of ‘junior consultant’ might mean in practice, and how they should prepare differently when re-sitting an exam.

Dr Parnis also expressed concern that the College had set tight limits on the number of times a trainee can sit the exams, with those who fail to meet these requirements being asked to show cause.

“This can be incredibly stressful in the best of circumstances, and it would be most unfair on the initial cohort of trainees if they were subject to these rules and it is [subsequently] shown that there are inherent problems in assessment processes,” he said.

Dr Parnis said the AMA was generally supportive of the College’s move toward a competency-based training framework, and had been reassured by the involvement of trainee representatives in monitoring and advising on the changes.

But the experience of the trainees showed the new arrangements needed to be reviewed, he said.

“While it is obviously early days for the new assessment arrangements, the low pass rates appear to warrant further consideration and potential remedial action.”

Adrian Rollins


Reporting of health practitioners by their treating practitioner under Australia’s national mandatory reporting law

In 2010, the Australian states and territories adopted a national law requiring health practitioners, employers and education providers to report “notifiable conduct” by health practitioners to the appropriate National Health Practitioner Board through the Australian Health Practitioner Regulation Agency (AHPRA). Notifiable conduct encompasses four behaviours: (1) practising while intoxicated by alcohol or drugs; (2) sexual misconduct during the practice of the profession; (3) placing the public “at risk of substantial harm” because of an impairment; or (3) placing the public at risk because of a “significant departure from accepted professional standards”.1 Details of these rules have been published elsewhere.2,3

The mandatory notification law was received with some concern, particularly by doctors and medical professional bodies.2,4 A particularly controversial aspect was its application to practitioners who, in the course of providing care to another practitioner, form a belief that notifiable conduct has occurred. The versions of the law enacted in Western Australia and Queensland allow certain exemptions for practitioners treating other practitioners, but those in force in the other states do not.3

Critics of extending mandatory reporting to care relationships object to the perceived assault on the time-honoured ethics principle of patient confidentiality; they also worry that it will deter impaired practitioners from seeking assistance.57 Defenders of the rule argue that treating practitioners have a valuable vantage point from which to identify impaired colleagues, and that requiring them to do so protects the public and enhances trust in the health system.8

Our earlier study of 816 mandatory reports received by AHPRA over a 14-month period2 found that around 8% were made by treating practitioners. In recognition of the importance of these “treating practitioner reports” for policy and practice, we collected and analysed additional data on this subset of reports, and the outcomes of their investigation by AHPRA.

Methods

As part of a larger study of mandatory notification,2 we reviewed all reports received between 1 November 2011 and 31 January 2013. Access to the reports was subject to strict conditions guaranteeing privacy and confidentiality, and study team members signed non-disclosure agreements. The study was approved by the Human Research Ethics Committee at the University of Melbourne (reference, HREC 1239183.2).

The examined reports were from all states and territories except New South Wales, and had been lodged with AHPRA either in a notification form available on the AHPRA website or in letter form. The layout and content of the reports have been previously described.2 Although health practitioners in NSW are subject to the same reporting requirements as those in other states, AHPRA has a more limited role in relation to notifications made in NSW.2

The reports were reviewed between April and June 2013 at the AHPRA head offices in Melbourne. Three trained reviewers extracted de-identified information about the statutory grounds for notification, the type of problem reported, and practitioner characteristics and demographics. This information was supplemented with data from the national register of health practitioners, including information on sex, age, practice location, profession, and the specialties of both the reporter and the subject of the report.

All reports lodged by a treating practitioner about a practitioner-patient were flagged for more detailed review; they formed the focus of our analysis.

A senior investigator (MB) examined each flagged report to verify that it had been submitted by a treating practitioner. She also extracted any free text that discussed the health condition treated, the nature of the treatment relationship, the perceived risk, and steps the reporter took before lodging their report.

Using a grounded theory approach,9 two investigators (MB, DS) reviewed a subsample of the extracts and developed a coding scheme for deriving information on six variables from the free text: primary health condition for which the patient was being treated; the reporter–patient relationship; the timing of the risk; impediments to risk reduction; advice sought on reporting obligations; and disclosure to the patient of the intent to report. Using the finalised coding scheme, one investigator and a second, legally trained reviewer independently coded the textual extracts for all reports.

Comparison of the data coding by the two coders found inter-rater reliability that ranged from good to very good, depending on the variable. For example, the kappa (κ) score for the variable “impediments to risk reduction”, which probably involved more implicit judgment than the other variables, was 0.77.

In November 2014, the outcomes of the response by AHPRA to each case were obtained and added to the analytic dataset. This allowed 18 to 36 months to elapse after the report lodgement dates.

Statistical analyses were conducted with Stata 13.1 (StataCorp).

Results

Of 846 mandatory reports made to National Boards through AHPRA during the study period, 64 (8%) were lodged by health practitioners who had a treating relationship with the subject of the report. The others were lodged by non-treating practitioners, managers, employers or educators. All results reported here relate to the treating practitioner reports.

Sample characteristics

A large majority of the reporters (57 of 64) were doctors, and most of the practitioner-patients were nurses (41 of 64) (Box 1). Two-thirds of the reports by doctors were made by psychiatrists (26 of 57) or general practitioners (16 of 57).

The most common dyads were doctors reporting nurse-patients (35 of 64 cases) and doctors reporting doctor-patients (15 of 64 cases) (Box 2). Nurse reports about nurse-patients were relatively uncommon (5 of 64 cases), although every nurse report involved a nurse-patient.

Grounds for report

Three-quarters of the reports (47 of 64) indicated that the practitioner-patient had placed the public at risk of substantial harm because of an impairment (Box 3). One-fifth of the reports (14 of 64) indicated that the practitioner had practised while intoxicated. Only three reports were triggered by departures from professional standards or sexual misconduct.

Health condition being treated

Practitioner-patients were primarily being treated for mental illnesses (28 of 64), substance misuse disorders (25 of 64) or neurological conditions (9 of 64) (Box 3). The most common forms of mental illness were psychosis, mania and depression. The most commonly misused substances were opiates, benzodiazepines, alcohol and amphetamines.

Nature of treatment relationship

The reporter for one in five reports (14 of 64) was the patient’s regular care provider (Box 4); the others involved treatment encounters with a non-regular care provider. The most common scenario was that the reporter had assumed the role of treating practitioner in the context of an acute presentation to hospital (38 of 64 cases), usually a psychiatric admission (27 of 38 cases). The other scenarios were that the reporter was seeing the patient for the first time (9 of 64 cases) or that the treatment relationship had been established indirectly through an informal corridor consultation (3 of 64 cases).

Other aspects of reports

In most reports (46 of 64 cases), the reporter mentioned discussing the mandatory notification requirement with the patient before the report was lodged. Most reporters (56 of 64) also mentioned that they had sought advice from an indemnity insurer, lawyer, manager or professional peer before making the report.

Twenty-six of the 47 reports of impairment described a risk of harm to the public; 12 of these reports discussed only future risks, six discussed only past risks, and eight discussed both.

Nearly four in five reports (50 of 64) described an impediment to risk reduction. There were four main types of impediment. The most commonly described was that the practitioner-patient lacked insight into the risks posed to patients by conditions such as mania, psychosis, or dementia (29 of 50 cases). A second impediment was deliberate dishonesty with the treating practitioner; this most commonly arose in cases where a practitioner-patient had an addiction and intentionally provided false information to the treating practitioner in an attempt to obtain drugs of misuse (12 of 50 cases). A third impediment was deliberate disregard for treatment advice or patient safety (5 of 50 cases); for example, when a practitioner would not adhere to prescribed medicines or comply with a plan intended to protect patients during the recovery of the treated practitioner. The final impediment to safe management was an ongoing intention to self-harm with medicines that could be obtained in clinical practice (4 of 50 cases).

The 14 reports that did not describe impediments to risk reduction either contained statements indicating that the practitioner-patient had insight into their health condition and was cooperating with treatment (two of these patients had already notified themselves to AHPRA), or there was no relevant information that enabled coding of this variable.

Reponses of reports

By November 2014, National Boards had made a final decision on 86% of the treating practitioner reports (55 of 64). Boards took immediate action in 19 cases. Immediate action is a formal measure that involves placing interim restrictions on practice; it is imposed when this is considered necessary to protect the public pending further investigation.

The final outcomes were: no further regulatory action by a Board (24 of 55 cases); voluntary agreements with the Board and AHPRA regarding appropriate monitoring, treatment or practice restrictions (16 of 54); imposition of formal conditions on the practitioner’s licence (12 of 55); a fine or formal reprimand (2 of 55); and referral to another body for resolution (1 of 55). Although the most common adjudication was to take no further action, it would be erroneous to infer that reports with this outcome were inappropriate or unfounded; steps may have been taken to redress a legitimate concern after the report had been lodged and before the Board’s final decision.

Discussion

Our study of mandatory reports of notifiable conduct by treating practitioners found that 90% were made by doctors, usually psychiatrists or general practitioners, and were typically related to a practitioner-patient who was experiencing mental illness, substance misuse problems or a neurological condition. Relatively few reports were made by regular care providers. Most reports were linked with situations in which the treating practitioner was struggling to safely manage the risk that the practitioner-patient posed, and reporters usually discussed the report with the patient before submitting it.

Australia’s requirement that treating practitioners notify regulators of practitioner-patients with impairments is not unprecedented. New Zealand has required health practitioners to report impaired peers since 2003,10 and several American states have mandatory reporting obligations that extend to treating practitioners.11 However, the Australian legislation is unusually far-reaching in two respects. First, it imposes a duty to report not only health impairments, but also certain concerns about performance. Second, it does not explicitly shield treating practitioners from the obligation to report if the practitioner-patient is participating in an approved program of treatment.

Opponents of mandatory reporting argued that the new requirements would open the floodgates to over-reporting.2 This has not occurred. Mandatory reports are rare events,2 and mandatory reports by treating practitioners are especially infrequent — so infrequent, in fact, that under-reporting is probably a more justifiable concern.

The prevalence of impairment in the health workforce is unknown, but conservative estimates suggest that at least 1000 doctors (about 1% of Australia’s 90 000 registered medical practitioners) are impaired in their ability to practise at some stage in the course of any given year.1214 Our 15-month sample contained reports on only 16 doctors, and only 20% of the reports were made by the practitioner-patient’s usual care provider. Previous research in the United States and New Zealand suggests that under-reporting of impaired colleagues is widespread,15 even in the context of mandatory reporting laws. Barriers are likely to include loyalty to colleagues, concerns about over-reacting to a situation, and uncertainty about the reporting obligation.1618

A second objection to the extension of mandatory reporting into the patient–doctor relationship is that it breaches a cornerstone of medical ethics: patient confidentiality. However, the duty to maintain patient confidentiality is not absolute. It is widely accepted that it should yield to obligations to report serious problems or risks that come to light during treatment, including certain infectious diseases, health conditions that imperil driving, and signs of child abuse.19 Whether impairments that pose risks to safe clinical practice are so different from these accepted forms of reporting is debatable. Addressing this issue is beyond the scope of our study, but several aspects of our findings should inform the debate. In particular, the infrequency of treating practitioner reports and the perceived seriousness of the impairments disclosed make it difficult to distinguish the risks associated with practitioner-patient impairment from those of other accepted categories of mandatory reporting by treating practitioners.

Perhaps the most serious charge levelled at the mandatory reporting of practitioner-patients is that it will discourage medical practitioners from seeking assistance.5 This objection involves an empirical question: do the harms that result from treatment foregone because of the law exceed the harms averted by identifying impaired practitioners who would not otherwise have been recognised? Such counterfactuals are difficult to assess. Anecdotal reports suggest that the Doctors’ Health Advisory Services in some states experienced a decline in referrals after the law was enacted.6 But it is not clear whether there was a net decrease across all relevant health services; the question of causality is even less certain. Further, the deferred treatment argument presumes that impaired practitioners would still seek care in the absence of the possibility that they might be reported, but the available evidence suggests that health practitioners may have been reluctant to do so even before the introduction of the law.17,20

When discussing concerns about seeking help, it is worth noting how the reporting behaviour by treating practitioners observed in our study deviated from the exact requirements of the law. The statutory duty to report refers to a past risk of harm and, unlike mandatory reporting programs elsewhere, there is no safe harbour for cases where a practitioner-patient subsequently seeks care and takes appropriate steps to protect patient safety. The pattern of reporting we observed did not correspond with these legal requirements. When explaining their decision to report, treating practitioners were more likely to refer to a future risk of harm than to a past risk. Further, treating practitioners frequently emphasised factors that reduced their ability to work with the practitioner-patient to mutually manage the risk to the public (eg, the patient’s lack of insight, dishonesty or recklessness). Caution is required when making inferences about notifiable conduct that was not reported on the basis of what was reported, but these aspects of the reports, coupled with the very low overall rate of reporting, clearly suggest that treating practitioners resisted reporting their practitioner-patients in circumstances where their treatment was on an appropriate and promising path.

Our study has three main limitations. First, we were unable to directly measure over- and under-reporting. Second, Australia’s mandatory reporting law was implemented in concert with a variety of other major changes to health practitioner regulation, so it was not feasible to assess changes in the rate or nature of treating practitioner reports before and after the introduction of the new law. Finally, we relied on information provided in the reports for most of the variables of interest. To save time or protect confidentiality, some treating practitioners may have omitted or altered salient details. Consequently, the counts we report, particularly for variables that relied on being mentioned in the reports, should be interpreted as lower bound estimates.

Much of the policy debate on the merits of mandatory reporting by treating practitioners has been based on certain implicit assumptions. The standard narrative involves an impaired patient who recognises their illness and seeks treatment from their usual care provider, who must then reluctantly take the contentious step of reporting their patient. Our findings suggest a different picture. The debate should acknowledge several realities. In particular: treating practitioner reports are rare, very few are made in the context of an established treatment relationship, and they tend to occur in situations where there is an identified impediment to safely managing a future risk of harm within the confines of the treating relationship.

Box 1 –
Characteristics of treating practitioners and practitioner-patients involved in mandatory reports

Practitioner making the notification (treating practitioner)

Practitioner subject to the notification (practitioner-patient)


Total number

64

64

Profession

Medical practitioner

57

16

Nurse

5

41

Pharmacist

1

2

Psychologist

1

1

Other*

0

4

Status

Practitioner

64

59

Student

0

5

Sex

Male

40

20

Female

23

44

Data missing

1

0

Mean age (range), years

46 (24–62)

41 (20–81)


* Dentist, physiotherapist, medical radiation practitioner.

Box 2 –
Frequency of notifications, by professions of treating practitioner and practitioner-patient

Box 3 –
Statutory grounds for reporting, and health conditions mentioned, for 64 mandatory reports by treating practitioners

Statutory grounds for report

Number of reports


Have an impairment

47

Practised while intoxicated

14

Departure from professional standards

2

Sexual misconduct

1

Health condition being treated


Mental illness

28

Psychosis/mania

16

Depression/attempted suicide

10

Eating disorder

1

Obsessive–compulsive disorder

1

Substance misuse

25

Opiates

8

Benzodiazepines

6

Alcohol

5

Amphetamines

5

Other (cannabis, cocaine or LSD)

3

Neurological condition

9

Dementia/cognitive impairment

7

Seizures

2

Unclear

2


Box 4 –
Relationship between treating practitioner and the practitioner-patient for 64 mandatory reports by treating practitioners

Treating relationship of reporting practitioner to practitioner-patient

Number of reports


Regular care provider

14

General practice

9

Psychiatry practice

4

Infectious disease practice

1

Non-regular care provider

50

Acute care provider

38

Psychiatric admission

27

General medical admission

2

Emergency department admission

9

First assessment

8

Psychiatrist

4

Physician

3

Pharmacist

1

Psychologist

1

Informal consultation with colleague

3


Low stress resistance leads to type 2 diabetes: study

A recent study published in Diabetologia (the journal of the European Association for the Study of Diabetes) has found 18-year-old men with low stress resistance have a 50% higher risk of developing type 2 diabetes in their lifetime.

The population based study examined all 1,534,425 military conscripts in Sweden during 1969–1997 who underwent psychological assessment to determine stress resilience. They had to have had no previous diagnosis of diabetes.

They were followed up for type 2 diabetes from 1987–2012 with the maximum attained age being 62.

Related: Emergency doctors as stressed as soldiers

After adjusting for body mass index, family history of diabetes, and individual and neighbourhood socioeconomic factors, the research found 34,008 men had been diagnosed with type 2 diabetes.

The study found the 20% of men with the lowest resistance for stress were 51% more likely to have been diagnosed with diabetes than the 20% with the highest resistance to stress.

Authors Dr Casey Crump, Department of Medicine, Stanford University, Stanford, CA, USA, and colleagues in Sweden and the USA admit lifestyle behaviours related to stress including smoking, unhealthy diet and lack of physical activity could be related to the increased risk of diabetes. The study also could not make any assertions about women as it only included male army cadets.

Related: MJA – Preventing type 2 diabetes: scaling up to create a prevention system

The authors conclude: “These findings suggest that psychosocial function and ability to cope with stress may play an important long-term role in aetiological pathways for type 2 diabetes. Additional studies will be needed to elucidate the specific underlying causal factors, which may help inform more effective preventive interventions across the lifespan.”

Latest news:

[Perspectives] In the novelist’s chair

Sebastian Faulks once told an interviewer that in a different life he would have liked to be a psychiatrist. Certainly, he has not neglected psychiatry in his novels. Human Traces used factual and fictional characters to tell the story of psychiatry at the end of the 19th century, while Enderby, a darker tale, centred on the mental world of a psychopath. Now in Where My Heart Used to Beat, Faulks has returned not only to psychiatry, but also to his favourite themes of war, love, philosophy, history, consciousness, and France.

The psychopathology of James Bond and its implications for the revision of the DSM-(00)7

The release of the fifth edition of the Diagnostic and Statistical Manual of Mental Disorders (DSM-5) has been controversial.1,2 One concern is that the DSM-5 promotes overdiagnosis, encouraging the unnecessary use of medications and potential stigmatisation through diagnostic labelling that does not necessarily lead to better treatment outcomes.3 The lack of consideration for local philosophical, cultural and professional practice needs has also been raised.4 The American Psychiatric Association (APA) should be commended for providing the first thorough revision of the DSM in more than 30 years.5 However, the resulting document is now a more complicated, thicker tome than the original version published in 1952, and literally adds weight to psychiatric diagnosis. A lighter, easier-to-use DSM would be welcomed.

Given the vocal debate that has ensued following the release of DSM-5, the authors of this article feel there is some merit in making the DSM more concise, while still ensuring that the criteria are effective when diagnosing complex cases. It was agreed that revised, more parsimonious DSM criteria were required. The authors were concerned that the APA would already be preparing the DSM-6, and therefore decided to begin with the DSM-(00)7. This paper describes the development of a novel diagnosis (the Bond Adequacy Disorder), new screening criteria (the Bond Additive Descriptors of Anti-Sociality Scale), and our proposed version of the DSM-(00)7.

Methods

James Bond was selected by the authors as a suitable subject on whom to base our study of psychopathology because of his widespread acceptance among both men and women as an aspirational role model, his documented problems with both alcohol and violence,6,7 and the large amount of observational data that was accessible without exceeding our research budget (NZ$80).

Our requests for a diagnostic interview with Commander Bond and for key informant interviews with his colleagues (M, Q and Miss Moneypenny) were turned down (we assume) by MI6 on the grounds that these people were allegedly not known at that address. We were, however, able to gain access to the 50th edition boxset of James Bond video observations.8 This provided more than 45 hours of video records of the subject over a 50-year period (1962–2012), and therefore represented a unique dataset in the history of psychiatry. The observations were not limited to unrepresentative research or clinical settings, but included many opportunities for observing the subject in a range of situations, including settings of considerable stress, intimacy and confrontation, and also in a wide range of cultural settings. This dataset has previously been described in greater detail by other authors on the Amazon.com website.

We also considered the many written observational records prepared by Fleming, Amis, Gardner, Benson and Faulks. However, we found their observations to be surprisingly inconsistent with the video recordings, which we feel must take precedence. The named researchers cannot, unfortunately, be regarded as reliable observers, and seem to have applied journalistic rather than scientific approaches in their work.

In order to catalogue the behaviours exhibited by James Bond, it was agreed that the investigation team would view all 23 Bond video observational records. An initial coding framework was developed, and each observation was reviewed and the behaviours categorised. This methodology was adapted from previously published studies on James Bond; one examined the books to evaluate alcohol consumption,6 another evaluated violence in the films.7

The reviewers were also asked to note any other extreme behaviours that might be suitable for establishing a DSM diagnosis. This included behaviours that are not currently included in the DSM but might be considered criteria for the diagnosis of Bond Adequacy Disorder (BAD: a good diagnosis has at least three words in the title and a catchy acronym).

Each reviewer watched between two and ten movies, depending on the reviewer’s ability to manage what, in some cases, were quite troubling recordings. Because of distress that initial views of the material caused the first author of this article, reviewers were prescribed anxiolytics (of the ethanol class) that they could take on an as-required basis. Eight observations were viewed twice to ensure inclusion of the newly identified criteria, and one recording (“Skyfall”) was viewed in a group setting by five of the reviewers.

The initial categorisations and the newly proposed behaviours were then analysed using a general inductive approach.9 We looked for behavioural themes, and developed an initial list of potentially defining characteristics for BAD. Although we considered using statistical techniques to define behavioural categories, we found that all the behaviours were highly correlated with each other. We therefore used the Delphi method to develop the final criteria for BAD. The initial round of discussions was undertaken by e-mail; when there was significant disagreement over the appropriateness of particular behaviours, the group met to discuss and resolve these questions.

Results

The initial review of the films identified 32 significant behaviours; the list was then refined, identifying 13 key behavioural themes (Box 1).

The Delphi process was used to select the eight behaviours that were consistent with a diagnosis of BAD: sense of entitlement, use of bad puns and sexual innuendos, craving for admiration and self-centredness, sexual promiscuity, excessive fighting, taking risks with one’s own life or those of others, excessive thrill seeking, and murder. All eight behaviours must be present for the diagnosis to be confirmed. If the individual presents with further symptoms listed in Box 1, it merely reflects increased severity of the diagnosed disorder.

We elected to further simplify diagnosis by defining just two categories: BAD and Normality Disorder (ie, everyone not meeting the criteria for BAD). The Bond Additive Descriptors of Anti-Sociality Scale (BADASS) tool was created to simplify screening for BAD and Normality Disorder (Box 2).

Discussion

In the resource-limited health settings that many countries face, there is a need to increase efficiencies, including that of diagnostic screening. We have used a novel approach to refine the DSM criteria so that less time need be spent diagnosing patients and more time directed to managing their care appropriately.

It is estimated that a third of the world’s adult population suffers from a mental health disorder.10 This means that efforts to streamline care for mental health would be of benefit for patients, clinicians and health care systems in general. We have used innovative methods to define two diagnostic categories for the DSM-(00)7. There are numerous advantages to this concept, as outlined in Box 3. We cannot see any disadvantages, but nevertheless expect some to be raised in letters to the editor following the publication of our proposal.

Our findings need to be considered in the light of some limitations. The members of our Delphi group had a tendency to be conflict avoiders, so that there was 100% agreement on all questions. It would have been ideal for each observation to have been examined by at least two enthusiastic reviewers. Unfortunately, as several reviewers stated that the movies did not live up to their childhood memories, the idea of recruiting additional reviewers and ruining their childhood spy fantasies seemed cruel and perhaps unethical. It was decided each observation would initially be viewed once, with repeat views only if necessary.

Our research team is not the first to turn to James Bond for insights into personality and emotional states.1114 The popular media is awash with characters who manifest the personality traits of the dark triad of attributes exhibited by Bond. This triad is complex, comprising subclinical narcissism, psychopathy and Machiavellianism, and is traditionally associated with “bad boys” and antiheroes.13 Bond cold-bloodedly murders with a gun or even with bare hands, and this lack of empathy suggests an underlying psychopathy. His short-term relationships with women involve mate-poaching and manipulation, and his narcissism is manifested by expensive suits, perfect hair, driving expensive cars, and the ability to nonchalantly fix his tie as he walks away from a fatal scuffle or explosion.13 The development of DSM-(00)7 will make identifying and managing these types of individual more straightforward.

While we anticipate gratitude from the APA, we think it unlikely that we will be invited to contribute to the DSM-8. However, our vision for this document is to revive the diagnostic creep of past versions, albeit from the low (two-category) baseline of the DSM-(00)7. Such categories as normality disorder with psychosis, normality disorder with depression, normality disorder not otherwise specified etc would be possible and much more socially acceptable. This will have great appeal for the research community, as they will be able to build research teams (and empires) for receiving large research grants to validate the new diagnostic categories and to invent even more; eg, normality disorder with borderline traits. Our endeavours will also benefit the world of treatment. New medications and psychotherapies will need to be invented and tested to determine whether people can be made supernormal (ie, more normal than normal) or moved from being marginally normal to having a full normality disorder. The old definition of a normal person being someone you don’t know very well will be abandoned, as we will now have criteria for a positive diagnosis of normality disorder, the new normal.

The DSM-4 was followed a few years later by a revised version. To pre-empt this possibility for our new edition, we will publish a revised version of the DSM-(00)7 together with the actual DSM-(00)7. The revised DSM-(00)7 will allow people to make their own diagnosis, and will provide 140 ready-made character tweets (eg, “My BADASS says I have Normality Disorder #gettested #licencetothrill”), quizzes for Facebook, and badges that advertise a BADASS status for dating profiles. We think this will be welcomed by the anti-psychiatry lobby and by regular humans, who will now be able to self-diagnose and self-actualise with the help of the DSM-(00)7. We also believe this will broaden the considerable economic interest in the DSM, and reap even bigger profits than those generated by the DSM-5, as clinicians will feel the pressure to purchase both versions simultaneously. If the projected economic outcomes are not realised, we would be willing to revise the revised edition at a later date. We are interested only in the science of our undertaking, and making mental health understandable for the general public; we will donate any profits to the APA. We expect the APA will incorporate many aspects of the DSM-(00)7 into its later editions, and while credit is always appreciated, a complimentary copy of the DSM-8 is expected.

Areas for future research include reducing the size of other tomes that also keep expanding; for instance, we suggest reducing the size of the dictionary, which is simply too verbose.

Box 1 –
A summary of the key behaviours exhibited by James Bond in each of the 23 video observations

Deceit

Sexual contact

Risking life (self)

Risking life (others)

Attracted to women with unusual names

Entitled behaviour

Exploiting others

Lack of empathy/emotional detachment

Illegal activity*

Killing (self-defence and murder)

Fighting

Bad puns

Patronising/sexual innuendo


Dr. No

x

x

x

x

x

x

x

x

x

x

x

x

x

From Russia with Love

x

x

x

x

x

x

x

x

x

x

x

x

Goldfinger

x

x

x

x

x

x

x

x

x

x

x

x

x

Thunderball

x

x

x

x

x

x

x

x

x

x

x

You Only Live Twice

x

x

x

x

x

x

x

x

x

x

x

x

x

On Her Majesty’s Secret Service

x

x

x

x

x

x

x

x

x

x

x

x

Diamonds Are Forever

x

x

x

x

x

x

x

x

x

x

x

x

Live and Let Die

x

x

x

x

x

x

x

x

x

x

x

x

x

The Man with the Golden Gun

x

x

x

x

x

x

x

x

x

x

x

x

x

The Spy Who Loved Me

x

x

x

x

x

x

x

x

x

x

x

x

Moonraker

x

x

x

x

x

x

x

x

x

x

x

x

x

For Your Eyes Only

x

x

x

x

x

x

x

x

x

x

x

x

Octopussy

x

x

x

x

x

x

x

x

x

x

x

x

x

A View to a Kill

x

x

x

x

x

x

x

x

x

x

x

x

x

The Living Daylights

x

x

x

x

x

x

x

x

x

x

x

x

Licence to Kill

x

x

x

x

x

x

x

x

x

x

x

x

GoldenEye

x

x

x

x

x

x

x

x

x

x

x

x

x

Tomorrow Never Dies

x

x

x

x

x

x

x

x

x

x

x

x

The World is Not Enough

x

x

x

x

x

x

x

x

x

x

x

x

x

Die Another Day

x

x

x

x

x

x

x

x

x

x

x

x

x

Casino Royale

x

x

x

x

x

x

x

x

x

x

x

x

Quantum of Solace

x

x

x

x

x

x

x

x

x

x

x

x

x

Skyfall

x

x

x

x

x

x

x

x

x

x

x

x


*Includes stealing, breaking and entering etc.

Box 2 –
Bond Additive Descriptors of Anti-Sociality Scale (BADASS)

Box 3 –
Advantages of the DSM-(00)7

Domain

Advantage


Patient- and caregiver-focused

There would be little or no stigma attached to a mental health diagnosis. Indeed, we feel the community may wish to embrace their normality disorder: it will be easy, even encouraged, to Google and self-diagnose it.Parents would feel more comfortable about their children’s behaviour probably reflecting normality disorder, so that there would be no need to fret. Those parents who wanted to fret could entertain a diagnosis of BAD for their child.

Clinician-focused

Diagnosis would be simpler.Clinicians could ignore psychosocial complications.Mental health clinicians would benefit, as their consultations could focus on therapy rather than spending too much time on diagnosis. This will leave them more time to have coffee with their colleagues, helping with their lifelong learning.New categories could be developed for dual diagnosis; eg, normality disorder with psychosis, normality disorder with depression and anxiety. This would have the added benefit of normalising these conditions.

Health care organisations

Planners would like it, as they would not need to provide as many mental health resources.Insurance billing codes would be simpler and payment quicker.

Commercial entities

Normality disorder would need treating, so new drugs could be developed to improve the quality of life for those with normality disorder.Big Pharma would appreciate a new diagnostic category being created by someone else for a change.

Other

It provides a boon to the research community working on projects related to diagnosis and treatment.The concept provides more fodder for editorials about the latest controversies; this will please editors.


Mental health services reach the tipping point in Australian acute hospitals

The OECD warns about Australia’s low psychiatric bed numbers

In April 2015, the federal government released the National Mental Health Commission (NMHC) report on the Australian mental health sector.1 Although the report contained many consensus-driven, consumer-oriented proposals, the media focused on the recommended shift of $1 billion from public acute-care hospitals over 5 years to expand community mental health programs including subacute beds.2

The NMHC schedule reduces mental health funding for acute hospitals progressively from the 2017–18 financial year (Box 1).1 Given that total funding was $1.4 billion in the 2012–13 financial year, the reallocation of at least $300 million in the final year of the schedule (2021–22) could reduce the number of acute-care hospital beds by 15%.

As an independent commission, the NMHC has encouraged debate about their report. In a recent article in the Journal, Professor Ian Hickie, an NMHC Commissioner, supported “shifting the emphasis” from acute hospitals to community-based services, and he urged the federal government to act.2 The NMHC chair, Professor Allan Fels, echoed these views in his National Press Club Address in August 2015.3 He criticised federal government expenditure on acute-care hospitals as “payment for failure” and argued that mental health problems should be treated earlier to “catch people before they fall”.

The NMHC report is not without its critics. Australian peak medical bodies suggested that the cuts to acute bed numbers could cost lives. The Royal Australian and New Zealand College of Psychiatrists (RANZCP) argued that the NMHC report ignored the already excessive demand on Australia’s psychiatric wards and emergency departments (EDs).4 The Australian Medical Association (AMA) has also lobbied against acute bed closures, which can block admissions when the risks of suicide and aggression are higher.

These medical experts suggested that Australia’s mental health sector has reached the tipping point of high bed occupancy and extended ED waiting times. If this is correct, Australia needs to commission more acute psychiatric beds and maintain bed occupancy rates below 85%, in order to guarantee the safe functioning of acute hospitals.5

The debate around the public positions of the NMHC and peak medical bodies raises a series of important questions. Does Australia have too many acute psychiatric beds, and can the nation safely make savings by reducing future funding for acute hospitals? How would acute bed closures affect patient care?

The OECD warning

The NMHC report’s recommended acute bed closures would begin from a low base by international standards. Australia is ranked 26th of the 34 countries in the Organisation for Economic Co-operation and Development (OECD) for hospital psychiatric beds per 100 000 population (Box 2).6 In 2013, Australia had 29 fewer beds per 100 000 than the OECD average. Anglosphere countries such as Australia, Canada, the United States and New Zealand tended to have lower bed numbers than the wealthy European nations, with the United Kingdom showing a European influence by having 15 more beds per 100 000 than Australia.

The OECD warned that Australia’s low psychiatric bed numbers increased the risks of worsening symptoms before acute admission.6 These patient risks depended on the “tricky balance” between inpatient care, community services, primary mental health care, and social capital including cooperative networks of carers, extended families and neighbourhoods.

In Australia, the nation seeks to compensate for low acute bed numbers by funding numerous community mental health services.6 In these circumstances, community services must be able to assist patients during the acute phase of their illness either to avert admission or to help patients immediately after discharge.

As Australia’s acute bed occupancy rates are high and patients have a short average length of stay (LOS), patients are often discharged before pharmacotherapy is optimally effective (Australia’s average LOS is 17 days). The 30-day hospital unplanned readmission rate provides a measure of how well community services offset short LOS. In 2011, Australia had the third highest readmission rate among the OECD countries for patients diagnosed with schizophrenia with over 15% being readmitted to hospital within 30 days, and the fourth highest unplanned readmission rate of 15% for patients with bipolar disorder.7 Australia’s readmission rate was higher than that of the UK, where more acute beds allowed longer admissions (the UK average LOS was 30 days versus the Australian average of 17 days); this ensured adequate acute treatment in the UK, which was accompanied by lower readmission rates (5%–10%).7

There was a significant increase in UK readmission rates from 2006 to 2011, which corresponded with a period of acute bed closures.7 As Fels3 noted, the UK government was “trying to manage cutting back hospital spending” in mental health. While hospital psychiatric bed numbers remained considerably higher in the UK than in Australia, these spending cuts created debate. In 2011, distinguished community psychiatrist Professor Peter Tyrer contended that the closure of psychiatric beds had gone too far in the UK, and the risk of preventing admissions was becoming too great.8 He concluded that inpatient care had been “demonised” by community psychiatry advocates who had captured national policy, and he suggested that the UK needed new policies that recognised the unique value of inpatient care. His argument could equally well be applied to Australia.

Emergency demand

South Australian data provide evidence of the excessive mental health demand on acute hospitals. From July 2011, SA anticipated the NMHC report recommendations by transferring funding from acute hospitals to fund community subacute beds.9 Over this period, SA was the only state decommissioning recently mainstreamed acute beds; other states were increasing acute bed numbers consistent with population growth. By 2014, SA was 20% below the Australian average for non-veteran general adult acute hospital beds (for 18–65-year-olds), with double the average number of community beds.

It soon became apparent, however, that these subacute beds were not substituting for the decommissioned acute beds as intended.9 The central problem was risk management. The subacute units were built and staffed for patients at minimal risk of suicide and aggression. This meant that only patients with low-risk presentations could be referred from the community or acute hospitals to the subacute units. Before the subacute units, most of these patients would have been treated at home.

Hence, the SA psychiatric bed mix left a gap in acute care, which resulted in increasing average ED total visit times for mental health patients in metropolitan hospitals over 2011–2014 (Box 3). Average ED visit times peaked at 15.7 hours in October 2014. These average ED visit times reflected the extended periods that mental health patients waited for admission (33.5 hours for mental health patients on average versus 9.3 hours for non-mental health patients in 2014). Of particular concern, 2450 mental health patients waited more than 24 hours in busy and overstimulating ED environments during 2014 (representing 17.5% of the mental health presentations to SA hospital EDs).10

Responding to patient need and community concern, in December 2014, the SA government commissioned 20 beds in metropolitan hospitals to return the state to the national average. The government’s revised strategy targeted investment towards psychiatric short-stay units in acute hospitals (14 beds) allowing up to 48-hour admissions. Early signs were positive, especially in those hospitals with the short-stay beds. For instance, average ED visit times reduced from 12.3 hours in 2014 to 6.7 hours during 2015 following the opening of 8 short-stay psychiatry beds at Flinders Medical Centre in December 2014. The short-stay units provided a dedicated environment for acute presentations enabling improved ED flow, which regional subacute beds had been unable to achieve.

Conclusion

Australia’s low acute bed numbers can block access for mental health patients when the risks of suicide and aggression are higher. The OECD 30-day readmission rates and the SA experience suggest that these problems are not being offset by Australia’s numerous community mental health services, including the expansion of subacute beds in SA. Overall, the data support RANZCP and AMA concerns that Australian acute hospitals are facing excessive mental health demand.

When ED waiting times and 30-day readmission rates are excessive, it is not possible to safely reduce acute hospital funding and close beds. Quite the opposite policy is required; more acute beds should be commissioned when mental health patients are waiting far longer for admission than medical or surgical patients, as occurred recently in SA. Clinical opinion suggests that these issues are not isolated to SA but are occurring in acute hospitals around the country. It is time for policy planners to reflect on the OECD warning, and urgently tackle this huge national problem.

The federal government convened an Expert Reference Group to provide a fresh perspective on the NMHC report. This presents Prime Minister Malcolm Turnbull and the government with an ideal opportunity to carefully evaluate mental health demand on acute hospitals, and to ensure adequate activity-based funding for acute psychiatric beds. This expenditure should not be regarded as “payment for failure”; it is a minimal investment in the compassionate care of mental health patients when they are most unwell, which is the standard required in every area of medicine in Australia.

Box 1 –
The National Mental Health Commission schedule for reducing acute hospital funding1

Financial year

Minimum reallocation ($ million)


2017–18

$100

2018–19

$150

2019–20

$200

2020–21

$250

2021–22

$300

Total

$1000


Box 2 –
Comparison of psychiatric bed numbers in Organisation for Economic Co-operation and Development (OECD) countries, 20116


1. In Japan, a high number of psychiatric care beds are used by long-stay patients. 2. In the Netherlands, psychiatric bed numbers include social care sector beds that may not be included as psychiatric beds in other countries. Source: OECD Health Statistics 2013. http://dx.doi.org/10.1787/health-data-en. Reproduced with permission from the OECD.

Box 3 –
Mean total visit times for mental health patients in the emergency departments (EDs) of South Australian metropolitan hospitals (2011–2015)10

Time period

Mean total ED visit time (hours)


July – December 2011

8.9

January – June 2012

8.4

July – December 2012

10.2

January – June 2013

10.2

July – December 2013

11.4

January – June 2014

12.3

July – December 2014

14.5

January – August 2015

11.5


Hospital doctors’ Opinions regarding educational Utility, public Sentiment and career Effects of Medical television Dramas: the HOUSE MD study

A career in medicine has long been considered an apprenticeship, with mentors providing guidance to their trainees. The word mentor finds its origins in Greek mythology. In Homer’s Odyssey, the confidant of king Odysseus, Mentor, was trusted to guide his son and oversee his education while Odysseus fought in the Trojan War.1

The modern practice of medicine, with an emphasis on shift work, has made the classical mentor–mentee relationship more challenging,2 but the modelling of one’s practice on observed social and clinical traits of a mentor or role model remains.3 Moreover, such exposures can be factors in students’ decisions to pursue a career in medicine and even in their subsequent choice of specialty.4

The eventual choice of role model is often a personal one and may not even involve one’s own supervising senior, although it is often based on clinical experiences.5 While knowledge and clinical competence have been cornerstones of role model selection, growing evidence suggests that factors relating to personality such as compassion, good communication and enthusiasm may in fact have more influence on the expanding minds of trainees.6 Further compounding this, in some educational situations, less than half of senior clinicians were subsequently identified as being excellent role models.7

While social interactions with parents, teachers or even peers may impact on personality, outlook and practice, other media such as literature and television (TV) have been demonstrated to be significant components of this role model hypothesis.8

Medical TV programs have grown in popularity from the 1960s onwards and are now considered a staple of primetime TV.9 It has only been in more recent years that the effects of these health and illness TV narratives have been studied in greater detail.

Although their true purpose has been one of entertainment, much of their appeal is based on the perception that they are an accurate reflection of reality.10

It has been well accepted that TV can have an impact on society, increasing knowledge and influencing behaviour.11 TV medical dramas have also been shown to be of educational worth to patients12 and even doctors.13

However, they have occasionally come under criticism for unrealistic medical content, ranging from demonstration of intubation technique14 to cardiopulmonary resuscitation (CPR).15 Frequently, in CPR situations on TV compared with actual practice, there is a higher volume of trauma cases as an underlying aetiology. Further, these scenarios often show considerably younger patients than those seen in routine CPR and survival to discharge is much better than clinically encountered.16 Concerns that this may influence the attitudes of members of the public who watch these dramas for educational purposes remain.

More recently, there has been a growing emphasis on the use of these programs as educational resources.17 In particular, some of the established role model personality traits such as ethical astuteness, communication and empathy have been sufficiently demonstrated in these series to warrant use in undergraduate teaching videos.18 Although much of the learning that can be gleaned from observing the practices of TV doctors has focused on perceived softer undergraduate educational domains,19 their use in postgraduate settings is also increasing.20

TV is a medium through which many health care workers not only take their minds off work, but also reflect both consciously and unconsciously on experiences. Students and doctors do indeed watch these programs at least as often as the general public does and, when questioned, are quite positive regarding them.21 Although not yet demonstrated, watching these series may form an early part of any role modelling or identification with certain character traits that both trainee and established medical practitioners may have.

Methods

A structured questionnaire was distributed among doctors of all grades and specialties in three large teaching hospitals in Wales, United Kingdom (Morriston Hospital, Singleton Hospital and Princess of Wales Hospital) within the Abertawe Bro Morgannwg (ABM) University Health Board, to allow capture of data from a diverse range of specialties. These were disseminated through various different locations, including departmental meetings and on-call rooms.

Questions related to respondents’ gender, specialty and grade, whether they watched medical TV dramas and their opinions regarding them, and whether they identified with characters from these programs (and if so, who) or with a non-fictional doctor encountered during their clinical careers.

Hospital grades were summarised as consultant, specialist trainee (registrar), core trainee (resident medical officer [RMO]), and foundation doctor (intern). For simplification, specialties was separated into medical, surgical, acute (eg, accident and emergency, intensive care unit, etc) and non-acute (eg, pathology, radiology, etc), although note was made of individual subspecialty answers from within these broader categories.

Statistical analysis

A cumulative odds ordinal logistic regression with proportional odds was run to determine the effect of grade and specialty on the choice and frequency of viewing of medical TV dramas. Statistical significance was set at P < 0.05. Statistical calculations were performed using SPSS Statistics, version 21.0 (IBM).

Ethics approval

Ethics approval was granted by the ABM University Health Board Research and Development Joint Scientific Review Committee.

Results

Three hundred and seventy-two questionnaires were disseminated and 200 completed questionnaires were returned (response rate, 54%). Forty-six per cent of individuals completing questionnaires were women and 88% had graduated from a UK medical school. Grades and specialties of respondents are presented in Box 1.

How often do clinicians watch TV medical dramas?

One hundred and twenty-nine doctors (65%) surveyed admitted to watching TV medical dramas on more than one occasion and 14% considered themselves to be regular viewers; 15% of respondents felt that watching them as a school student positively influenced their decision to pursue a medical career.

Junior doctors were five times more likely to have watched these programs as medical students compared with more senior doctors (odds ratio [OR], 5.2; 95% CI, 2.5–10; P < 0.01). The ORs for RMOs and specialist trainees were 3.1 and 2.5, respectively, in relation to consultants (P < 0.05). Further, UK graduates were five times more likely to have watched these medical TV dramas as medical students compared with non-UK graduates (OR, 4.8; 95% CI, 2.4–9.6; P < 0.01).

The most commonly watched TV programs were Scrubs (49%), House MD (35%) and ER (21%). Most doctors who admitted to watching medical dramas did so for entertainment purposes (69%); 19% watched because there was nothing else on TV; 5% for insight into media perceptions of medical practice; and 8% for educational purposes.

Clinicians’ opinions regarding TV medical dramas

We asked individuals if they felt that TV medical dramas were educational, gave doctors a bad name, accurately showed the doctor–nurse relationship, and represented the spectrum of illnesses commonly encountered.

One hundred and three respondents (52%) felt that these shows displayed no educational value whatsoever, 52 (26%) were unsure, and 45 (23%) believed there were some educational benefits from watching them.

Evaluating the spectrum of illness represented in these dramas, 82% felt that those shown were unrealistic of daily practice. However, 20 respondents (10%) thought that they accurately portrayed reality. Most of these positive responses (16/20) were from junior doctors. No associations between the belief that medical dramas portrayed realistic life situations and specialty or frequency of viewing were observed.

Grade, specialty and country of qualification had no effect on whether a doctor believed that the programs represented current medical practice. Neither did current frequent watching or having been a regular viewer at undergraduate level.

Twenty-seven per cent of doctors surveyed felt that these programs gave doctors a bad name, although no significant differences were observed between any of the groups.

Only 13% of respondents felt that medical dramas accurately portrayed the doctor–nurse relationship, most of whom were self-admitted non-regular viewers (P = 0.01) and general practitioners or GP trainees (19/25; P = 0.05).

Outcomes of watching TV medical dramas

Thirty per cent of foundation doctors (interns) and 25% of core trainees (RMOs) felt that watching medical TV programs may have affected their career choice (to any extent) compared with more senior doctors (18%).

Compared with consultants, the OR for interns considering that watching medical TV dramas had any effect on their subsequent career choices was 4.8 (95% CI, 1.6–13.7; P = 0.013); for RMOs and specialist trainees, the ORs were 2.5 (95% CI, 1.3–5.8) and 2.7 (95% CI, 1.3–5.8) respectively; P = 0.09 and 0.13).

Specialty and country of qualification did not influence doctors’ beliefs that watching medical dramas had an effect on their career choice.

Clinicians’ identification with doctors in TV medical dramas?

A total of 121 respondents (61%) role modelled aspects of their practice on another doctor (fictional and non-fictional).

Junior doctors, particularly interns and RMOs were more likely to find commonality in their practice with fictional TV characters compared with more senior doctors (OR, 2.7; 95% CI, 1.3–5.8; P = 0.008).

Consultants were most likely not to specify any role models and, if they did so, were more likely to identify themselves with non-fictional characters (32/55) compared with other doctors, particularly interns (4/49).

Medical doctors were more likely to identify themselves with a fictional TV character (OR, 3.2; 95% CI, 1.08–9.43; P = 0.035). This was followed by 19% of acute specialty doctors and 14% of surgical specialty doctors. Non-acute specialty doctors were least likely to identify themselves with a fictional TV doctor.

The top five most popular fictional role models are shown in Box 2. Leonard McCoy (Star Trek) and Quincy (Quincy ME) were the most popular choices among consultants; the majority of positive responders were anaesthetists and pathologists. A more varied response was seen among physicians and surgeons, but note was made of a peculiar popular choice: Dr Evil (from the Austin Powers film series, Box 3) was named by four trainees, all surgical (three orthopaedic and one general surgery).

Discussion

There is a known association between clinical role models in undergraduate medicine and career choice.22 Therefore, TV medical dramas could potentially influence doctors’ and students’ opinions and have been found to be a source of entertainment for both health care professionals as well as the wider public.23

Fictional doctors have evolved into television heroes and much of their appeal is their on-screen personality as well as, in some cases, their absolute prioritisation of scientific challenge over social relationships.24 Further, much of their appeal is their ability to navigate through difficult ethical dilemmas, to make decisions that are often perceived by clinical trainees as being positive ones.25

Although clinicians watching these programs appear to do so predominantly for entertainment purposes, we found that those who watch for educational reasons show that junior trainees exposed to this genre of TV entertainment are more influenced by these series than their more senior counterparts. Interestingly, all respondents who admitted to watching TV medical dramas for educational reasons watched House MD (Box 4), perhaps suggesting that they value its learning input.

In keeping with previous studies,1416 most doctors felt that a large proportion of what was televised may not be a true representation of clinical practice; however, suggestions that more junior trainees believe this to be so could be explained by their relative lack of clinical experiences to date.

Identifying aspects of one’s practice with witnessed exposures has been a cornerstone of the role modelling theory, but data generated from this questionnaire-based study suggest some interesting differences between specialties. Doctors who answered negatively to currently viewing or having ever viewed this type of program were least likely to admit to having been influenced into a career in medicine on the basis of TV medical dramas, thus validating the data.

It is to be assumed that consultants may look on their past seniors as role models to identify commonality of practice but the high proportion of respondents among all grades who admitted to being influenced, at least in part, by medical TV dramas suggests a much higher effect than anticipated.

Further, differences between specialities — for example, medical doctors identifying more with TV doctors compared with their surgical peers — might be explained by the sizeable volume of medically themed programs as opposed to more surgical ones. It is plausible, however, that some of the core learning traits seen in physicianly specialties, particularly regarding difficult diagnostics and ethical dilemmas, strike a chord with this group of clinicians. Specific choice of TV doctor hero as a potential role model will require further evaluation. Motivations for the popular choice of a Star Trek character among anaesthetists may include an interest in futuristic technology. Likewise, the interesting preference for Dr Evil among some surgical trainees may be due to an interest in world and/or career domination, or it may be suggestive of professional ambition rather than a display of true megalomaniac traits.

While we may be some years from continuing medical education creditation obtained from Saturday evening viewing, this study does suggest that the current generation of junior doctors relies on medical TV dramas for entertainment and education in parallel. Further observation may show some interesting effects during career progression, particularly regarding the atypical answers we received to our questions about TV doctor identification.

Box 1 –
Grade and specialty of respondents (n = 200)

Grade and specialty

No. (%)


Grade

Intern

49 (24.5%)

Core trainee (RMO)

60 (30.0%)

Registrar (specialist trainee)

36 (18.0%)

Consultant

55 (27.5%)

Specialty

Medical

83 (41.5%)

Surgical

36 (18.0%)

Acute non-medical

27 (13.5%)

Non-acute

20 (10.0%)

GP or GP trainee

34 (17.0%)


RMO = resident medical officer.

Box 2 –
Most popular fictional television doctor role models

Rank

Doctor

Show

Most popular among:


1

Elliot Reid

Scrubs

Women, junior trainees

2

Perry Cox

Scrubs

Specialist trainees, physicians

3

Leonard McCoy

Star Trek

Consultants, anaesthetists

4

John Carter

ER

Physicians, acute specialties

5

R Quincy

Quincy ME

Consultants, non-acute specialties (pathologists)


Box 3 –
Dr Evil (Austin Powers film series) was an interesting selection among some surgical trainees (Getty Images)

Box 4 –
House MD was considered the most educational among respondents (Getty Images)