×

Why don’t we speak openly about doctor suicides?

Why don’t we speak openly about doctor suicides?


Just over a week ago, I read an obituary in a medical publication about a young talented and clearly lovely junior doctor. Her life and achievements were celebrated, but no mention was made of the cause of her untimely death. Some colleagues and I surmised it was suicide, but then we wondered why it was it was not mentioned in the obituary.  Subsequently, suicide was confirmed, but at the time it felt as though there was an embargo on talking about doctor suicide. There is a shame about discussing it in public, and if this is the case, how can we possibly learn about the things that lead to suicide in our colleagues? We discuss medical cases openly so that we might learn, but why not of our colleagues who reach a point of no return?

It is well known that doctors do have a higher rate of suicide than the general public. These results have been reported as being up to 5.7 times higher than the general public. Female doctors are at the greatest risk with rates 2.27 – 5.7 times higher.

These results are staggering, but the fact that we have suicide at all in the profession is indicative of a deep dis-ease in our profession.

How is it that we can have people who are caring by nature, who choose to do medicine to care for people, but ending up so despairing that they take their own life?

And worse, that their colleagues and medical friends do not notice their decline to that point and are often completely surprised to hear of the death of a colleague in such a fashion?

These suicide statistics have been known for some time, yet until now, no true action has been undertaken.

In response to recent matters, last month the NSW Health Minister Brad Hazzard, instructed his staff that they have one month to come up with a plan for the doctor suicide crisis. It is great to see urgency brought to this matter, but is one month really enough and will it really get to the root of the cause?

What we are looking at here are ingrained issues, where for so long suicide has been accepted as a “sad yet inevitable”, or an “occupational hazard”. I was taught the statistics as though it was an inevitability that could not be altered. But is this really the case, and is this the way we would or ought to approach other health issues?

As doctors, we care about the health of people in medicine, yet we do not appear to be taking the same care and attention to the health of people in our own medical community.

Doctor suicide occurs within the context of the health care system and culture

Increasingly the culture of medicine is being revealed as replete with bullying and harassment. Far from caring for health care professionals, the culture of medicine is that of judgement, critique, condemnation, blaming and shaming. There is no true care and attention brought to the health and well-being of doctors and we are not trained in any suitable way how to deal with the emotional demands of the job, nor are we taught how to look after our own health and well-being.

Medicine is not a culture of peer support, but rather of peer competition and judgement. Any sign of human vulnerability and feelings is seen as a sign of failure. Medicine teaches you to be a “doctor” and not who you are as a human being. You are taught to “toughen up”. You learn that only the tough survive. There is stigma for those with mental health issues. People become isolated, hiding what they are going through. There are definitely some cultural factors that need addressing.

I have heard it said more than once that medicine is more stressful than being in the army or in a war zone, and that there is more compassion for your well-being when you are a soldier. In such a harsh environment, does it really surprise us that people do not survive?

As health care experts, why are doctors ‘surviving’ and not thriving?

Doctor suicide is the end of a long line of health issues for doctors, who are well known to have worse mental health than the general population on a number of counts. For every doctor who actually dies by suicide there are many who make an attempt but survive. Statistics show that  40-55% of the profession are burnt out with all of the personal health issues that entails such as higher rates of cardiovascular disease, anxiety, depression, diabetes, musculoskeletal disorders and suicidal thoughts. 25% of the profession have thought about killing themselves.

Doctor suicide exists in a longstanding culture that is well established to be uncaring and, at times, frankly abusive towards its own professionals. Suicide is an absolute tragedy but the day-to-day ill health of the medical profession is also a serious issue that needs to be recognised.

If we are serious about dealing with doctor suicide, we need to address the entire medical culture and system including the educational, medico-legal and regulatory aspects as well as personal factors at play. We need to be willing to make the needed changes. But we cannot do that until we are completely open about it and willing to examine the issue in absolute fullness.

Given the long association of suicide with the medical profession, there is clearly something amiss and thus something that can potentially be rectified. Let’s not look for short term solutions. Let’s aim to truly address the situation in full and get to the roots of the matter. Lives depend on it.

Dr Maxine Szramka is a Sydney-based rheumatologist and Clinical Senior Lecturer at the University of Wollongong. She blogs regularly at Dr Maxine Speaks.

Doctorportal hosts a dedicated doctors’ health service providing support and information about suicide prevention in the medical community.

For support and information about suicide prevention, call Lifeline on 13 11 14

A systematic review and meta-analysis of treatments for acrophobia

Acrophobia (irrational fear of heights) is a chronic disorder that may have a serious impact on people’s lives, inhibiting their ability to perform everyday tasks such as climbing a flight of stairs, standing near a balcony, or parking a car in a high-rise building, as well as interfering with recreational activities. Phobias are common in the community. Studies in developed countries that are similar to Australia have reported the prevalence of acrophobia,14 In the epidemiologic catchment area study, which comprised 20 000 participants across five sites in the United States,3 4.7% of participants fulfilled the criteria for a diagnosis of acrophobia. Comparable studies in Germany and Sweden have shown similar results.1,4 Additionally, 13% of patients presenting to their general practitioners in New Zealand have phobias, and 2.4% of these are situational phobias (eg, water, heights, flying).2 Our aim here was to assess the efficacy of the treatments for acrophobia by conducting a systematic review. This is the first systematic review on treatment for acrophobia. We have written it according to the PRISMA checklist.5

Methods

Protocol and registration

Details of the protocol, including the search strategy for this systematic review were registered on the international prospective register of systematic reviews, PROSPERO.6 We wished to examine all parallel-arm and crossover randomised controlled trials (RCTs), and controlled trials that met our participants, intervention, control and outcomes (the PICO model) eligibility criteria (anyone with acrophobia or a fear of heights, any psychological or medication intervention, control or waitlist, and outcome on questionnaire or behavioural avoidance test [BAT]). Eligible studies involved people with acrophobia or those with a fear of heights of any age. We wished to assess the effectiveness of any intervention against any comparison. We looked at studies from 1946 onwards, published, unpublished and in any language.

Information sources — the search

The search was conducted by the Cochrane Common Mental Disorders Group on 1 December 2015. It covered the Cochrane Common Mental Disorders Group — Specialised Register (CCMD-CTR; all years to date), Cochrane Central Register of Controlled Trials (CENTRAL; all years to date), PsycINFO (all years to date), MEDLINE (1950 to the present) and Embase (1980 to the present). Reports of trials were also sourced from international trials registers courtesy of the World Health Organization’s International Clinical Trials Registry Platform (ICTRP) and the United States National Institutes of Health registry and results database, ClinicalTrials.gov. The search terms were for RCTs involving participants with acrophobia or a fear of heights.

We attempted to contact the authors of all included studies and authors of ongoing studies in search of additional studies to include in the review, and we scanned the reference lists of included studies for any additional and relevant studies. We searched for grey literature studies that we identified and inter-library loan requests were placed where the abstracts were unavailable online. Two of us (B A and H W) selected the studies from abstracts. Studies were excluded if the they had fewer than 20 participants with acrophobia to avoid pilot studies and underpowered treatment studies. Full articles were obtained where there was disagreement or uncertainty.

The data were extracted in duplicate by H W and all the other authors. This included the PICOs, funding sources, dropouts, sources of bias and presence of a BAT. Data from crossover design trials were only extracted before the first crossover. We used the Cochrane Collaboration tool to assess the risk of bias (Table 8.5.a in the Cochrane handbook for systematic reviews of interventions7), which covers sequence generation; allocation concealment; blinding; incomplete outcome data (eg, dropouts and withdrawals); and selective outcome reporting and other categories of bias (we added sample size calculation).7 The extracted data were synthesised using RevMan 5.3.5 (the review management software used for preparing and maintaining Cochrane Reviews). If continuous data were reported without corresponding estimates of variance (standard deviations), we assigned these data a standard deviation by using the largest standard deviation available from intervention and control groups, respectively, from other studies (using the same measurement instruments) to be included in the same analysis, for the most conservative approach using RevMan 5.3.5 software.

Studies were added to meta-analyses (pooling) if any two or more studies using the same intervention reported the same outcomes. Pooled analyses were performed by computing standardised mean differences (SMDs) for continuous outcomes using a random-effects model to take the most conservative approach. We chose the SMD because it is the standard output in RevMan 5.3.5. We reported numbers needed to treat and relative risks. Measures of heterogeneity, including I2 (which gives the percentage of variance in a meta-analysis that is attributable to study heterogeneity) were calculated (an I2 > 50% suggests significant heterogeneity). No sub-group analyses were planned or performed.

Results

We identified 16 studies for the years 1973 to 2016 in 15 articles for inclusion in the review (the 1985 article by Marshall included two studies8). Appendix 1 (online at mja.com.au) summarises the search results.922 The most common reason why studies were excluded after reviewing full-text articles was because they had fewer than 20 participants with acrophobia. The specific reasons for study exclusion are available on request. At the time of the review, 15 studies were published1022 and one was a conference abstract.9 Appendix 2 (online at mja.com.au) summarises the characteristics of included trials.

There were five broad categories of intervention: desensitisation (DS); in vivo exposure (IVE); virtual reality exposure (VRE); neurolinguistic programming (NLP);23 and VRE with medication. The medications studied were not primary treatments for phobias, but were intended to augment the cognitive processes underlying exposure therapy. There were variations within each of the broad groups with co-interventions, such as prolonged exposure therapy with coping self-statements8 and other interventions such as negative practice (compared against DS).18 The main interventions used in included studies are summarised in Box 1.

While NLP has characteristics of imaginal exposure, we chose to consider it separately as it is not described in the literature as imaginal exposure and it has very brief intervention durations. There were three studies of VRE with the addition of medication at different times during therapy. Comparison groups for VRE with medication studies varied widely from waitlist controls to participants receiving VRE and other treatments.

The methods used to measure outcomes in the studies also varied. All used questionnaires, and most also used a BAT. Certain standard questionnaires were commonly used. One example is the Acrophobia Questionnaire (AQ), which describes 20 situations and assesses levels of avoidance (scores, 0–3) and anxiety (scores, 0–6). This scale is a widely used measure of acrophobia and has been reported to have adequate retest reliability and validity.21,24 Another commonly used instrument was the Attitudes Towards Heights Questionnaire (ATHQ), which includes six heights situations and assesses attitudes towards these situations on a scale of 0–10. The internal consistency and validity of this questionnaire are reported to be “acceptable”.21,25

BAT involved exposing clients to a real-life height situation and gauging their anxiety, often using the subjective units of discomfort scale (SUDS), which provides a measure of the clients’ current anxiety or discomfort.26 Each study that used a BAT chose one that was suitable to its own locality; there appears to be no standard BAT. One study used the Heights Interpretation Questionnaire, which is validated against actual heights.

Most interventions (including DS therapy, VRE therapy, negative practice and IVE therapy) tested against a waitlist control group (ie, no intervention) were shown to be superior.10,14,18,20,27 However, when the control group was one receiving another intervention, the trend was towards equivalence. NLP was trialled in a single study, which showed it to be superior to a meditation-based control.9 Recent studies have also examined the use of medication therapies in conjunction with VRE therapy for acrophobia.12,19,21 One such study has shown a benefit for the use of hydrocortisone in conjunction with VRE, and another showed a benefit over placebo of administering d-cycloserine before exposure to VRE.12,19 No benefit has been shown for giving d-cycloserine after VRE.21

The results of our meta-analytic pooling are shown in Appendix 3 (online at mja.com.au). IVE and DS were effective in the short term when pooled. We use short term to mean outcomes measured in the immediate post-treatment period. IVE was not effective in the longer term follow-up analysis (follow-up for IVE studies ranged from 1 to 9 months, with a median follow-up of 1 month). VRE therapy was effective when measured with the ATHQ scale, but not when measured with the AQ. DS and VRE had no reported follow-up data. Studies comparing their intervention with another similar intervention rather than using a control group was a major limiting factor. Most comparisons of interventions showed equivalence of effect. Also, two studies failed to report the numbers of participants in their intervention and comparison groups, reporting only the total number of participants. In these cases we estimated the numbers of participants in groups by dividing the total number of participants by the number of study groups to perform the meta-analysis.8,18

Nine studies included an actual BAT,11,12,14,1618,22,28 and two studies included a virtual BAT (where the height exposure was in a virtual environment, rather than a physical one).12,21 Many of these studies also required clients to be unable to complete the BAT successfully (ie, reach the highest fear stimulus without a high degree of anxiety) to participate in the study. The findings for the BAT were the same as those found by the questionnaires for all but two studies. These were: Krijn (2004),14 where the BAT showed superiority of VRE over waitlist controls while the AQ showed equivalence; and de Quervain (2011),12 where VRE plus hydrocortisone therapy showed equivalence with VRE plus placebo on the BAT, but showed superiority on the AQ.12,14

Only three studies reported dichotomous outcomes.9,22,27 The number needed to treat (NNT) for improvement with guided mastery DS versus DS alone was 2.6 (95% CI, 1–15) participants.22 For IVE therapy versus waitlist control, the NNT to show improvement was 2.8 (95% CI, 1.5–16.5). When oppositional actions (Box 1) were added to the guided mastery, the NNT to show improvement was 1.427 (95% CI, 1.0–2.2), and for the rapid phobia NLP, the NNT to show improvement was 6.0 (95% CI, 2.8–35.5).9 The forest plots of our comparisons are shown in Box 2, Box 3 and Box 4 and in Appendix 4 (online at mja.com.au), and the findings they illustrate are summarised in Appendix 3 (online at mja.com.au).

The assessment of risk of bias is shown in Appendix 5 (online at mja.com.au). Most articles did not report enough information in their methods to enable us to make an adequate assessment of bias. Most did not describe the randomisation process or the attempts to conceal randomisation, the methods for blinding outcome, whether or not an outcome was primary (on which the sample size calculation was conducted) or secondary, and how resentful demoralisation was managed (those in the control group being upset at not being in the intervention group).29 Only three studies reported their sample size calculation.9,21,27

Discussion

The results of our pooled analysis suggest that DS, IVE, and VRE exposure are probably effective treatments, at least in the short term. Single studies showed that NLP, negative practice, and variations on IVE therapy trialled with oppositional actions, coping self-statements, and exposure with guided mastery were superior to comparison interventions. The case for the effectiveness of these interventions would be stronger if there were more studies on each intervention.

Overall, the literature shows a trend towards faster treatments with fewer visits. For example, a 1973 study used 12 to 14 visits10 while a 2013 study required two 60-minute visits21 and a 2015 study required a single 15-minute visit.9 Appendix 2 (online at mja.com.au) shows that the median duration of therapy from 1980 to 1999 was 218 minutes and for 2000 to 2016 was 60 minutes. Another trend in therapy for acrophobia is the movement away from DS and IVE towards the use of virtual reality equipment. Such technology makes exposure therapy more accessible and easier for therapists to deliver. Finally, the use of medications to enhance the process of fear extinction is becoming more common, and has shown promising results when coupled with VRE.12,19,21 d-Cycloserine is a partial agonist of the N-methyl-d-aspartate glutamatergic receptor, and is thought to enhance the learning process underlying the extinction of fear, and corticosteroid hydrocortisone is also thought to speed the fear extinction process.12,19,21

Strengths and limitations

There are several strengths to our review, which we believe is the first to compare all treatments for acrophobia. We used broad inclusion criteria, and the studies included are representative of the existing body of literature. We also contacted all authors of included and ongoing studies in search of unpublished articles.

A limitation of our review is that only three studies had a power calculation.9,21,27 Power to detect differences was frequently undermined by dividing study participants into multiple small intervention groups (eg, 50 participants divided into five groups) and then reporting equivalence.11 A larger study may have shown differences in larger subgroups. There has been longstanding concern about this undermining of the power to detect differences in the psychological literature.30 Studies also reported numerous outcomes, and it was not clear which were primary and which were secondary. This, coupled with the lack of power calculation, made it difficult to determine the validity of the findings of each study.

Inadequate sample size was a common problem, as can be seen in the comparison in Box 2, B.9 The 1995 study by Menzies and Clarke had 49 participants, and a non-significant effect size of −0.28. To achieve a significant effect size of 0.42, with the same means and standard deviations, would have required 96 participants. In addition to the sources of potential biases (elaborated in Appendix 5, online at mja.com.au), intention-to-treat analyses were rarely reported, and only one study9 was designed according to a guideline for RCTs (the CONSORT statement).5 In addition, very few studies reported dichotomous outcomes, which are best understood by therapists.9,22,27 The proportion of participants who show improvement in their acrophobia is an important figure for clinicians to be able to judge effectiveness and to inform clients about potential benefits of therapy. Older studies also tended to report their results in the form of F tests, without publishing empirical data in any form (table, graph, or text), which limited our ability to compare studies and impairs the ability of readers to fully comprehend the results.

While there is a large array of studies and interventions in this area, our review provides a true overview of the literature. There are many sources of heterogeneity, including the use of different questionnaires for measuring outcomes, the presence or absence of a BAT, unclear sources of bias and small sample sizes. Our decision to exclude studies with fewer than 20 participants resulted in four papers being excluded (details of these studies and an assessment of their risk of bias are summarised in Appendix 6, online at mja.com.au). We made this decision when we were checking the abstracts and realised that some of the articles had very small sample sizes (19, 18, 12 and six participants, and there was no extractable data in any of these studies). The total number of participants in the included studies was 811 so the participants in the four excluded studies made up 7% of those in all the studies. Publication bias frequently occurs when small studies with positive results are published and small studies with negative results are not. Including the small studies would have not significantly increased the statistical power, but would have increased the risk of publication bias.

Comparison with existing literature

To our knowledge, there are no previously published reviews on acrophobia alone. There is a 2008 review of psychological therapies of a range of phobias, which found that treatments involving in vivo contact with the phobic target outperformed alternative modes of exposure (eg, imaginal exposure, virtual reality, etc.) at post-treatment but not at follow-up.31 This is broadly similar to our findings in this review focusing on acrophobia.

Implications for practice

There is a range of therapies that are effective for acrophobia, but the lack of adequately powered comparative studies makes it impossible to say which are the more effective treatments. IVE therapy and DS seem to be consistently effective. IVE therapy may be equivalent to VRE, so as the technology for VRE therapy becomes more available, it may become the first-line therapy because it can be performed in the clinician’s office and has high acceptability. NLP has also been shown to be a brief, effective treatment, easily delivered with minimal training required for practitioners, so this too may prove a popular choice for clients and clinicians alike.

Implications for research

The use of reporting guidelines such as the CONSORT statement would increase the quality of published papers.28 Such reporting would make clear what were primary outcomes and what were not. The inclusion of sample size calculations along with larger sample sizes would give more confidence in findings, especially when no difference is found.32 Larger studies comparing two treatments would help clinicians decide which treatment to employ first. This may require studies using an inferiority analysis.28,33 Dichotomous outcomes need to be reported to enable NNT to be calculated.

Box 1 –
Glossary of the main interventions used in included studies

Desensitisation

  • A therapy that trains clients in self-control and relaxation methods, and then slowly exposes them to simulated fearful situations (either pictured or imagined for the studies included in our review).10,19

In vivo exposure

  • A therapy that involves exposing clients to real-world height scenarios while maintaining their anxiety at controlled levels.13,23

Virtual reality exposure

  • Therapies that involve exposing clients to computer-generated height scenarios while maintaining their anxiety at controlled levels.13,21,23

Neurolinguistic programming

  • A therapy that helps clients to safely expose themselves to a chosen heights experience, in a manner similar to VRE, but using the participant’s imagination of a real experience rather than computer software.9

Negative practice

  • A technique believed to help clients learn to control their anxiety symptoms (such as muscle tension, trembling, etc) by learning to produce them voluntarily while receiving the therapist’s assistance in modifying them.
  • Clients are instructed to practice repeatedly producing and modifying the symptoms involved in their fear responses.
  • “Positive practice” — attempting to inhibit phobic anxiety — is prohibited until all negative practice sessions are completed.
  • At the completion of negative practice treatment, clients are instructed to begin attempting to control their actual anxiety.

Oppositional actions

  • Actions that increase the threat stimulus in an exposure situation.
  • An example would be having participants place their hands behind their backs as they looked over the railing of a balcony one floor from the ground (a “low dose” of the phobic target).

Box 2 –
Participants treated with in vivo exposure (IVE) v controls

Box 3 –
Participants treated with virtual reality exposure (VRE) v waitlist controls

Box 4 –
Participants treated with desensitisation (DS) v waitlist controls

Physical comorbidities of post-traumatic stress disorder in Australian Vietnam War veterans

The known Post-traumatic stress disorder (PTSD) is associated with poor physical health, but few analyses of the relationship have been controlled for trauma exposure. 

The new This is the first study to find that several comorbidities are associated with PTSD in older veterans by comparing the veterans with a trauma-exposed control group. These associations remained after adjusting for potential confounding factors. 

The implications PTSD should be viewed as a systemic disorder rather than a purely psychological disorder. Integrated health care strategies for improving psychological and physical health, as well as controlling risk factors, could improve the quality of life and survival of patients. 

Post-traumatic stress disorder (PTSD) is a disabling mental health condition that can develop following exposure to a traumatic event. People with PTSD experience a range of psychological symptoms, including intrusive memories, significant changes in cognition, mood, arousal and reactivity, as well as persistent avoidance of reminders of the traumatic event. The disorder can compromise personal behaviour, including the ability to maintain employment, relationships, and general self-care.

PTSD is common among combat veterans. Investigation of Australian veterans of the Vietnam War has found a lifetime prevalence of 20.9%,1 similar to the estimated prevalence of war-zone PTSD among United States Vietnam War veterans of 17.0%.2 The prevalence of PTSD among Australians who served in Iraq or Afghanistan is 16.5%,3 and the 12-month prevalence among veterans of Australian peacekeeping missions is as high as 16.8%.4

In addition to significant psychological effects, PTSD is associated with considerable physical comorbidity.57 Veterans with PTSD are more likely to suffer from physical illness and chronic disease than the general population or veterans without PTSD.5,7 Specifically, PTSD has been associated with gastrointestinal disease,7 respiratory disease,8 musculoskeletal, renal and autoimmune diseases,9 and with cardiovascular disease (CVD); veterans with PTSD have a higher prevalence of myocardial infarction (MI) and increased CVD mortality.10 PTSD is also associated with sleep disturbances, with nightmares and insomnia being common. More recently, an increased prevalence of obstructive sleep apnoea (OSA) was also reported.11 Responses to chronic stress in PTSD, such as increased substance misuse, poor diet and inactivity, have the potential to further harm health.12

Many studies investigating the impact of PTSD on health have examined the prevalence of certain disorders in people with PTSD. However, most have relied on self-reported data, and have not applied a clear definition of trauma exposure in their control groups, making it unclear whether the measured health effects were associated with PTSD or with trauma. We therefore compared self-reported and objective clinical health data for a group of Australian Vietnam War veterans with PTSD and a control group of veterans exposed to trauma but not suffering PTSD.

Methods

Participants

Male veterans who had served in the Australian or New Zealand armed services in Vietnam during the Vietnam War were recruited between February 2014 and July 2015 by a specialised veteran mental health unit at Greenslopes Private Hospital in Brisbane through the Gallipoli Medical Research Foundation and Returned and Services League of Australia (RSL) websites, through RSL publications and newspaper and television advertisements, and by word of mouth. Written informed consent was obtained from participants in advance. Enrolment was stratified by likely PTSD diagnosis. The study was conducted at the Gallipoli Medical Research Institute.

Data collection, management and quality assurance

Participants were assessed by a psychiatrist experienced in diagnosing and treating veterans with PTSD; they were classified as ever having had PTSD (currently or in the past) or not. Participants also underwent assessment by a psychologist using the Clinician-Administered PTSD Scale for DSM-5 (CAPS-5), the Depression Anxiety Stress Scale (DASS-21), the Alcohol Use Disorders Identification Test (AUDIT), and the Montreal Cognitive Assessment (MoCA). A structured comprehensive medical history was obtained and a clinical examination conducted by a medical officer. Sleep information was obtained with structured questionnaires, the Berlin Questionnaire for assessing risk of OSA, and the Epworth Sleepiness Scale (ESS). A brief description of all validated questionnaires is provided in the online Appendix 1, table 1.

Electrocardiography (ECG), respiratory function tests, liver transient elastography, fasting abdominal ultrasonography, and computed tomography for coronary artery calcium (CAC) were conducted, and fasting blood pathology assessed.

All data were entered and stored in a Microsoft Excel database. Data quality was ensured by routine database checks and a random chart audit.

Statistical analysis

Outcomes statistically associated with PTSD status were identified, followed by regression analysis of outcomes associated with PTSD to exclude the effects of confounding variables and to evaluate the association of depression or anxiety symptoms with outcomes. Odds ratios (ORs) were calculated for binary data outcomes, and continuous data were compared in unpaired Student’s t tests. For variables directly related to medication use (blood pressure, serum lipid levels, glycated haemoglobin [HbA1c], serum glucose and testosterone levels; online Appendix 1, table 2), the statistical significance of a PTSD diagnosis as a predictor independent of medication was assessed by multiple linear regression, with relevant drug use as a fixed binary predictor (yes v no). Categorical data (CAC score strata) were compared in a Fisher exact test. Medical conditions that were not presented by any participants were excluded from analysis. All tests were two-tailed; to correct for multiple testing at this top-level comparison, statistical significance levels were adjusted with the Benjamini–Hochberg method.13

Two regression models were then developed. Model 1 used forward/backward stepwise regression, with seven potential confounders (age, body mass index [BMI], smoking pack-year history, AUDIT score, marital status, employment status, highest education level) and PTSD diagnosis offered into the model in an additive manner to test whether these factors accounted for the association between the PTSD diagnosis and individual comorbidities. Model 2 included the same set of confounders and the PTSD diagnosis, as well as DASS-21 depression and anxiety scores, to test whether symptoms of depression or anxiety accounted for the association between the PTSD diagnosis and individual comorbidities.

All analyses were performed in R 3.1.3 (R Foundation for Statistical Computing).

Ethics approval

Ethics approval was obtained from the Greenslopes Research and Ethics Committee (reference, 13/53), the Department of Veterans’ Affairs (reference, 014/002), the University of Queensland (reference, 2014000174), and the Queensland University of Technology (reference, 9339361).

Results

Participant characteristics

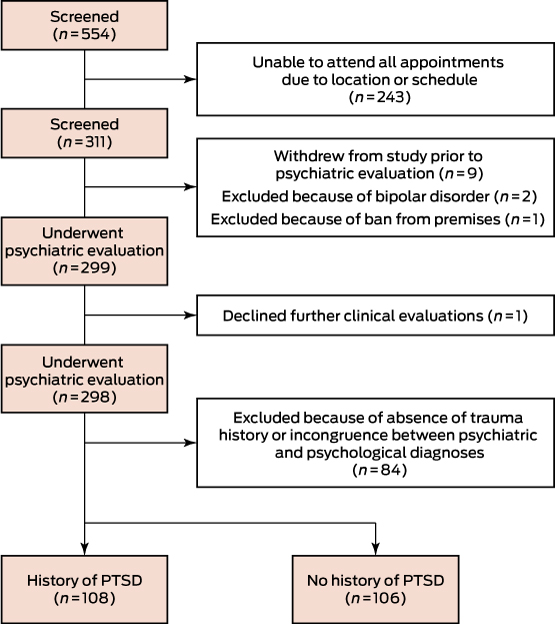
A total of 311 participants were enrolled, of whom 298 underwent all assessments (Box 1). Of these, 108 were confirmed by both psychiatric interview and CAPS-5 evaluation as having or having had PTSD, while 106 trauma-exposed controls had not, according to both measures. Participants who did not meet DSM-5 criteria for trauma exposure were excluded, as were those for whom the psychiatrist and CAPS-5 diagnoses were discordant.

The participants ranged in age from 60 to 88 years, with no significant difference between the two groups. Nor was there a significant difference in their mean weight, but mean BMI was significantly higher in the PTSD group, although the difference was small (control group, 29.0 kg/m2; PTSD group, 30.3 kg/m2; P = 0.037). More participants with PTSD had smoked recently and the group had a higher mean pack-year history. Fewer in this group currently consumed alcohol; total AUDIT scores were not significantly different, but more participants with PTSD were categorised as drinking at a risky or hazardous level or higher, indicating possible alcohol dependence. Fewer participants with PTSD were still in full-time work or had completed a university degree (Box 2).

Clinical outcomes

Direct comparison

The prevalence rates of 16 of 88 adverse outcomes were significantly higher among participants with PTSD, while the prevalence of one (history of squamous cell carcinoma or basal cell carcinoma) was lower. There were no significant differences in the reported histories of disorders affecting the endocrine or immune systems, the kidneys, or the eyes (Box 3, A; online Appendix 2, A). Participants with PTSD had a significantly higher mean number of comorbidities than those without (17.7 [SD, 6.1] v 14.1 [SD, 5.2]; P < 0.001). No participants from either group had mesothelioma, lung cancer, liver cancer, fibrosis, or cirrhosis, parathyroid problems, pituitary gland tumours, adrenal insufficiency or adrenal hormone excess, Addison disease, Conn or Cushing syndromes, phaeochromocytoma, or Parkinson disease.

The group mean values for nine of 66 clinical variables also differed significantly between the two groups; the differences were adverse for the PTSD participants, with the exception of basophil numbers. There were no significant differences in CAC scores (Box 3, B; online Appendix 2, B). No participants from either group were hepatitis B- or C- positive or had anti-mitochondrial antibodies.

After adjusting for multiple testing, five of the 24 adverse outcomes were significant predictors of PTSD after applying a 10% false discovery rate (FDR): a self-reported history of gastroesophageal reflux or peptic ulcers, and three sleep-related disorders (history of diagnosed OSA; high risk category for OSA on the Berlin Questionnaire; restless legs syndrome) (Box 3, A).

Regression analyses

After direct comparison of groups, regression models were developed for 23 of the 24 nominally significant adverse outcomes (unadjusted P < 0.05). History of seizures or epilepsy was excluded from the analysis, as no control participants reported this outcome.

Box 4 shows the ORs and 95% confidence intervals (CIs) for the relationship between PTSD and each outcome, adjusted for significant confounding demographic and risk factors (Model 1). PTSD remained significantly associated with 17 outcomes: history of MI, wheeze, gastrointestinal problems (reflux, peptic ulcers, irritable bowel syndrome [IBS], constipation), abnormal liver texture, sleep disorders (diagnosed OSA, high risk of OSA on Berlin Questionnaire, restless legs syndrome, ESS), headaches, hearing loss, forced expiratory volume ratio [FEV1%] predicted), anion gap, α1-antitrypsin levels, and caeruloplasmin levels. Seven outcomes were accounted for by the demographic and risk factors of age, BMI, smoking, and alcohol use: shortness of breath on exertion, history of fatty liver, urticaria, reduced forced vital capacity ratio (FVC%) predicted, estimated glomerular filtration rate (eGFR), triglyceride levels, and high density lipoprotein levels.

After also exploring depression and anxiety symptoms in addition to demographic confounders (Model 2), seven associations with PTSD identified in Model 1 were accounted for by symptoms of depression (history of MI, wheeze, reflux, OSA and high risk of OSA, restless legs, and ESS), and four by anxiety symptoms (abnormal liver texture, headaches, α1-antitrypsin levels, caeruloplasmin levels). Peptic ulcers, IBS, constipation, hearing loss, FEV1% predicted, and anion gap were significantly and positively associated with a PTSD diagnosis, independently of symptoms of depression and anxiety.

Discussion

We found a greater prevalence of comorbidities in Australian Vietnam War veterans with PTSD than among trauma-exposed control persons without PTSD. In particular, veterans with PTSD had higher rates of comorbidities of the gastrointestinal, cardiovascular, and respiratory systems, as well as a higher prevalence of sleep disorders. The proportions of participants with PTSD with risk factors for physical disease (higher BMI, smoking, and alcohol dependence) were greater. This is consistent with reports of associations between PTSD and obesity, lack of exercise,14 and health risk behaviours, such as smoking and alcohol dependence.12 These factors accounted for several differences between the groups, including shortness of breath on exertion, fatty liver, urticaria, eGFR, and triglyceride levels, highlighting the importance of treating these health risk behaviours as part of PTSD therapy.

The association between peptic ulcers and IBS with depression and anxiety, as well as with PTSD, was first proposed in the early 1990s.15 Case–control studies that examined the prevalence of anxiety and depression in people with functional gastrointestinal disorders have confirmed an association,16 and treating depression has been shown to improve IBS symptoms.17 The results of case–control studies investigating links between IBS and PTSD or trauma have been less clear;1820 they have not confirmed an association between IBS and PTSD independent of trauma exposure. We found that PTSD was significantly associated with a previous diagnosis of IBS or peptic ulcer, and with a history of constipation, and that these associations were independent of depression or anxiety.

These findings highlight a major strength of our study: the rigorous diagnosis of PTSD with multiple measures for assessing trauma history, allowing us to delineate a trauma-exposed control group. Use of questionnaires with checklists for self-reported data, standardised tools, and objective clinical measures administered by clinicians helped overcome problems of recall bias, including the possibility that people with PTSD may over-report symptoms.21

The relationship between PTSD and CVD is well documented, and recent studies have found this association remains after adjusting for comorbid depression.6,10,22 We found an increased risk of MI in those with PTSD, an association explained by symptoms of depression. This is consistent with a large study22 that found the 8-year cumulative incidence of MI in people with PTSD to be 8.0%, compared with 5.9% for those who did not have PTSD; this result was also accounted for by depression.22 In contrast to other studies,23 we found no significant difference in CAC scores, suggesting that the higher prevalence of MI among PTSD patients is not explained by increased atherosclerotic plaque burden, but rather by increased susceptibility to plaque rupture and subsequent intraluminal thrombus formation, two processes associated with systemic inflammation,24 also more common in people with PTSD.

The lower predicted FEV1% in our participants with PTSD is consistent with the findings of a German report,8 but we are the first to report this finding for a veteran population in a study with a trauma-exposed control group. As in the German report, we did not observe a consistent pattern across all respiratory measures; however, chronic airway inflammation causing airflow obstruction would explain our findings.

Comorbid depression is very common in PTSD (with a prevalence as high as 50%25). We found that 22% of our participants with PTSD had depressive symptoms of moderate or greater degree according to the DASS-21. These symptoms increase the complexity and difficulty of treating PTSD, augmenting the risk that PTSD will be persistent and chronic. We also explored whether anxiety symptoms accounted for the association of PTSD with comorbid physical illness, but such symptoms should not be conceptualised as confounders, but rather as components of the symptomatology of PTSD. Symptoms shared by PTSD and anxiety disorders are treated in the same manner, including with psychological and pharmacological therapies.

Limitations to our study include its cross-sectional design, which prohibited assessing the temporal relationship between PTSD, confounders, and comorbidities. It also did not allow consideration of the time course or chronicity of PTSD symptoms. Further, the number of participants was relatively small; a larger number may have afforded the power to detect additional significant associations. Finally, it has been shown that PTSD is a risk factor for all-cause mortality among veterans of the Vietnam and other wars, independent of conventional physical comorbidities.6,23 As we studied our participants four decades after the war, they probably constituted a healthier survivor cohort than would have been observed closer to the conflict. Further, veterans needed to be well enough to participate, so that those with very severe, acute PTSD were not recruited for the study. The lack of comorbidity data from these more seriously affected veterans may have led to underestimating the extent of associations, or indeed to missing associations that contribute to early mortality in this group.

Nevertheless, our study adds further evidence about the association between PTSD and general disease. The significant contribution to physical pathology by conditions associated with PTSD (depression, obesity, alcohol and nicotine use) should alert the clinician to the importance of treating these conditions in combat veterans. Additionally, effective treatment of anxiety may significantly reduce the risk of increased physical morbidity in combat veterans. Large scale, long term prospective studies of young veterans could help elucidate the time course of disease development.

Conclusion

The higher frequency of comorbid physical conditions suggests that PTSD be conceptualised not as a purely mental disorder, but rather as a systemic disorder. Integrated health care strategies directed at the psychological and physical health of patients with PTSD, as well as rigorous control of risk factors, are likely to improve their quality of life and their survival.

Box 1 –
Study design of the Gallipoli Medical Research Institute Post-traumatic Stress Disorder Study

Box 2 –
Characteristics of the Gallipoli Medical Research Institute Post-traumatic Stress Disorder (PTSD) Study participants, by PTSD diagnosis*

Characteristic

No PTSD

PTSD

P


Number of participants

106

108

Age (years), mean (SD); range

69.2 (4.2); 63–86

68.5 (4.1); 60–88

0.19

Weight (kg), mean (SD); range

90.6 (14.1); 62–126

93.7 (16.2); 63–146

0.16

Body mass index (kg/m2), mean (SD); range

29.0 (4.3); 20.6–43.0

30.3 (4.9); 21.2–45.8

0.037

Body mass index category

0.22

< 25 kg/m2

17 (16%)

12 (11%)

25–30 kg/m2

50 (47%)

44 (41%)

> 30 kg/m2

39 (37%)

52 (48%)

Smoking status

Current smoker

7 (7%)

14 (13%)

0.17

Recent smoker (within 12 months)

8 (8%)

21 (19%)

0.016

Past smoker (> 12 months ago)

80 (76%)

89 (82%)

0.24

Smoking pack-year history, mean (SD); range

18.7 (22.5); 0–105

26.2 (29.2); 0–150

0.041

Currently consumes alcohol

102 (96%)

92 (85%)

0.008

AUDIT score, mean (SD); range

6.2 (4.3); 0–23

8.5 (6.8); 0–30

0.14

AUDIT score category

0.010

Low risk (0–7)

74 (70%)

55 (51%)

Risky or hazardous level (8–15)

28 (26%)

38 (35%)

High risk or harmful level (16–19)

3 (3%)

8 (7%)

High risk; probably dependent (≥ 20)

1 (1%)

7 (6%)

Ethnic background

1.0

European

103 (97%)

102 (94%)

Indigenous Australian

0

1 (1%)

Other

0

1 (1%)

Not reported

3 (3%)

4 (4%)

Marital status

0.99

Single

1 (1%)

1 (1%)

Married

93 (88%)

95 (88%)

Divorced

9 (8%)

9 (8%)

Widowed

2 (2%)

1 (1%)

Other

1 (1%)

2 (2%)

Employment status

< 0.001

Full-time

16 (15%)

2 (2%)

Part-time

10 (9%)

7 (6%)

Retired

75 (71%)

76 (70%)

Not working

4 (4%)

22 (20%)

Other

1 (1%)

1 (1%)

Highest education level

0.006

University

44 (42%)

23 (21%)

Year 11 or 12

26 (24%)

24 (22%)

Year 10

14 (13%)

21 (20%)

Less than year 10

6 (6%)

16 (15%)

Vocational

16 (15%)

24 (22%)


AUDIT = Alcohol Use Disorders Identification Test. * Expressed as number of participants (percentage of group) unless otherwise stated. † Comparison of log-transformed distributions.

Box 3 –
Clinical measures for participants for which a statistically significant difference between the post-traumatic stress disorder (PTSD) and control groups was detected*

A. Binary variables: expressed as number of participants (percentage of group)

Outcome

No PTSD

PTSD

Odds ratio (95% CI)

P

False discovery rate


Number of participants

106

108

Self-reported history

Cardiovascular

Myocardial infarction

4 (4%)

16 (15%)

4.43 (1.43–13.7)

0.006

0.12

Cardiorespiratory

Symptomatic wheeze

15 (14%)

27 (25%)

2.02 (1.01–4.07)

0.046

0.28

Shortness of breath when exercising

18 (17%)

34 (32%)

2.25 (1.17–4.30)

0.014

0.17

Cancer

Basal cell carcinoma or squamous cell carcinoma

59 (56%)

45 (42%)

0.57 (0.33–0.98)

0.041

0.27

Liver

Fatty liver

4 (4%)

15 (14%)

4.11 (1.32–12.8)

0.01

0.16

Gastrointestinal

Diagnosed gastroesophageal reflux

49 (46%)

74 (68%)

2.53 (1.45–4.42)

0.001

0.048

History of peptic ulcers

12 (11%)

31 (29%)

3.15 (1.52–6.55)

0.002

0.048

Irritable bowel syndrome

12 (11%)

26 (24%)

2.48 (1.18–5.23)

0.015

0.17

Constipation

1 (1%)

8 (7%)

8.40 (1.03–68.4)

0.019

0.17

Neurological

History of any seizures (including epilepsy)

0

4 (4 %)

NA

0.046

0.28

Headaches (any type)

21 (20%)

35 (32%)

1.94 (1.04–3.63)

0.037

0.27

Sleep

Diagnosed obstructive sleep apnoea

22 (21%)

46 (43%)

2.83 (1.55–5.19)

< 0.001

0.048

Obstructive sleep apnoea, high risk Berlin category

44 (42%)

72 (67%)

2.82 (1.62–4.91)

< 0.001

0.035

Restless legs

27 (26%)

50 (46%)

2.52 (1.42–4.50)

0.002

0.048

Skin

Urticaria

10 (9%)

21 (19%)

2.32 (1.03–5.19)

0.038

0.27

Ears/hearing

Hearing loss

64 (60%)

82 (76%)

2.07 (1.15–3.73)

0.015

0.17

Measured parameters

Abdominal ultrasound

Abnormal liver texture

17 (16%)

34 (32%)

2.38 (1.23–4.60)

0.009

0.16


B. Continuous variables: expressed as mean (SD)

Outcome

No PTSD

PTSD

Difference of means (95% CI)

P

False discovery rate


Number of participants

106

108

Respiratory system

FEV1% predicted

87.1% (16.8)

81.8% (16.8)

–5.35 (–9.89 to –0.80)

0.021

0.18

FVC% predicted

94.5% (14.3)

89.6% (15.8)

–4.93 (–8.99 to –0.87)

0.018

0.17

Pathology

Anion gap (mmol/L)

7.96 (1.78)

8.64 (2.33)

0.68 (0.118–1.24)

0.018

0.17

Estimated glomerular filtration rate (mL/min/1.73 m2)

78.3 (13.7)

75 (14.5)

–3.27 (–7.08 to 0.533)

0.027§

0.21

Triglycerides (mmol/L)

1.38 (0.575)

1.66 (1.16)

0.281 (0.035–0.528)

0.026

0.21

Basophils (106/L)

39.7 (25.2)

33.5 (19.8)

–6.09 (0.99–1.00)

0.047

0.28

α1-Antitrypsin (g/L)

1.24 (0.20)

1.31 (0.22)

0.07 (0.01–0.13)

0.016

0.17

Caeruloplasmin (g/L)

0.233 (0.032)

0.248 (0.041)

0.015 (0.005–0.025)

0.003

0.072

Sleep

Epworth sleepiness score

7.6 (4.0)

9.2 (5.7)

1.6 (0.3–2.9)

0.018

0.17


FEV1 = forced expiratory volume in one second; FVC = forced vital capacity; NA = not applicable. * The complete data for all clinical measures are included in online Appendix 2. † Accounts for confounding medications (see online Appendix 1, table 2). ‡ Comparison of log-transformed distributions, with 95% CI = ratio of log-transformed means. § Non-parametric test (Mann–Whitney). False discovery rate was calculated with consideration of all tests performed.

Box 4 –
Evaluation of a post-traumatic stress disorder (PTSD) diagnosis as a risk factor for adverse outcomes. Model 1: includes significant confounding demographic factors. Model 2: evaluation of symptoms of depression and anxiety as explanatory risk factors for association of PTSD with outcomes, including significant confounding demographic factors*

A. Logistic model

Outcome

Model 1


Model 2


PTSD and demographic factors

PTSD odds ratio (95% CI)

Psychological and demographic factors

PTSD odds ratio (95% CI)


Heart attack/myocardial infarction

PTSD &plus; smoking

3.74 (1.18–11.9)

Depression &plus; smoking

Shortness of breath when exercising

Age &plus; BMI &plus; alcohol

Anxiety &plus; age &plus; BMI &plus; alcohol

Wheeze

PTSD

2.02 (1.01–4.07)

Depression

Fatty liver

BMI &plus; alcohol

BMI &plus; alcohol

Reflux

PTSD &plus; alcohol

2.25 (1.28–3.98)

Depression &plus; alcohol

Peptic ulcers

PTSD

3.15 (1.52–6.55)

PTSD

3.15 (1.52–6.55)

Irritable bowel syndrome

PTSD

2.48 (1.18–5.23)

PTSD

2.48 (1.18–5.23)

Constipation

PTSD

8.4 (1.03–68.4)

PTSD

8.4 (1.03–68.4)

Abnormal liver texture

PTSD &plus; BMI

2.09 (1.06–4.15)

Anxiety &plus; BMI

Diagnosed obstructive sleep apnoea

PTSD &plus; age &plus; BMI

2.84 (1.47–5.48)

Depression &plus; age &plus; BMI

Obstructive sleep apnoea, high risk Berlin category

PTSD &plus; BMI &plus; alcohol

2.25 (1.22–4.16)

Depression &plus; BMI &plus; alcohol

Restless legs

PTSD

2.52 (1.42–4.50)

Depression

Headaches

PTSD

1.94 (1.04–3.63)

Anxiety

Urticaria

Alcohol

Alcohol

Hearing loss

PTSD

2.07 (1.15–3.73)

PTSD

2.07 (1.15–3.73)


B. Linear model

Outcome

Model 1


Model 2


PTSD and demographics model

PTSD coefficient (95% CI)

PTSD and demographics model

PTSD coefficient (95% CI)


FEV1% predicted

PTSD &plus; age &plus; smoking

–4.51 (–8.81 to –0.22)

PTSD &plus; age &plus; smoking

–4.51 (–8.81 to –0.22)

FVC% predicted

BMI &plus; smoking

BMI &plus; smoking

Anion gap (mmol/L)

PTSD &plus; BMI

0.593 (0.034–1.15)

PTSD &plus; BMI

0.593 (0.034–1.15)

eGFR

Age &plus; BMI

Depression &plus; age &plus; BMI

Triglycerides (mmol/L)

BMI &plus; smoking &plus; alcohol

BMI &plus; smoking &plus; alcohol

α1-Antitrypsin (g/L)

PTSD

0.071 (0.014–0.128)

Anxiety

Caeruloplasmin (g/L)

PTSD

0.015 (0.005–0.025)

Anxiety

Epworth sleepiness score

PTSD &plus; BMI &plus; smoking

1.62 (0.30–2.94)

Depression


BMI = body mass index; eGFR = estimated glomerular filtration rate; FEV1 = forced expiratory volume in one second; FVC = forced vital capacity. ∗ See online Appendix 1, tables 3 and 4, for complete record of analyses. † Model accounts for lipid-lowering agents as well as other confounders.

Post-traumatic stress disorder is a systemic illness, not a mental disorder: is Cartesian dualism dead?

Mind and body are intimately linked, in health and in disease

Descartes’ notion of dualism, which argues for the distinction between the mind and the body,1 has underpinned and subtly driven much of the confused thinking in medicine about psychiatric disorders. A substantial and still accumulating body of evidence about the extensive psychophysiological and somatic comorbidities of post-traumatic stress disorder (PTSD),2,3 however, now challenges this notion, suggesting the need to reconceptualise PTSD as a systemic disorder rather than one confined to the mind. The somatic pathologies range from metabolic syndrome and related cardiovascular conditions to autoimmune diseases, including rheumatoid arthritis.2,4 Such disorders have been associated with a range of quantifiable abnormalities, including inflammatory cascades, altered psychophysiological reactivity and neuroendocrine function, and shortened telomere lengths.5

The study of a convenience sample of Australian Vietnam War veterans published in this edition of the MJA6 explores in detail the somatic comorbidities of PTSD. McLeay and her co-authors found that the relationship between PTSD, gastrointestinal disorders and abnormal respiratory function in veterans remained statistically significant even after controlling for factors known to be associated with chronic disease and early mortality in the absence of PTSD, such as higher body mass index, smoking, alcohol dependence, anxiety, and depression. These direct somatic comorbidities highlight the fact that the pathophysiological burden of PTSD cannot be attributed to other comorbidities, but indicate the biological dysregulation inherent to this disorder,7 a factor not systematically addressed by current treatments.8 Many of the physiological and immune abnormalities in PTSD are also present in the subsyndromal form of the disorder, and therefore provide potential targets for early intervention.5 One important question not explored by McLeay and colleagues is the relationship between combat exposure and physical disorder when full-blown PTSD is absent but subsyndromal symptoms are present.

Chronic pain and disability resulting from traumatic injury3 constitute another domain of somatic pathology in PTSD, with longitudinal studies indicating how important PTSD is for the long term outcome.9 The foundations of this relationship are the shared neurobiology of pain and PTSD, and their complex interaction.10 These findings are of particular importance for managing injuries in people such as emergency service workers and veterans, for whom there are significant risks of physical injury as well as of PTSD caused by trauma exposure. Physical health outcomes in these populations, particularly for older members with their cumulative burden of trauma exposure, are underpinned to a significant degree by the somatic pathology, pain and disability that is driven by PTSD. The refining of the stressor criterion for PTSD in the fifth edition of the Diagnostic and statistical manual of mental disorders (DSM-5) to include “experiencing repeated or extreme exposure to aversive details of … traumatic event(s)”11 as a category of exposure highlights the salience of the effects of cumulative trauma exposure for the pathophysiology of the disorder. Treatment plans for PTSD, including those for preventing “burnout” in emergency service personnel, have largely failed to adopt an integrated approach or to develop management strategies that recognise the common roots of the physical and psychological dimensions of the health of these individuals.

The failure to attend to the somatic pathology of PTSD has not served patients well. People with PTSD frequently also present with somatic symptoms of a non-specific nature8 that represent an integral part of the patient’s sense of ill-health. Medical journals, as well as the general media, frequently attest to the fierce controversies and battles in academia and among advocacy groups regarding conditions linked with military service, such as the effects of Agent Orange exposure in Vietnam War veterans and Gulf War syndrome. These conditions arise from veterans’ preoccupation with their sense of somatic ill-health and its possible causation.12 The various editions of the DSM of the American Psychiatric Association have failed to incorporate this central component of the patients’ illness experience by not including somatic symptoms as one of the axes of distress in their diagnostic criteria for PTSD. As a consequence, the biological mechanisms of the symptoms, their prevalence, and their relationship with later somatic pathology have all been inadequately explored.

The limited effectiveness of evidence-based psychological interventions in people with PTSD, particularly in veteran populations,13 highlights the need to develop biological therapies that address the underlying neurophysiological and immune dysregulation associated with PTSD. It is possible that these neurobiological dimensions may drive the relatively poor outcomes of psychological interventions. One important strategy for better understanding the sequence of the emergence of the psychological symptoms and somatic pathology in PTSD is to adopt a staging model that distinguishes the emerging matrix of the early patterns of biological dysregulation from the neurobiology of chronic, longstanding PTSD, which may reflect the secondary consequences of prolonged pathophysiological dysregulation.5 It is only by effectively collating such evidence that we will realise that Descartes’ views on dualism are completely outmoded.

Clozapine-induced maculopathy

A 57-year-old man was treated for schizophrenia with clozapine 900 mg daily over 22 years. His history included epilepsy, hypertension and hypercholesterolaemia, which was treated with clonazepam, clonidine and atorvastatin. Examination showed acuity 6/5 bilaterally, corneal and macular pigmentation (Figure, A, arrow, compared with B, which is normal macula), with subfoveal atrophy and disruption of the photoreceptor-retinal pigment epithelium junction on optical coherence tomography scan ([OCT]; Figure, C compared with D, which is a normal OCT, arrows), and left eye macular dysfunction on multifocal electroretinography ([ERG]; Figure, E compared with F, which is a normal ERG). These changes were similar to previously described clozapine-associated retinopathy.1 Clonazepam is associated with depigmentary retinopathy and normal ERG responses.2 Clonidine and atorvastatin have no documented retinopathy. The patient’s hyperpigmentation may be due to clozapine absorption via the choroid, binding to retinal pigment epithelium and interrupting photoreceptor phagocytosis.3 High dose clozapine warrants ophthalmic follow-up.

Figure

[World Report] Profile: Centre for Clinical Brain Sciences, Edinburgh, UK

The Centre for Clinical Brain Sciences (CCBS) at the University of Edinburgh, UK, is strategically located at four hospital sites across the Scottish capital and has three research divisions—Clinical Neurosciences, Neuroimaging Sciences, and Psychiatry—each with its own research director. CCBS was formed during what current centre and Clinical Neurosciences director, Siddharthan Chandran, describes as “a bonfire of departments” in 2004 to drive a new interdisciplinary approach to the understanding and treatment of major brain disorders.

[Comment] Schizophrenia, primary negative symptoms, and soft outcomes in psychiatry

Eugen Bleuler, one of the founding fathers of psychiatry, who coined the term schizophrenia in 1908, considered so-called negative symptoms, such as lack of drive and motivation or social withdrawal, to be at the core of the disorder, while he regarded the more dramatic positive symptoms, such as delusions and hallucinations, as accessory.1 Unfortunately, antipsychotics have been shown effective for positive symptoms, but they have limited efficacy for negative symptoms, which remain an unresolved problem.

Outstanding doctor from outstanding Israeli hospital visits Down Under


Internationally renowned Israeli doctor Nitza Heiman Newman is currently visiting Australia representing the Soroka Medical Centre, the only major medical centre in the entire Negev. 

It is one of the largest and most advanced hospitals in Israel, serving a population of more than one million people, including 400,000 children, in a region that accounts for more than 60 per cent of the country’s total land a

Soroka also serves as a teaching hospital of the Ben-Gurion University Medical School.  

 But what makes Soroka even more unique in the region is that in a nation often embroiled in conflict, it caters for everyone.

 “We treat people by the severity of the medical problems they have, not by any religion or culture,” Dr Newman said.

 “You can see in our wards, in the same room, Israelis, Jews, Arabs, Bedouin and more.

 “And you can see the changes of the people in those wards. It can sometimes start out with – I wouldn’t say with tension, but maybe with some suspicion amongst the patients and those who visit them. But within 24 hours they are getting along better and visitors are often bringing along cakes for everyone in the room.”

 Another thing making Soroka a standout facility is the way it is prepared for trauma. In a war zone, this is a necessity.

 “What we see a lot of unfortunately is military trauma in our area. The last time there was a serious breakout two years ago our helipad was very, very busy and we were treating a constant flow of injured soldiers and civilians,” Dr Newman said.

 “We are one of the biggest medical centres in Israel and definitely as a trauma centre. But we are also a general hospital with more than a thousand beds.

 “We do everything, including transplants. Our specialty is genetics and we also have the biggest delivery room in the country – delivering 55 new babies every day.”

 Dr Newman says Soroka is an example to the world, which is part of her reason for being in Australia.

 She is speaking at forums about the medical centre and also about the United Israel Appeal program called Professions for Life, which assists new immigrants to Israel to re-certify in their chosen professions.

“If you make the transition easier for new immigrants you make their lives easier and they integrate faster,” she said.

 “It makes life more enjoyable for them and for those who absorb them into the community.”

 Born in Israel, the only child of Holocaust survivors, Dr Newman served in a range of positions in the Israel Defense Forces, including as an officer in the Golani Brigade. Her last army position was as a company commander in a female officers’ course.

 She took a year off from medicine to direct a school in Be’er Sheva for gifted children, before taking a residency in pediatric surgery at Soroka Medical Center in Be’er Sheva.

 She then did a year-long fellowship at Great Ormond Street Hospital in London in the field of pediatric oncology surgery, a field that she developed at the hospital.

 Since 2005, Dr Newman has been responsible for the Dr. Gabi and Eng. Max Lichtenberg scientific program in surgery for outstanding staff at Ben-Gurion University.

 From 2009-2013, she was a member of the Be’er Sheva city council and responsible for the health and environment portfolio.

 Since 2010 she has been the deputy hospital director, in charge of medical personnel, children’s division, maternity division, gynecology, psychiatry and now rehabilitation as well.

 Chris Johnson

Self-poisoning by older Australians: a cohort study

The known Self-poisoning is less common among older people, but the numerous medicines they often use provide a ready source of toxins. Further, multiple comorbidities may exacerbate their toxicity and hinder recovery. 

The new Most self-poisoning by older people was intentional, but the proportion of unintentional poisonings increased with age. Hospital length of stay, rates of intensive care unit admission and cardiovascular adverse effects, and mortality were higher among older patients. 

The implications As our population ages, self-poisoning by older people is likely to be an increasing problem. Although self-poisoning is associated with higher morbidity and mortality than in younger patients, the risk of a fatal outcome is low when patients are treated in specialist toxicology units. 

As our population ages, self-poisoning and the associated morbidity are likely to be a growing problem. Self-poisoning is a burden on the health system and is a risk factor for subsequent suicide.1 Drug overdose is less common among older people than in younger adults,2 but is associated with higher morbidity and mortality.35 Distinct age differences in the nature and severity of self-poisoning have been reported.5 Stressors such as failing health, the death of a spouse, family discord, and loneliness may contribute to poisoning in older people.6 They often have several comorbidities and consequently take numerous medications, providing a ready source of toxins for self-poisoning. Further, multiple comorbidities and frailty may exacerbate the toxicity of these agents and hamper recovery from self-poisoning. Hopelessness and suicidality frequently increase with age, and depression is strongly associated with suicidality in older people. There is also a relationship between medical and psychiatric comorbidities and suicide by older people.7

While poisoning generally occurs in the context of deliberate self-harm or drug misuse, declining cognitive function can also be associated with unintentional overdose in older people.5 A recent report on self-poisoning in Australia8 provided only limited information about drug overdoses in older people, while an earlier, small study of deliberate self-poisoning by mature Australians included data only to July 1998.9

We examined the epidemiology and severity of self-poisoning by older people in a large regional centre in eastern Australia over a 26-year period, including in-hospital morbidity and mortality, and changes over time in the medications most commonly involved in self-poisoning. We compared these data with those for overdoses in a younger population.

Methods

We undertook a retrospective review of prospectively collected data for people presenting to the Hunter Area Toxicology Service (HATS) after self-poisoning during the 26-year period January 1987 – December 2012. Since 1987, HATS has provided a comprehensive 24-hour toxicology treatment service for a population of about 500 000 people. HATS currently has direct clinical responsibility for all adult poisoning patients in all hospitals in the greater Newcastle region, and provides a tertiary referral service to Maitland and the Hunter Valley.

HATS routinely records data for patients who present to hospital (even if the poisoning is uncomplicated) in a purpose-built database.10 A structured data collection form is used by HATS to prospectively capture information about patient demographics (age, sex), the drugs ingested, co-ingested substances, previous suicide attempts, whether the overdose was intentional or unintentional, management (including intensive care unit [ICU] admission), and complications of poisoning (hypotension, arrhythmias, ventilation requirement, death).11 At discharge, further information is collected, including hospital length of stay [LOS], and psychiatric and substance misuse diagnoses. Data are routinely entered into a fully relational Microsoft Access database distinct from the hospital’s main medical record system.

Data for all patients aged 65 years or more who presented following self-poisoning were extracted, analysed and compared with data for patients less than 65 years of age.

Statistical analysis

Continuous variables are reported as medians and interquartile ranges (IQRs) or ranges, and dichotomous variables as percentages. The statistical significance of differences in continuous variables was assessed in Mann–Whitney U tests, and of differences in dichotomous variables in χ2 tests (with Yates correction) or Fisher exact tests. P < 0.05 was deemed statistically significant. All analysis and graphics were performed in GraphPad Prism 6.0h (GraphPad Software).

Ethics approval

The Hunter New England Human Research Ethics Committee has previously granted an exemption from formal ethics approval for analysing data from the HATS database and patient information for research purposes.

Results

There were 17 276 admissions for self-poisoning over the 26-year period 1987–2012; 626 patients (3.6%) were aged 65 years or more and 16 650 (96.4%) were less than 65 years old. The older cohort included 344 women (55%), the younger group 10 258 women (62%; P < 0.001).

Changes in the epidemiology of the admissions of older patients over the 26-year period were analysed by dividing it into one 6-year and four 5-year segments. The proportion of patients admitted to hospital for self-poisoning who were 65 or older (3–4%) was relatively constant across the entire period. The median age of the older patients was 73 years (IQR, 68–79 years); that of the younger patients was 31 years (IQR, 23–41 years). There was a steady decline in the number of admissions for overdoses with increasing age (Box 1). Five hundred admissions in the older cohort (80%) and 14 837 in the younger cohort (89%) involved deliberate self-poisoning (P < 0.001). While the absolute number of self-poisonings decreased with age, the proportion of unintentional and iatrogenic poisoning admissions among patients over 65 increased (65–74 years, 15%; 75–84 years, 25%; 85–97 years, 34%; P < 0.001).

The median hospital LOS for the older patients across the entire period was 34 hours (IQR, 16–75 h); for the younger cohort, 16 hours (IQR, 9–25 h; P < 0.001). There was a progressive decline in LOS for the elderly cohort over the 26 years, from 46 hours (IQR, 23–86 h) in 1987–1992 to 26 hours (IQR, 14–35 h) in 2008–2012; in the younger cohort LOS was relatively constant across time (Box 2, A). The fall in LOS for older patients did not appear to be related to any change in self-poisoning rates with a particular class of drugs (data not shown).

In the older cohort, 133 people (21.2%) were admitted to an ICU, compared with 1976 of the younger cohort (11.9%; P < 0.001). The proportion of older patients admitted to an ICU declined over the 26-year period from a peak of 26% in 1993–1997 to 14% in 2008–2012; there was also a decline for the younger group (Box 2, B). The decline in the proportion of older patients who were ventilated was similar to that for those admitted to an ICU (Box 2, C). There were 24 deaths (3.8%) in the older cohort and 93 (0.6%) in the younger cohort (P < 0.001). Mortality decreased over time in the older cohort, from 8% to 1%, but remained relatively constant (0–1%) in the younger cohort (Box 2, D). The most common drug/toxin groups involved in fatal self-poisoning in the older cohort were opioids (5 of 24 deaths) and organophosphates (3 of 24; Appendix 1).

The incidence of cardiovascular adverse effects was higher in the older cohort. Hypotension was present in 65 older patients (10.4%) and 813 younger patients (4.9%); 59 patients aged 65 or more (9.4%) had arrhythmias, compared with 217 patients under 65 (1.3%). There were no differences between the two groups in the incidence of delirium, serotonin toxicity, or seizures.

There were 356 single-drug ingestions (56.9% of admissions) in the older cohort, compared with 7009 (42.1%) in the younger cohort (P < 0.001), and 28 many multiple drug (ie, more than five) ingestions (4.5%) in the elderly cohort compared with 250 (1.5%) in the younger cohort (P < 0.001; Appendix 2). Benzodiazepines were the drug class most commonly ingested by older patients (24.2%), followed by paracetamol (8.1%) and alcohol (7.3%); in contrast, alcohol was the most common drug ingested by younger patients (16.2%), followed by benzodiazepines (15.6%) and paracetamol (14.0%; Box 3). The proportion of benzodiazepine ingestions among older patients decreased over the 26-year period from a high of 35% in 1993–1997 to 15% in 2008–2012 (Box 4, A). The proportion of cardiovascular drug ingestions (Box 4, B) increased threefold, from 4% to 11%, with about one-third of poisonings unintentional or iatrogenic. In contrast, only 2% of toxic benzodiazepine ingestions were unintentional or iatrogenic. The proportions of tricyclic antidepressant and first generation antipsychotic ingestions fell across the study period, with a corresponding increase in those of newer antidepressants and second generation antipsychotics (Box 4, C). The overall proportion of ingestions involving antidepressants or antipsychotics was unchanged over the study period, accounting for 12% of admissions. The proportion of poisonings with analgesic drugs (paracetamol, opioids or salicylates) increased by about 50% (from 10% to 16%); paracetamol accounted for 60% of toxic analgesic drug ingestions (Box 4, D), but there was a much greater increase in the proportion of poisonings with morphine and oxycodone. Only four admissions of older patients (0.6%) involved recreational drugs, compared with 1306 admissions (7.8%) in the younger cohort (P < 0.001).

A history of previous suicide attempts, psychiatric illness, hospital admission for mental health problems, or drug or alcohol misuse was respectively identified for 198 (32%), 241 (38%), 174 (28%) and 147 (23%) admitted older patients. Each of these proportions was significantly smaller (P < 0.001) than for patients under 65 (Box 5).

Discussion

For people aged 65 years or more admitted to hospital for self-poisoning, the average LOS was twice as long, admission to an ICU more likely, the incidence of hypotension and arrhythmia significantly higher, and mortality greater than for younger patients. Hospital LOS for older patients steadily declined over the 26-year period, and this decrease was associated with a similar decline in the rates of ICU admission, ventilation, and mortality. This may reflect changes in management over time, with an increasing emphasis on reducing LOS, as well as improvements in services that aid older patients during the discharge process. A reduction in the proportions of self-poisonings with more toxic agents, such as tricyclic antidepressants and conventional antipsychotics, may have also contributed to the decline in LOS, although the number of admissions of older patients for self-poisoning with these drugs was small. Further, the reduced number of more toxic ingestions by the younger cohort did not affect their mean LOS over the study period (data not shown).

The proportion of patients admitted to hospital for self-poisoning who were at least 65 years old in our study (3–4%) was lower than the proportion of older people in the Australian population (11–14%) during the study period. Lower rates of admission of people over 65 years of age for poisoning with recreational drugs and the lower prevalence of psychiatric co-factors and alcohol and drug misuse probably explain this difference. Although the proportion of the population who were 65 or older increased during the study period, the proportion of self-poisonings involving older people remained relatively constant. This is reassuring, but underscores the importance of specialist toxicology services.

Among those aged 65 or more, the proportion of non-deliberate or unintentional self-harm admissions increased with age; the proportion was more than twice as great among the oldest patients as in the 65–74-year age group. In a profile of calls to a large American poisons information centre, therapeutic errors resulting in self-poisoning were increasingly prevalent among older people, rising from 14.5% in 50–54-year-old people to 25.3% in those aged 70 years or more.2 Psychiatric illness is associated with suicide at all ages,7 and 38% of older patients in our study had a history of psychiatric illness. Other risk factors for suicide include depression, alcohol misuse, prior suicide attempts, higher age, being male, living alone, and bereavement (especially among men).12 While in our study a history of psychiatric illness, a prior suicide attempt, and alcohol or drug misuse were all more frequent in patients under 65, one-third of older patients also had a history of attempted suicide, and almost one-quarter reported alcohol or drug misuse. Social isolation and loneliness, family discord, and financial trouble are also risk factors for suicide.6

In our study, opioids were the drugs most commonly associated with fatal self-poisoning by older patients. The rising proportion of opioid overdoses in this group is worrying, and may be reflect the increasing use of these agents, particularly for the treatment of non-malignant pain. While paracetamol was the second most commonly ingested drug in poisonings, the proportion has remained constant over time, and there were no fatalities, probably because a highly effective antidote, N-acetylcysteine, is available.13

Benzodiazepines were the drugs most frequently implicated in self-poisonings by older patients in our study, consistent with other reports. A Canadian study of 2079 people aged 65 or more found that benzodiazepines, opioids, other analgesics and antipyretics, antidepressants, and sedative hypnotics were the drug classes most frequently used in suicide attempts.5 In a Swedish study, a benzodiazepine was implicated in 39% of drug poisoning suicides by older people, and this proportion was rising despite a reduction in prescription sales.14 Both the prescription and ingestion of benzodiazepines have been reported to be associated with self-poisoning by older Australians.9 Benzodiazepines may exacerbate undiagnosed depression and impair impulse control in some individuals, leading to suicide attempts. The decline in the proportion of admissions for self-poisoning with benzodiazepines over the study period is therefore reassuring.

Self-poisoning with cardiovascular drugs by older people increased threefold over the study period, and probably contributed to the higher incidence of hypotension than in the younger cohort. In an American study of calls to a poisons information centre, there was a relatively high number of self-poisonings with β-blockers and calcium channel antagonists by older callers.2

The number of drugs taken by older patients appears to have a bimodal distribution, with the proportions of admissions for ingesting one drug or more than five drugs both being higher than among younger patients. The higher frequency of toxic ingestions of more than five drugs may reflect the increased use of Webster-pak and dosette boxes by older patients.

The data in our study have inherent limitations. The HATS database does not capture the number of people who died outside hospital, nor those with less severe poisonings; that is, people who visited their primary care physician rather than presenting to an emergency department. Other poisoning studies in Newcastle have also not included patients treated only by their local medical officer or in private hospitals.15,16 Further, despite the use of a prospective data collection form, retrospective review of medical records is often required to complement prospectively collected data. However, this is rarely required for the minimum dataset we analysed; almost all data were recorded at admission. Finally, the HATS database does not capture medical comorbidities, so that we were unable to correlate these with the outcomes we reported. The key strengths of our study include the fact that the longitudinal data were gathered over an extended period, and that core data fields were consistently recorded.

Education strategies for preventing poisoning have traditionally focused on children, but the morbidity and mortality for this age group is extraordinarily low.2 Although less common in older people, self-poisoning can be a highly significant clinical event. Suicidal intent is more common, as is a lethal outcome. Some prevention efforts may be better directed to protecting our expanding population of older citizens. The importance of potentially remediable factors, such as depression and rates of benzodiazepine prescribing, should not be overlooked. The overall low mortality among older people presenting to hospital after self-poisoning reflects the standard of care received by these patients.

In summary, self-poisoning by older people is likely to be an increasing problem as our population ages. Self-poisoning by older people is associated with higher morbidity and mortality than in younger patients, and unintentional self-poisoning is also more common. The steady decrease in LOS over the 26-year period and the declines in the rates of ICU admission and death are encouraging. Despite the higher overall rate of completed suicide by older people, our data indicate that the risk of a fatal outcome following self-poisoning is low when the patient is treated in a specialist toxicology unit.

Box 1 –
Number of admissions for self-poisoning, greater Newcastle region, 1987–2012, by 5-year age bands*


* Age group labels indicate the starting age for each band; eg, 15 years = 15 to less than 20 years of age.

Box 2 –
Median hospital length of stay (A), proportion of admissions to intensive care units (B), proportion of patients requiring mechanical ventilation (C), and in-hospital mortality (D) for patients admitted to hospital for self-poisoning, greater Newcastle region, 1987–2012

Box 3 –
Types of drugs most frequently ingested by patients admitted to hospital for self-poisoning, greater Newcastle region, 1987–2012, by age cohort*

Drug class/name

Patients≥ 65 years

Patients< 65 years


Total number of patients

626

16 650

Total number of ingested substances

1198

33 205

Benzodiazepines

290 (24.2%)

5180 (15.6%)

Paracetamol

97 (8.1%)

4633 (14.0%)

Opioids

37 (3.1%)

1221 (3.7%)

Salicylates

24 (2.0%)

335 (1.0%)

Alcohol

87 (7.3%)

5374 (16.2%)

Tricyclic antidepressants

54 (4.5%)

1332 (4.0%)

Selective serotonin re-uptake inhibitors

33 (2.8%)

1650 (5.0%)

Serotonin/noradrenaline re-uptake inhibitors

13 (1.1%)

767 (2.3%)

Antidepressants (other)

15 (1.3%)

428 (1.3%)

Angiotensin 2 receptor blockers/angiotensin converting enzyme inhibitors

42 (3.5%)

178 (0.5%)

β-Blockers

30 (2.5%)

259 (0.8%)

Calcium channel blockers

28 (2.3%)

111 (0.3%)

Digitalis glycosides

14 (1.2%)

20 (0.1%)

Vasodilators

13 (1.1%)

154 (0.5%)

Anticonvulsants

39 (3.3%)

1475 (4.5%)

Antipsychotics (typical)

35 (2.9%)

1200 (3.6%)

Antipsychotics (atypical)

22 (1.9%)

1673 (5.0%)

Lithium

22 (1.8%)

228 (0.7%)

Antihistamines

16 (1.3%)

727 (2.2%)

Proton pump inhibitors

15 (1.3%)

129 (0.4%)

Statins

14 (1.2%)

50 (0.2%)

Non-steroidal anti-inflammatory drugs

13 (1.1%)

1091 (3.3%)

Other drugs

85 (7.1%)

1356 (4.1%)

Nitrates

14 (1.2%)

22 (0.1%)

Other non-therapeutic substances

33 (2.8%)

516 (1.6%)


* Three drug groups frequently implicated in self-poisoning by people under 65 years of age were rarely involved in self-poisoning by older patients: amphetamines (1.9% of admissions of people under 65), antibiotics (1.1%), and anticholinergic agents (1%).

Box 4 –
Major drug classes implicated in admissions for self-poisoning of people aged 65 years or more, greater Newcastle region, 1987–2012. (A) Alcohol and benzodiazepines; (B) cardiovascular drugs; (C) antidepressant and antipsychotic drugs; (D) analgesics

Box 5 –
The proportions of patients admitted to hospital for self-poisoning, greater Newcastle region, 1987–2012, with a history of previous suicide attempt, psychiatric illness, admission to hospital for a mental health problem, or substance misuse, by age cohort

Self-poisoning by older Australians

Improving mental care for people over 65 must be a priority

In this issue of the MJA, important data on self-poisoning by older people presenting to the Hunter Area Toxicology Service (HATS) over a 26-year period are reported.1 It is firstly to be recognised that these data are the result of the enormous effort involved in maintaining a database over a period of that length. They are clearly of interest to specialists in the field of toxicology, but the data will also attract much broader interest. Suicide rates among men in Australia aged 85 or more were the highest for any age group throughout the period of study.2 Further, self-poisoning remains one of the most common methods employed. This report is therefore very interesting, and may provide clues about how to respond to this major, but often hidden, public health challenge.

The study by Pillans and co-authors found that only 3.6% of all toxicology presentations to HATS were by people over 65.1 However, the importance of this group of patients lies in the fact that overdoses in older people were associated with longer admission times, and greater likelihood of admission to an intensive care unit, need for artificial ventilation, and death (3.8% of older patients died, compared with 0.6% of those under 65). These findings are consistent with long term experience that suicide attempts by older people are more likely to end in death than those of younger people.3,4 This all suggests that overdoses in older people are a very important area for intervention. This need is further underlined by the acknowledgement of the study authors that they were unable to include overdoses that resulted in death without admission to hospital. The relatively high lethality of overdoses in older people, together with available community data, suggests the number of such deaths is not small.

This all raises the question as to what can be done in response to this important problem. The first step, undertaken by the authors, is to highlight its significance. It is noteworthy that, despite the size of the problem, it has received relatively little public attention, with almost an unspoken suggestion that suicide is a life choice or a consequence of ageing. Yet, as the authors acknowledge, most older patients admitted to hospital after self-poisoning have a history of mental illness, as also noted by other investigators.3 Unfortunately, the data available to Pillans and his colleagues were limited to retrospective information about a history of suicide attempts (32% of admitted older patients), psychiatric illness (38%), admission to hospital for a mental health problem (28%), or drug and alcohol use (23%). While this suggests that most older people admitted to hospital after self-poisoning had at least one of these risk factors, each of these numbers was lower than for patients under 65. This is somewhat surprising, apart from the differences in rates of substance misuse; whether it is related to a generational reluctance to acknowledge problems or to seek mental health care is not clear, or it may underline how frequent these problems are in younger patients. Assessments of current psychopathology in these patients, including depression and anxiety, were not available, and it might reasonably be suspected that most of the admitted patients, regardless of age, would present evidence of mental health problems.

So where is the public awareness campaign about the mental health of older people? Nothing is currently seen or heard.5 Despite the growth of our older population,6 public attention has been limited, despite a clear increase in the volume of campaigns about mental health in general, including those raising awareness of suicide.7 It is unclear why so little attention is paid to a group that is at such high risk.

Such a campaign could highlight that depression and other mental health problems are not a sine qua non of ageing, that they are diagnosable and treatable in the vast majority of cases, and that the stigma attached to receiving such assistance should be reduced for older people as it has been for other age groups. Such a campaign would be timely, as major reforms are currently being undertaken in the mental health sector, including new roles for primary health care networks.8 Most care for older people with disorders such as major depression is currently provided as part of primary care, and general practitioners deserve all the support possible in this sometimes daunting task. In this regard, it is noteworthy that the proportion of spending in the Better Access to Mental Health Care scheme for those over 60 is only 8%.9 If the problem is granted appropriate priority, we can hopefully change the sad but hidden situation highlighted by Pillans and his co-authors.