×

Multidisciplinary approach to reducing pharmaceutical misuse

Hospitalisations for pharmaceutical opioid poisoning now exceed those for heroin use. In fact, most people who enter Australian drug and alcohol treatment programs are doing so because of prescription opioid and/or benzodiazepine use (Aust Prescr 2014; 37: 79-81). Mortality associated with prescription opioid use is on the rise, and around 40% of deaths involve a legitimate prescription for oxycodone for non-cancer pain (Forensic Sci Med Pathol 2015; 11: 3-12).

The National Pharmaceutical Drug Misuse Framework for Action identifies national priorities to minimise harm from pharmaceutical drug misuse. Under the nine priority areas, there are a number of actions designed to support the entire health care team involved in medicine management, including prescribers and pharmacists.

NPS MedicineWise recently launched an online module to help pharmacists identify and manage prescription drug misuse as part of the broader care team. Often pharmacists are well placed to identify issues and improve quality use of medicines in patients they see in their pharmacies. This can be done by influencing the way an individual uses medicines, but also by identifying and relaying concerns back to the prescriber about potential misuse.

The module aims to help pharmacists improve their integration into a multidisciplinary care team, and offers suggestions and ideas to help pharmacy cultivate closer ties with general practice and allied health providers at a local level. Learning objectives include identifying the warning signs of drug misuse and how to respond, how to hold sensitive conversations with patients, and the role of pharmacists in the patient care team.

It is also important that clinicians recognise the contribution pharmacists can provide in reducing misuse of prescription medicines, and seek opportunities to build closer ties with their local providers. Pharmacists are very well placed to identify medicines issues and work collaboratively with the prescriber to improve outcomes for patients. The module is freely available online at http://learn.nps.org.au.

Therapeutic advances and risk factor management: our best chance to tackle dementia?

An update on research advances in this field that may help tackle this growing challenge more effectively

Increasing life expectancy has fuelled the growth in the prevalence of dementia. In 2015, there were an estimated 47 million people with dementia worldwide (including 343 000 in Australia), a number that will double every 20 years to 131 million by 2050 (900 000 in Australia).1 The global cost of dementia in 2015 was estimated to be US$818 billion.1 Low-to-middle income countries will experience the greatest rate of population ageing, and the disproportionate growth in dementia cases in these nations will be exacerbated by a relative lack of resources.

The diagnostic criteria for dementia (relabelled “major neurocognitive disorder”) of the American Diagnostic and Statistical Manual of Mental Disorders, fifth edition (DSM-5)2 include a significant decline in one or more cognitive domains that is clinically evident, that interferes with independence in everyday activities, and is not caused by delirium or other mental illness. Whether the new diagnostic label catches on remains to be seen. The most common type of dementia is Alzheimer’s disease (AD) (50–70% of patients with dementia), followed by vascular dementia (10–20%), dementia with Lewy bodies (10%) and fronto-temporal dementia (4%).3 These percentages are imprecise, as patients often present with mixed pathology.

Our discussion will focus on AD because it receives significant research attention as the most common cause of dementia. The two hallmark pathological changes associated with neuronal death in AD are deposition of β-amyloid plaques, and tau protein neurofibrillary tangles. Understanding this process has been enhanced by prospective cohort studies, such as the Australian Imaging Biomarkers and Lifestyle (AIBL) study.4 As shown in the Box, the results of this research indicate that the degree of β-amyloid deposition exceeds a predefined threshold about 17 years before the symptoms of dementia are detectable. In the absence of an alternative model, the amyloid cascade remains the most compelling hypothesis for the pathogenesis of AD. This is supported by the fact that early onset familial AD is caused by mutations in chromosome 21 that result in the production of abnormal amyloid precursor protein (APP), or by mutations in chromosomes 1 or 14 that result in abnormal presenilin, each of which increase amyloid deposition. The extra copy of chromosome 21 in Down syndrome also leads to faster amyloid deposition and the earlier onset of AD. Further, the symptoms of AD are correlated with imaging of amyloid in the living brain and with cerebrospinal fluid biomarkers that are now included in new diagnostic criteria for AD and which will enable suitable participants to be selected for trials of drugs that may prevent or modify the disease,2 in particular to determine whether anti-amyloid agents are useful for delaying or treating AD.

At present, cholinesterase inhibitors (donepezil, galantamine and rivastigmine) and the N-methyl-D-aspartate (NMDA) receptor antagonist memantine are licensed for treating AD dementia, and produce modest but measurable benefits for some patients. These medications are thought to work by increasing cholinergic signalling and reducing glutamatergic activity respectively, partially redressing neurochemical abnormalities caused by the amyloid cascade.5 More than 200 other drugs advanced to at least Phase II development between 1984 and 2014, but none has yet entered routine clinical use.6 Lack of efficacy in clinical trials may be the result of their being introduced at a rather late stage of the disease process; hippocampal damage is so profound by the time individuals present with AD dementia that attempting to slow their decline with an anti-amyloid agent may be analogous to starting statins in patients on a heart transplantation waiting list. As it provides the most compelling hypothesis for AD, the amyloid cascade remains the main target for developments in treatment. Treatment trials in people with preclinical or prodromal AD will in due course determine its validity.

Recent developments include promising results for treating prodromal AD with passive vaccines containing monoclonal antibodies directed against β-amyloid, such as solanezumab and aducanumab. This may point the way to treatments in the next decade that delay the onset of dementia in people with developing AD pathology.7,8

The identification of risk factors for AD may lead to risk reduction strategies. Recent randomised controlled trials of multidomain interventions, such as the Finnish Geriatric Intervention Study to Prevent Cognitive Impairment and Disability (FINGER) study (a 2-year program including dietary, exercise, cognitive training and vascular risk monitoring components), show that such interventions could improve or maintain cognition in at-risk older people in the general population.9 Greater risk reduction might be attained by intervening 10 to 20 years before the first clinical signs of cognitive impairment are presented. A recent review of 25 risk and protective factors associated with AD concluded that “the evidence is now strong enough to support personalized recommendations for risk reduction by increasing levels of education in young adulthood, increasing physical, cognitive and social activity throughout adulthood, reducing cardiovascular risk factors including diabetes in middle-age, through lifestyle and medication, treating depression, adopting a healthy diet and physical activity, avoiding pesticides and heavy air pollution and teaching avoidance of all potential dangers to brain health while enhancing potential protective factors”.10 These risk factors, and particularly vascular risk factors, are implicated in neurodegeneration pathology in a number of dementia processes.

While the search for effective preventive strategies and access to evidence-based pharmacological treatments and psychosocial interventions are critical, there are still delays in diagnosis and a failure to utilise existing available resources.1,3 The introduction of the federal government-funded, state-based Dementia Behaviour Management Advisory Services (DBMAS), the initiation of severe behaviour response teams, and increased funding for research should be applauded, but there needs to be greater coordination of service delivery systems for patients and carers at every stage, from prevention through to end-of-life care, and the medical profession needs to do more to ensure that all existing and trainee practitioners are well informed about what we can do for people with dementia right now.

Box –
Relationship of ß-amyloid deposition with other parameters in Alzheimer disease


Aß-amyloid = ß-amyloid; CDR = Clinical Dementia Rating. Reproduced with permission from Villemagne et al (2004).4

Ten years of publicly funded biological disease-modifying antirheumatic drugs in Australia

Access to high-cost medicines through the Australian Government’s Pharmaceutical Benefits Scheme (PBS) poses a number of challenges for the National Medicines Policy, which aims to provide timely access to medicines at a cost individuals and the community can afford. Biological disease-modifying antirheumatic drugs (bDMARDs) for rheumatoid arthritis (RA) were among the first highly accessed, high-cost drugs to be subsidised in Australia. To restrict their use, a unique subsidy scheme was developed by the Pharmaceutical Benefits Advisory Committee (PBAC), whereby physicians complete written authorities documenting both eligibility to initiate and response to permit continuation.1 Similar models have been adopted for other high-cost medications (eg, trastuzumab),2 but there is continuing debate on whether the medicines are available for all who need them, and what constitutes a “worthwhile” response for the individual and for the community who pay.3,4 In this article, we reflect on bDMARD use and the expenditure for newer bDMARDs for RA (abatacept, tocilizumab, certolizumab pegol and golimumab) (our methods are described in the Appendix). We suggest that an electronic database of data submitted for subsidised bDMARD use could promote the quality use of medicines (QUM) and improve cost expenditure predictions for high-cost drugs.

bDMARDs on the PBS for rheumatoid arthritis

Etanercept and infliximab were PBS listed for RA treatment in 2003, and eight bDMARDs are now available (Box 1). These agents cost between $15 000 and $25 000 per patient per annum, and use has increased such that expenditure was about $383 million in 2014 (Box 2).

Etanercept and adalimumab remain the most commonly prescribed bDMARDs, collectively accounting for 64% of bDMARD use in 2013–2014 (Box 3). The cost of the available bDMARDs on the PBS for RA treatment is relatively uniform, with each bDMARD having been added on a cost minimisation basis compared with a competitor.5 The dispensing cost for each bDMARD (for the most dispensed item code), and the PBS-reported dispensing price for the maximum quantity, are shown in Box 4.6

The subsidy process

In 2003, consultation between stakeholders (the PBAC, pharmaceutical companies, rheumatologists and consumers) resulted in access criteria (to limit access to those for whom less expensive options had been inadequate to achieve acceptable disease activity) and response criteria (based on ACR50 responses [at least a 50% improvement in the American College of Rheumatology score], to ensure only those responding received continued treatment).1 Limitations to access were also thought warranted given concerns regarding the possibility that bDMARDs might increase the risk of lymphoma. After review, these restrictions were relaxed in 2010 (Box 5).7 The cost of etanercept and adalimumab has decreased from about $1880 per patient per month in 2003 to $1760 per patient per month in 2014, reflecting a price reduction to achieve a more acceptable cost–effectiveness ratio when the initiation criteria were modified.7

After failure of five bDMARDs, no further access to biological agents within a lifetime is allowed,7 so patients may access two tumour necrosis factor (TNF) blockers and each of the bDMARDs with distinct alternative actions. The proportion of patients who exhaust all bDMARD options is likely to be small.

Formal evidence that strict initiation and continuation criteria contain gross drug acquisition costs and improve the overall cost–benefit ratio has face validity, but formal proof is lacking and difficult to establish. The need to interpret complex rules and to complete onerous paperwork for access, incidentally or by design, is a disincentive to the promiscuous use of expensive agents. Nonetheless, assessing disease activity at baseline and after defined periods introduces to clinical practice formal assessment of RA disease activity, hitherto reserved for clinical trials. It is thus difficult to argue that such procedures should not be used in routine clinical practice, if for no other reason than to avoid resource expenditure on patients failing to fulfil response criteria and who may benefit from alternative treatment.

Circumventing restrictions

As high disease activity at baseline and subsequent demonstrable clinical response is required for initial and continued bDMARD therapy, concerns are raised regarding those not meeting initiation criteria, or not meeting response thresholds despite improvement.8 The ethical burden this places on rheumatologists is undefined; however, practices may be altered such that clinicians may be tempted to allow disease activity to increase before applying for bDMARD initiation or bias baseline joint counts.

Expenditure predictions and monitoring

To predict cost-effectiveness and the financial implications of listing a medication on the PBS, usage is estimated before listing,9 and the difference between estimated and actual usage is serially assessed after listing.10

In the 2 years following etanercept and infliximab listing (Box 1), the actual expenditure was $53 million (19% of predicted).11 This low uptake may have reflected concerns regarding safety, perceived efficacy, availability of the drugs and facilities to administer them, the complexity of the rules, and the administrative burden of applying for initiation and continuation of these agents. Since 2008, abatacept, tocilizumab, certolizumab pegol and golimumab have been introduced, and their use has steadily increased (Box 6). The estimated annual expenditure in the first 5 years for abatacept was $25 million (ie, 50 000 vials at $500 per vial) and less than $10 million for each of tocilizumab, certolizumab pegol and golimumab.1215 Expenditure on abatacept was less than predicted for each of the first 5 years, but tocilizumab, certolizumab pegol and golimumab had a combined expenditure of about $93 million for the fifth year of their listing, 210% over the initial estimate. Over the same period, the combined annual expenditure on etanercept and adalimumab rose from about $110 to $227 million. The reasons for the differential uptake of bDMARDs are unclear. Given the lack of head-to-head studies to evaluate the relative efficacy of bDMARDs, ease of administration and access to appropriate facilities, growing experience with use and the (perceived or actual) benefit of alternative mechanisms of action may be important determinants of choice. Also, the respective marketing strategies of sponsoring pharmaceutical companies are likely to have had an effect.

Cost forecasting for bDMARDs has failed, highlighting the problem with estimations in their current format. It is unclear whether the cost underestimations for tocilizumab, certolizumab pegol and golimumab were due to a larger than expected switch rate, circumvention of restrictions or preference for newer bDMARDs rather than older agents. Recently, European League Against Rheumatism guidelines removed the recommendation that the first-line bDMARD should be a TNF inhibitor, instead stating that there was no preference.16 However, it does not appear that non-anti-TNF agents (bDMARDs with other mechanisms of action) were strongly preferred, since etanercept and adalimumab use continued to increase. It is also difficult to apportion the effect of changing PBS restrictions in 2010 on anticipated uptake.

The implications of inaccurate expenditure predictions on the National Medicines Policy can be significant. Initiation and continuation criteria are based on clinical trial data and inaccurate predictions could result from difficulty in translating trial evidence to practice. Underestimation of use could be due to a lower than expected commitment or response rates to existing conventional DMARDs and bDMARDs, and this has substantial long-term cost implications. Underestimation could reflect an unforeseen preference for the newer agents (compared with the older, similarly priced biological agents), which could lead to benign cost-shifting. However, the net effect is uncertain, since managed-entry agreements, which share the financial risks of underestimation between funders and sponsors of recently introduced high-cost drugs, are common. The details of such arrangements are not publicly available, and extend beyond the restriction criteria and cost predictions presented herein. For the 2013–14 financial year, the Australian government recovered $500 million from managed-entry agreements and, as such, the importance of inaccurate cost prediction, at least for the duration of these agreements, is uncertain.17 It is likely that price-capping agreements were in place for abatacept, tocilizumab, certolizumab pegol and golimumab throughout the investigated period, although details of recovered monies are not available.2

Biosimilars

Recently, biosimilars of etanercept and infliximab have offered promise for providing less expensive bDMARDs. Unlike small-molecule generic products that can lower price by as much as 90%, biosimilars have more complex development processes which result in post-translational modifications in structure. Typically, prices are 20%–30% lower than branded products.18 These factors can result in reluctance to switch from branded products that are “known” to work.18 However, clinicians and sponsors may be placing too strong an emphasis on post-translational differences, as branded agents can also exhibit functionally and/or immunologically important post-translational modifications over time.19 The price of a branded bDMARD undoubtedly includes a substantial profit margin to compensate for development costs. A biosimilar, however, can be developed in the knowledge that it is directed at an appropriate target. There must, therefore, be appropriate and proportionate incentives to develop both novel bDMARDs and cost-effective biosimilars. There is a need for regulatory agencies, funders and manufacturers of reference and biosimilar agents to strive to assemble clinical research data, and to achieve funding arrangements which increase access to the most effective biological products (be they branded or biosimilar) at a time when they will be most effective. Without this collaborative action, we may not see a substantial reduction in the cost of newer bDMARDs until patents expire on the small-molecule tyrosine kinase inhibitors that are not yet marketed for the treatment of RA in many countries.20

Future perspectives

A key feature of Australian programs for access to high-cost drugs is the need to provide clinical data before initiation and when evaluating response. These data could be used to examine real-world effectiveness and review expenditure predictions, with a view to developing better predictive models; however, these data have been inaccessible to date.1,21

Recent advents to allow access to a 10% sample of individualised PBS data are a step towards improved QUM monitoring. Yet, a real-world database of clinical and laboratory data could also have an important role. The information would, however, lack patient-reported data and quality-of-life outcomes. These shortcomings could be addressed in part by linkage with the Australian Rheumatology Association Database, which contains this information for a subset of the population.22 A real-world database would also present a potentially novel framework for nationwide research projects that could, for example, investigate the clinical utility of pharmacogenomic and therapeutic drug monitoring variables as a means to optimise bDMARD selection. It would have the potential to answer questions about bDMARD use that have remained unanswered over the past 10 years, some of which are listed in Box 7.

Like the novel bDMARDs introduced before them, bDMARD biosimilars will be among the first high-cost agents in their class to be publicly funded, and the developed funding models will lay the framework for accessing and pricing biosimilars in the future. Since their introduction is likely to result in only modest price reductions, relaxation of access criteria is unlikely unless acceptable reductions in cost–effectiveness ratios can be demonstrated. Funding of medicines currently relies on substantial cost reduction following the introduction of generics, which frees up funds that can be directed towards new medicines.

In this article, we have used bDMARDs to exemplify current and future challenges to achieving equitable access to high-cost drugs. A real-world database could also inform questions regarding effectiveness and appropriate access of other high-cost drugs that use similar written authority-based prescribing models. In turn, these data could inform future negotiations regarding what constitutes a fair price for the benefit accruing from the use of these agents.

Conclusion

The use of bDMARDs to treat RA, and the cost to taxpayers, has steadily increased in Australia since 2003. Despite the newer bDMARDs, etanercept and adalimumab remain the two most used agents. The impact of strict initiation and continuation rules on overall expenditure is uncertain, but is likely to have lessened as prescribers have become more familiar with procedures. Prediction of expenditure on newly introduced high-cost drugs remains inaccurate despite substantial experience with the systems for restricted access. Present and future opportunities that must be explored to ensure that the goals of the National Medicines Policy are met include the strategic development, regulation and use of biosimilars. These endeavours should include analyses of authority prescription data which have been collected over the past 10 years and continue to be collected with the objectives of refining access and improving cost–effectiveness ratios.

Box 1 –
Timeline of bDMARD addition and subsidisation for RA on the PBS*


bDMARD = biological disease-modifying antirheumatic drug. RA = rheumatoid arthritis. PBS = Pharmaceutical Benefits Scheme. * Anakinra is an interleukin 1 receptor antagonist that is classified as a “biological response modifier”.

Box 2 –
Use and service cost per year (combined cost to PBS and RPBS) for anti-TNF and non-anti-TNF bDMARDS for treating patients with RA in Australia, 2003–2014*


bDMARD = biological disease-modifying antirheumatic drug. PBS = Pharmaceutical Benefits Scheme. RPBS = Repatriation Pharmaceutical Benefits Scheme. TNF = tumour necrosis factor. RA = rheumatoid arthritis. DDD = defined daily doses. * Anakinra is an interleukin 1 receptor antagonist that is classified as a “biological response modifier”; its use and expenditure has been included in the total bDMARD and non-anti-TNF bDMARD representations above.

Box 3 –
Use of individual bDMARDs for treating patients with RA in Australia, 2003–2014*


bDMARD = biological disease-modifying antirheumatic drug. RA = rheumatoid arthritis. * Anakinra is an interleukin 1 receptor antagonist that is classified as a “biological response modifier”.

Box 4 –
Cost of various bDMARDs for treating patients with RA in 2014

bDMARD

Typical maintenance dose

Most dispensed item code (strength)

Dispensed price for maximum quantity*

Total dispensing number

Total expenditure

Cost per dispensing


Abatacept

500–1000 mg IV every 4 weeks (weight based) or 125 mg SC once a week

1221G (4 × 125 mg)

$1754

15 785

$27 559 020

$1746

Rituximab

1 g IV for 2-dose course; repeat after > 6 months

9544H (1 × 500 mg)

$2033

1847

$8 296 451

$4492

Tocilizumab

4–8 mg/kg IV every 4 weeks (maximum, 800 mg)

9673D (1 × 400 mg)

$979

12 043

$14 753 071

$1225

Adalimumab

40 mg SC every 2 weeks

9100Y (2 × 40 mg)

$1775

43 820

$77 131 559

$1760

Certolizumab pegol

200 mg SC every 2 weeks

3425G (2 × 200 mg)

$1709

12 330

$20 927 569

$1697

Etanercept

50 mg SC once a week or 25 mg twice a week

9460X (4 × 50 mg)

$1775

31 001

$54 565 851

$1760

Golimumab

50 mg SC once a month

3429L (1 × 50 mg)

$1778

9851

$17 346 793

$1761

Infliximab

3–7.5 mg/kg IV every 8 weeks

5757B (1 × 100 mg)

$752

1041

$2 426 802

$2331


bDMARD = biological disease-modifying antirheumatic drug. RA = rheumatoid arthritis. IV = intravenous. SC = subcutaneous. ∗ Illustrates price to pharmacist for maximum quantity supplied; additional agreed fees may apply.6 † Although the costs of rituximab, infliximab and tocilizumab appear to differ, like other biological agents they have been added to the PBS on a cost minimisation basis, and therefore apparent cost differences are likely a reflection of different administration frequencies or the need for loading doses.5

Box 5 –
Criteria for PBS-subsidised initiation of a bDMARD for patients with RA

2003 to August 2010

August 2010 onwards


Demonstrably severe active RA* that has failed to achieve adequate response to:

  • methotrexate at a dosage of at least 20 mg weekly; and
  • methotrexate (at a minimum dosage of 7.5 mg weekly), in combination with two other DMARDs for a minimum of 3 months; and
  • Leflunomide, cyclosporin or leflunomide with methotrexate for a minimum of 3 months

Demonstrably severe active RA* that has failed to achieve adequate response to:

  • 6 months of intensive DMARD treatment, which must include:
    • 3 months of consecutive treatment with methotrexate at a dosage of at least 20 mg weekly (unless contraindicated); and
    • 3 months of one of sulfasalazine, hydroxychloroquine or leflunomide at an effective dose

PBS = Pharmaceutical Benefits Scheme. bDMARD = biological disease-modifying antirheumatic drug. RA = rheumatoid arthritis. DMARD = disease-modifying antirheumatic drug. ∗ Based on number of joints that are both swollen and tender (> 20 in total or four large joints) and one or more elevated inflammatory markers (erythrocyte sedimentation rate > 25 mm/hour or C-reactive protein level > 15 mmol/L).

Box 6 –
Service cost per year (combined cost to PBS and RPBS) to provide abatacept, tocilizumab, certolizumab pegol and golimumab to patients with RA, and predicted cost per year based on 5 years of use in RA, 2008–2014


PBS = Pharmaceutical Benefits Scheme. RPBS = Repatriation Pharmaceutical Benefits Scheme. RA = rheumatoid arthritis.

Box 7 –
Example questions to be addressed by a real-world database of restriction criteria data

Questions


What is the response to each bDMARD when prescribed according to current restriction criteria? Do any factors explain variance among patient populations?

Is the cost-effectiveness of bDMARDs, prescribed according to current restriction criteria, comparable with that predicted from trial data?

How do access and response to bDMARDs in remote areas compare with access and response in other areas? What is the differential between private versus public sector access and response?

How many patients have switched to the newer bDMARDs and is this due to documented failure?

What concomitant treatments are patients on bDMARDs receiving (eg, corticosteroids, conventional DMARDs), and do they affect response rates?

Are the response rates for biosimilars equivalent to that for the originator?

What is the impact on immunogenicity of changing between an originator and multiple biosimilar bDMARDs?


bDMARD = biological disease-modifying antirheumatic drug. DMARD = disease-modifying antirheumatic drug.

Management of pregnancy in women with rheumatoid arthritis

Rheumatoid arthritis (RA) is a common condition which occurs more frequently in women than men.1 Its prevalence is about 2% in Australia, and this is predicted to increase to 3% by 2032.2 Therefore, the need to manage pregnancy in a woman with RA is not an uncommon clinical scenario. Clinicians must be aware of the teratogenicity of certain disease-modifying antirheumatic drugs (DMARDs) used to treat RA, and must ensure that women taking these drugs are using reliable contraception. Clinicians also have an important role to play in prepregnancy counselling to facilitate informed decision making. We,3 and others,4 have identified unmet information needs among women with RA, including needs relating to contraception, pregnancy planning, pregnancy and early parenting. The aim of our review is to highlight pertinent issues in managing pregnancy in women with RA.

Effect of RA on fertility and pregnancy

Despite having normal ovarian reserves,5 women with RA have fewer children than women in a control group,6 and take longer to conceive.7 The reasons for smaller family size have not been fully elucidated but may include personal choice, uncontrolled inflammatory disease, sexual dysfunction secondary to RA and the effects of non-steroidal anti-inflammatory drugs on ovulation and implantation.8 Clinicians should be aware of the possibility of subfertility, discuss this issue with prospective parents, and refer to reproductive specialists, when appropriate.

A recent registry-based study reported increased rates of spontaneous abortion in women with RA, although previous studies suggested no increased risk.9 Increased rates of prematurity, pre-eclampsia, caesarean delivery and infants with a low birth weight have been reported in women with RA.1013 A Dutch study found that women taking prednisolone had higher rates of preterm delivery, and those with high disease activity were more likely to have caesarean delivery and infants with a low birth weight, but patients with well controlled RA had pregnancy outcomes comparable with those of the general population.14

Effect of pregnancy and lactation on RA

It was reported as early as 1938 that RA disease activity improved in 90% of women during pregnancy,15 and numerous subsequent studies have reported similar observations. A more recent prospective study of pregnant women with RA supports this finding, but suggests that rates of remission are more modest than traditionally thought, and that complete remission is uncommon.16 In this study, 39% of patients had flared by 26 weeks postpartum, confirming another long-held observation that women with RA are at increased risk of flare in the postpartum period. Women should be educated about the likelihood of postpartum flares and safe strategies to manage these events.

Because prolactin, a pituitary hormone integral to breastfeeding, is proinflammatory in animal models,17 the effect of breastfeeding on postpartum RA activity has been investigated. Despite two small studies suggesting that breastfeeding was associated with postpartum flares of RA,18,19 subsequent larger studies have not confirmed this association.20,21

Prepregnancy counselling

Given the teratogenicity of several DMARDs, treating practitioners have an obligation to ensure that patients with RA are counselled regularly about the importance of reliable contraception while taking these agents.22 One study found that 28% of women taking methotrexate (MTX) or leflunomide (LEF) used ineffective contraception.23 Another reported that despite 84% of women receiving correct contraceptive advice, one-third of women taking MTX or LEF were not using any contraception.24

It is estimated that up to 49% of pregnancies in the general population are unintended.25 If an unplanned pregnancy occurs in the setting of exposure to teratogenic drugs, the medications should be ceased immediately and the patient referred to a genetic counsellor and maternal–fetal medicine specialist for discussion of risk and further management.

Women with RA may question their practitioner about the possibility of RA inheritance. Controlled cohort studies have shown a relative risk of RA of 1.5–4.5 in first-degree relatives.26 Despite this modest increase in relative risk, patients can be reassured that the absolute risk of RA in their offspring remains small.

Good disease control before conception results in the best chance of low disease activity during pregnancy and a reduced risk of postpartum flare.16 Teratogenic medications need to be ceased and the several months it may take to ensure stability on a new drug regimen should be taken into account when planning pregnancy. Recommendations about cessation of medications before conception also extend to men on MTX and LEF (although there are no reports of teratogenicity in the children of men on either drug),27,28 and sulfasalazine (SSZ), which is known to reversibly impede spermatogenesis and reduce sperm motility and quality.29 A preconception referral to a maternal–fetal medicine specialist or obstetrician with an interest in high-risk pregnancy should also be considered.

Safety of drug therapy in pregnancy

Because of ethical concerns, pregnant and lactating women are specifically excluded from premarketing drug trials. Most pregnancy drug safety data are, therefore, derived from animal studies or postmarketing surveillance, case reports and large registries. In Australia, the Therapeutic Goods Administration pregnancy classification is used to categorise the safety of drugs in pregnancy (https://www.tga.gov.au/australian-categorisation-system-prescribing-medicines-pregnancy). It is not a hierarchical system, ie, it is not implied that a category B drug is safer than a category C drug. Although the pregnancy classification is widely used, in certain situations it is of limited use to clinicians in determining suitability of therapy. For example, while hydroxychloroquine (HCQ) and MTX are both category D drugs, only HCQ is considered safe in pregnancy, according to Australian practice guidelines.30

Of the DMARDs in current use, MTX and LEF are contraindicated in pregnancy and breastfeeding, and HCQ and SSZ are compatible with pregnancy.31 Of the biological agents, tumour necrosis factor (TNF) inhibitors may be continued until pregnancy is confirmed, with use in later gestation determined on a case-by-case basis,32 but all other biological agents should be avoided. If TNF inhibitors are used during pregnancy, live vaccinations should be avoided in the infant until 6 months of age, because of the risk of immunosuppression.33

Given the evolving nature of drug safety data, online resources are particularly helpful for clinicians. MotherToBaby (www.mothertobaby.org), a service of the Organization of Teratology Information Specialists, and LactMed (http://toxnet.nlm.nih.gov/newtoxnet/lactmed.htm), run by the United States National Library of Medicine, are two useful and regularly updated websites.

SEPSIS KILLS: early intervention saves lives

The increasing incidence of sepsis is well recognised, and is generally attributed to the growing prevalence of chronic conditions in ageing populations.13 In New South Wales, the number of patients with a diagnosis of sepsis in the Admitted Patient Data Collection (APDC) has increased, and sepsis was involved in 17.5% of in-hospital deaths in 2009, compared with a mortality of 1.5% for all hospital separations (unpublished data).

The clinical presentation of sepsis may be subtle; fever is not always present.4,5 In NSW, failure to recognise and respond to sepsis has been regularly reported. In 2009, 167 incidents were highlighted in a clinical focus report published by the Clinical Excellence Commission (CEC).6 A Quality Systems Assessment in 2011, completed by over 1500 respondents across the NSW hospital system, reported that 34% of clinical units did not have guidelines or protocols for managing sepsis.7

This article reports on the SEPSIS KILLS program of the CEC, which aims to promote the skills and knowledge needed for recognising and managing patients with sepsis in NSW hospital emergency departments.

Methods

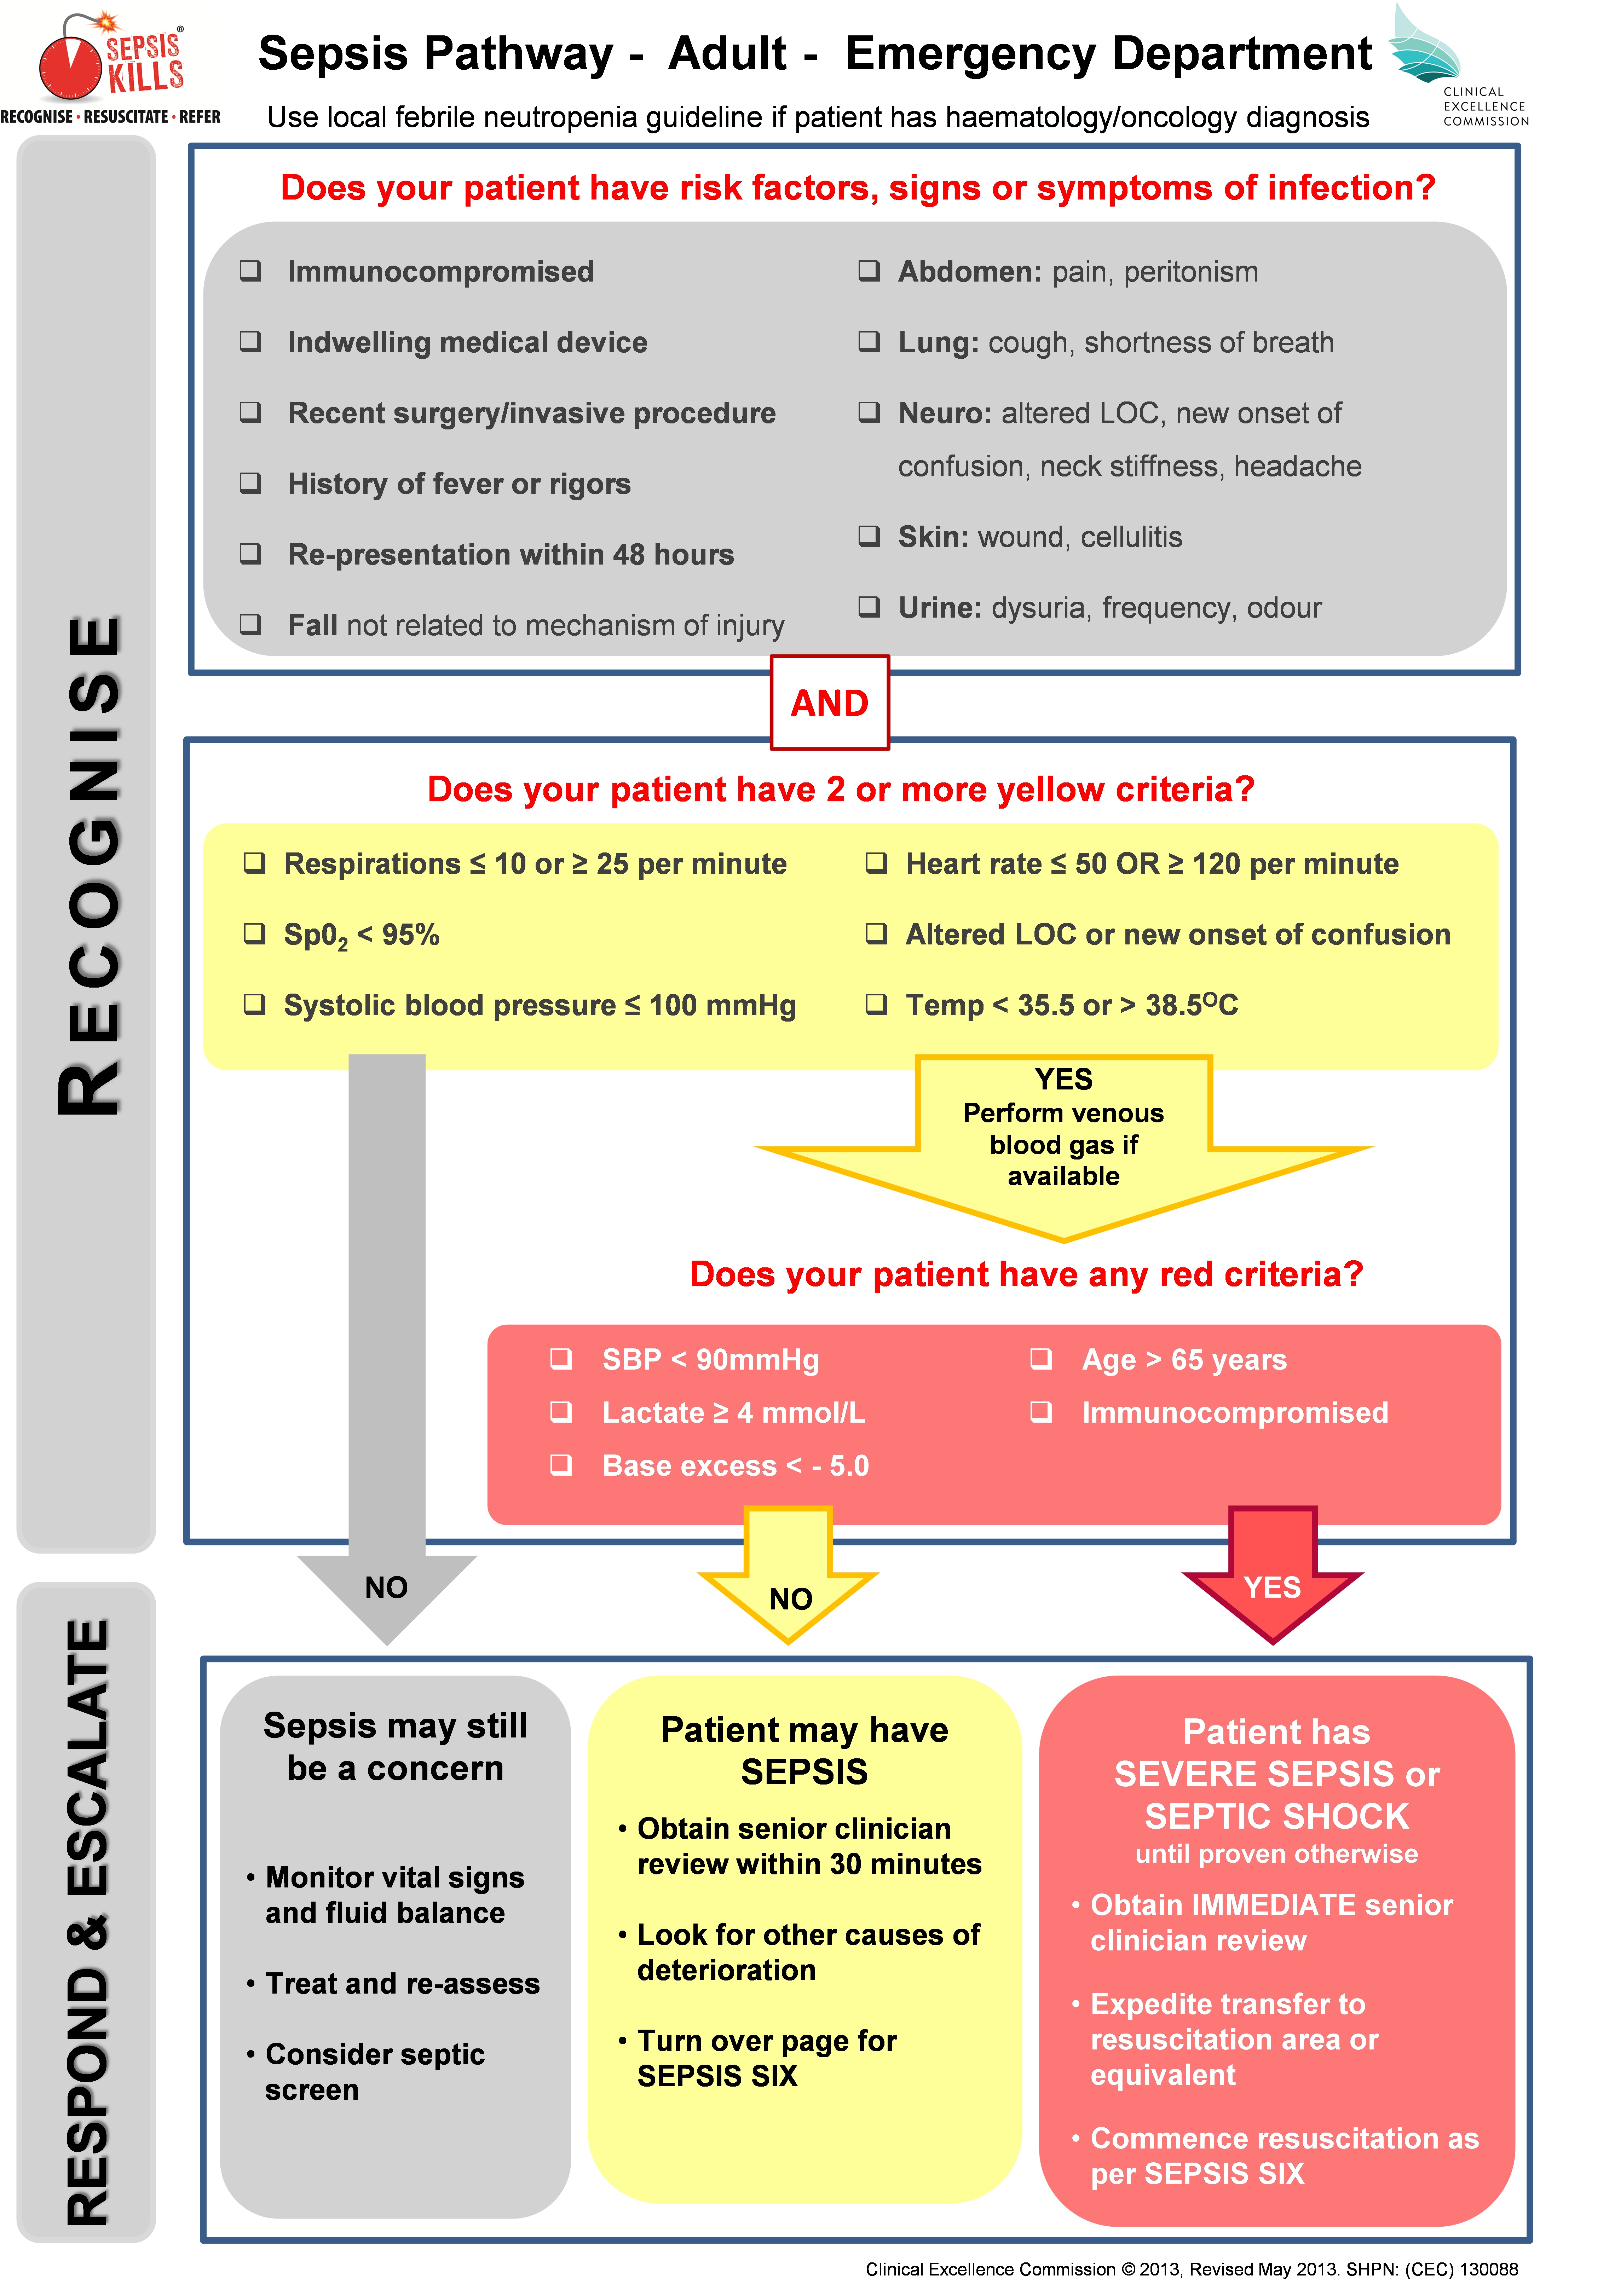
The focus of the program is to RECOGNISE risk factors, signs and symptoms of sepsis; RESUSCITATE with rapid intravenous fluids and antibiotics; and REFER to senior clinicians and teams. Standardised sepsis tools were developed in consultation with NSW emergency physicians, and included adult and paediatric pathways that built on the NSW deteriorating patient system, Between the Flags (BTF).8 The vital signs assessed in the sepsis pathways were consistent with BTF, and varied marginally from accepted systemic inflammatory response criteria (Box 1).

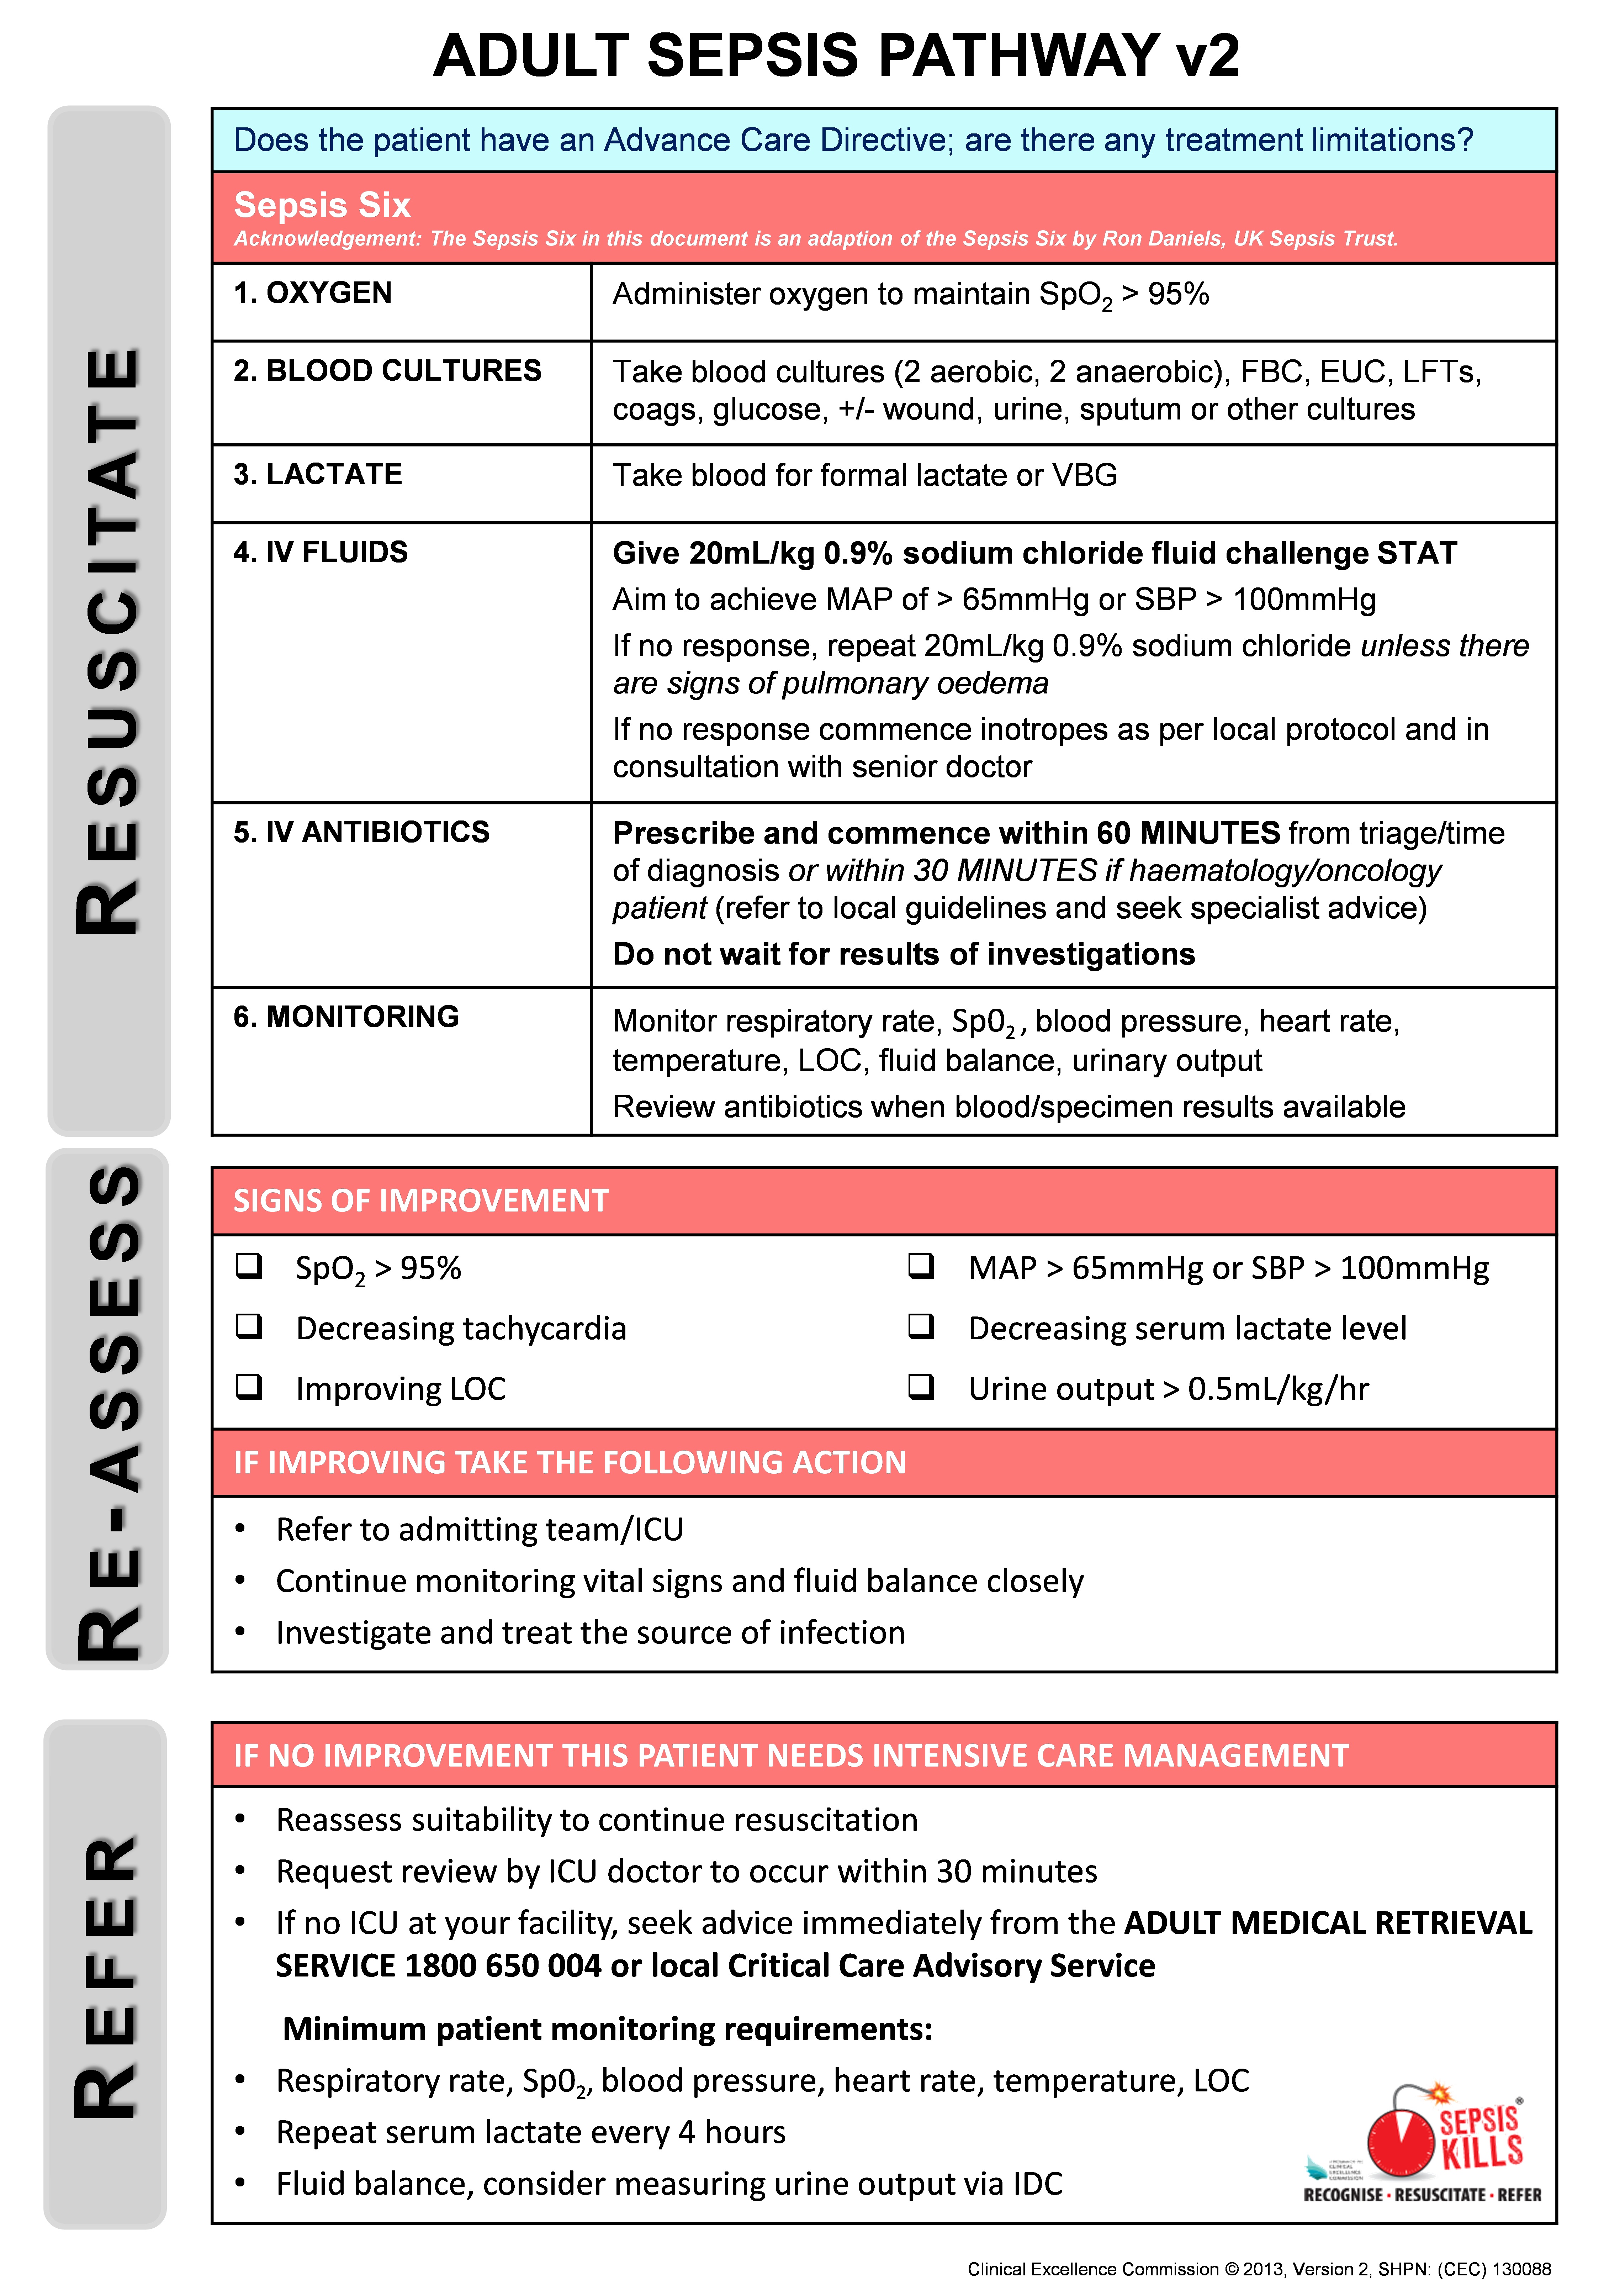
The SEPSIS KILLS pathways promote bundles of care, with the emphasis on early intervention. The adult bundle includes taking blood cultures, measuring serum lactate levels, administering intravenous antibiotics within an hour of triage and recognition, and administering a fluid bolus of 20 mL/kg, followed by another bolus of 20 mL/kg (if necessary) and inotropic drugs if the patient’s condition is not fluid-responsive. If no improvement is observed, senior medical review and admission to intensive care or retrieval to a major centre should be considered (Box 2). The paediatric bundle emphasises the importance of early senior clinical review and decision making. In addition, an empiric antibiotic guideline was developed with advice from expert infectious disease physicians. Emphasis was placed on the first dose of antibiotics, thereby allowing time for further assessment and diagnosis. Because of wide variations in practice, the guideline also contained details on how antibiotics could be administered most expeditiously.

The program was implemented in 2011 with a top-down, bottom-up approach, with strong leadership from medical and nursing clinical leads, and supported by the local health district Clinical Governance Units. Participation was not mandatory, and no extra resources were provided to participating emergency departments who implemented the program. The CEC team supported clinicians by holding a preliminary launch, monthly CEC–hospital teleconferences, executive reports, newsletters, site visits and workshops. A range of online resources was provided, including a Sepsis Toolkit (implementation guide) and various education tools.

Emergency departments were encouraged to collect prospective data on paediatric and adult patients with a provisional diagnosis of sepsis who had received intravenous antibiotics. An online sepsis database (from August 2011) facilitated collection of a minimum dataset for each patient that included their date of birth, triage time and date, triage category, clinical observations (including systolic blood pressure [SBP] and serum lactate levels), time and date of initial intravenous antibiotic treatment and of commencement of the second litre of intravenous fluid, the presumptive source of sepsis, and the disposition of patients following emergency department treatment. Data were collected either prospectively or by retrospective chart review. The database allowed emergency departments to monitor time to antibiotics and fluids in real time, and to compare this with the corresponding local health district and NSW data.

Ethics approval was obtained from the NSW Sepsis Register, which was developed as a public health and disease register under s98 of the Public Health Act 2011. The Sepsis Register is maintained by the CEC.

Data analysis

Analysis of process measures (time to antibiotic, time to intravenous fluid) was based on data from the SEPSIS KILLS database. A total of 13 567 SEPSIS KILLS records were submitted for linkage to the APDC to assess associations between in-hospital mortality and sepsis severity and patient disposition. Patients were classified by emergency department staff according to the Australasian Triage Scale (ATS).9 The cases were further classified as being severe or uncomplicated sepsis according to the serum lactate levels and presenting SBP of the patient.

To assess the population-level impact of the SEPSIS KILLS program, we analysed health outcomes (in-hospital mortality, hours in intensive care, length of stay) for paediatric and adult patients separated from NSW hospitals with ICD-10-AM (International Classification of Diseases, 10th revision, Australian modification) discharge diagnosis codes consistent with sepsis10 recorded in the Admitted Patient, Emergency Department Attendance and Deaths Register. This register was accessed through the NSW Ministry of Health Secure Analytics for Population Health Research and Intelligence (SAPHaRI) system. Linkage was undertaken by the Centre for Health Record Linkage (CHeReL). Only patients admitted to public hospitals with emergency departments were included in the analysis. Trend analysis was performed for the run-in period, August 2009 – December 2011, and for the two following years, 2012 and 2013. Outcomes by sepsis severity could not be analysed at the population level because of the lack of consensus about using ICD-10-AM codes to differentiate between severe and uncomplicated sepsis.

Descriptive and inferential analyses included the calculation of frequencies, odds ratios (ORs) and 95% confidence intervals, and χ2 tests for trends. Trends over time for process and outcome measures were assessed in regression models. Logistic regression was used to analyse in-hospital deaths, while linear regression models were used for time in intensive care and lengths of stay. Models were adjusted as appropriate for covariates (age, year, triage category and severity of sepsis). Statistical significance was defined as P < 0.05.

Results

The SEPSIS KILLS program was implemented as individual emergency departments became ready during 2011. Both retrospective and prospective data were collected by 97 hospitals to 31 December 2013 and entered into the sepsis database. Data were submitted by 13 tertiary, 19 metropolitan and 65 rural hospitals. Because of the low number of paediatric patients, analysis was restricted to data for adult patients.

The provisional sources of sepsis included the lungs (5216 patients, 40.5%), urinary tract (2998, 23.2%), abdomen (1077, 8.4%), skin or soft tissue (975, 7.6%), musculoskeletal system (98, 0.8%), central nervous system (96, 0.7%), vascular device (82, 0.6%), and other systems (973, 7.6%). For 1238 patients (9.6%) the source was unidentified, for 133 (1.0%) no source was recorded.

There were age data in 12 879 records. There was a significant reduction in the mean age of patients between 2009 and 2013, from 67.3 years in 2009–2011 to 64.8 years in 2013 (P < 0.001 for trend; Box 3).

Data for the process indicators from the CEC sepsis database are summarised in Box 3. The proportion of patients who were categorised at triage as ATS 1 (“see immediately”) rose from 2.3% in 2009–2011 to 4.2% in 2013. Those categorised as ATS 2 (“see within 10 minutes”) increased from 40.7% in 2009–2011 to 60.7% in 2013 (P < 0.001). There were small reductions in the proportions of patients classed as ATS 3, 4 or 5.

The proportion of patients who received antibiotics within 60 minutes of triage or recognition increased from 29.3% in 2009–2011 to 52.2% in 2013 (linear trend test, P < 0.001). Similarly, the number of patients who started a second litre of intravenous fluid within one hour rose from 10.6% to 27.5% (linear trend test, P < 0.001).

The analysis of population-based APDC data, which included all separations with emergency department involvement from public hospitals in NSW between January 2009 and December 2013, is presented in Box 4. There were 15 801 sepsis hospital separations during the run-in period of 2009–2011, with a mortality of 19.3%. This rate declined to 17.2% in 2012 and 14.1% in 2013. There was a significant linear decrease over time (P < 0.0001); the OR for death (compared with the run-in period) was 0.87 (95% CI, 0.80–0.94) in 2012, and 0.69 (95% CI, 0.63–0.74) in 2013. Significant linear declines were also observed for time in intensive care and length of stay (for each trend: P < 0.0001).

Linkage of the APDC and sepsis databases showed that the mortality rate for the 1616 patients with severe sepsis (serum lactate ≥ 4 mmol/L or SBP < 90 mmHg) was 19.7%; these patients were significantly more likely to die than patients with uncomplicated sepsis (serum lactate < 4 mmol/L and SBP ≥ 90 mmHg) (OR, 3.7; 95% CI, 3.2–4.4; P < 0.0001). The mortality rate for the 893 patients with hyperlactataemia (a lactate level of 4 mmol/L or more; reference interval, 0.5–2.0 mmol/L) was 24.9%, while that for 637 patients presenting with cryptic shock — hyperlactataemia together with normotension (SBP ≥ 90 mmHg) — was 21.2%. There was no change in mortality for either group over time. For 734 patients who presented with SBP < 90 mmHg and lactate levels < 4 mmol/L, mortality was 13.5%, which declined significantly across the study period (2009–2011, 16.5%; 2012, 16.0%; 2013, 9.8; P = 0.03). The overall mortality rate for uncomplicated sepsis patients increased significantly over time: 3.7% (21/567) in 2009–2011, 6.2% (145/2336) in 2012, and 6.7% (145/2164) in 2013 (P = 0.02).

The mortality rate for the 268 ATS 1 patients was 28.8%. The risk of death for patients over 65 years of age was 3.3 times higher (95% CI, 2.6–4.1) than for patients under 65 years of age (P = 0.001).

The mortality rate for 543 severe sepsis patients admitted to intensive care did not change significantly over time — 23.4% (2009–2011), 19.5% (2012) and 16.0% (2013) (P = 0.145) — nor did the proportion of the 1073 patients with severe sepsis who were admitted to the ward and died — 21.4% (2009–2011), 21.5% (2012) and 18.4% (2013) (P = 0.263). In contrast, the risk of death for 4225 patients with uncomplicated sepsis admitted to the ward increased significantly: 3.2% (15/466) during 2009–2011, 6.0% (115/1914) during 2012, and 6.2% (115/1845) during 2013 (P = 0.047).

Discussion

SEPSIS KILLS is a quality improvement program that aims to reduce preventable harm to patients with sepsis by recognising the condition early and managing it promptly. It is based on the principle that early recognition and aggressive management with antibiotics and fluids will improve outcomes.1113 It is consistent with the 3-hour component of the resuscitation bundle outlined in the international guidelines of the Surviving Sepsis Campaign.3

The program was not planned as a before-and-after project, but was independently implemented by individual emergency departments during 2011. More than 80% of NSW emergency departments (175 of 220) used the sepsis pathways, and 97 emergency departments submitted over 13 000 records. The resulting increase in the number of patients for whom antibiotics were initiated within 60 minutes of recognition and the increased likelihood of the second litre of fluids being started in the first hour indicate that the program was successful. Greater urgency is also apparent from the marked increase in the number of patients classified at triage as ATS 2. We cannot, however, explain the significant age difference between the patients seen in 2012 and 2013.

Reviewing the population-based APDC hospitalisations with an ICD-10-AM code for sepsis showed that there was a steady reduction in mortality over time. Contrary to what we expected, the survival benefit in our patients appears to have been greatest for those with evidence of haemodynamic instability (SBP < 90 mmHg) but normal lactate levels.

The mortality rate of 15%–20% for patients admitted to intensive care with severe sepsis (one-third of the overall sample) is consistent with the overall mortality rate in Australian and New Zealand intensive care units.14,15 In 2013, the crude mortality rate for the patients admitted to wards was higher than that for the intensive care group. We believe the relatively high proportion of ward patients may be the result of an underappreciation of the potential mortality of sepsis, of the significance of elevated lactate levels, and of the time course of the septic process, as well as of failure to recognise cryptic shock16 and the obvious and practical problem of intensive care unit bed availability. We did not assess how many had end-of-life treatment limitations in place.

Managing large numbers of patients with sepsis on the wards has been described elsewhere.17,18 These patients have not been well studied, although a number of studies have identified deficiencies in care.1921 The significant increase in mortality among patients with uncomplicated sepsis admitted to the ward causes concerns that some of our ward patients may have qualified for intensive therapy. An increase in mortality in less severe sepsis has also been documented by other authors.22

The major challenge was managing the prescribing of antibiotics. Despite general acceptance of expert guidelines for prescribing antibiotics, differences in their prescription and administration were observed. This evidence–practice gap is well recognised,23 and the empiric antibiotic guideline was developed to promote appropriate antibiotic prescribing practices and optimal outcomes.24 The empiric guideline was consistent with the principles of antimicrobial stewardship, and, while each site was allowed to modify it according to local opinion and antibiotic resistance patterns, changes were infrequent. Particular anxieties were expressed about prescribing and administering gentamicin. The administration component of the guideline was developed to promote the most expeditious method of administration rather than favouring the slow infusion that had become normal practice. Despite the emphasis on the first dose and timely review, antibiotics were often continued long after they should have been reviewed, following consideration of the results of pathology investigations.

Other challenges beyond our control included educating a high turnover workforce in emergency departments, as well as medical engagement, particularly in rural facilities where governance is difficult and there is no doctor on site, or locum medical staff are more common. There were wide variations in the methods of blood culture collection, and a standardised guideline for blood cultures was subsequently added to the Sepsis Toolkit.

Limitations

This work is subject to the limitations of any quality improvement project at multiple sites. The prolonged run-in period was not ideal. Our approach was not to measure compliance with the care bundle, as undertaken elsewhere, but to use time as a measure for promoting behavioural change among emergency department clinicians. Assessing patient outcomes was the major difficulty. The voluntary nature of data collection resulted in its inconsistent submission, and the lack of strict diagnostic criteria for sepsis resulted in patients with conditions from across the inflammatory condition–sepsis spectrum being included in the SEPSIS KILLS database. Resource limitations also meant that some sites implemented the pathways but did not submit data.

Reviewing the outcomes of patients with an ICD-10-AM code for sepsis in the population-based administrative APDC is an accepted approach. This, however, entails the risk of reviewing the outcomes of a different group of patients, a group for whom the final diagnosis might not be directly related to sepsis or its severity. This is a potential problem when comparing the final diagnosis in the APDC database with the provisional diagnosis in the SEPSIS KILLS data.

Finally, the improved outcomes described in our article may be the result of the SEPSIS KILLS program, but may also be related to other initiatives for improving quality of care.

Implications for clinicians, researchers and policy makers

The observation that patients with severe sepsis are being managed on the wards highlights the need for a shift in the focus of both practice improvement and research from intensive care to ward management. It also raises the problem of sepsis and the deteriorating patient. We informally estimated that around 30% of patients who required a Rapid Response call had sepsis, but this may be an underestimate, with rates possibly as high as 50%–60%.25 Finally, our work confirms the need for continued research into risk stratification tools for sepsis in the emergency department. In the meantime, all patients with lactate levels of 4 mmol/L or greater require intensive care unit review and admission.

The SEPSIS KILLS program promotes early recognition and management of sepsis during the first few hours in NSW emergency departments. By focusing on the principle of “Recognise, Resuscitate, Refer” it is possible to reduce the time before antibiotics are administered and fluid resuscitation initiated. This program could be applied in other jurisdictions and its integration with antimicrobial stewardship requirements should be considered.

Box 1 –
The SEPSIS KILLS pathway for adult patients in hospital emergency departments, page 1

Box 2 –
The SEPSIS KILLS pathway for adult patients in hospital emergency departments, page 2

Box 3 –
Characteristics, and process and outcome indicators of sepsis-related hospital separations before and after the launch of the SEPSIS KILLS program

Characteristics

Run-in period


SEPSIS KILLS program in operation


P for trend

Aug 2009 – Dec 2011

2012

2013


Number of separations

1585

5396

5905

Mean age ± SEM, years

67.3 ± 0.5

67.6 ± 0.3

64.8 ± 0.3

< 0.001

Triage category*

< 0.001

1

37 (2.3%)

176 (3.3%)

242 (4.2%)

2

463 (40.7%)

2765 (51.5%)

3532 (60.7%)

3

683 (43.2%)

2034 (37.9%)

1767 (30.4%)

4

207 (13.1%)

378 (7.0%)

267 (4.6%)

5

10 (0.6%)

16 (0.3%)

12 (0.2%)

Missing data

5

22

83

Antibiotic received within 60 min

464 (29.3%)

2165 (40.2%)

3083 (52.2%)

< 0.001

Second litre of intravenous fluid within 60 min

135 of 1272 patients (10.6%)

521 of 3631 patients (14.3%)

991 of 3609 patients (27.5%)

< 0.001


SEM = standard error of the mean.

Box 4 –
Hospital outcomes prior to and after the launch of the SEPSIS KILLS program, NSW, January 2009 to December 2013

Outcomes

Descriptive statistics

Odds ratio (95% CI)

P for trend


Deaths, numbers (percentage)

< 0.0001

2009–2011

3053/15 801 (19.3%)

1

2012

979/5683 (17.2%)

0.87 (0.80–0.94)

2013

870/6167 (14.1%)

0.69 (0.63–0.74)

Mean time in intensive care (SEM), hours

< 0.0001

2009–2011

32.7 (1.0)

2012

26.6 (1.4)

2013

25.8 (1.3)

Mean length of stay (SEM), days

< 0.0001

2009–2011

13.5 (0.1)

2012

12.2 (0.2)

2013

11.5 (0.2)


SEM = standard error of the mean. Source: Admitted Patient Data Collection, NSW Ministry of Health Secure Analytics for Population Health Research and Intelligence (SAPHaRI). Data extracted on 1 June 2015.

Therapeutic drug safety for Indigenous Australians: how do we close the gap?

In the setting of significant disease burden, lack of data on drug safety for Australia’s Indigenous population is concerning

Indigenous Australians have a high burden of disease and are at increased risk of premature death compared with the general Australian population. Cardiovascular disease accounts for a large proportion of this burden, with high prevalence of type 2 diabetes and chronic renal failure being underlying risk factors.1 Traditional cardiovascular risk calculators underestimate risk in Aboriginals and Torres Strait Islanders. For example, observed numbers of coronary events for Indigenous Australians who live in remote areas are 2.5 times higher than predicted using the Framingham risk calculator, and younger women in this population have 30 times the predicted rate of events.2 While this suggests that solely focusing on management of traditional risk factors may not be the complete answer, this high burden of disease in the Indigenous population can drive recommendations for early and extensive use of medicines.

National guidelines recommend using lower thresholds to screen for and manage cardiovascular risk factors such as hyperlipidaemia in the Aboriginal and Torres Strait Islander population.3 Aggressive primary preventive measures for asymptomatic and young people, including early use of statin therapy, is recommended, despite limited direct evidence regarding efficacy in this population. It is also recognised that there are differences in the lipid profile of Indigenous Australians compared with non-Indigenous Australians, which may influence efficacy of therapies.4

Effective medications have adverse effects. Knowledge regarding drug safety is obtained across the lifecycle of drug use: throughout drug development programs, controlled clinical trials, and post-marketing experience. Drug development programs often do not include Indigenous Australians and few randomised controlled trials have been performed in this population. For many years (since the 1950s), the cornerstone of post-marketing safety has been spontaneously generated reports of adverse drug reactions from health care professionals and consumers. More recently, there has been an increasing focus on proactively investigating drug safety and using risk management plans in the post-marketing phase, rather than simply relying on spontaneously generated reports. Drug sponsors are required to report post-marketing adverse drug events to the Therapeutic Goods Administration (TGA), and certain groups are recognised as requiring special mention and consideration as they are often missing from clinical trials.5 Attention is given to reporting the safety of medications in older people and paediatric populations, and in pregnant and breastfeeding women. However, in Australia, there are no specific reporting requirements for ethnic groups, including Aboriginals and Torres Strait Islanders.

The Australian spontaneous adverse drug reporting system has only included a field to indicate racial status as “ATSI” (on the electronic form, not the paper form) since 2008, but this is not reliably completed (TGA, personal communication, 2013). Risk management plans are generally developed for specific products, rather than specific at-risk populations. Therefore, drug safety in Aboriginals and Torres Strait Islanders does not have a robust evidence base. The potential for harm is real.

In the face of this substantial uncertainty, several things are known.

First, the Australian Indigenous population, while ancient in tradition and culture, is a relatively youthful population in 2015. In 2011, the median age was 21.8 years, compared with 37.6 years for the non-Indigenous population.1 The significance of this is that a younger group of people are exposed to drugs when starting cardiovascular screening and primary preventive treatment, leading to potentially longer cumulative lifetime exposure.

Second, differences in drug response — efficacy and harm — exist in racially and ethnically distinct groups.6 Aboriginals and Torres Strait Islanders are a very diverse population, with over 250 different language groups,2 and it may be inappropriate to generalise what little information we do have with regard to efficacy and safety for the group as a whole. The causes of racial and ethnic differences in drug responses may be multifactorial. Potential intrinsic differences (eg, variation in genetics, metabolism and elimination) and extrinsic factors (eg, diet, environmental exposure and sociocultural factors) may play a role. In cardiovascular medicine, it has been established that African Americans respond poorly to β blockers and angiotensin-converting enzyme (ACE) inhibitors,7,8 and ACE inhibitor-associated angioedema is more prevalent (and possibly more severe) in African Americans than in white people.9 Racial and genetic variation contributes to variation in susceptibility to statin-associated myopathy,10 so lower initial statin drug doses are suggested for patients with Asian ancestry.7

In the past decade, pharmacogenomics has advanced significantly, and moved from an individual candidate gene approach to the use of genome-wide association studies — that is, studies that compare the genomes of those affected by a disorder or drug-induced adverse effect to the genomes of those who are unaffected. Genome-wide association studies have consistently identified common variants in SLCO1B1 (a gene encoding the organic anion-transporting polypeptide OATP1B1, which regulates hepatic uptake of statins) that are strongly associated with an increased risk of statin-induced myopathy.11 The prospective use of genotyping can help avoid adverse pharmacogenomic effects. Genotyping can also prevent classification of whole populations as diverse ethnic groups that are at universally high risk. For example, the Han Chinese have been identified as being at higher risk of Stevens–Johnson syndrome and associated severe toxic epidermal necrolysis when treated with carbamazepine. However, the discovery that HLA-B*1502 carriers are the at-risk group has enabled successful genotype screening and treatment of HLA-B*1502-negative Han Chinese without any instances of Stevens–Johnson syndrome or toxic epidermal necrolysis.12

Third, it is known that harm occurs. In recent years, evidence has emerged from case reports and case series regarding drug safety and adverse drug reactions in Indigenous Australians, and some very significant adverse events from use of marketed medications have been published. Indigenous Australians may be at higher risk of serious, and potentially fatal, statin-associated myotoxicity,1315 particularly in the setting of vitamin D deficiency.14 Recently, three cases of ACE inhibitor-associated angioedema involving airway compromise in Aboriginal Australians were reported.16 A genetic predisposition to a specific adverse drug reaction in the Indigenous population has also been suggested; a shared HLA-B allele was identified in three unrelated Indigenous patients who had severe phenytoin hypersensitivity syndrome, two of whom died.17

The paucity of data on potential adverse drug reactions in the setting of a marked disparity in health standards between Indigenous and non-Indigenous Australians is of great concern. It is time to close the gap in drug safety information for Indigenous Australians. How will this be achieved?

The challenge is made greater by having to carefully balance the significant need for drug safety data while not further disadvantaging Aboriginals and Torres Strait Islanders. It is unrealistic and probably unethical to demand that all drugs be tested in an Aboriginal and Torres Strait Islander population before TGA approval. The financial costs alone would be prohibitive and this would significantly delay the introduction of new medications into the Australian market. This would also place a disproportionate burden on a minority group in terms of drug trial participation.

It is in the post-marketing space that a comprehensive and proactive approach to addressing drug safety in Indigenous Australians is urgently needed. The community as a whole — including health care providers, professional organisations, patients and regulators — needs to recognise the significant lack of drug safety data available for Indigenous Australians and actively participate in promoting safety, including adverse event reporting.

All policies and guidelines promoting the quality use of medicine in the Aboriginal and Torres Strait Islander population must include a robust pharmacovigilance strategy and an acknowledgement of the limitations of drug safety information in this population. The assessment and management of potential adverse drug reactions should be part of any comprehensive health care program. Aboriginal health care workers, like all health care professionals, need training in pharmacovigilance, the principles of drug safety, and the identification and reporting of adverse drug reactions. This should be accompanied by culturally appropriate resources and tools to help them and their patients identify and manage adverse drug reactions. When adverse drug reactions do occur, these should be thoroughly investigated.18 Advances in other industries, typically aviation, have come from engaging with failures and investigating and reviewing bad outcomes.19

The same can be said of drug safety for Aboriginals and Torres Strait Islanders as for pharmacovigilance in general; it is not enough to be “content with an absence of evidence on harms … we need to move to a position where we have evidence of absence of harm”.20

Long courses, confusion and culture: why we’re losing the fight against antibiotic resistance

Doctors often tell patients to take a “course” of antibiotics, because a partially treated infection may result in relapse with antibiotic-resistant bacteria. But where does this advice come from?

As Lyn Gilbert has pointed out on The Conversation, there isn’t good evidence behind many of these recommendations. For GPs, the main determinant of the duration of antibiotics is the size of the pack they come in.

In hospitals, we also have some odd rules about antibiotics:

  • Prime numbers for durations of up to a week (three, five or seven days)
  • Even numbers for more serious infections that take weeks to eradicate (two, four or six weeks)
  • Multiples of three for really tenacious infections such as bone infections (three months) or TB (six months).

Of course, there is nothing magical about these numbers. I doubt anyone was harmed by stopping their treatment on day 89 instead of day 90.

Although this seems rather silly, it highlights the serious point that we often don’t know exactly how long is necessary to treat many infections.

The evidence base for these recommended durations comes from the duration used in previous studies. But shorter courses often haven’t been tested. Clinical trials that test shorter durations of treatment aren’t as sexy as those testing a new antibiotic, but are also important.

If we could safely treat infections with shorter courses of antibiotics, this might help reduce the risk of antibiotic resistance developing in bacteria. On the other hand, inadequate treatment of infections can increase the risk of resistance, so the optimal treatment length is “just enough”.

Grey areas in clinical diagnosis

One of the most difficult areas for new doctors is dealing with uncertainty. It is easy to catastrophise: every headache could possibly be meningitis, every cough could be pneumonia, every fever could be the harbinger of an overwhelming infection. The problem is, sometimes they are. The junior (and senior) doctor’s worst nightmare is to miss a serious diagnosis, be responsible for a patient’s death and end up in court.

Given this uncertainty, it isn’t surprising that doctors sometimes over-prescribe antibiotics. Despite clinical guidelines not to prescribe antibiotics for viral infections – and knowledge that antibiotics don’t benefit patients who have bronchitis – it is easy to rationalise why “my” patient might be different.

Patients don’t present to their doctors with a diagnosis; when doctors make the decision to prescribe antibiotics they rarely have the results of a test for viral flu, or a chest x-ray to diagnose pneumonia. Even in hospitals, where access to diagnostic tests isn’t really a problem, the results of the test may not be available until well after the decision to prescribe antibiotics is made.

Another example is in sinusitis. The clinical trials that looked at the role of antibiotics in sinusitis largely focused on those presenting to GPs in the community. They show little or no benefit for patients given antibiotics compared to those who did not receive antibiotics.

But what about patients who need to be hospitalised with sinusitis? What about a patient with sinusitis who responded well to antibiotics last time? What about a patient with sinusitis who had a heart transplant and is on medication to heavily suppress her immune system? Or the frail elderly patient with multiple chronic illnesses who probably wouldn’t survive a serious infection?

One way we have been combating this problem in hospitals is to have “post-prescription” reviews. A team of pharmacists and infectious diseases specialists checks the notes and tests of patients who are prescribed broad spectrum antibiotics two to three days after they are started, with the sole aim to see if something better could be used.

This recognises that simple rules for prescribing don’t account for how complicated patients can be, and that not all the information may be available when the initial decision is made.

Benefits for the individual, harm to others

Antibiotic resistance is, in many ways, a lot like global warming. We want to be warm and well fed, live comfortably in large houses and take holidays in exotic locations, but don’t want to think about the consequences for the environment.

As Alex Broom wrote on The Conversation, doctors want the best for their patient, and giving antibiotics to treat or prevent infection provides a potential benefit for the patient. It is hard enough deciding on the balance of benefits and harms for the patient in front of you, let along the potential “harms” to the wider community.

Cultural factors may be particularly important in clinical decision-making. When I worked in the United States, there was a strong feeling among many doctors that the individual being treated was the patient, and the impact on other patients was very much a secondary consideration. I once heard a doctor saying he used new, broad spectrum antibiotics because he wanted his patient to benefit from them before the bacteria became resistant to it.

On the other hand, the northern Europeans are well known for their low rates of antibiotic use and resistance.

I once worked in a hospital in Denmark and had a patient who was rather unwell with sinusitis, which had caused fever for more than two weeks. I explained to him that while the evidence generally didn’t support the use of antibiotics for sinusitis, prolonged illness was a situation where we might consider using antibiotics. He said to me that he would prefer to wait a few more days, just to see if he might avoid the need to take antibiotics.

In addition to the obvious cultural differences between Americans and Europeans, this suggests that education is required for both doctors and patients. Australia’s National Prescribing Service is running a Resistance Fighter campaign to raise awareness of the dangers of unnecessary antibiotic use.

Research findings that antibiotic use actually increases the risk of resistance in the patient, and isn’t just a hypothetical problem in a far-off future, is also an important message.

It is easy to make excuses for poor prescribing and no doubt a significant proportion of antibiotics are not required. We could do more by researching the optimal durations of treatment for different infections, setting up systems to deal with clinical uncertainty and educating both doctors and patients about the trade-off between antibiotic use and resistance.

The Conversation

Allen Cheng, Professor in Infectious Diseases Epidemiology, Monash University

This article was originally published on The Conversation. Read the original article.

Other doctorportal blogs

Pharmaceutical industry exposure in our hospitals: the final frontier

The relationship between the medical profession and the pharmaceutical industry has changed considerably over the last two decades. While the days of expenses-paid overseas conferences and golf trips may be over, pharmaceutical company presence is still felt not only in private practice but also in our hospitals.

Some of these interactions benefit patients; in particular, industry-sponsored clinical trials and research studies in hospitals. Besides generating new evidence and drugs, patients who participate in clinical trials in hospitals appear to have better outcomes and lower mortality.1 However, there is a risk that industry sponsorship may unduly influence clinician researchers or the hospital itself. To reduce (but not eliminate) this risk, hospitals must comply with mandatory national research governance frameworks through the implementation of local policies and procedures, and researcher codes of conduct, overseen by research ethics committees.2

On the other hand, pharmaceutical company-sponsored medical education for doctors and students risks the presentation of biased evidence and subsequent poorer treatment choices for patients. All industry influence in hospitals should be transparently acknowledged and carefully examined in order to minimise potential harms.

Universities and hospitals have a mixed record when it comes to protecting doctors and medical students from making biased decisions by implementing policies to restrict exposure. Across Australia, health services struggle to take the final step to eradicate pharmaceutical company presence. This hesitation may be due to subtle underlying cultural and financial dependence on pharmaceutical company sponsorship, as well as a commonly held belief that small exposures are fairly harmless.

This contrasts with the community sector, where the No Advertising Please campaign launched in 2014 (http://www.noadvertisingplease.org) encouraged doctors to pledge to avoid ever seeing pharmaceutical company representatives, recognising that prescribing decisions are influenced even by these small exposures to marketing.

One of the biggest obstacles to complete eradication of undue influence from advertising is that the medical community continues to hold positive attitudes towards market-oriented activities of the pharmaceutical and medical device industries.3,4 This is often correlated with the belief that the information from pharmaceutical company representatives is trustworthy, and that these interactions are therefore beneficial to patient care.5 Some argue that this commercial promotion is far more effective in conveying essential information to clinicians than publicly funded drug information and, therefore, that we should be prepared to tolerate influence on prescribing behaviour.6

In a 2010 systematic review,7 Spurling and colleagues effectively excluded the existence of any reliable evidence that information sourced from pharmaceutical company representatives improves the prescribing habits of doctors. In the robust debate following the No Advertising Please campaign, the pharmaceutical industry was unable to point to any such evidence.

Despite acknowledgement of study findings to the contrary, doctors commonly state that they are able to effectively manage pharmaceutical company representative interactions such that their own prescribing is not adversely impacted.5 In one study, whereas 51% of surveyed doctors agreed that pharmaceutical company representatives had a large influence on other doctors’ prescribing habits, only 1% believed that this influence applied to themselves.8

Another reason for the loss of momentum is that doctors share a belief that a sponsored lunch at a morbidity and mortality meeting, for example, is harmless; that a small exposure, be it a gift or sponsored lunch, is unlikely to have a significant impact on prescribing practices.7,9 Yet the pharmaceutical industry, which owes it to shareholders to be at the forefront of marketing psychology, continues to spend billions of dollars on this small-scale sponsorship. In a trial involving 352 medical students, exposure to a logo on a notepad or clipboard resulted in more favourable implicit attitudes about that brand-name drug compared with the control group.10

Exposure to pharmaceutical products and branding is likely to affect an individual’s objectivity towards the brand, and his or her prescribing behaviour in relation to associated products. A 2010 systematic review showed that doctors’ exposure to pharmaceutical promotional material was associated with, on average, higher prescribing frequency, higher costs and lower prescribing quality.7 In 2011, a systematic review found that medical students’ exposure to pharmaceutical company marketing increased positive attitudes towards that exposure.11

Change requires a two-pronged approach

First, ongoing education continues to be necessary to inculcate change in the profession regarding pharmaceutical industry interactions.5 Education, particularly of trainees, should be part of this cultural transition,3 as there is some evidence that education is protective; in places of strict pharmaceutical regulation, individuals are less influenced when exposure does occur.10 Education aims to eradicate the belief that an individual is exempt from influence, and to improve reception to organisational change.

Second, specific policies and strategies must be consistently implemented.5 These should address pharmaceutical company relationships specifically, as well as conflicts of interest more generally.11 A united approach would be ideal, with reinforcement and support from colleges and registration boards. All members of health care staff require education and support regarding conflict of interest policies and procedures. These strategies are already being achieved at a medical school level4,11 and need to be effectively implemented at a health service level.

The systems that many public hospitals currently use to promote appropriate prescribing behaviour should be reinforced. These include formulary systems, electronic medical management systems, drug and therapeutic committees, prescribing guidelines, clinical pharmacist input, antimicrobial stewardship programs, and therapeutic equivalence programs. These systems should remain strictly independent of any pharmaceutical industry input, and merely recording conflicts of interest at the start of meetings is an inadequate solution. Pharmaceutical company-sponsored clinical trials are an important component of medical research that occurs in hospitals, and such systems reduce undue influence.

The financial burden associated with this form of divestment is acknowledged, and therefore a gradual transition may be ideal. Various organisations within the medical community have managed to effectively transition away from reliance on pharmaceutical company money, sometimes instead accepting alternative sponsorship, such as from medical defence or medical finance organisations.12

Case study 1: medical students

The Australian Medical Students’ Association (AMSA) was the first Australian medical organisation to completely remove reliance on pharmaceutical company sponsorship. This was later mirrored in America, where the American Medical Students’ Association did the same, as part of a rigorous conflicts of interest reform.13

From 1994 to 2004, the issue of pharmaceutical company sponsorship at AMSA events was hotly and repeatedly contested. At the July 2005 AMSA Council, following an extensive survey of medical students’ attitudes, representatives from each of the Australian medical schools passed the policy. In 2007, a working party examined the research on the influence of pharmaceutical exposure on medical students and eventually drafted the AMSA guidelines governing these interactions.14 Over the next few years, AMSA gradually moved sponsorship opportunities nationally to medical indemnity and financial organisations. As an organisation with an annual turnover of $3.2 million and heavily dependent on sponsorship, this was no small feat. Current AMSA sponsorship guidelines are so rigorous that they preclude companies with a subsidiary that sells pharmaceutical products.12 This case study shows that reliance on pharmaceutical company sponsorship can be removed successfully at an undergraduate level.

Case study 2: public hospital doctors

Monash Health is Victoria’s largest public health service, covering five major hospitals, and the Monash Doctors Workforce and Education units at Monash Health have successfully transitioned financial reliance away from pharmaceutical company sponsorship. While pharmaceutical industry presence in the health service still exists through the sponsorship of clinical trials, these two centralised medical workforce and education departments are now successfully free from pharmaceutical company influence, with any resources or sponsorship required for training events now internally funded by the organisation. In addition, the annual Monash Doctors Careers Expo held at Monash Health is now exclusively sponsored by medical finance and medical insurance organisations, as are the Monash Doctors Education junior doctor tutorials and interprofessional orientations. This case study shows that health services can successfully move away from a dependence on pharmaceutical company sponsorship for their workforce and education events.

Health services must be proactive in shifting cultural and financial reliance away from pharmaceutical company sponsorship. This transition is possible without significant financial detriment and is important for independent prescribing decisions. No justifications for the presence of pharmaceutical industry exposure in our health services remain, aside from sponsored clinical trials. Complete eradication rather than minimisation is an essential goal for appropriate patient care.

What GPs can do to help curb rising STI rates

Despite years of safe sex promotion, rates of sexually transmitted infections continue to rise and there are concerns infections are becoming resistant to antibiotics.

Gonorrhoea notifications have almost doubled between 2008 and 2012, rates of HIV infection have increased and in 2013, the highest number of syphilis cases was ever recorded.

However in good news, chlamydia rates in 2013 decreased for the first time in 15 years and genital warts in young women is also declining thanks to the introduction of the HPV vaccine.

Dr Catriona Ooi and Professor David Lewis from the Western Sydney Sexual Health Centre say that more needs to be done in a primary health setting to prevent, identify and treat these infections.

They say:  “GPs have an important role in caring for patients with sexually transmitted infections, in educating patients about unsafe sex, and encouraging regular screening for people at risk of infection. The whole community needs to acknowledge and tackle the rising rates of sexually transmitted infection.”

Related: MJA – Gonorrhoea notifications and nucleic acid amplification testing in a very low-prevalence Australian female population

In an article published in Australian Prescriber, they write a detailed update about STIs and what doctors can do to help diagnose and treat them.

According to NSW STI Unit, people should be offered STI screening if they meet the following criteria:

  • Anyone requesting a screen
  • Sexually active people under 29 years
  • Men who have sex with men
  • Sex workers
  • People who inject drugs

Social media campaign for World AIDS day

World AIDS Day was 1st December and Durex used the day to launch a social media campaign “”to create the first official safe sex emoji”, asking users to use #CondomEmoji hashtag.

They said their research had told them that 80% of 16-25-year-olds could express themselves better using Emojis. 84% of young people felt more comfortable using icons when talking about sex.

Durex said it was sending the emoticon to developer Unicode following ‘resounding global support’ for the campaign.

Latest news:

General practitioners’ prescribing of lipid-lowering medications for Indigenous and non-Indigenous Australians, 2001–2013

Aboriginal and Torres Strait Islander Australians (Indigenous Australians) bear a disproportionate burden of disease in Australia and have a life expectancy 13 years shorter than that of other Australians.1,2 Heart disease is the leading cause of death among both Indigenous and non-Indigenous Australians, and it is also the single largest contributor to the gap in life expectancy between the two populations.3,4 The mortality rate associated with cardiovascular disease is 60% higher in Indigenous than in non-Indigenous populations; the prevalence of cardiovascular disease is 30% higher and that of its risk equivalent, diabetes, is three times greater among Indigenous Australians.36

Promoting access to prescription drugs and improving the management of chronic disease are key components of the national strategy for reducing health disparities in Australia. In 1999, the Australian Government eliminated out-of-pocket drug costs for Indigenous patients attending remote Aboriginal community-controlled health clinics.7 Two subsequent initiatives, in 2008 and 2010, reduced medication co-payments for Indigenous patients who attended non-remote Aboriginal community-controlled clinics or mainstream general practices.8,9 Further, the Pharmaceutical Benefits Scheme modified its criteria for subsidised lipid-lowering medications to include all Indigenous Australians with diabetes or a blood total cholesterol level above 6.5 mmol/L.10 The Indigenous Practice Incentives Program of the federal Department of Health provides bonus payments to general practitioners who enrol chronically ill Indigenous patients and prepare chronic disease management plans for them.11

Whether these efforts have translated into increased prescribing of cardiovascular medications to Indigenous Australians or better control of cardiovascular risk factors is unknown. We therefore evaluated trends in the prescribing of lipid-lowering medications for Indigenous and non-Indigenous Australians seen in general practice. We focused on therapies that reduce blood lipid levels because treating this modifiable risk factor can reduce coronary events and mortality in selected patients.12,13

Methods

Study design, source of data and population

We conducted an observational time trend study, from April 2001 to March 2013, that determined the proportion of patient encounters in which GPs prescribed lipid-lowering medications. We analysed data from the Bettering the Evaluation and Care of Health (BEACH) survey, which randomly samples 1000 GPs each year.14 The source population included all registered GPs and GP registrars who had claimed at least 375 Medicare service items in the past 3 months.

Each participating GP provided information about 100 consecutive patient encounters. The BEACH survey collects reasons for the encounter, problems addressed during the encounter, and clinical actions undertaken to manage each problem. GPs record up to four medications for each problem managed, and link each medication with a single managed problem. The final study sample encompassed 759 673 GP encounters with patients aged 30 years or over: 9594 with Indigenous and 750 079 with non-Indigenous patients.

Outcome measures

The primary outcome was the report that at least one lipid-lowering medication had been prescribed during an encounter. Lipid-lowering medications included five classes: statins, bile acid sequestrants, fibrates, niacin, and cholesterol absorption inhibitors. The primary independent variable was Indigenous status (dichotomous: yes v no), based on the GP’s record of the patient’s self-report during the encounter.

Statistical analyses

We calculated the unadjusted rate of prescribing lipid-lowering medications (ie, the proportion of encounters at which at least one such medication was prescribed) for Indigenous and for non-Indigenous patients. These data were further stratified by time period (1 April 2001 – 31 March 2005, 1 April 2005 – 31 March 2009, 1 April 2009 – 31 March 2013) and by the clinical condition that was addressed during an encounter (non-gestational diabetes mellitus, hypertension, ischaemic heart disease, lipid disorder). We also calculated the age–sex standardised rate of prescription of lipid-lowering medications for Indigenous patients, using 14 discrete age–sex subgroups (men and women in seven age groups spanning 10 years each). Age–sex standardisation yields an estimate of the lipid-lowering prescribing rate for encounters with Indigenous patients, assuming an age–sex structure identical to that of the non-Indigenous population.

A further subgroup analysis calculated the proportions of all lipid-lowering medications prescribed for each specified clinical condition. To assess whether there were statistically significant increases over time in the age–sex standardised rate of prescribing of lipid-lowering medications, we constructed logistic regression models, with the time period (the three 4-year time periods) as the independent variable.

All analyses were adjusted for clustering by GP using SAS 9.3 survey procedures (SAS Institute). Differences were considered statistically significant at P < 0.05. For routine analyses of BEACH data, we report a significant difference only if there was no overlap of the 95% confidence intervals of the two comparison groups. This is a stricter threshold than the usual P < 0.05 criterion, equivalent to P < 0.006, and reduces the risk of Type 1 errors when making multiple comparisons.

The University of Sydney Human Research Ethics Committee approved the study (reference 2012/130).

Results

Rate of prescription of lipid-lowering medications for Indigenous and non-Indigenous patient encounters

During the study period, lipid-lowering medications were prescribed during 4.9% (95% CI, 4.2%–5.6%) of encounters with Indigenous patients, and at 4.6% (95% CI, 4.5%–4.7%) of encounters with non-Indigenous patients. After age–sex standardisation (which adjusts the Indigenous but not the non-Indigenous rate), the rate of prescription during Indigenous patient encounters was 5.5% (95% CI, 4.7%–6.3%), significantly greater than that for non-Indigenous patient encounters.

For Indigenous patient encounters, the age–sex standardised rate of prescription of lipid-lowering medications increased from 4.1% during 2001–2005 to 6.4% during 2009–2013 (P = 0.013 for trend). For non-Indigenous encounters, the rate of prescription increased from 3.8% to 5.2% over the same period (P < 0.01) (Box 1). The point estimates for these proportions were higher for Indigenous patient encounters for each of the three time periods, but these individual differences were not statistically significant.

Specified clinical conditions addressed during Indigenous and non-Indigenous patient encounters

Diabetes and ischaemic heart disease were significantly more commonly managed at encounters with Indigenous patients than at those with non-Indigenous patients: in age-standardised analyses, diabetes was managed at 13.8% (95% CI, 12.6%–15.1%) of encounters with Indigenous patients and at 4.7% (95% CI, 4.6%–4.7%) of encounters with non-Indigenous patients. Ischaemic heart disease was managed at 3.2% (95% CI, 2.6%–3.8%) of encounters with Indigenous patients and at 1.7% (95% CI, 1.7%–1.8%) of those with non-Indigenous patients. Lipid disorders were managed significantly less frequently during Indigenous encounters (3.8%; 95% CI, 3.1%–4.5%) than during non-Indigenous encounters (4.6%; 95% CI, 4.5%–4.7%). There was no significant difference between the proportions of encounters at which hypertension was managed (12.6% for each group).

Rate of prescription of lipid-lowering medications, according to clinical condition

The proportion of Indigenous patient encounters involving diabetes, hypertension or ischaemic heart disease at which lipid-lowering medication was prescribed was similar to that for non-Indigenous patient encounters. However, for encounters at which GPs managed a lipid disorder, the age–sex standardised proportion at which lipid-lowering medication was prescribed was 78.4% (95% CI, 72.6%–84.2%) for Indigenous patient encounters, significantly greater than that for non-Indigenous patient encounters (65.2%; 95% CI, 64.5%–65.8%) (Box 2).

Proportion of lipid-lowering prescriptions linked with specific clinical conditions

Box 3 depicts the proportions of all 35 798 prescriptions for lipid-lowering medication according to the specified clinical conditions managed, and stratified by Indigenous status. Only the proportions linked with diabetes (Indigenous: 13.1% [95% CI, 9.1%–17.3%] v non-Indigenous: 4.2% [CI, 4.0–4.5]) and lipid disorders (Indigenous: 53.3% [95% CI, 46.1%–60.4%], v non-Indigenous 64.3% [95% CI, 63.5%–65.1%]) were significantly different between the two groups.

Discussion

There were three major findings from this nationally representative study of the prescribing of lipid-lowering medications for Indigenous and non-Indigenous adults managed in Australian general practice. First, the rates of prescription of lipid-lowering medication by GPs for both Indigenous and non-Indigenous Australians increased substantially from 2001–2005 to 2009–2013, with relative increases of 37% for non-Indigenous and 56% for Indigenous patients. Second, lipid-lowering medication was more likely to be prescribed at encounters with Indigenous patients than at those with non-Indigenous patients, including encounters at which lipid disorders were managed. Third, diabetes was about three times as likely to be managed at encounters with Indigenous patients.

We found that the rates of prescription of lipid-lowering medication were higher for all Indigenous patient encounters, and for encounters at which a lipid disorder was managed; the prescription rates at encounters during which diabetes, heart disease or hypertension were managed were similar for Indigenous and non-Indigenous patients. These findings may reflect extensive efforts by the Australian Government, clinicians and other stakeholders to identify and reduce cardiovascular risk among Indigenous people, to increase their access to medications, and to revise clinical and benefit guidelines for lipid-lowering prescriptions so that they include all Indigenous patients with diabetes or blood total lipid levels greater than 6.5 mmol/L.711 Our study cannot establish a causal link between these policies and increased prescribing of lipid-lowering agents. However, it is reassuring that, as lipid-lowering therapies have continued to diffuse into clinical practice over the past 15 years, we found no evidence that GPs were less likely to prescribe these agents to Indigenous patients.

As noted by other authors, screening for and managing cardiovascular risk in Australian general practice is suboptimal.15,16 It is therefore also possible that the equivalent prescribing rates may reflect underuse of these medications in both Indigenous and non-Indigenous patients who might benefit from these therapies. Future studies should characterise disparities in the proportion of clinically appropriate treatment candidates who are prescribed effective cardiovascular medications.

Our study has some limitations. First, the BEACH data do not include information on whether patients filled or adhered to lipid-lowering prescriptions. Second, data concerning managed conditions, medications prescribed, and the patient’s self-identified ethnicity may include errors, although we have no reason to believe that rates of misclassification changed over time. Third, the sample in our study included only patients seen in primary care. Fourth, the sample sizes for some subgroup analyses were small. Fifth, the data were collected at the encounter level, precluding calculation of the overall prevalence of lipid-lowering therapy in Indigenous and non-Indigenous populations. Finally, we lacked laboratory values and comprehensive data on comorbid conditions to determine the clinical appropriateness of prescribing decisions or to adjust for casemix.

In conclusion, we detected substantial increases in the rate of prescribing of lipid-lowering medication at encounters with both Indigenous and non-Indigenous patients in Australian general practice between 2001 and 2013, and found no evidence that Indigenous patients were less likely to be prescribed these agents. Indigenous patients were more likely than non-Indigenous patients to be prescribed lipid-lowering therapy during encounters at which a lipid disorder was managed. Our findings suggest some measure of success in expanding access to medications and reducing cardiovascular risk in Indigenous populations. Further efforts are needed to promote long-term adherence to effective medications and to improve cardiovascular health for Indigenous people in Australia.

Box 1 –
Age–sex standardised proportions of patient encounters (with 95% CI) at which lipid-lowering medication was prescribed, by time period and Indigenous status

Box 2 –
Age–sex standardised proportions of patient encounters (with 95% CI) at which lipid-lowering medication was prescribed, by specified clinical condition and Indigenous status


* Significant difference: no overlap of 95% confidence intervals.

Box 3 –
Age–sex standardised proportion of lipid-lowering medication (with 95% CI) prescribed for each specified clinical condition, by Indigenous status


* Significant difference: no overlap of 95% confidence intervals.