×

Black bones: minocycline-induced bone pigmentation

An 82-year-old man with bilateral knee osteoarthritis underwent consecutive total knee arthroplasty 5 months apart. During both procedures, he was noted to have black subchondral bone with otherwise normal architecture and normal-coloured cancellous bone. At the time of surgery, bone specimens sent for pathology testing were histologically normal. The patient had been treated with minocycline for rosacea for 7 months before the first procedure. Minocycline is an uncommon cause of skeletal pigmentation and is not known to affect bone quality.1 Discolouration may also be owing to ochronosis, metal deposits, sequestrum and metastatic disease.2

Renal replacement therapy associated with lithium nephrotoxicity in Australia

In reply: We welcome valuable comments in response to our article on lithium and end-stage renal disease (ESRD).1 This is an area that warrants further discussion and additional data. Our study, the first comprehensive epidemiological analysis of the link between lithium nephropathy and ESRD in any country, indicated a progressive increase in the problem in Australia between 1991 and 2011.

We have had difficulty determining whether this increase was due to increased lithium use, given that ESRD is usually associated with prolonged exposure (typically 20 years or more) and that complete data on lithium use in Australia are only readily available since 1995.

We accept that lithium is often an effective mood stabiliser that only sometimes causes toxicity. However, we believe that prescription of a drug that can propel people toward permanent dialysis or transplantation requires caution. We therefore applaud Saboisky’s practice as a psychiatrist of conjointly managing patients with a nephrologist. We do similarly.

We also endorse the call for more accurate diagnosis of renal disease, especially as bipolar disorder is often associated with risk factors such as smoking, obesity and poor diet. Our study showed that few patients with suspected lithium-induced kidney disease undergo renal biopsy, and we suggest that nephrologists could consider modifying this deficiency.

Use of secondary stroke prevention medicines in Australia: national trends, 2003-2009

Individuals diagnosed with transient ischaemic attack (TIA) or ischaemic stroke are at high risk of recurrent vascular events.1,2 Current Australian guidelines recommend continued use of antihypertensive, antithrombotic and lipid-lowering medicines after TIA or ischaemic stroke to reduce the risk of a recurrent ischaemic event, unless contraindications exist.3

In Australia, a national audit is conducted every 2 years to assess the quality of acute stroke care, including use of secondary stroke prevention medicines at the time of hospital discharge.4 However, few studies have examined use of secondary stroke prevention medicines after discharge from hospital.5,6 Of those available, none have assessed changes in use of these medicines at the national level, and it is unclear whether use has increased since the release of Australia’s first stroke management guidelines in 2003. Consequently, the aim of this study was to examine national trends in the use of secondary stroke prevention medicines by TIA and ischaemic stroke survivors to determine whether use has increased over time.

Methods

A retrospective observational study was conducted using data from the Australian Government Department of Veterans’ Affairs (DVA) administrative health claims database. The database contains details of all hospital and pharmaceutical claims subsidised by DVA for Australian veterans and their eligible dependents. At the end of 2009, the treatment population consisted of 263 433 veterans.7

Patients discharged alive after an episode of care for TIA (identified by International classification of diseases, 10th revision, Australian modification [ICD-10-AM] codes G45.0, G45.1, G45.2, G45.8 and G45.9) or ischaemic stroke (code I63) between 1 January 2000 and 31 December 2009 were eligible for inclusion. They were eligible for subsidisation of all health services by the DVA. We assessed consecutive hospital claims after each TIA or ischaemic stroke claim up to 30 June 2010, as patients may have multiple claims recorded for treatment of the same event.8 Data rules established in consultation with clinicians8 were used to link stroke-related separations and determine final discharge dates.

The proportion of patients using secondary stroke prevention medicines was determined monthly, commencing in January 2003. Each month, the cohort included all patients aged ≥ 65 years who had had a previous episode of care for TIA or ischaemic stroke recorded between 1 January 2000 and the month under study. Patients with a previous episode of care for both TIA and ischaemic stroke were eligible for inclusion in both cohorts. Patients were included each month until either their death or the end of the study period.

To determine the number of patients dispensed recommended medicines each month, all claims for antihypertensives (identified by the World Health Organization Anatomical Therapeutic Chemical classification codes C02, C03, C07, C08 and C09 [excluding C08EX02, perhexiline]), antithrombotics (code B01A [excluding B01AD, thrombolytics]) and lipid-lowering medicines (code C10) between 1 July 2002 (to include medications taken at, but dispensed before, study commencement) and 31 December 2009 were extracted. As dosage information is not available from the database, prescription durations were used as a measure of duration of use of each medicine. The prescription durations were calculated from the DVA pharmaceutical claims dataset and represent the time in which 75% of prescriptions for an individual item were refilled. Use of each of the three classes of medicine, combined treatment with antihypertensive and antithrombotic therapy, and treatment with a combination of all three classes of medicine were determined for all patients still living each month.

Prevalence of use each month (January 2003 to December 2009) was age and sex standardised using the DVA population in January 2003 to account for changes in population characteristics over time. After standardisation, Poisson regression models with generalised estimating equations were used to test for trends in medicine use, using an autoregressive working correlation matrix to adjust for serial correlation. The regression models compared the rate of medicine use in 1 year with the rate in the previous year to test for linear trends between 2003 and 2009. Separate models were used for each treatment and diagnosis combination. All analyses were performed using SAS version 9.4 (SAS Institute).

This study was approved by the University of South Australia and DVA human research ethics committees.

Results

A total of 19 019 patients were included in our analysis. Of these, 403 patients (2.1%) were included in both disease cohorts for at least 1 month during the study period. The characteristics of those included at the start and end of the study are described in Box 1.

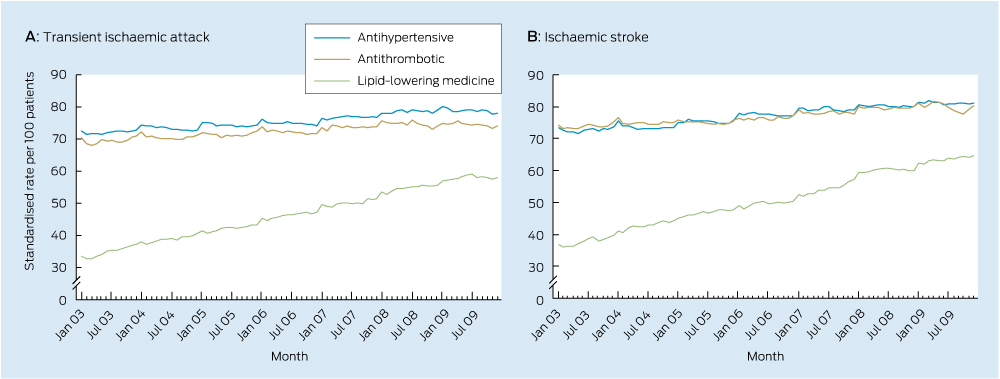
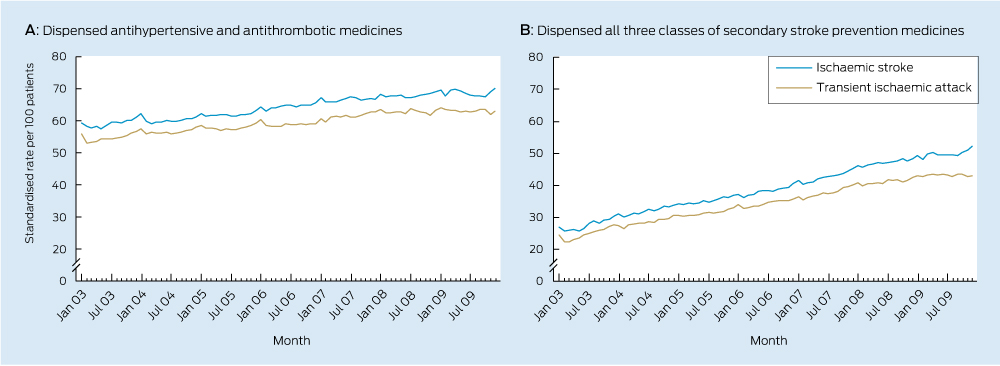
Significant increases in use of each class of secondary stroke prevention medicine occurred during the study period (Box 2, Box 3). There was also an increase in the total number of guideline-recommended medicines taken by survivors (Box 2, Box 4) with a near doubling in prevalence of the combined use of all three recommended medicines.

Discussion

This is the first Australian study to examine national trends in the use of secondary stroke prevention medicines among patients with a previous TIA or ischaemic stroke. The median duration of time patients had spent in the cohort was 1.3 years in January 2003 and 3.4 years in December 2009, meaning trends are reflective of use among the prevalent population, rather than among patients with a recent event. Increased use observed in this study suggests practice is moving towards guideline recommendations. Despite this, only half of the population were dispensed medicines from all three recommended classes in December 2009, suggesting there may be opportunity to further increase use of these medicines among the older population.

These findings are consistent with results from international studies conducted within the general practice population over a similar period.9,10 A large study from the United Kingdom showed use of antihypertensives in the year after a first stroke increased from approximately 50% to 70% between 1999 and 2008, antiplatelet use increased from 60% to 75%, and use of lipid-lowering therapy increased from 15% to 80%.10 Large increases in use of lipid-lowering therapy were also shown in a Danish population-based study, with use among ischaemic stroke survivors increasing from 40% to 65% between 2004 and 2010.11

Along with the release and dissemination of national stroke guidelines (which were regularly updated during the study period), other quality use of medicines initiatives may have contributed to the increased use observed in this study. Stroke-specific sections were included in yearly editions of Australia’s national formulary (the Australian medicines handbook) and updated versions of Therapeutic guidelines (neurology). Evidence-based stroke prevention and management was also reviewed in Australian prescriber12 and targeted by National Prescribing Service initiatives.13 The study population and their general practitioners would have received information about antithrombotics through the Veterans’ Medicines Advice and Therapeutics Education Services (Veterans’ MATES) program during the study period. Additional factors likely to have had an impact on the use of lipid-lowering medicines include the publication of a landmark trial14 and changes to eligibility criteria for subsidisation of these medicines through Australia’s national pharmaceutical subsidy scheme15 during 2006.

Factors influencing the use of secondary stroke prevention medicines in older populations are complex, and may be related to lack of awareness of guideline recommendations, prescriber-related factors (such as concern about the lack of evidence to guide secondary prevention among older patients and potential harms of treatment) or patients’ preferences.16 Although there may be room for improvement in use of these medicines, our results reflect use among all survivors, as we lacked clinical information necessary to exclude those with treatment contraindications or previous adverse reactions. We do not expect all patients could be dispensed each medicine, as some older patients may be unsuitable for treatment on entering the cohort. For others, treatment priorities may change over time,17 and medicines for secondary prevention (such as lipid-lowering therapy) may be withdrawn during the late stages of life, or in those with severe physical impairment or cognitive deficit.18 The number of older patients ineligible for treatment may be significant. In a study assessing antithrombotic use by older patients with acute ischaemic stroke, more than one-third were excluded from the analysis, owing to contraindications or refusal of treatment at discharge.19 Trends in antithrombotic use observed in our study may be further underestimated, as aspirin can be purchased without a prescription in Australia (although patients included in this study had access to subsidised aspirin via prescription).

This study used hospital claims data to determine whether patients had a TIA or ischaemic stroke. To minimise selection bias, patients were selected using primary diagnosis codes and those with an unspecified stroke (ICD-10-AM code I64) were not included. There is high adherence to Australian standards for ICD-10-AM coding,20 and 95% of patients with a primary diagnosis code for stroke were correctly coded in a recent Australian audit.21

We expect that use of recommended medicines by patients included in this study is indicative of use by older Australians previously hospitalised for TIA or ischaemic stroke. Age-specific comparisons show veterans without a service-related disability and the general Australian population have similar use of pharmaceuticals, hospital services and GP visits.22 However, changes in medicine use observed in this study may not be generalisable to patients managed solely in the community setting, and without assessment of clinical records it is not known if treatment targets were attained.

The increased use of secondary stroke prevention medicines shown between 2003 and 2009 in this large cohort of older Australians with a previous TIA or ischaemic stroke is consistent with Australian stroke guideline recommendations and initiatives to support quality use of medicines during the study period.

1 Characteristics of patients who were included at the start and end of the study

Characteristics, by disease cohort

Jan 2003

Dec 2009


Transient ischaemic attack


No. of patients

2765

5242

Age (years), median (IQR)

81.0 (78.3–84.4)

86.8 (84.1–89.5)

No. of men (%)

1761 (63.7%)

2716 (51.8%)

Time in cohort (years), median (IQR)

1.3 (0.6–2.0)

3.5 (1.6–6.1)

Ischaemic stroke


No. of patients

2493

4302

Age (years), median (IQR)

80.9 (78.0–84.2)

86.6 (84.1–89.2)

No. of men (%)

1609 (64.5%)

2376 (55.2%)

Time in cohort (years), median (IQR)

1.3 (0.6–2.1)

3.3 (1.5–5.8)

2 Changes in use of secondary stroke prevention medicines by transient ischaemic attack and ischaemic stroke survivors between 2003 and 2009


Standardised monthly rate of use (per 100 patients)


Medicines, by disease cohort

Jan 2003

Dec 2009

Standardised rate ratio (95% CI)

Average annual % change

P


Transient ischaemic attack


Antihypertensive

72.5

78.2

1.016 (1.015–1.016)

+1.6%

< 0.001

Antithrombotic

70.4

74.0

1.013 (1.011–1.014)

+1.3%

< 0.001

Lipid-lowering

33.5

58.0

1.087 (1.084–1.091)

+8.7%

< 0.001

Antihypertensive + antithrombotic

55.9

63.0

1.025 (1.023–1.027)

+2.5%

< 0.001

Antihypertensive + antithrombotic + lipid-lowering

24.4

43.0

1.094 (1.088–1.101)

+9.4%

< 0.001

Ischaemic stroke


Antihypertensive

73.3

81.1

1.019 (1.019–1.020)

+1.9%

< 0.001

Antithrombotic

74.2

80.4

1.014 (1.013–1.015)

+1.4%

< 0.001

Lipid-lowering

36.8

64.8

1.088 (1.087–1.090)

+8.8%

< 0.001

Antihypertensive + antithrombotic

59.4

70.2

1.027 (1.025–1.028)

+2.7%

< 0.001

Antihypertensive + antithrombotic + lipid-lowering

26.9

52.3

1.102 (1.098–1.106)

+10.2%

< 0.001

3 Trends in monthly use of secondary stroke prevention medicines by patients previously hospitalised with a transient ischaemic attack or ischaemic stroke

4 Trends in monthly use of combination therapy by patients previously hospitalised with a transient ischaemic attack or ischaemic stroke

Off-label prescribing

To the Editor: Off-label prescribing is a complex paradigm, with important clinical, safety, ethical, legal and financial dimensions. The articles by Seale,1 Hickie,2 and Harris and Naylor3 highlight some associated controversies and the need for a rigorous approach.

The Council of Australian Therapeutic Advisory Groups (CATAG) has recently developed national guiding principles that provide a structured framework to support judicious, appropriate, safe, effective and cost-effective off-label use of medicines.4 This framework will facilitate a more rigorous and consistent approach to decision making by health professionals, consumers, and drug and therapeutics committees in their evaluation and use of medicines that are prescribed off label. CATAG’s guidance provides an important expansion and update on previous Australian recommendations.5

There are seven overarching guiding principles, including a core principle of systematic evaluation of the evidence base and risk–benefit ratio for proposed off-label uses. Comprehensive advice for involving patients and carers in shared decision making and systematic outcomes evaluation is also provided. Applying these principles in routine practice will help address the clinical, safety and ethical concerns that have recently been highlighted. CATAG anticipates undertaking future work to support wider implementation of the guiding principles.

Multidrug-resistant tuberculosis in Western Australia, 1998–2012

Multidrug-resistant tuberculosis (MDR-TB), defined by resistance to both isoniazid and rifampicin, has significant implications for individual patient management and TB control efforts. The current global situation is further complicated by the emergence of extensively drug-resistant TB (XDR-TB), defined by additional resistance to a fluoroquinolone and at least one second-line injectable drug (amikacin, kanamycin or capreomycin).1 Drug resistance may develop in the context of TB treatment, but the majority of MDR-TB cases are contracted as primary infections.2 As with drug-susceptible TB, household transmission is common, frequently affecting young children.3,4 Treatment is resource-intensive and requires longer courses of less effective, more toxic and more expensive drugs compared with drug-susceptible TB.5

Global efforts to combat the threat of MDR-TB have been hampered by a paucity of data. Although progress has been made towards obtaining accurate estimates of MDR-TB in key high-burden countries, less than 4% of bacteriologically proven incident TB cases worldwide underwent formal drug susceptibility testing (DST) in 2011.1 Overall, 3.7% of new TB cases are estimated to be MDR-TB, with proportions by country varying from 0 to 32.3%. The estimated treatment success of MDR-TB globally is 48%.1 Even in wealthy countries, MDR-TB is associated with increased risk of adverse outcomes, including death.68

A total of 196 laboratory-confirmed MDR-TB cases were reported in Australia from 1998 to 2010.9 In Victoria, increasing numbers of MDR-TB cases were reported over the 10-year period to 2007.10 Most patients were born overseas, but local transmission has also been reported.11 High rates of MDR-TB (about 25% of tested isolates) have been observed in patients from Papua New Guinea who were treated in Queensland health clinics in the Torres Strait.12 XDR-TB remains rare, with only two reports in Australia.9,13

Early experience of MDR-TB in Western Australia was published in 1991.14 Here, we describe epidemiological, clinical, treatment and outcome data for all MDR-TB cases notified in WA over 15 years to 2012, and compare MDR-TB cases against a matched cohort of patients with drug-susceptible TB.

Methods

All patients with a laboratory-confirmed diagnosis of MDR-TB in WA from 1 January 1998 to 31 December 2012 were identified from the state Mycobacterium Reference Laboratory in Perth. Automated DST was carried out using the BACTEC 460TB mycobacterial detection system (Becton Dickinson) before 2007 and the BACTEC MGIT 960 system (Becton Dickinson) since then. Isoniazid susceptibility was tested at 0.1 μg/mL and 0.4 μg/mL in each case. Paediatric patients with probable MDR-TB, diagnosed according to international research definitions on the basis of probable TB plus a history of household or daily contact with someone with confirmed MDR-TB,15 were also included.

For each MDR-TB case, three matched controls with drug-susceptible TB (on the basis of DST or demonstrated response to standard therapy) were selected from the same period. Randomly chosen controls were matched for site of TB disease, HIV status, age and sex.

De-identified patient data were collected from medical and laboratory records for all cases and controls. Data included demographic characteristics, risk factors, clinical and laboratory diagnostic information, treatment details, health care resource use and outcomes.

Statistical analysis was performed with GraphPad Prism 6.0 statistical software (GraphPad). Categorical data were compared using McNemar’s test, and continuous variables using the Mann–Whitney test. A two-tailed P value < 0.05 was considered significant.

Ethics approval for the study was granted by the WA Department of Health Human Research Ethics Committee.

Results

During the study period, 16 cases of MDR-TB were notified (zero to three cases per year), accounting for 1.2% of all TB cases (n = 1352) notified in WA (Box 1). Fifteen cases were laboratory-confirmed MDR-TB. One case was defined as probable MDR-TB on the basis of a clinical syndrome consistent with TB (clinical features, neuroimaging and cerebrospinal fluid examination suggestive of tuberculous meningitis) and a previous isolate of laboratory-confirmed MDR-TB from the same patient.

Patients with MDR-TB were predominantly female (12/16), with a median age of 26 years (range, 8–58 years). Most patients (15/16) were born outside Australia (East Asia and Pacific, 8; sub-Saharan Africa, 4; South Asia, 2; Middle East and North Africa, 1). Refugees with humanitarian visas and asylum seekers in Australian detention centres each accounted for two MDR-TB cases.

Rates of TB risk factors were similar between cases and controls, although patients with MDR-TB were more likely to have been previously treated for TB with a regimen containing rifampicin and isoniazid (Box 2). However, most patients with MDR-TB had never been exposed to antituberculous therapy.

Pulmonary disease was most common (11/16), with positive sputum smear microscopy results noted in about half of pulmonary cases (Box 3). Extrapulmonary manifestations included tuberculous meningitis, genitourinary TB, lymphadenitis and pleural TB. Of the patients who received effective therapy, those with MDR-TB were more likely to experience delays of 1 week or more from specimen collection to commencement of treatment (11/13 [85%] v 14/48 [29%]; P < 0.001).

Of the 15 laboratory-confirmed cases, 13 demonstrated high-level resistance to isoniazid at 0.4 μg/mL. Resistance to ethambutol and pyrazinamide was common. No XDR-TB cases were identified, although resistance to second-line agents including ciprofloxacin or ofloxacin and amikacin was occasionally seen (Box 3).

Hospitalisation was more common for patients with MDR-TB than controls and, for those who completed therapy, their mean duration of treatment was more than twice as long (Box 4). Targeted second-line antituberculous drugs, individualised on the basis of DST, were used in 13 MDR-TB cases. All regimens included moxifloxacin and an injectable agent for at least part of the treatment course; moxifloxacin was ceased in one case shown to be quinolone-resistant.

Adverse effects were more commonly reported in patients with MDR-TB and necessitated modification of therapy in five patients (Box 4). Symptoms reported in patients with MDR-TB but not in those treated for drug-susceptible TB included vestibular toxicity and hearing impairment secondary to injectable aminoglycosides, and neuropsychiatric problems that were attributed to MDR-TB drugs in seven patients (Box 4).

One paediatric patient with laboratory-confirmed pulmonary MDR-TB was treated with isoniazid, rifampicin and pyrazinamide for 12 months, with apparent initial success but subsequent relapse (culture-negative meningitis) 2 years later, which was successfully treated with second-line agents for 24 months. No other treatment failures or deaths occurred in either group, although treatment was ongoing in four MDR-TB patients and three controls at the end of the study period. Three MDR-TB patients and seven controls were transferred out before completion of therapy (Box 4).

Screening for TB infection was carried out for 727 contacts of patients with MDR-TB (median, 6; range, 0–625) and 371 contacts of controls (median, 3; range, 0–222). No secondary cases of active MDR-TB disease were identified.

Discussion

MDR-TB remains uncommon in WA, though the challenges associated with managing it are increasingly recognised. We found that, despite an association with previous TB treatment, most cases occurred through primary transmission. Most patients with MDR-TB diagnosed in WA were born in one of the 27 high MDR-TB burden countries.1

Delayed diagnosis, which has an impact on timely provision of effective therapy and increases the risk of local transmission of MDR-TB strains, is a significant concern.13 Traditional methods for TB culture and DST take several weeks to produce results, contributing to delays. Nucleic acid amplification tests (NAATs), such as the World Health Organization-endorsed Xpert MTB/RIF assay (Cepheid), can rapidly detect TB and the rpoB gene mutation that confers rifampicin resistance.16 We have not reported information about the use of NAATs in this study, as they were only introduced into routine methods in 2011. Caution is warranted in the interpretation of rapid tests for rifampicin resistance due to low positive predictive value when the pretest probability of rifampicin resistance is low.16 Nonetheless, in patients at higher risk of MDR-TB (those with previous TB treatment, a household MDR-TB contact or residence in a high MDR-TB burden country), the use of a rapid NAAT to detect rifampicin resistance may hasten diagnosis. If conducted routinely in a low-prevalence setting, NAAT results should be interpreted cautiously and should be in addition to formal DST.

As is appropriate in a setting with ready access to DST, patients with MDR-TB in WA were managed with individualised drug regimens. Later-generation fluoroquinolones, such as moxifloxacin, are the most potent bactericidal drugs available for the treatment of MDR-TB. Their use has been associated with increased chance of treatment success.17 Moxifloxacin was administered to all 13 MDR-TB patients treated with second-line drugs in this study. Studies have demonstrated improved outcomes with regimens including at least 18 months of active therapy, and the WHO recommends a minimum treatment duration of 20 months for MDR-TB.1820 Research continues into the possibility of effective shorter-course regimens as brief as 9 months.21 All nine patients in this study who completed an MDR-TB targeted regimen received at least 18 months of active therapy. Pending further research, this conservative approach should be the preferred option in clinical settings where MDR-TB is treated.1,18

Adverse drug reactions more commonly complicate the treatment of MDR-TB than drug-susceptible TB. Close clinical and laboratory follow-up is obligatory for all patients with MDR-TB, and directly observed therapy should be considered where possible. Drugs that are often poorly tolerated, such as prothionamide, cycloserine and para-aminosalicylic acid (PAS), may be initiated gradually.8 Patients receiving aminoglycoside therapy should undergo regular screening for ototoxicity. Cessation of problematic drugs may be unavoidable, as was the case for one patient in WA who experienced severe psychiatric symptoms with unmasking of post-traumatic stress disorder after commencing cycloserine. Unfortunately, alternative options for treatment may be limited.

The complexity and length of MDR-TB treatment necessitates significant health care resource use, placing increased demands on outpatient and inpatient services. Specialist TB services play an important role in the effective management of TB and are crucial for accurate diagnosis and adequate management of protracted MDR-TB treatment regimens and their associated toxicities.

Given the clinical and public health implications of MDR-TB, prevention should be a priority. Prevention of acquired resistance is achieved by ensuring early diagnosis and effective treatment of all TB cases. Prevention of MDR-TB transmission requires early diagnosis, effective treatment and appropriate infection control measures. About a third of patients with MDR-TB in this series were infectious at the time of diagnosis on the basis of positive sputum smear microscopy results. Contact tracing after a new diagnosis of MDR-TB is recognised as an important measure in identifying further cases. This has significant workforce implications. Guidance on management of MDR-TB contacts found to have latent TB infection is currently limited.3,4,11

Our study has several limitations. Comparison of clinical and diagnostic information was affected by inconsistency in diagnostic approach and the use of matched controls. The ability of the study to detect a difference in outcomes was affected by the small numbers analysed. A quarter of patients with MDR-TB were still receiving treatment at the time of data collection. Of the remaining patients, 75% successfully completed treatment, compared with 84% of patients with drug-susceptible TB. In both groups, patients who did not achieve treatment success were transferred out before completion of therapy. While some patients transferred of their own volition, several patients with drug-susceptible TB and one with MDR-TB were deported on the basis of rejected asylum claims. In contrast, consensus recommendations urge that:

All patients with TB who present to health care services within Australia’s borders should have free and equal access to TB care from diagnosis to completion of treatment, irrespective of their legal status or other demographic characteristics …22

In conclusion, MDR-TB is uncommon in WA and is usually associated with treatment success, despite delays to effective therapy and frequent therapeutic changes due to adverse effects. Early diagnosis of MDR-TB is important for both individual patient care and to reduce the risk of transmission. Long treatment courses are associated with increased health service use. Further research into optimal treatment regimens is required. Specialist TB services are heavily relied on for prevention and management of MDR-TB and should be strengthened to effectively control TB and limit the emergence of MDR-TB in Australia and the surrounding region.

1 Multidrug-resistant tuberculosis (MDR-TB) cases and total TB notifications in Western Australia, 1998–2012

2 Risk factors in patients with multidrug-resistant tuberculosis (MDR-TB) and matched controls with drug-susceptible TB in Western Australia, 1998–2012

Risk factor

MDR-TB (n = 16)

Susceptible TB (n = 48)

P


Born in a high-prevalence country*

15 (94%)

39 (81%)

0.11

Resident > 3 months in a high-prevalence country*

16 (100%)

41 (85%)

0.02

Born in a high MDR-TB burden country

10 (63%)

21 (44%)

0.07

Previous TB diagnosis treated with first-line TB drugs

4 (25%)

1 (2%)

0.006

Previous treatment with isoniazid monotherapy

0

2 (4%)

0.48

Household TB contact

6 (38%)

17 (35%)

1.0

Household MDR-TB contact

1 (6%)

0

0.25

HIV

1 (6%)

Matched


* Country with TB prevalence > 50 per 100 000 population. One of 27 high MDR-TB burden countries that account for 85% of estimated MDR-TB cases globally.1

3 Diagnostic details for patients with multidrug-resistant tuberculosis (MDR-TB) and matched controls with drug-susceptible TB in Western Australia, 1998–2012

Diagnostic detail

MDR-TB (n = 16)

Susceptible TB (n = 48)

P


Pulmonary TB

11 (69%)

Matched

Extrapulmonary TB

5 (31%)

Matched

Central nervous system

1 (6%)

Genitourinary

1 (6%)

Lymph node

2 (13%)

Pleural

1 (6%)

Sputum smear microscopy positive for acid-fast bacilli

5 (31%)

18 (38%)

TB culture positive

15 (94%)

37 (77%)

Drug resistance

Isoniazid

15/15 (100%)

2/37 (5%)

Rifampicin

15/15 (100%)

0

Ethambutol

7/15 (47%)

0

Pyrazinamide

5/15 (33%)

1/37 (3%)

Streptomycin

10/15 (67%)

4/37 (11%)

Amikacin

1/15 (7%)

Not tested

Capreomycin

1/15 (7%)

Not tested

Ciprofloxacin or ofloxacin

2/15 (13%)

Not tested

Ethionamide

3/15 (20%)

Not tested

How case was identified

Contact tracing

1 (6%)

1 (2%)

Routine screening

5 (31%)

19 (40%)

Symptomatic presentation

10 (63%)

28 (58%)

Time to TB notification from arrival in Australia < 1 year

6/15 (40%)

18/45 (40%)

Delay from specimen collection to effective TB treatment < 1 week

2 (13%)

34 (71%)

0.01

Never received effective TB treatment

3 (19%)

0

0.008

Median days of delay for those with ≥ 1-week delay to effective treatment (range)

48 (17–149)

21 (7–84)

0.002

4 Treatment details and outcomes for patients with multidrug-resistant tuberculosis (MDR-TB) and matched controls with drug-susceptible TB in Western Australia, 1998–2012

Treatment detail/outcome

MDR-TB
(n = 16)

Susceptible TB
(n = 48)

P


Hospitalised during treatment

16 (100%)

17 (35%)

< 0.001

Mean total days in hospital (range)

26 (1–99)

13 (2–41)

Directly observed therapy

14 (88%)

6 (13%)

< 0.001

Intravenous access required for treatment

11 (69%)

0

< 0.001

Drugs used in definitive treatment regimen

Isoniazid

1 (6%)

48 (100%)

Rifampicin

1 (6%)

48 (100%)

Ethambutol

7 (44%)

43 (90%)

Pyrazinamide

10 (63%)

48 (100%)

Moxifloxacin

12 (75%)

2 (4%)

Prothionamide

10 (63%)

1 (2%)

Cycloserine

10 (63%)

0

Amikacin

9 (56%)

0

Capreomycin

2 (13%)

0

Streptomycin

2 (13%)

0

Para-aminosalicylic acid (PAS)

2 (13%)

0

Linezolid

2 (13%)

0

Clofazamine

1 (6%)

0

Adverse effects reported

13 (81%)

16 (33%)

< 0.001

Arthralgia

0

1 (2%)

1.0

Haematological abnormalities

2 (13%)

1 (2%)

0.13

Hearing impairment

4 (25%)

0

0.002

Hypothyroidism

1 (6%)

0

0.25

Injection site complications

3 (19%)

0

0.008

Liver dysfunction

3 (19%)

2 (4%)

0.13

Nausea/vomiting

11 (69%)

5 (10%)

< 0.001

Psychiatric problems

7 (44%)

0

< 0.001

Palpitations

1 (6%)

0

0.25

Paraesthesia

0

1 (2%)

1.0

Rash/itch

2 (13%)

10 (21%)

0.42

Renal dysfunction

1 (6%)

0

0.25

Tinnitus/vertigo

7 (44%)

0

< 0.001

Visual disturbance

1 (6%)

3 (6%)

0.68

Adverse effects requiring therapeutic change

5 (31%)

6 (13%)

0.02

Completion of therapy

Ongoing therapy

4 (25%)

3 (6%)

Transferred out before completion

3 (19%)

7 (15%)

0.72

Completed therapy

9 (56%)

38 (79%)

    Mean total days of treatment (range)

597 (365–724)

229 (174–554)

Treatment outcome

Success*

9/12 (75%)

38/45 (84%)

0.72

Success in accessible cases

9/9 (100%)

38/38 (100%)

Failed

0

0

Died

0

0


* Denominator excludes patients whose therapy was ongoing. Denominator excludes patients whose therapy was ongoing and those who were transferred out before completion of therapy.

Inadvertent dispensing of Coumadin instead of Coversyl

To the Editor: We note a similar experience to that described in Carradice and Maxwell’s report of coagulopathy caused by inadvertent substitution of Coumadin for Coversyl.1 A patient aged over
80 years was found to have an international normalised ratio
of greater than 9 after ingesting warfarin instead of perindopril in 2011: a consequence of a pharmacy labelling error identical to that described by Carradice and Maxwell.

Dispensing errors commonly involve substitution of drugs with orthographic similarity.2 In addition, unrelated drugs may share prefixes, such as clomiphene and clonidine. We propose two strategies to minimise substitution errors.

First, we suggest that pharmacists arrange medicines by class, not
by name as currently done. Consequently, shelves would contain smaller groups of drugs and the chance of orthographic similarity between adjacent drugs would be lower. This would also lessen the harm of a substitution error, because the incorrectly dispensed drug would be pharmacologically related to the prescribed drug, therefore having similar therapeutic and adverse effects.

Second, we advocate for packaging of medicines in boxes rather than bottles. A medicine box on a shelf presents its full face to the pharmacist, unlike a bottle on which only part of the drug name may be evident. Boxes also have designated spaces for the pharmacist’s printed label, whereas the manufacturer’s label on a bottle is sometimes necessarily obscured by the pharmacist’s label. Finally, the blister pack inside a box is printed with the drug’s name, providing another safety barrier against substitution errors.

We believe that adopting these simple strategies could avert further serious medication errors.

A functional dependence? A social history of the medical use of morphine in Australia

The history of morphine use in Australia has shaped public perception and current challenges

Morphine has had an important role in the history of Australia and continues to play a major part in the medical, social and economic aspects of this country.1 The extent of its multitude of uses (and misuses), its constant depiction in the media, and its role in the history of Australia have created a complex public understanding of the drug. There is a broad array of perceptions regarding addiction, tolerance, fear of side effects and an association with death, which may complicate morphine’s use in clinical care.2 An understanding of the history of morphine in Australia can enable a greater understanding of its current use, and provide some background to the increases in opioid prescription seen in the past two decades.3,4

Such a rapid expansion in the use of medical morphine has been experienced before in Australia, on a much greater scale, towards the end of the 19th century before the creation of a regulatory system.5 Although Australia currently has the fifth highest per capita consumption of licit morphine, this is a marked decrease from the first half of the 20th century — in 1936, 14% of the world’s legally produced morphine was consumed by Australia, which then had a population of 6.7 million.4,6

Here, we review the history of morphine use and regulation in Australian society, and consider how the past may influence the attitudes and perceptions of the present. We searched the following electronic databases for studies published in English: MEDLINE (1950 – March 2013), the Cochrane Library, PsycINFO (1806 – March 2013), CINAHL, EMBASE (1980–2013), PubMed and ProQuest. Search terms included morphine, opioids, Australia, narcotics and law. These electronic searches were supplemented by hand searches of key references cited, including historical sources.

Early use of morphine

Opium was widely used and unregulated in colonial Australia, although records of its early use are incomplete. Increased use coincided with the arrival of Chinese immigrants during the gold rush of the 1850s, as this population had high rates of opium use for recreational purposes following British importation of opium to China and the subsequent Opium Wars.5,7,8 It was widely available as a raw product, often used for smoking or dissolved in alcohol as a mixture known as laudanum.

Morphine was originally isolated from opium in 1804 by German pharmacist Friedrich Sertürner, but it was initially difficult and expensive to manufacture.9 Laudanum, by contrast, was readily available, cheaper, well known to doctors and patients alike, and showed similar clinical benefits, although it varied greatly in strength and additives. It was not until the introduction of the modern hypodermic needle in 1853 that morphine became more readily used by physicians, initially for surgical interventions.9 The American Civil War (1861–1865) saw the first use of morphine on a wider scale, where, especially due to its multiple routes of administration and short onset of action, it was recognised for its utility.

Morphine gained popularity in Australia in the 1860s, marketed as an antidiarrhoeal medicine for infants and young children at a time when infantile diarrhoea was responsible for around a quarter to half of all infant deaths.10 Morphine and laudanum were sold virtually unregulated, often by door-to-door salesmen in the form of mixtures, powders and lozenges. The use of morphine increased as physicians became more accustomed to prescribing, dispensing and administering the drug, and societal recognition increased due to marketing through newsprint and magazines.10 Compared with laudanum, which was often inconsistent in strength, morphine was recognised as having standardised dosing and therefore a predictable effect.

Growing concerns

The wide availability of opioids continued unregulated, with neither the public nor government expressing appetite for change, for two main reasons. First, the morbidity associated with infantile diarrhoea ensured great public support for unrestricted availability of a possible remedy. Second, the Australian population was widely dispersed, and with few experienced medical practitioners there was a need for fast access to these medications.10

However, the harmful effects of opioids became increasingly evident over time. In the 1880s, Queensland coroners investigated 98 infant deaths and determined that 15 of these children had been given “infant soother” drugs, most of which contained opioids.10 Coronial records demonstrate that increasing numbers of infant deaths related to opioids were investigated in the 1890s and early 20th century, and doctors became reluctant to sign death certificates in cases where opioids had been used.10 While anxiety surrounding the overuse of opioids for infants grew, for many, the benefits continued to outweigh possible harms.

Australian society seemed largely indifferent to the use of medical opioids for recreational or habitual use, as this practice remained mostly invisible and of little moral consequence.5 The use of opium for smoking was viewed differently, being closely associated with the Chinese population and carrying particular social and racial stigma.8 The Chinese immigrants at the time were poorly accepted in many respects, due to their foreign customs and language, yet the smoking of opium was a very visible vice to which racist sentiment could easily be attached.5 As The Bulletin wrote in 1886, “… where the legions of aggressive stinks peculiar to Chinamen seem ever to linger … The very air of the alley is impregnated with the heavy odour of the drug”.5

Legislative changes

The first Australian laws to limit the supply of narcotics appeared in 1897 in Queensland, largely as a response to the anti-Chinese sentiment surrounding opium smoking rather than as a harm-reduction measure.5 These original laws prohibited the smoking and supply of raw opium but did not address control of medical opioids. In the following 10 years, the remaining states passed similar laws. In 1913, a Bill was passed in Victoria requiring a medical prescription for the supply of opioids, with other states soon following.11

The trend towards regulation soon turned towards criminalisation. With tighter regulation, profiteering from illegal markets increased, and international opinion supported changes aimed at more stringent control, particularly in the United States. The first international drug control treaty was created in The Hague in 1912, with Australia signing the following year.12 The Hague International Opium Convention originally sought to control the international trade of opium and cocaine, but over time placed further restrictions on trade, manufacture and use of all narcotics and psychotropic drugs. At this time, there was a significant cultural shift around the use of opioid medications in the US, which had previously tolerated a free market for these substances, similar to Australia. By 1922, courts had interpreted the Harrison Narcotics Tax Act, passed by the US Congress in 1914, as meaning it was illegal to supply narcotics for people with opioid addiction. Around 25 000 physicians were charged under this legislation in the US, with 3000 serving prison sentences.11

These international influences significantly shaped Australia’s policy on opioids. In 1927, New South Wales passed a Bill providing criminal sanctions against recreational narcotic use and supply. Despite such measures, use continued to grow, with increasing consumption of morphine and heroin nationally.6

A series of legislative acts in the US in the 1950s increased the severity of criminal sanctions for narcotic use and supply, ensuring prescribing of opioids only occurred in narrow, clearly justified circumstances.13 This influence stretched to Australia, with public opinion favouring a criminal justice approach to the problem, leading to increasing numbers of arrests for opioid misuse and supply from 1960 to 1990.11

Conclusion

The history of morphine reflects its effects — of being able to provide great relief or cause significant harm. Despite remaining unchanged as a medication since its discovery, its uses and perception have changed considerably and have been profoundly affected by the legal and political climate in a manner unlike few, if any, other medications in Australia. The place of morphine in our society has been transformed from one of widely unregulated acceptability to decades of intense scrutiny governed by a legal and regulatory framework and increasing levels of public concern. Its uses extend beyond the scope of the medical sphere, as a device of recreation and habit, and also as an important source of legal export income — opioid production is worth about $100 million annually to the Australian economy.1

What the future holds for morphine is uncertain. The history of its use demonstrates the harms of poor regulation and, with a rising tide of deaths attributable to opioids in Australia and internationally, this appears to again be an increasing problem.3 Yet to strictly control these medications, as was done in the mid 20th century, is not without its costs. Society has been adversely affected by the decision to persecute doctors and to not allow supervised access to these medications for patients with genuine pain. Government and media condemnation of opioid use has had a detrimental impact on the public perception of opioids, especially in oncology and treatment of terminal disease, where they may be needed most.2

The impact of the history of use, legal and political attention and media scrutiny appears to have had a significant effect on society’s understanding of morphine. An understanding of the past may provide greater insight into the full effect of this evolving social history, enrich our clinical discussions and provide a discourse to guide future use.

Off-label prescribing

Prescribing medications “off label” in some settings is appropriate as long as it is evidence-based

Many medication prescriptions are written for approved indications, as listed in the product information (PI) for the drug. “Off-label” prescribing is the term used when a drug is prescribed for an indication, a route of administration, or a patient group that is not included in the approved PI. There are groups of patients who are not included in the clinical trials undertaken for drug registration, and these groups may not be included in the PI. They typically include children, pregnant women, older men and women, and patients with terminal illness. Prescribing the medication for patients in these categories would be off label if they are not listed in the PI.

Based on a drug’s mechanism of action in an approved indication, it may be hypothesised that the drug may be efficacious in treating a medical disorder that is not listed in the PI. It is acceptable to prescribe off label, provided that there is sufficient evidence of efficacy and safety. This situation can arise for medications that have been available for many years, during which well conducted studies in patients with an off-label indication have shown acceptable efficacy and safety. If the drug’s patent has expired, it is unlikely that the pharmaceutical company that sponsors the drug will engage in the process of submitting data to the Therapeutic Goods Administration (TGA) for having the PI revised to include the new indication. The process for assessing the appropriateness of off-label medication use has been well described.1

The prescriber should inform patients that their prescription is off label so that they are not concerned by not finding their condition listed in the Consumer Medicines Information (CMI). Patients should also be informed about the rationale for prescribing the medication for them to increase the likelihood of good adherence to the treatment regimen.

Off-label indications are not covered by the Pharmaceutical Benefits Scheme (PBS), so patients will have to pay the full price for the medication. They need to be informed of this as well. The prescriber needs to monitor the tolerability of the medication and report any significant adverse events to the TGA to help develop a comprehensive profile of the medication prescribed in the off-label indication.

Reducing off-label prescribing in psychiatry

Practitioners need to consider the evidence for pharmacological options before prescribing medications off label

There are few more controversial topics in mental health than what constitutes evidence-based prescribing. Medications not indicated for common conditions like anxiety or depression, or particular age groups such as the young or old, are often prescribed for these conditions or age groups. Consequently, strident calls for clamping down on such “off-label” prescribing are common. Three drivers are behind these public and professional concerns.

First, precision in diagnostic and therapeutic practice is hard to achieve because of low reliability and questionable validity of the major diagnostic groupings.13

Second, a wide gap persists between the number of people affected by mental disorders and the number who demand and receive care.4 In Australia, the continuing growth in demand for clinical services extends across all age groups for psychological as well as pharmacological interventions.5,6

Third, there is growing recognition of the potential for longer-term harms, including metabolic complications and an enhanced risk of cardiovascular disease (CVD) that may accompany prolonged use of various psychotherapeutic drugs.7 This is especially true for the second-generation antipsychotic medications.8 The increased CVD risks may be tolerable when treating patients with major mental disorders, but if the drugs are being used for off-label purposes the risk equation is much more questionable.

The reality for much clinical practice, however, is that practitioners are largely managing individuals with prolonged and disabling symptom sets with a wide mix of psychological and medical interventions. They are doing so without the assistance of well defined laboratory-based markers of illness type, pathophysiology or indicators of response to specific interventions. They also rely on a relatively small clinical trial database for key population-based subgroups — younger and older persons, those with complex medical comorbidity or those with concurrent substance misuse.

Within this context, recent attempts by the major United States regulatory agencies to develop more precise therapeutic targets (eg, cognitive enhancement in schizophrenia9) and the National Institute of Mental Health’s promotion of a more pathophysiologically based research classification system10 offer significant hope of a move to a more solid evidence base to underpin clinical prescribing for the major mental disorders.

In the interim, however, it remains important for clinicians to maximise the use of non-pharmacological interventions for common forms of anxiety and depression and minimise the use of major psychotropic medications in situations in which there is no clear evidence from clinical trials of a clear benefit-to-risk ratio.

Pharmacometrics: an underused resource in Australian clinical research

To the Editor: Pharmacometrics
is an emerging field in Australia, with use in a wide range of therapeutic areas including cardiovascular disease, critical patient care, diabetes and paediatrics.14 The results of pharmacometric analyses are often referred to in Therapeutic Goods Administration-approved product information; however, for many clinicians, pharmacometrics remains
a mysterious area of research. Therefore, we seek to promote the discipline of pharmacometrics in clinical practice.

Pharmacometrics has its underpinnings in the principles of clinical pharmacology.5 It has been defined as “the science of developing and applying mathematical and statistical methods to: (a) characterize, understand, and predict a
drug’s pharmacokinetic and pharmacodynamic behavior, (b) quantify uncertainty of information about that behavior, and (c) rationalize data-driven decision making in the drug development process and pharmacotherapy”.6

In the United States, pharmacometric analysis is widely applied in drug development and
is used by the Food and Drug Administration to determine optimal dosing regimens and first in-human dose selection for clinical trials. Its application can be used to answer important questions such as “what dose will provide therapeutic efficacy?” and “which patients are
at greatest risk of adverse drug reactions?”.7

The clinical application of pharmacometrics has been demonstrated by Duong and colleagues.3 Using Monte Carlo simulation, a commonly used pharmacometric tool, they found that metformin, typically contraindicated in patients with renal impairment,
can be used in such patients, with appropriate dose adjustments based on stage of renal impairment to
avoid toxicity.3 They pooled sparse concentration data and developed a population pharmacokinetic model for metformin. This model then allowed the quantification of different variables (genetics, age, creatinine, total body weight and renal function) on the pharmacokinetic parameters of metformin that affect drug exposure. They performed simulations to identify the dose that did not exceed toxic concentrations for each stage
of renal function.

Pharmacometric approaches have also been embraced to individualise treatment with aminoglycoside antibiotics, with dose-prediction software now recommended in Australian guidelines (http://www.tg. org.au/etg_demo/desktop/tgc/abg/7823.htm).

Pharmacometrics holds great promise to truly personalise medicine. Collaboration between clinicians and pharmacometricians could finally remove “hit and miss” approaches
to dose selection.