×

Prevention and early detection in young children: challenges for policy and practice

Review and further development of the Healthy Kids Check are crucial

Evidence-based systems of prevention and early intervention have long been a far-reaching goal for health planners and academics. This notion has assumed even greater importance in paediatrics because of the robust research now emerging about the early-life origins of a range of problematic health and psychosocial conditions later in the life course.1 Conditions as diverse as diabetes, cardiovascular disease, mental health problems and criminality have been linked to the environments experienced by unborn and young children. The idea of introducing a health check for children in order to detect emerging problems and risk factors, and offer treatment early in life, seems a natural and welcome policy response.

However, what seems such an intuitive concept faces a number of significant challenges in its implementation.2 These include the improbability of being able to check all children (with those most at risk being least likely to present for a check); the lack of reliable and valid measures in many domains (not fulfilling the scientific criteria for a screening test or program); the considerable developmental variability in young children (so that many problems are transient); and the difficulty in timely access to assessment and treatment services (cost, long waiting lists, and uneven coverage especially in rural areas).

In 2008, the Australian Government introduced the Healthy Kids Check (HKC). This was designed to be administered to all 4-year-olds before starting school, to promote “early detection of lifestyle risk factors, delayed development and illness, and … introduce guidance for healthy lifestyle and early intervention strategies” (http://www.health.gov.au/internet/main/publishing.nsf/Content/Health_Kids_Check_Factsheet). The HKC has been criticised for not being evidence-based3 and for its timing (many conditions and risk factors emerge earlier than 4 years of age). In addition, the focus is narrowly on health and largely excludes developmental and behavioural issues. On the other hand, a recent limited evaluation of the HKC in two general practices found that general practitioners “are identifying important child health concerns … using appropriate clinical judgement for the management of some conditions, and referring when concerned”.4

In 2012, the government established a multidisciplinary expert working group to provide advice about the introduction of an expanded Healthy Kids Check (EHKC), designed to be administered at 3 years of age and to replace the HKC. The working group systematically and carefully worked through the various issues — methods of early detection, selection of domains, professional training and expertise, referral and follow-up arrangements — and made a series of recommendations to government. The EHKC was designed to elicit and respond to any parent concerns about the child’s health, development and behaviour, along with providing a physical assessment including measurement of height and growth and calculation of body mass index (http://www.health.gov.au/internet/main/publishing.nsf/Content/healthy-kidschk). The check itself was but one part of the process — also included were online training modules and a mapping template to facilitate referral for assessment and intervention. Piloting of the EHKC was undertaken in several states by the Australian Medicare Local Alliance, which submitted an evaluation report to government in November 2013.

The process of designing the EHKC highlighted some of the challenges in developing and introducing an approach to prevention and early intervention in child health. There was uninformed criticism — in the media as well as in peer-reviewed journals5,6 — that this was a mental health check and that the EHKC was designed to screen for mental health problems. This perception may have arisen from the inclusion of questions designed to elicit parent concerns about the child’s behaviour, and because funding for the development of the EHKC was provided by the mental health branch of the Department of Health. Rather than being a screening test, the EHKC was conceptualised as providing an opportunity for parents to raise any concerns with their child’s GP. These would be addressed using the GP’s clinical judgement — reassurance, providing appropriate advice, or referral for further assessment and management — facilitated by appropriate training and a mapping template to document local community supports and referral agencies. The government is apparently considering the evaluation report, generally very positive, but no decision has been made about the introduction of the EHKC. Meanwhile, the HKC continues as a Medicare-funded check for 4-year-olds.

While the idea of prevention and intervention early in life is compelling and the research underpinning it largely uncontested, it is a hard sell to government and there are many challenges in its implementation. Early detection of emerging problems is problematic. Many issues in young children are transient, and we do not have reliable and valid methods to know which children we should be concerned about. The evidence suggests that systematically eliciting and responding to parent concerns is the best method for early detection (Murdoch Childrens Research Institute, Centre for Community Child Health; submission to the Victorian Government, March 2009). Making the check part of Medicare removes a potential financial barrier for uptake but still does not ensure that all children, especially those at risk, are seen in a timely fashion.

The primary health care system must be at the heart of efforts to refocus the health system towards prevention and early intervention, so GP involvement in undertaking the child health checks is important. It is to be hoped that the government persists with the ongoing review and informed evolution of the child health check, and that the challenges and concerns that are an inevitable accompaniment to introducing any population health measure are addressed appropriately.

Australia’s treatment of refugee and asylum seeker children: the views of Australian paediatricians

Many Australian paediatricians have been, and will be, providing care to refugee or asylum seeker children. They come from countries evenly spread among Africa, Asia and the Middle East, and demonstrate a different disease spectrum to Australian children.1 Australia hosts about one refugee per 1000 inhabitants.2 Children are proportionally overrepresented, with around 40% of Australia’s refugee intake being less than 20 years old, similar to the global refugee population.3 These children bring unique medical, cultural, social and linguistic characteristics, and paediatricians need to know how to manage them (Box 1).15

There are scant data on how well paediatricians understand the health and health-related rights of refugees and people seeking asylum. Concerns have been raised that the medical profession’s knowledge is suboptimal.9,16 General practitioners and medical directors have limited knowledge of support services available to them.17 Only one-third of the GPs studied had used a professional interpreter service while managing refugees, while 60% knew that the Translating and Interpreting Service (TIS) is available free of charge.18 However, there are no data for paediatricians.

Refugees and people seeking asylum suffer from physical and mental health problems attributed to experiences in their country of origin, transit countries and Australian detention centres.15,1921 Refugees and people seeking asylum attempting to access health care services in Australia face geographical, cultural and linguistic barriers.22,23 To best serve children and adolescents, paediatricians need to know about relevant screening practices and Medicare arrangements.24

We sought to determine the knowledge and attitudes of Australian paediatricians in relation to the health of refugee and asylum seeker children both onshore and offshore.

Methods

Questionnaire

To establish the sample for our survey, we began with the Royal Australasian College of Physicians (Paediatrics and Child Health Division) register of paediatricians in Australia and New Zealand. We used the filters “general paediatrician” and “community paediatrician” to select those practitioners most likely to be managing refugee and asylum seeker children. We removed those who were retired or were working overseas (eg, New Zealand). In November 2013, we sent an email to paediatricians on this list with a link to a SurveyMonkey online questionnaire (Appendix 1). We followed up with one reminder email in December 2013 and a final email in January 2014.

Our survey had six sections:

  • terminology (clinical vignettes about a child’s visa status and legal guardianship);
  • health care delivery issues (Medicare eligibility, fee waiver programs and interpreters);
  • visa and screening process (communicable disease screening and transmission risks);
  • support for Australia’s asylum seeker and refugee policies;
  • support for Australian Medical Association [AMA] and Royal Australasian College of Physicians [RACP] statements; and
  • respondent demographics.

We conducted a pilot questionnaire with medical students, who took 5 to 8 minutes to complete the survey, after which the survey was shortened.

Ethics

Ethics approval was granted by the Sydney Children’s Hospitals Network and the University of Sydney (HREC LNR/13/SCHN/266). No incentives were provided to participants.

Data analysis

Data were expressed as the percentage of valid responses for each question. We used IBM SPSS version 21 to compare responses (α = 0.05) by demographic characteristics (all determined a priori) with χ2 analysis, or a two-tailed Fisher exact test whenever there were less than five valid responses.

Results

Target population

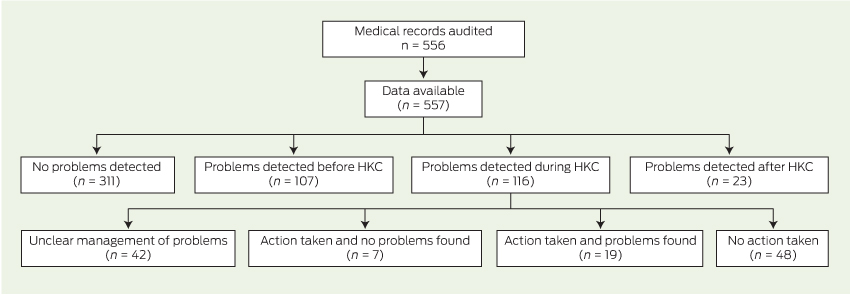
There were 599 paediatricians in the RACP register working in “general paediatrics” or “community paediatrics”. After excluding duplicates and those listed as retired or semiretired, overseas or without an email address, 419 paediatricians remained. A further 76 were excluded due to the email bouncing or because they were no longer in practice in Australia, leaving 343 eligible paediatricians (Appendix 2).

Characteristics of respondents

There were 139 respondents (response rate, 40.5%). Respondents’ characteristics were broadly representative of all Australian general paediatricians (Appendix 3). Most of the paediatricians completed all of the questions (90.6%–100% for non-demographic questions).

Questionnaire results

There was no difference in the proportion of respondents who saw refugee and asylum seeker children more than once per month (versus less frequently) in relation to paediatricians’ sex (= 0.45), training in Australia versus overseas (= 0.36) or having less than 10 years’ clinical experience versus more (= 1.00).

Asylum seeker terminology and legal guardian

Ali is a 12-year-old boy from Afghanistan who travelled to Indonesia by plane with his 15-year-old brother, then by boat to Christmas Island. Ali’s brother asked the Department of Immigration and Citizenship (DIAC) for protection from the danger they faced in Afghanistan due to their Hazara ethnicity.

Li is a 10-year-old girl from China who arrived in Australia by plane with her father on a tourist visa. The day after they arrived, Li’s father asked DIAC for protection from the danger they faced in China due to their membership of Falun Gong.

Most respondents correctly classified Ali and Li as “asylum seekers” (Ali, 113/139, 81.3%; Li, 114/139, 82.0%). A small majority correctly identified the Minister for Immigration and Citizenship as Ali’s legal guardian, given that Ali was an unaccompanied minor (83/139, 59.7%).

Medicare eligibility

Fatima is a 17-year-old who has recently fled persecution in Iraq. She comes to see you about a productive cough that has developed over the past few days. She is otherwise well. She informs you that she is not an Australian citizen but she cannot remember what visa she currently holds.

Sixty-five of 134 respondents (48.5%) correctly identified that all refugees hold Medicare cards, but only some categories of asylum seekers are eligible for Medicare. Practitioners who saw refugee or asylum seeker patients “more than once per month” were more likely to select the correct answer than others (15/21, 71.4% v 48/107, 44.9%, = 0.03). Practitioners with less than 10 years’ experience were just as likely to select the correct answer as those with more experience (8/22, 36.4% v 55/106, 51.9%, = 0.19).

Fee waiver programs

An intern at a tertiary hospital emergency department calls you about one of your patients, Maya, who has just presented in the final stages of labour. Maya is 17 years old and fled persecution in Fiji. She does not have a Medicare card. The intern asks you whether Maya will be required to pay for all medical costs associated with the admission.

Only 12 of 133 respondents (9.0%) correctly identified that fee waiver programs are available for non-elective services in most Australian states for asylum seeker patients who request treatment at public hospitals but who do not possess a Medicare card.1113 Practitioners who saw asylum seekers more than once per month had no greater knowledge of these services compared with other respondents (1/21, 4.8% v 10/106, 9.4%, = 0.69). Over a quarter of respondents (36/133, 27.1%) thought that the hospital administration decided whether to bear an asylum seeker child’s hospital costs.

Interpreters and Medicare

Dhati is a 12-year-old refugee from Nepal who comes to see you with a urinary tract infection. She is accompanied by a friend as she has very limited English.

Similar proportions of respondents would arrange a face-to-face interpreter (59/132, 44.7%) as a telephone interpreter (63/132, 47.7%), with no differences by demographic characteristics (Box 2). Almost half of the respondents who would use a telephone interpreter were not aware of the TIS Doctors Priority Line (29/63, 46.0%).

The vast majority of respondents (118/133, 88.7%) reported no prior knowledge of the Medicare eligibility hotline, but 99 of this group (83.9%) planned to use it in the future. There was no difference between the proportion of respondents who gained their degree in Australia versus overseas who knew of the TIS Doctors Priority Line (54/104, 51.9% v 13/23, 56.5%, = 0.69) or the Medicare hotline (12/104, 11.5% v 2/23, 8.7%, = 1.00).

Pre-departure screening

Mr and Mrs Nazif and their four children (Mohammad, 16 years, Sheeva, 14 years, Wasim, 12 years and Fahran, 8 years) fled Afghanistan for Indonesia, where they were granted refugee status by United Nations High Commissioner for Refugees (UNHCR). They are all well and none has any significant past medical history.

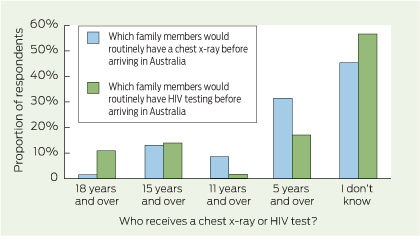
Very few respondents were aware which refugee and asylum seeker children would undergo chest x-rays for tuberculosis (TB) screening (11/130, 8.5%) and be tested for HIV (18/129, 14.0%) as part of their initial health screening (Box 3). The most common response was “I don’t know” (chest x-ray, 59/130, 45.4%; HIV, 73/129, 56.6%).

Most respondents (103/128, 80.5%) reported that they thought there was “no” or “low” risk of refugee children transmitting HIV or TB.

Offshore processing and mandatory detention

Only 17/127 (13.4%) of respondents correctly identified that most applicants wait in UNHCR camps for an average of more than 10 years before resettlement to Australia. Most (98/127, 77.2%) responded “1 to 10 years” to this question.

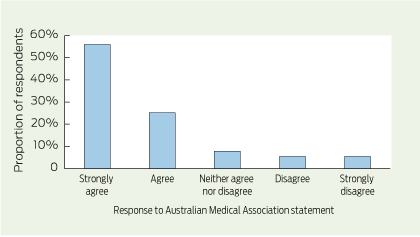
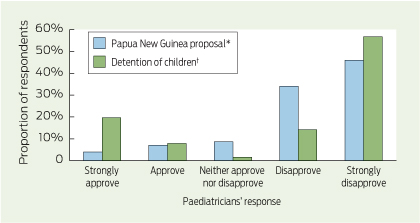
One hundred and one of 126 respondents (80.2%) disapproved or strongly disapproved of offshore processing in Papua New Guinea (PNG) and 103/127 (81.1%) agreed or strongly agreed with the AMA statement that detention of asylum seeker children was a form of child abuse (Box 4).25 Male respondents were more likely to approve of offshore processing than female respondents (13/66 v 0/58, < 0.001. Ninety of 127 respondents (70.9%) disapproved or strongly disapproved of detention of asylum seeker children (Box 5). There were 25 respondents who “strongly approved” of detention of children. Of these, 23 “strongly agreed” or “agreed” with the proposition in the next question that “detention of asylum seeker children and their families is a form of child abuse”.

One in five respondents left comments, including:

  • reluctance to use government services for asylum seeker children for fear of adverse consequences on the child’s visa application;
  • concern about the “long-term damage” and the “high social, medical, psychological and hence economic costs” associated with current policies, in respect of which they were “appalled” and “ashamed”;
  • “dismay” over the constantly changing nature of refugee and asylum seeker policies (“walking in a mine field when faced with this subject”); and
  • “ ‘strongly disagree’ was often ‘not strong enough’ ”.

Responses by frequency of contact

Box 6 shows that paediatricians seeing refugee and asylum seeker children more than once per month were more likely than others to know: who had access to Medicare cards (= 0.03); the Medicare hotline (= 0.005); and that refugees accepted into Australia had stayed an average of more than 10 years in UNHCR refugee camps (< 0.001). However, there were no differences in any of the other responses between these groups of paediatricians.

Discussion

This is the first study to investigate the knowledge and attitudes of Australian paediatricians about refugees and asylum seekers. This study also describes how paediatricians across Australia conduct consultations with refugee and asylum seeker children. Most paediatricians surveyed used the correct terminology of “asylum seeker” rather than “boat person” or “illegal immigrant”. However, we found serious gaps in knowledge in relation to Medicare eligibility, whether asylum seekers would be charged for essential health care, and the Medicare priority and TIS hotlines. There was also confusion about children’s screening tests during the visa application process. We found very strong support for the AMA contention that mandatory detention of children was a form of child abuse and overwhelming disagreement with the current policy of immediate removal of asylum seekers to PNG with no prospect of future immigration to Australia.

Two vignettes described the journey taken by Ali (by boat) and Li (by plane) to seek protection in Australia. Following recent policy and legislative changes, pursuant to sections 46A and 46B of the Migration Act 1958 (Cwlth), Ali would currently be classified as an “unauthorised maritime arrival” and would be barred from applying for a protection visa unless the Minister for Immigration and Citizenship (now Minister for Immigration and Border Protection) exercised his non-compellable discretion to lift this restriction.5 The terms “illegal immigrant” and “boat person” are not appropriate as applying for protection in Australia is a legal process provided for by the Migration Act 1958 (Cwlth) and consistent with Australia’s international obligations under the United Nations (UN) 1951 Convention Relating to the Status of Refugees and 1967 Protocol Relating to the Status of Refugees. The children in our vignettes could not properly be classified as “refugees” until their claims for protection were assessed on their merits.5

We found that most paediatricians understood that the Minister is the guardian of an unaccompanied minor.7 The Minister thus detains children while also being their legal guardian (with a duty to act in their best interests). To resolve this conflict of interest, the RACP in a position statement in 2013 called for an independent legal guardian for these children. As most paediatricians considered mandatory detention a form of child abuse, it cannot be in the children’s best interests.

We found gaps in paediatricians’ knowledge about Medicare eligibility. Medicare rights are held by all refugees and by asylum seekers who hold bridging visas to which such rights are attached.4,9 Although respondents who didn’t know the answer could ask colleagues and other contacts, the high percentage of “I don’t know” responses highlights the need for better training and education in this area. This is further complicated by some asylum seekers being supported by International Health and Medical Services (IHMS) and the Red Cross. However, these complexities were beyond the scope of this study.

Poor knowledge of hospital fee-waiver programs could limit access to hospital care and could be obstructed by this perceived cost burden, and health professionals might not be referring asylum seekers as they otherwise would.

Better knowledge of the pre-visa screening process may help to avoid duplications or omissions and thereby minimise financial and time burdens for patients and their paediatricians. This information is available — a copy of pre-departure screening results is given to Settlement Services International by the Department of Immigration and Border Protection on arrival. We are concerned that some health care workers may not know how to access this information and families are not being provided with it to bring to appointments.

Data derived by use of questionnaires are limited by potential responder bias; however, our sample was representative of Australia’s general paediatricians and responses did not differ greatly by demographic characteristics. Question wording and ordering may have resulted in our study underestimating disagreement with current policies. In questions 12 (approval of PNG proposal) and 15 (agreement with AMA statement that mandatory detention is child abuse), we outlined a policy or statement and then asked for approval or disapproval, whereas in question 14 (approval of detention of children), we outlined the RACP position calling for the end of detention for child asylum seekers, and then asked for approval or disapproval of detention of children (rather than of the RACP position). This may explain why almost all those who strongly agreed with detention of children also agreed with the proposition that mandatory detention was a form of child abuse.

Refugee and asylum seeker health care is complex with frequent government policy changes. Nonetheless, our findings show that there is considerable confusion about their legal and health access-related rights and the services currently available to assist in delivering care. As a group, paediatricians strongly oppose the detention of children and forced offshore processing of protection visa claims. Australian health care professionals need better training and education to be able to provide best practice health care to these most vulnerable children.

First, medical practitioners can ensure they have up-to-date knowledge of the health problems common among refugee and asylum seeker patients and develop an awareness of information sources and local services available to support the assessment and care of refugee and asylum seeker patients.

Second, medical practitioners can be important advocates for the rights of the specific children they see. This may include writing to the Minister to request that a child be removed from detention and that families be reunified. If such approaches are unsuccessful, the matter may be referred to the Commonwealth Ombudsman. Doctors may choose to contact their parliamentary representatives expressing support for the AMA, RACP and Australian Human Rights Commission positions on people who are seeking asylum and are in detention.

On 19 August 2014, the Minister for Immigration and Border Protection announced measures to enable children to be released from detention onto bridging visas, but only if they arrived before the arbitrary date of 19 July 2013. At the time of his announcement there were 876 children held in detention, including some in Nauru. All of these children should be released from detention immediately, irrespective of their date of arrival.

1 Practical information for managing asylum seekers and refugees

Terminology

  • An asylum seeker is a person who is living outside their country of origin and has applied for recognition as a refugee.4
  • A refugee is a person who is living outside their country of origin and has a well founded fear of persecution for reasons of race, religion, nationality, membership of a particular social group or political opinion.5
  • An unaccompanied minor is a person aged < 18 years who has arrived in Australia without a natural parent or a relative ≥ 21 years old.6 The Minister for Immigration and Border Protection is likely to be the designated legal guardian of unaccompanied minors.1,7

United Nations High Commissioner for Refugees (UNHCR) camps

  • Refugees processed offshore have waited, on average, > 10 years in refugee camps run by the UNHCR before resettlement to Australia.1

Medicare eligibility and charging patients

  • All refugees have Medicare cards and are entitled to health care cards under the same conditions as Australian citizens (some waiting periods are waived).8
  • Some asylum seekers have Medicare rights attached to their temporary visas.4,910
  • To check a patient’s Medicare eligibility, contact the Medicare enquiry number (132 150, press “1”) or access Health Professional Online Services (http://ww.medicareaustralia.gov.au/hpos).
  • To check eligibility for the Asylum Seeker Assistance Scheme, contact the Australian Red Cross (02 9229 4111).
  • A public hospital fee waiver program for asylum seekers without a Medicare card is available in most Australian states and territories (no formal policy found for Northern Territory and Western Australia). In New South Wales, a fee waiver is available for certain public health services including emergency care for acute conditions, some elective surgery, and ambulatory and outpatient care to maintain the health of patients with acute and chronic conditions, and to provide patients with maternity services and mental health services.1113

Translating services

Screening

  • Applicants for a permanent visa in Australia are required to undergo a chest x-ray for tuberculosis screening (those aged ≥ 11 years) and HIV screening (those aged ≥ 15 years or if there is a history of blood transfusions or clinical indications suggesting HIV infection, or that the child’s mother was or is HIV positive).14
  • For more information on past screening and immunisations for patients in detention, please contact International Health and Medical Services Community Detention Assistance Desk on 1800 689 295 or email cdad@ihms.com.au.

2 Paediatricians’ responses to questionnaire items, by paediatrician demographic characteristics


Sex


Where degree obtained


Clinical experience


Responses

Female (n/N)

Male (n/N)

P*

Australia (n/N)

Overseas (n/N)

P*

< 10 years (n/N)

≥ 10 years (n/N)

P*


Sees refugee children at least every month

11/59

9/66

0.45

19/105

2/23

0.36

3/22

18/106

1.00

Described Ali as an asylum seeker (Ali is a 12-year-old boy from Afghanistan arriving by boat with no visa)

53/59

50/66

0.04

88/105

17/23

0.26

19/22

86/106

0.76

Described Li as an asylum seeker (Li is a 10-year-old girl seeking protection arriving by plane on a tourist visa)

51/59

54/66

0.48

90/105

16/23

0.06

15/22

91/106

0.046

Knew that the Minister for Immigration and Citizenship was Ali’s legal guardian as Ali was only accompanied by his 15-year-old brother

39/59

37/66

0.25

62/105

14/23

0.87

13/22

63/106

0.98

Knew there was a fee waiver for essential hospital-based care

7/59

4/65

0.35

7/105

4/22

0.10

2/22

9/105

1.00

Knew some asylum seekers and all refugees had Medicare cards

32/59

31/66

0.42

48/105

15/23

0.09

8/22

55/106

0.19

Used phone or in-person interpreter when patient did not speak English

57/58

58/65

0.07

96/103

21/23

0.67

22/22

95/104

0.36

Knew about Medicare hotline

8/59

6/65

0.45

12/104

2/23

1.00

3/22

11/105

0.71

Knew about Translating and Interpreting Service Doctors Priority Line

36/59

29/65

0.07

54/104

13/23

0.69

12/22

55/105

0.86

Knew who received chest x-rays before arrival

6/59

4/66

0.52

7/105

3/23

0.38

2/22

8/106

0.68

Knew who received HIV screening before arrival

12/59

5/65

0.04

13/105

4/22

0.49

3/22

14/105

1.00

Considered that refugee and asylum seeker children posed a low or no risk of disease transmission

50/59

50/65

0.27

85/104

18/23

0.70

20/22

83/105

0.25

Approved or strongly approved of immediately sending asylum seekers to Papua New Guinea

0/58

13/66

< 0.001

11/103

3/23

0.72

4/22

10/104

0.27

Knew that refugees stayed an average of > 10 years in UNHCR refugee camps before settling in Australia

9/59

8/66

0.61

17/105

0/22

0.04

4/21

13/106

0.48

Approved or strongly approved of mandatory detention of children

11/59

24/66

0.03

27/104

8/23

0.39

6/22

29/105

0.97

Agreed or strongly agreed with AMA statement that detention of asylum seeker children was a form of child abuse

50/59

52/66

0.39

85/104

18/23

0.70

15/22

88/105

0.09


AMA = Australian Medical Association. n = no. of paediatricians giving each response. N = no. of paediatricians who answered question. UNHCR = United Nations High Commissioner for Refugees. * 5% significance was determined with χ2 analysis whenever there were more than 5 valid responses, and with a two-tailed Fisher exact test whenever there were less than 5 valid responses. † Less than 5 valid responses.

3 Paediatricians’ knowledge about tuberculosis and HIV screening of refugee and asylum seeker children*


* Participants were asked to respond with reference to a clinical vignette that described a family of two parents and four children. The family was granted refugee status by the United Nations High Commissioner for Refugees. They are all well and none has any significant past medical history. † Applicants for a permanent visa in Australia are required to undergo a chest x-ray (those aged ≥ 11 years) and HIV screening (those aged ≥ 15 years, or if there is a history of blood transfusions or clinical indications suggesting HIV infection, or the child’s mother was or is HIV positive).14

4 Paediatricians’ responses to Australian Medical Association’s statement that “detention of asylum seeker children and their families is a form of child abuse25

5 Paediatricians’ approval or disapproval of offshore processing and detention of asylum seeker children


* In July 2013, the Australian Government announced a proposal to send all asylum seekers arriving by boat to Papua New Guinea for processing and that “As of today asylum seekers who come here by boat without a visa will never be settled in Australia”.26 † As at June 2012, over 1000 children were recorded as being held in detention in Australia. The Royal Australasian College of Physicians released a statement in May 2013 entitled “Leading paediatricians call for the immediate end to children in detention”.27

6 Paediatricians’ responses to questionnaire items by how often paediatricians saw refugee and asylum seeker children


Frequency of seeing refugee and asylum seeker children


Responses

At least once per month (n/N)

Less often than once per month (n/N)

P*


Described Ali as an asylum seeker (Ali is a 12-year-old boy from Afghanistan arriving by boat with no visa)

17/21

88/107

1.00

Described Li as an asylum seeker (Li is a 10-year-old girl seeking protection arriving by plane on a tourist visa)

19/21

87/107

0.53

Knew that the Minister for Immigration and Citizenship was Ali’s legal guardian as Ali was only accompanied by his 15-year-old brother

12/21

64/107

0.81

Knew there was a fee waiver for essential hospital-based care

1/21

11/118

0.69

Knew some asylum seekers and all refugees had Medicare cards

15/21

48/107

0.03

Used phone or in-person interpreter when patient did not speak English

20/21

97/105

1.00

Knew about Medicare hotline

6/21

8/106

0.005

Knew about Translating and Interpreting Service Doctors Priority Line

12/21

55/106

0.66

Knew who received chest x-rays before arrival

4/21

6/107

0.06

Knew who received HIV screening before arrival

5/21

12/106

0.13

Considered that refugee and asylum seeker children posed a low or no risk of disease transmission

17/21

86/106

1.00

Approved or strongly approved of immediately sending asylum seekers to Papua New Guinea

1/21

13/105

0.46

Knew that refugees stayed an average of > 10 years in UNHCR refugee camps before settling in Australia

8/21

9/106

< 0.001

Approved or strongly approved of mandatory detention of children

2/21

33/106

0.06

Agreed or strongly agreed with AMA statement that detention of asylum seeker children was a form of child abuse

17/21

86/106

1.00


AMA = Australian Medical Association. n = no. of paediatricians giving each response. N = no. of paediatricians who answered question. UNHCR = United Nations High Commissioner for Refugees. * 5% significance was determined with χ2 analysis whenever there were more than 5 valid responses, and with a two-tailed Fisher exact test whenever there were less than 5 valid responses. † Less than 5 valid responses.

Identified health concerns and changes in management resulting from the Healthy Kids Check in two Queensland practices

Population screening of young children has been proposed to detect early developmental delay and behavioural difficulties, enabling early intervention and prevention of long-term physical and mental health problems.13 The Healthy Kids Check (HKC) is an Australian Government initiative to assess 4-year-old children for physical developmental concerns, introduced as a one-off Medicare-funded assessment in 2008. Although now rescinded, the National Health and Medical Research Council review of childhood screening and surveillance did not recommend screening, instead proposing surveillance (meaning “following development over time”).4 The HKC is classified as screening rather than surveillance, because it is a one-off check. With over 282 200 4-year-olds in Australia in 2010,5 this represents a significant health investment.

The HKC is usually administered by general practitioners, who are well placed to identify and subsequently manage potential problems. Children with possible problems may be referred to specialists for confirmation and management. Although implementation of the HKC varies from practice to practice, there are six mandatory screening items: height and weight, vision, hearing, oral health, toileting, and notation of allergies.6

Effective strategies to identify and confer benefits to child health outcomes are paramount. However, few screening implementation studies have assessed child health outcomes.7 Rather, many have assessed changes to screening rates, identification of potential problems and referrals.810 These are surrogate end points; they do not evaluate the effectiveness of screening intervention outcomes. Ideally, to assess the clinical impact of screening programs on child health, researchers should track developmental and health outcomes of children whose screening test results are positive or negative.

There have been two reviews on the effectiveness of the mandatory screening components of the HKC. They found insufficient evidence for the effectiveness of most components, evidence for some components, and evidence of ineffectiveness for the remainder (Appendix 1).3,11 There were plans to expand the HKC to include social and emotional developmental problems and to reduce the screening age from 4 to 3 years in 2014.12 Since the first announcement of the changes, the reduced age has been maintained, but the composition of the new HKC is now unclear. Policy decisions about the expansion of the HKC, and even its original form, are not well informed by data on its efficacy or efficiency. This may reflect the assumption that early detection leads to early treatment and therefore that screening is beneficial. However, screening can be harmful as well as beneficial.13 Screening is effective if (i) the screening test has good sensitivity and specificity;14 (ii) effective early intervention is equitably available and accessed;15 and (iii) early interventions yield better long-term outcomes than those provided later.16

Our study is the first evaluation of the HKC. We aimed to determine how many children had health problems identified by HKC screening and how many of these had their clinical management changed.

Methods

We conducted a retrospective audit of 557 medical records from two Queensland general practices that provided the HKC to children between January 2010 and May 2013 (Box 1). We identified appropriate records by matching dates of birth and Medicare item numbers 701, 703, 705 and 707 (time-based HKC consultations with GP input). We read relevant files from the date of file commencement until either 9 March (Practice 1) or 2 June (Practice 2) 2013. By reading entire files and extracting data related to all child health problems noted by the GP, we were able to match specific health problems to time of detection in relation to the itemised, one-off HKC. Data extracted included child health problems detected before, during and after the HKC. For some children, some health problems were detected twice. In these cases, we coded the first detection: problems detected before and again during, and those detected before and again after, the HKC appointment were coded as “before”; and problems identified during and again after the HKC were coded as “during”.

We recorded any child health problems described in the consultation notes section of the medical records and matched these to the HKC components. These are described in Appendix 2. In the event of a review scheduled or a referral made as a result of the HKC, outcome data from review notes, letters or referrals were also extracted. Two authors (B R and K V) conducted double data extractions for about 10% of the sample to identify potential discrepancies and to discuss and resolve these before independently extracting and entering the remaining data. Data were entered into Microsoft Excel spreadsheets. Discrepancies (predominantly data entry errors) were reconciled by another author (L M) before analyses. Our a priori setting of clinical significance was a minimum change of 6% in clinical management for the program to be effective. This was arbitrary, and represents about one child per GP per year benefiting from the HKC. Study approval was granted by the Bond University Human Research Ethics Committee (RO1568).

Results

Of the total number of children in our sample, over half (331/557, 59%) had no problems in their health or development noted in the medical record at any stage; 116/557 (21%) had problems identified during the HKC; 107/557 (19%) had problems detected before the HKC; and 23/557 (4%) had problems detected after the HKC (Box 2).

Of the children with problems identified during the HKC, 19/557 (3%) were referred or reviewed and then confirmed with appropriate change in clinical management; 7/557 (1%) were managed or referred, with no problems confirmed; 48/557 (9%) had no action taken; and the remaining 42/557 (8%) had uncertain outcomes (Box 3). Therefore, up to 11% (61/557 [19 children with confirmed problems and 42 children with unclear or missing data]) of children may have had problems identified by the HKC and managed appropriately, but most of these children had unclear file notations.

Child health concerns detected by GPs

Overall, 347 problems were identified in 246 children (Box 2). The three most identified developmental problems were speech and language (77/347, 22%), hearing (51/347, 15%) and anatomical concerns (42/347, 12%).

Of the problems detected before the HKC appointment, the most common were speech and language (41/174, 24%), anatomical concerns (32/174, 18%) and hearing (23/174, 13%). Problems identified during the HKC included mandatory components and other problems detected during the check. Problems from the mandatory components were independent toileting (22/144), hearing (21/144) and vision (21/144) (15%, respectively), oral health concerns (10/144, 7%) and concerns regarding height or weight (4/144, 3%). Other problems commonly identified during the HKC involved speech and language (29/144, 20%), behaviour (13/144, 9%), anatomical concerns (8/144, 6%) and cardiac problems (5/144, 3%). No allergy notations were extracted from the health consultation notes.

Behaviour, hearing, and speech and language each accounted for almost a quarter of the problems detected after the HKC (Box 2).

Child health concerns and the Healthy Kids Check

Twenty-six children had 39 problems identified and were either further managed (scheduled for monitoring or review) or referred to specialist services as a direct result of the HKC. Of these, 19 children (19/557, 3% of the total sample) had their problems confirmed, resulting in a change of management (Box 3) (Appendix 3). The most frequent confirmed problems involved speech and language (9/31), hearing (6/31), behaviour (3/31) and vision (3/31) (Box 3).

No further action was recorded for the problems of 49 children (9% of total sample). For these children, the most common problems detected involved toileting (20/56), speech and language (7/56) and behaviour (6/56). For 42 children (8% of total sample) with health-related concerns detected at the HKC, information about scheduled reviews, referral letters or referral outcomes was either missing or unclear (Box 3).

Discussion

The HKC is administered by GPs, who are well placed to identify and manage potential problems early. That 144 problems were detected in 116 children suggests that GPs are diligent in detecting child health concerns. In our medical records audit of two Queensland general practices, we documented a change in management for 3% (19/557) of children, no change for 1% (7/557), no further action for 9% (48/557) and unclear or missing data for a further 8% (42/557). We conservatively estimate that between 3% (19 children with confirmed problems) and 11% (19 children with confirmed problems and 42 children with unclear outcomes) of children have a change in clinical management resulting from the HKC (based on numbers where change was clear and unclear). Our lower estimate of 3% is similar to a developmental screening study that followed referral pathways of children to early intervention services.17

In our study, for 19 children, we identified 26 problems that resulted in clinically important changes to management. Assuming adequate services and interventions were available, accessed and effective, these children benefited from the HKC. They may also have experienced harms (eg, from overdiagnosis of problems that would never have had a negative impact18), but this cannot be determined from the available data.

A lack of independent toileting was the most detected and least actioned problem. This is appropriate: questioning about independent toileting is a mandatory component of the HKC, but action is not recommended until after 5 years of age because of evidence of ineffectiveness.11 However, discussing with parents what is “normal” and giving practical advice about toileting issues may still be beneficial. Child behaviour concerns can be managed actively or passively. A GP may encourage parents to try several strategies to ameliorate child behaviour problems (active), or consider the child’s behaviour to be probably normal and adopt a “test of time” or “watchful observation” approach (passive). There was often insufficient detail in the medical record to distinguish between active and passive approaches; we were therefore unable to determine whether the outcome was appropriate. Finally, problems detected after the HKC may represent missed or new incident problems (not present at the time of the HKC). For example, several learning problems are unlikely to be detected until a child is of school age. Reasons for our lack of allergy notation data are unclear: allergies may have been recorded elsewhere than in the consultation sections of the medical record; the GP may not have recorded any (perhaps not realising their mandatory reporting status); or there were none.

The study has several strengths. It is the first evaluation of HKC outcomes. We used medical records from two large general practices; two researchers independently extracted data; and all data were double entered as a reliability check (few discrepancies were found).

There were also limitations. First, the study design relied on accurate and detailed documentation of events in medical records. We could not determine the outcome of reviews or referrals for 42 children who had a health problem detected during the HKC. Therefore, our estimation of a positive predictive value of the HKC of 3% is likely to be an underestimation. Second, screening can be harmful as well as beneficial. We could not determine whether children (or their parents) experienced harms (such as anxiety regarding the screening results or overdiagnosis).18 Conversely, reassurance of “normal development” is often suggested as a screening benefit; however, medical record audits do not produce these data. Third, because this was a cross-sectional study, the time between the HKC and the medical record audit varied between subjects. Therefore, some data may be missing because of insufficient time between the HKC and rescheduled or specialist appointments. Some children may have had problems that were missed but insufficient time had elapsed for these problems to be recorded, or children may have moved to a new general practice. Finally, this study design precludes estimating the true negative value for the HKC (which would require an independent examination of every child to determine the false negatives). It is impossible to estimate false negatives without an intervention trial (in which all screened negative children would be subject to a gold-standard assessment).

Our data suggest that GPs are identifying important child health concerns during the HKC, using appropriate clinical judgement for the management of some conditions, and referring when concerned. It also appears that GPs use HKC screening to conduct opportunistic examinations that extend the parameters of the HKC, identifying other clinically meaningful child health concerns. However, they may be hampered by limited means of detection with little evidence of effectiveness. We also have no knowledge of the cost-effectiveness of the HKC, although given that its timing coincides with vaccination at 4 years of age, the incremental cost is likely small. Despite lack of evidence of effectiveness, the HKC is scheduled to be expanded to include social and emotional development and assessment at 3 years of age.

Longitudinal studies of community samples or birth cohorts report that few young children have high internalising (eg, anxiety, depression) and/or externalising behaviours (eg, oppositional behaviour) at any assessment period, and that very few continue these behaviours to school entry.19,20 An Australian prospective cohort study following children to adulthood reported screening children at 5 years of age for behavioural, social and emotional concerns poorly predicted psychopathology at 21 years of age.21 Estimates of the sensitivity and specificity of the age 5 years screening tool were 23% and 82%, respectively, for any diagnosis of psychopathology at 21 years of age. In other words, single screening for behavioural, social and emotional problems does not confer long-term benefits for most children, perhaps because of the rapid developmental changes.21 Given the significant child health concerns detected throughout the medical records and at various time points (including times other than the one-off HKC) in our study, we must consider the value of a single-point assessment, which has components of limited evidence.

Despite interventions to improve the uptake of screening in paediatric primary care, few studies have tracked developmental outcomes of those screened.7 Previous research in child developmental screening and subsequent intervention reported that screening for developmental delays was not effective in changing health outcomes for children, and that harms occurred for some parents.22 A longitudinal, prospective cohort study of children undertaking the HKC is needed to understand the long-term outcomes of children with identified health concerns, and to determine whether interventions help or harm.

1 Medical records audit — flow diagram


HKC = Healthy Kids Check.

2 Number of children, and categories, numbers and proportions of problems detected before, during and after the Healthy Kids Check (HKC)

Problems detected*

Before HKC

During HKC

After HKC

Total


No. of children

107

116

23

557

Mandatory HKC components


Height and weight

14 (8%)

4 (3%)

0

18 (5%)

Vision

8 (5%)

21 (15%)

1 (3%)

30 (9%)

Hearing

23 (13%)

21 (15%)

7 (24%)

51 (15%)

Oral health

0

10 (7%)

0

10 (3%)

Toileting

2 (1%)

22 (15%)

1 (3%)

25 (7%)

Other problems detected


Behaviour

10 (6%)

13 (9%)

7 (24%)

30 (9%)

Eating

3 (2%)

3 (2%)

0

6 (2%)

Anatomical

32 (18%)

8 (6%)

2 (7%)

42 (12%)

Cardiac

9 (5%)

5 (3%)

0

14 (4%)

Motor

8 (5%)

3 (2%)

2 (7%)

13 (4%)

Speech and language

41 (24%)

29 (20%)

7 (24%)

77 (22%)

Head circumference

6 (3%)

0

0

6 (2%)

Psychological disorders

10 (6%)

3 (2%)

0

13 (4%)

Other

8 (5%)

2 (1%)

2 (7%)

12 (3%)

Total no. of problems*

174

144

29

347


* Children could have more than one problem; 311 children did not experience any problem at any time. † Includes 28 children with problems identified before and during HKC. ‡ Does not include six children also identified with different problems before the HKC but with no problems at the HKC.

3 Changes in management resulting from problems detected in the Healthy Kids Check (HKC)

Problems detected*

Managed or referred and problem identified

Managed or referred and no problem identified

No action taken

Unclear or missing data

Total


No. of children

19

7

48

42

116

Mandatory HKC components


Height and weight

1

0

2

1

4 (3%)

Vision

3

0

4

14

21 (15%)

Hearing

6

2

5

8

21 (15%)

Oral health

2

0

3

5

10 (7%)

Toileting

1

0

20

1

22 (15%)

Other problems detected


Behaviour

3

1

6

3

13 (9%)

Eating

0

0

3

0

3 (2%)

Anatomical

1

1

3

3

8 (6%)

Cardiac

2

2

1

0

5 (3%)

Motor

1

0

1

1

3 (2%)

Speech and language

9

1

7

12

29 (20%)

Psychological disorders

2

1

0

0

3 (2%)

Other

0

0

1

1

2 (1%)

Total no. of problems*

31

8

56

49

144


* Children could have more than one problem. † Dyslexia. ‡ Diabetes.

David John Seymour Hill MB BS, FRACP

David Hill was born in Melbourne on 15 July 1944. When he was 9 years old, his family moved to Mt Gambier, South Australia, where his father was a general practitioner and his mother was the first social worker. As a child, David always intended to be a doctor.

From the age of 11, David attended boarding school at Prince Alfred College in Adelaide, where he was a prefect.

David studied medicine at the University of Adelaide, living at St Mark’s College. After graduating in 1969, he was a resident medical officer at the Queen Elizabeth Hospital. He completed a further residency year at the Adelaide Children’s Hospital, where he subsequently worked as a paediatric registrar. In 1976, he moved to Dunedin, New Zealand, where he was Senior Paediatric Registrar at Dunedin Hospital and a lecturer with the Department of Paediatrics at the University of Otago.

On returning to Adelaide in 1977, he was Senior Visiting Paediatrician at the Adelaide Children’s Hospital, Flinders Medical Centre and Regency Park Centre for Young Disabled. Concurrently, he conducted a private practice in North Adelaide. He also worked as a consultant paediatrician in Mt Gambier from 1987 to 1994.

From 1995 to 2002, he was Director of Paediatrics at Toowoomba Hospital and a visiting specialist to surrounding clinics and hospitals. He returned to Mt Gambier to practise as a consultant paediatrician as well as being a visiting paediatrician to the Millicent and District Hospital from 2002 to 2008.

David had a very active interest in most sports, especially cricket, and was an excellent swimmer — this interest would later be reflected when he served as Honorary Medical Officer to the South Australian Amateur Swimming Association. He was a mascot of Port Adelaide Football Club as a young boy and retained this allegiance for the rest of his life.

He was a much-loved paediatrician because of his gentle and knowledgeable approach. David retired in 2008 but his health suffered. However, he never lost his patience and dry humour. David died from metastatic cancer on 3 July 2014, and is survived by June, his wife of over 40 years, and children Amanda, Amy, Angus and Alistair.

Data needs in child maltreatment response

Solving the problem begins with accurately measuring its occurrence

In a recent supplement to the American Journal of Preventive Medicine on approaches to measuring the incidence of the leading cause of fatal child maltreatment — inflicted brain injury — a staff member of the World Health Organization asserted that the major element missing from the global response to child maltreatment was “epidemiologically informed methods for monitoring its occurrence”.1 This view was reinforced when, in the year after its 2009 series on child maltreatment, The Lancet asked leading professionals in child health and welfare what question they most needed to be answered by the scientific published work. Their response was “Are trends in child maltreatment decreasing?”2

The difficulties of relying on reporting or notification and substantiation data from statutory child protection agencies to monitor child maltreatment are well known. These data are not good measures of the true prevalence of child abuse and neglect, because they are subject to changes in legislation and reporting policies and practices.3 This is nowhere more evident than in the impact of the recent change to the reporting threshold in New South Wales, changed by legislation after the Wood Inquiry in 2008, from “harm” to “significant harm”.4 The number of children who were the subject of a report increased steadily from the early 2000s, reaching 114 765 in the financial year 2008–09 before the NSW Government’s Keep Them Safe reforms5 were introduced, but then falling to 61 132 in 2010–11.6 Comparisons between and within jurisdictions over time are thus difficult, as illustrated by the fact that the Australian Institute of Health and Welfare noted in its annual review of child protection in Australia that the changes meant that new data were not comparable with those from previous years.7 Use of these population data to gauge the impact of prevention and early intervention strategies — a central element of the public health approach to child protection advocated for the past 40 years2,3 — is highly problematic.

Alternative measures include the use of mortality and hospital morbidity data.8 The article by Guthridge and colleagues in this issue of the Journal, examining trends in hospital admissions for child maltreatment-related conditions in the Northern Territory, provides an example of the usefulness of the latter.9 The WHO and UNICEF have called for uniform reporting procedures for registering both fatal and non-fatal child maltreatment, arguing that health professionals are better placed than others to obtain evidence of maltreatment, and advocating for better systems of communication between health professionals and statutory child protection workers.10

The use of hospital morbidity data for surveillance of child maltreatment is not without its pitfalls, though. For a case to be coded under a definitive maltreatment code using the ICD-10-AM (International Classification of Diseases, version 10, Australian modification),11 clear clinical documentation of evidence of maltreatment is necessary. If documentation shows that an injury, for example, is queried as suspicious, but there is no documentation of further investigation being done to rule out or substantiate maltreatment, coding rules prevent the assignment of a definitive maltreatment code but allow for the case to be considered as possible maltreatment. The lack of clear, legible, concise and complete documentation is likely to result in underestimates of the true magnitude of maltreatment.7 Nevertheless, a study in the United States linking hospital morbidity data with child protection service data found that 12% more cases of maltreatment were identified using data from emergency departments and admissions compared with child protection service data alone.12 The value of linking data from multiple sources has also been highlighted in Western Australia,13 where data showed rises in both hospital morbidity rates and child protection notification rates over the same period.

One way in which documentation in medical records might be improved, enabling coding to achieve higher sensitivity, would be the use of agreed protocols for recording histories and the results of examinations and investigations in suspected cases of child maltreatment. A SCAN (suspected child abuse and neglect) medical protocol has recently been launched in NSW public hospitals for use by paediatric consultants and junior staff involved in assessing suspected cases of child maltreatment referred to them by other staff (emergency department, inpatient) or by the statutory agency, which has the legislative authority to request that carers present their child for a medical examination.14

Another way of improving the capture of possible cases of child maltreatment would be to broaden the coding rules to enable cases to be assigned definitive codes in suspected cases where there is undetermined intent or adverse social circumstances related to the injury.15

However, the challenges facing the development of more broadly based surveillance systems are considerable. For example, a review analysing the steps needed to develop a measurement system for inflicted brain injury concluded that the ideal system will need to link data from different sources — medical, legal and social service — and be maintained over time.16 This challenge reaffirms the growing recognition that “wicked” problems like child maltreatment inevitably require high-level strategic leadership and the good will of many to devise a collective solution.

Role of the medical community in detecting and managing child abuse

To the Editor: I thank Oates,1 and Gwee and colleagues2 for writing on the role of the medical community in detecting and managing child abuse. I would like to add to the points they make. Doctors have a crucial role in medical follow-up for children in out-of-home care. Many children in out-of-home placements have complex needs, with physical and mental health disorders.3 Placement breakdowns mean that some children lack consistency in medical follow-up, which can lead to complete treatment drop-out. This is a significant risk factor for children in care.4

Keeping the child health passport up to date can help with handover of medical conditions for children changing placements. General practitioners can assist with handover by keeping a log of prescriptions issued, with photocopies of private scripts.5 A doctor should highlight in the medical record when a patient is a child in care, making note of the name of the person who attends with the child, which organisation he or she works for, and details of the responsible government department and case worker. Such details can be useful to track a new abode for the child, particularly in the context of a missed appointment. Details of the guardian are also valuable when seeking consent for treatment.

Medication safety can be promoted through: carers leaving prescriptions at a designated pharmacy; weekly or fortnightly dispensing; use of Webster-paks; and the safe storage of medications by carers. The medical community can, with documentation and attention to prescribing, assist with the medical management of children in care.

Trends in hospital admissions for conditions associated with child maltreatment, Northern Territory, 1999-2010

Child maltreatment statistics are routinely reported by child protection services in all Australian jurisdictions.1 There are well documented variations in both the rates and trends of these statistics among states and territories. In the 6 years from 2004–05 to 2009–10, notifications of possible maltreatment increased fourfold in Western Australia but halved in Queensland. For the same period, the number of substantiated cases halved in the Australian Capital Territory but increased threefold in the Northern Territory.1 Explanations for the variation both within and between jurisdictions include: varying mandatory reporting requirements; changes in the threshold for documenting reports; changes in definitions; and changes in policy and service capacity.2 Rates also vary between countries. The rate for Australian children subject to substantiated maltreatment was 6.1 per 1000 in 2009–10,1 compared with 14.2 per 1000 in Canada in 20083 and 3.6 per 1000 children in England in 2009–10.4 Improved understanding of variations in child maltreatment rates is important in informing the rational development of services and has led to efforts to expand the sources of information used for child maltreatment surveillance. One possible source is hospital inpatient data.

Details of hospital admissions are coded by trained administrative staff using the International Classification of Diseases, which includes version 9, clinical modification (ICD-9-CM) and version 10, Australian modification (ICD-10-AM).5,6 The classification system includes codes for specific diagnoses and for cause of injury, including whether an injury was intentional. There are also codes for child maltreatment. A recent review of 47 international studies assessed the utility of hospital codes for reporting injury-related child maltreatment.7 The authors were guarded in their recommendation for the general use of hospital admissions data for reporting child maltreatment, concluding that the primary benefit was to identify “selected diagnoses” and patterns of child abuse.

The use of hospital data for more general surveillance has been uncommon. A 2004 analysis linked child protection data with diagnostic data from emergency departments and hospital admissions.8 The analysis identified 12% more cases of maltreatment than child protection data alone. Nonetheless, the authors concluded that the method was of only marginal benefit, and could not be justified as an ongoing model because of the limited subset of additional cases, methodological complexity and expense. More recently, it has been proposed that population surveillance may be feasible if based on a wider range of codes “suggestive” of child maltreatment.9 Researchers identified 68 ICD-9-CM codes which, when restricted by age bounds, were estimated to have a greater than 66% likelihood of being the result of child maltreatment. In WA, hospital maltreatment and assault codes have been validated by linkage with child protection data.10 The authors of this study subsequently reported long-term trends in child maltreatment and assault.11 WA hospital data were also used in a comparison of trends in maltreatment in six countries.12 A further variation in approach involved systematically identifying ICD-10-AM hospital inpatient codes “indicative” of child maltreatment.13 This approach included separate codes for four types of maltreatment — physical abuse, sexual abuse, emotional abuse and neglect. The application of these codes included a filter for specified perpetrator categories that may be recorded within admission codes.

We recently reported trends in notifications and substantiated cases of child maltreatment for the NT using child protection data for 1999 to 2010.14 Through this period of legislative change, service expansion and continued media attention, the rate of substantiated cases of maltreatment increased by 18% per year among Aboriginal children, while there was no evidence of increase among non-Aboriginal children. Despite the increase in substantiated cases, we were unable to identify whether there had been a change in the underlying rates of maltreatment in the population. The aim of this study was to investigate trends in child maltreatment among NT Aboriginal and non-Aboriginal children using a different data source — hospital admissions.

Methods

Data sources

We used the NT hospital separations dataset (HSD), which contains data (with coded diagnoses and procedures) for inpatient episodes for all five NT public hospitals. Data from the one private hospital in the NT were not available. The research dataset contained de-identified demographic information and up to 10 admission codes for all children aged 0–17 years admitted between 1993 and 2010. Demographic information included a unique identification number for each child. Rates were calculated using population data (by year, sex, 5-year age-group and Indigenous status), provided by the Health Gains Planning Branch of the NT Department of Health, based on Australian Bureau of Statistics estimates.15

Identification and classification of abuse-related episodes

Hospital admissions were coded using the ICD-9-CM until June 1998 and then ICD-10-AM from July 1998 onwards. Analysis was undertaken using both the definitive codes for maltreatment (ICD-10-AM codes T74.0, Y06 and Y07 and ICD-9-CM codes 9955, E9684 and E967) and indicative codes proposed by McKenzie and Scott (Appendix).13 Mapping of ICD-9-CM to ICD-10-AM codes was possible for definitive maltreatment codes;16 however, there was an anomalous surge in ICD-9-CM coded episodes after 1996 which was consistent with a systematic change in coding practice. There was greater difficulty mapping the indicative codes, with one-to-many mapping of the indicative codes between ICD versions. As a result of these inconsistencies, the final analysis was restricted to the 12-year period from 1 January 1999 to 31 December 2010. Interstate residents, patients with no diagnostic information and “statistical discharges” were excluded. A statistical discharge indicates a change in the type of care during a single admission in the same hospital.

A number of changes were necessary to the approach of McKenzie and Scott.13 Supplemental codes for perpetrators were introduced for external cause codes (ICD-10-AM codes X85-Y09) in 2002, after commencement of the study period, and were therefore not used in the general analysis. McKenzie and Scott also included two procedure codes which were not included in this analysis. There were no recorded episodes of physical abuse counselling (9608400) in the NT HSD, while the small number of full-body radiography procedures (5830600) not already identified using an admission code for child maltreatment were commonly associated with conditions such as the assessment of cancer or genetic conditions.

Repeat admissions of a child for the same incident, including interhospital transfers, were identified using separation mode, date of separation and admission codes. These admissions were then analysed as a single event based on details provided for the first admission.

Analysis

The incidence rates for all maltreatment-related hospitalisation episodes were calculated by Indigenous status for the age-group 0–17 years combined; a subanalysis for physical abuse-related hospitalisations included sex and age-specific (0–12 and 13–17 years) rates. Poisson regression was used to estimate the incidence rate ratio for the annual increase in rates by calendar year.

Ethics

The study protocol was approved by the Human Research Ethics Committee of the NT Department of Health and the Menzies School of Health Research (HREC 11-1501) and the Human Research Ethics Committee of the University of Adelaide (H-028-2011).

Results

The study dataset contained information on 150 962 public hospital admissions, from 1999 to 2010. Analysis was undertaken on 140 646 records after excluding 6857 interstate residents, 90 patients with no diagnostic information and 3369 statistical discharges.

Definitive maltreatment diagnoses

There were 323 admissions with at least one definitive code for maltreatment. After removing 10 repeat admissions there were 275 admissions of Aboriginal children and 38 admissions of non-Aboriginal children (Box 1). The average annual hospitalisation rate for Aboriginal children with a definitive code was almost ten times the rate for non-Aboriginal children (8.8 v 0.91 admissions per 10 000 per year, respectively). The rate for each group tended to decrease over time, but neither decrease was statistically significant.

Indicative maltreatment diagnoses

During the same period, there were 1201 admissions with one or more codes indicative of maltreatment. After removing 99 repeat admissions, there remained 885 admissions of Aboriginal children and 217 admissions of non-Aboriginal children (Box 1). The average annual hospitalisation rate was greater for Aboriginal children than non-Aboriginal children (28.4 v 5.2 admissions per 10 000 per year, respectively). Between 1999 and 2010, the estimated hospitalisation rate increased by 3% for Aboriginal and 4% for non-Aboriginal children, but the 95% confidence intervals were also consistent with no change or a small decrease (non-Aboriginal children) over time.

There was an overlap between types of maltreatment, with some children being diagnosed on the same admission with more than one type of maltreatment. Physical abuse was reported for about 85% of admissions for maltreatment among both Aboriginal and non-Aboriginal children (Box 1). The hospitalisation rate for Aboriginal children was almost five times the rate for non-Aboriginal children; rates increased for both groups between 1999 and 2010 (by 4% and 6% per year, respectively). The increase for Aboriginal children was statistically significant. For the group of non-specific indicative codes (“other”), including emotional abuse, the hospitalisation rate decreased by 14% per year for Aboriginal children and 17% per year for non-Aboriginal children. The decrease for Aboriginal children was statistically significant (but may reflect a shift in coding practice toward more specific codes).

The hospitalisation rate for conditions indicative of physical abuse was much higher for older children than younger children among both Aboriginal and non-Aboriginal children (Box 2). For non-Aboriginal children, the hospitalisation rate was 2–3 times as high for boys compared with girls in both age groups. Among Aboriginal children, the rates were similar for boys and girls aged 0–12 years, but higher for girls than boys among those aged 13–17 years, and increased for both older groups. The rate among older Aboriginal girls was 13.5 times the rate among older non-Aboriginal girls (Box 2).

Perpetrators

The available data with perpetrator codes, for 2003–2010, showed that among younger children, both Aboriginal and non-Aboriginal, most perpetrators were family members (Box 3). For most older children, a perpetrator was not specified. One notable difference among older children was that a spouse or partner was recorded as the perpetrator for 18% of Aboriginal children but only 1% of non-Aboriginal children.

Discussion

Our study shows the utility of hospital admissions data for population surveillance of child maltreatment. A direct comparison can be made between the results in this study and the results of our previous trend analysis, for the same period and same population, using child protection data.14 Among NT non-Aboriginal children there was a significant increase in notifications of possible maltreatment between 1999 and 2010, but both child protection substantiations and hospital admissions data suggest that the underlying level of child maltreatment has remained stable. Among Aboriginal children, the comparison of child protection and hospital data is more complex. Between 1999 and 2010, notifications to child protection authorities increased for all types of maltreatment, with an overall annual increase of 21%. This was matched by an annual increase of 18% in rates of substantiated cases. Numbers of cases also increased by type of maltreatment, except for physical abuse.14 The current study shows no increase in definitive codes and a 3% annual increase using the indicative codes, of uncertain significance. The difference in trends between data sources supports the argument that the increases in substantiated cases were a result of factors including improved identification, changes in policy and increased capacity in child protection services. The judgement by a clinician that a hospital admission was maltreatment-related involves a level of subjectivity, but the results suggest that clinical reporting practice did not change substantially over time.

Among older Aboriginal children, there was an increase in admission rates for physical abuse. Of particular concern was the violence against older Aboriginal girls, who had the highest rate of hospital admission for physical abuse among all groups, which was 13.5 times the rate for older non-Aboriginal girls. Perpetrator coding was available for more recent years; and while for most admissions the perpetrator was not specified, those that were specified suggest that the violence against older children extended beyond the historical definition of maltreatment (involving only parents and caregivers) to violence within the broader community, including from peers and partners. The results are consistent with previous reports on interpersonal violence that have highlighted the increased risk among Aboriginal children and women.1720

The study results also support a more general application. In WA, a maltreatment admissions rate of 2.7 per 10 000 children was reported for 1999, falling to 1.3 per 10 000 children in 2005.11 The WA rate in 2005 is consistent with the rate of 0.91 per 10 000 for non-Aboriginal NT children reported in this study. The WA rate of assault-related hospitalisation was 6.1 per 10 000 children in 2005,11 while for NT non-Aboriginal children in our study the average annual rate for physical abuse was 4.5 per 10 000 children. There are variations in the methods, populations and the time periods between studies; however, the similarity of results indicates that hospital admissions may provide a more consistent basis for comparison between Australian states and territories than the current reliance on child protection reports.

Whether based on child protection sources or hospital admissions, child maltreatment rates are only indicators of the prevalence of child maltreatment in a community. Hospital admissions data have the further limitation of only containing a subset of more severe episodes of maltreatment. In particular, emotional abuse is a rare hospital diagnosis, but is commonly reported in child protection data. A second limitation is that reporting is entirely dependent on clinical records. Definitive codes have the requirement that they can only be applied if there is a clear statement within the clinical record that the episode is a consequence of maltreatment. Clinicians may be suspicious, but not certain, so an episode can pass without a definitive record. Despite recommendations for developing classifications, there is currently no diagnosis code for “possible” maltreatment.9,21 As a result of not being able to use perpetrator codes for the general analysis in this study, there will be an overestimate of maltreatment-related admissions. However, the study shows a converse difficulty that, even when available, the perpetrator code was not specified in a substantial proportion of admissions.

This study demonstrates that hospital admissions data can provide an additional source for surveillance of child maltreatment in a population. The use of hospital data is particularly useful among younger children where there is a clearer association with family-related incidents. In this study, the stable rate of maltreatment-related admissions in younger Aboriginal children was in contrast to the increase in substantiated cases reported by child protection services.14 For older children the codes indicative of maltreatment overlap with incidents within the wider community. The extent of violence and overlap of family and community incidents lends support to the calls for a broad population strategy, with focus on prevention, to protect vulnerable children.21,22

1 Trends in hospital admission rates for child maltreatment, using both definitive and indicative codes (by type of maltreatment), 1999–2010


No. of admissions

Average annual rate per 10 000 (95% CI)

Annual change in rate, IRR (95% CI)


Aboriginal children


Definitive codes (1999–2010)

275

8.8 (7.4–10.2)

0.96 (0.91–1.01)

Indicative codes (1999–2010)


Neglect

170

5.5 (4.7–6.3)

1.03 (0.96–1.11)

Physical abuse

747

24.0 (21.5–26.5)

1.04 (1.01–1.08)

Sexual abuse

97

3.1 (2.3–3.9)

1.05 (0.96–1.16)

Other*

132

4.2 (2.6–5.9)

0.86 (0.79–0.93)

All admissions

885

28.4 (25.8–31.1)

1.03 (1.00–1.07)

NonAboriginal children


Definitive codes (1999–2010)

38

0.91 (0.59–1.22)

0.92 (0.77–1.10)

Indicative codes (1999–2010)


Neglect

11

0.26 (0.05–0.48)

1.01 (0.73–1.39)

Physical abuse

188

4.5 (3.5–5.4)

1.06 (0.98–1.14)

Sexual abuse

27

0.6 (0.4–0.9)

0.98 (0.81–1.21)

Other*

25

0.6 (0.3–0.9)

0.83 (0.66–1.06)

All admissions

217

5.2 (4.4–6.0)

1.04 (0.96–1.11)


IRR = incidence rate ratio. * Emotional abuse has been included within “other”.

2 Trends in hospital admission rates for children with a diagnosis indicative of physical abuse, 1999–2010


No. of admissions

Average annual rate per 10 000 (95% CI)

Rate ratio (Aboriginal v non-Aboriginal)

Annual change in rate, IRR (95% CI)


Aboriginal children


Boys


0–12 years

104

8.8 (6.7–10.8)

4.1

1.01 (0.96–1.07)

13–17 years

237

58.2 (49.4–67.1)

3.1

1.04 (1.01–1.06)

Girls


0–12 years

81

7.2 (5.9–8.5)

8.9

0.99 (0.94–1.06)

13–17 years

325

82.8 (69.2–96.3)

13.5

1.07 (1.05–1.09)

Non-Aboriginal children


Boys


0–12 years

34

2.1 (1.1–3.1)


1.11 (0.99–1.25)

13–17 years

110

19.0 (14.8–23.2)


1.05 (1.01–1.09)

Girls


0–12 years

12

0.8 (0.4–1.3)


1.06 (0.88–1.28)

13–17 years

32

6.1 (4.5–7.8)


1.01 (0.94–1.08)


IRR = incidence rate ratio.

3 Perpetrator categories for all maltreatment, 2003–2010


Recorded perpetrator by category


Spouse/partner

Family member

Other

Unspecified

Total


Aboriginal children


0–12 years

6 (2.2%)

192 (70.3%)

18 (6.6%)

57 (20.9%)

273

13–17 years

77 (17.9%)

80 (18.6%)

56 (13.1%)

216 (50.3%)

429

All children

83 (11.8%)

272 (38.7%)

74 (10.5%)

273 (38.9%)

702

Non-Aboriginal children


0–12 years

0 (0)

24 (55.8%)

5 (11.6%)

14 (32.6%)

43

13–17 years

1 (1.0%)

12 (11.7%)

25 (24.3%)

65 (63.1%)

103

All children

1 (0.7%)

36 (24.7%)

30 (20.5%)

79 (54.1%)

146

Children’s protective eyewear: the challenges and the way forward

Children’s eye injuries prompt calls for increased adoption of eye protection for children at risk

Ocular injuries are common in childhood, and their aetiology and epidemiology are well documented.1,2 Internationally, 20%–59% of all ocular trauma occurs in children (male to female ratio, 3.6 : 1), with 12%–14% of cases resulting in severe monocular visual impairment or blindness.2,3 In 2009, the Australian Institute of Health and Welfare identified that people aged < 19 years represented 15.6% of eye-related emergency department presentations between 1999 and 2006.4 Most eye injuries in children occur at home (76%), with the remainder occurring during sport and other recreational activity.2,3,5 In a recent New South Wales study, open globe injuries accounted for 40% of ocular trauma in children; of these, 48% occurred at home and involved common household objects.6 In 2000, 2.4 million eye injuries in the United States were related to sporting activity; 43% in children aged < 15 years and 8% in children aged < 5 years.7 Retrospective studies in Australia have shown that eye injuries from sporting activities accounted for 10% of severe ocular trauma in children, with permanent visual damage occurring in 27% of these cases.1 However, there is a lack of detailed information regarding the nature and incidence of children’s sporting eye injuries.

Due to their developing physical coordination, limited ability to detect risks inherent in the environment and vulnerable facial morphology, children are at higher risk of ocular trauma compared with adults of working age.5 Moreover, given that a child’s visual development continues from birth until 7–8 years of age, visual outcomes following trauma in children are worse than adults, affecting their subsequent career and social opportunities as adults.2 By adopting simple protective measures, such as using eye protectors when necessary, 90% of ocular injury is preventable.8

Outcomes of intervention in eye protection

A decline in paediatric ocular injuries in some sports, including lacrosse, field hockey, ice hockey and hurling, has been attributed to the adoption of mandatory protective eyewear in Canada, the US and Ireland. In the US, children’s eye injuries in lacrosse dropped by 84% following the introduction of mandatory eye protection in 2010.9 Key to effective implementation of eye-protection programs has been the development of product standards and policy statements by supporting organisations such as the American Academy of Ophthalmologyand American Academy of Pediatrics.5,7,9 In Australia, Squash Australia has set down strict guidelines for use of eye protectors in children (regulation 42, http://www.squash.org.au/sqaus/regulations_policies/regulations.htm [accessed Mar 2014]), but no studies have been conducted to review the effectiveness of this intervention.

Hurdles to effective use of protective eyewear in children

Significant research has been undertaken on the aetiology and management of eye injuries in children worldwide.3,5,7 However, there is less emphasis on research, public policy development and promotion of protective eyewear to reduce the incidence of eye trauma and vision loss. Occupational adult eye injuries have been found to decrease significantly with the use of eye protection.10 Little information is available in the scientific and grey (public domain) literature regarding protective eyewear in children; information for the general public is similarly limited.

Studies have shown that despite an awareness among adults, caregivers and children (particularly 15–18-year-olds) of the need for children’s eye protection, the rate of use remains low at about 19%.11 Parents and peers are major influences on attitudes to the use of eye protectors, with media not playing an important role. Deterrents to using appropriate eye protection include discomfort, poor visibility, unsuitable material, cosmetic appeal, availability, cost, storage and accessibility, no formal education on eye protection, and the perception that eye protectors are unnecessary.11

Regular (dress optical) spectacles are not an adequate substitute for eye protectors and can pose an additional danger due to the nature of the lens materials and the frame design.12 Because of its superior impact resistance, polycarbonate is the material of choice for prescription eye-protector lenses, but higher cost and the perception of its reduced scratch-resistance inhibit its uptake.13

Strategies to reduce ocular trauma in children

To address the large gaps in research and public policy regarding children’s eye protection, a multilevel approach is required to influence change in risk-reduction behaviour. Development, promotion and use of eye protection for children can be achieved through education and standards and policies.

Any approach to reduce the incidence of eye injuries should attempt to remove or limit hazards. Keeping potentially hazardous chemicals such as dishwashing liquid, toilet cleaners, paint, superglue and sprays out of young children’s reach, and purchasing toys that are appropriate for age and do not have sharp or projecting edges, can help protect children’s eyes.5 While it is impractical to suggest that a child wear eye protectors all the time, as most eye injuries in children occur at home, children’s activity should be supervised by a responsible adult, particularly when the child is exposed to potentially hazardous household items such as scissors, knives and other sharp objects.

Children, parents and caregivers, teachers, coaches and sports venue operators need to be reminded of the risks involved with particular sporting activities and the type of eye protectors that are available. Children who are at higher risk of eye injury — such as those who have experienced ocular surgery, trauma or disease, and functionally one-eyed individuals — should be encouraged to wear eye protection for all medium to high-risk activities and avoid sports or activities where no adequate eye protection is available.7 Health campaigns are essential to promote eye protection, using mass media to highlight the problems of eye damage in terms of blindness and its long-term impact. The support of professional organisations, local and national eminent people, eye-protection manufacturers and policymakers is important. Doctors and health professionals also play a key role in increasing public awareness and developing positive attitudes towards eye protection.

Standards in Australia currently focus on occupational more than domestic and sports eye protection. Internationally, there is a lack of standards and policies specifically for children’s eye protection. Of 43 spectacle and eye-protection standards for occupational and recreational requirements in the UK, US, Canada, Europe and Australia, only 21 allow for the specific needs of children. Most of the limited number of policies developed to prevent children’s eye injuries have focused on sports eye-protection requirements. It is imperative that policies and standards reinforce the needs of children who are functionally one-eyed and those at higher risk of ocular trauma to ensure that their vision is adequately protected.

Development of more advanced materials like polyurethane for occupational and sports eye protection has allowed for improved comfort and fit for adults. Children’s eye protection is yet to benefit from many of these advances. The optimal eye protector allows clear, distortion-free vision with a lens that does not fog, in a frame that is stylish and comfortable with adequate coverage and impact resistance. This highlights the need for spectacle designers to develop eye-protection solutions for children that meet standards requirements as well as addressing other issues to maximise compliance and use.

The way forward

To enable adequate measurement of the impact of interventions, the lack of detailed eye-injury data in Australia will need to be addressed. Long-term follow-up studies are required to improve our understanding of the nature and incidence of children’s eye injuries. Critical to the sustainability of any injury-prevention program is the ability to measure behaviour change following an intervention, to improve and develop more effective programs. Health education regarding eye protection should not stop with awareness campaigns but must be an ongoing process — awareness is highest soon after a campaign, after which it diminishes.

An improved understanding of the reasons for non-compliance with existing eye-protection recommendations will enable increased success of eye-protection programs. Importantly, we need an understanding of the current knowledge, influences and societal practices regarding ocular injuries, as well as the perception of risk, adequacy and subsequent use of eye protectors before and after an intervention.

Gaps in the current standards for children’s eye protection provide an important opportunity for a change in policies, recommendations and legislation, as well as for gaining support from relevant individuals and bodies. We have identified the need for specific standards to protect functionally one-eyed children and those at higher risk of eye injury; to determine when dress optical spectacles should be replaced with prescription eye protectors; and to identify which sports and recreational activities pose a medium to high risk of eye injury and require that participants use eye protection.

Child health – how is Australia doing and what more do we need to do for our kids?

Focusing on the health and wellbeing of our children is the most important investment Australia can make

Australia is similar to other wealthy Western democracies for many aspects of child and youth health and wellbeing but, despite our material wealth, Australian rates of vaccination, obesity, child abuse and neglect do not compare well, and youth unemployment and the gap between rich and poor are increasing.1,2 Canadian researchers suggest that an unwanted outcome of economies focusing heavily on wealth creation is an impoverishment of the health and wellbeing of children, which will affect adult health and the human capability of nations — so-called modernity’s paradox.3

Problems including developmental delays, substance misuse, child maltreatment and obesity and overweight are occurring at such high rates that they are already putting pressure on our health and welfare services. Most of these problems do not have effective treatments, hence they demand an urgent preventive approach. With a third of Australian children now overweight or obese, baby boomers may be the last generation to live longer than their parents, given the disease complications that will result.4

Further, mental health problems including substance misuse and autism appear to be increasing, or at least increasingly diagnosed.5 The impact on children of increasing mental health problems and substance misuse in their parents is hard to quantify and likely to be enormous.6 In a healthy country like Australia, it is unacceptable that many child health problems are much more prevalent in Aboriginal populations.

Can we replicate the successes of population interventions such as folate supplementation for preventing neural tube defects7,8 and supine sleeping for preventing sudden infant death syndrome?9 Surely some measures, such as improved vaccination coverage and prevention of prenatal alcohol exposure, are achievable. Most interventions will require collaborative action on multiple fronts outside health and with increased attention to social, economic and health inequalities. No issue is more urgent than climate change, which will have a disproportionately greater effect on child health.10 Let’s hope the dithering, delaying, denying and disparaging of the scientific evidence does not mean it is too late.

Australia really is a lucky country, but if we want future prosperity, then focusing on the health and wellbeing of our children is one of the most important investments we can make.

Temporal trends in weight and current weight-related behaviour of Australian Aboriginal school-aged children

The health status of Australian Aboriginal and Torres Strait Islander (hereafter Aboriginal) children is comparatively poorer than for non-Aboriginal Australian children.1 Such health inequalities may be confounded by social disadvantage. However, Aboriginal adults report higher rates of lifestyle behavioural risk factors associated with chronic diseases including obesity, cardiovascular disease and type 2 diabetes.1 Given the gap in health status experienced by Aboriginal people, there is a need to focus preventive efforts in childhood, adolescence and early adulthood to minimise risks of chronic diseases later in life.2,3 Accordingly, obtaining representative population data on Aboriginal children’s lifestyle behaviour is a priority to understand how best to attenuate chronic disease risk during childhood.

Some evidence suggests that there are no significant differences between school-aged Aboriginal and non-Aboriginal children in the prevalence of overweight and obesity.4,5 However, other studies among preschool-aged children show significantly higher rates of overweight and obesity in Aboriginal compared with non-Aboriginal children,6,7 suggesting that the new cohort of Aboriginal children entering school may be at higher risk than the current cohort of school-aged children. Evidence of the distribution of weight-related behaviour among Aboriginal children, generated from large representative samples, will help identify priority areas for culturally relevant and appropriate programs.

Our aims were to report temporal trends in weight status of children aged 5–16 years, by Aboriginality, using representative population health monitoring survey data collected in 1997, 2004 and 2010; and to use the 2010 data to examine differences between Aboriginal and non-Aboriginal children’s weight and weight-related behaviour.

Methods

This study involved secondary analysis of the New South Wales Schools Physical Activity and Nutrition Survey (SPANS), a representative cross-sectional population surveillance survey of children’s weight and weight-related behaviour conducted in 1997 (n = 5518), 2004 (n = 5407) and 2010 (n = 8058). For each survey, schools in NSW were selected at random so that the number of schools selected in each education sector (government, Catholic and independent) was proportional to the number of students enrolled in that sector. The likelihood of a school being selected was proportional to the size of student enrolment. In each school, one class was chosen at random from each of the grades being surveyed. Detailed descriptions of each survey’s methodology have been published elsewhere.8 Briefly, data were collected in Term 1 (February–April) by teams of trained field staff using standardised protocols for survey consistency. As questions on weight-related behaviour have changed across surveys, only findings from 2010 data are presented here for that analysis.

Informed consent from each child’s parent or carer was a requirement for participation. Ethics approval for the study was granted by the University of Sydney Human Research Ethics Committee, the NSW Department of Education and Training and the NSW Catholic Education Commission. The Aboriginal Health and Medical Research Council Ethics Committee approved this publication.

Measures

On each survey, demographic details included the child’s sex, date of birth, postcode of residence and Aboriginality. Postcode of residence was used as a proxy for socioeconomic status (SES), based on the Australian Bureau of Statistics Index of Relative Socio-Economic Disadvantage, and was used to rank children in tertiles of SES.9 Aboriginality was determined by asking “Are you of Aboriginal and/or Torres Strait Islander origin?” (responses: Yes, No, Don’t know). Anthropometry was measured and included height (m), weight (kg) and waist circumference (cm). Body mass index (BMI; kg/m2) was calculated, and each student’s BMI status was categorised as overweight/obese or not overweight/obese using the International Obesity Task Force age–sex-adjusted cut-points.10 Waist-to-height ratio (WtHr), an index of cardiometabolic disease risk, was calculated and categorised as < 0.5 or ≥ 0.5.11

Weight-related behaviour

In 2010, parents of Grade K, 2 and 4 children were sent a questionnaire to complete about their child’s weight-related behaviour, and Grade 6, 8 and 10 children self-completed the same questionnaire at school.

Indicators of dietary quality and habits came from the validated NSW Child Health Survey, which was developed for population-based monitoring,12,13 and included frequency of consumption of energy-dense, nutrient-poor (EDNP) foods, specifically fried potato products, salty snack products, other snack products, ice-cream or iceblocks, and fast food. The response categories were: never/rarely, 1–2 times/week, 3–4 times/week, 5–6 times/week, daily, and two or more times/day. As reporting on the frequency of eating individual EDNP foods may obscure the true extent of overall EDNP food consumption among children, a combined summary score was generated from the consumption frequency of each item. The cut-point for high EDNP food consumption was based on the distribution of the data, which showed that more than 50% of children consumed one or more items three or more times a week. Soft drinks (including cordial and sports drinks) and fruit juice were also assessed (same response categories) and were examined separately as single variables. Additional diet-related questions included frequency of eating breakfast, frequency of eating dinner in front of the television, and how often good behaviour was rewarded with sweets.

Questions on children’s physical activity came from the NSW Population Child Health Survey (for Grades K/2/4)14 and the Adolescent Physical Activity Recall Questionnaire (for Grades 6/8/10).15 Responses were used to determine whether children met the physical activity recommendation of ≥ 60 min/day.16 Cardiorespiratory endurance (ie, fitness) was assessed among children in Grades 4, 6, 8 and 10, using the 20-metre shuttle run test,17 and children were categorised as “adequately fit” or “unfit” according to published age–sex-adjusted reference cut-points.18 Information on recreational screen time (ST) (ie, watching television or DVDs, using a computer for fun, playing electronic games) was assessed using the Adolescent Sedentary Activity Questionnaire19 and used to determine whether children met the ST recommendation of < 2 h/day.16 Respondents also reported if there was a television in the child’s bedroom and whether there were rules about ST.

Statistical analysis

Data were analysed in April 2013 using SPSS Complex Samples, version 21 for Windows (IBM), to account for the cluster design of the study and adjust for the standard errors and 95% confidence intervals. Statistical significance was accepted at P < 0.05. For the analyses, students were stratified by Aboriginal status as Aboriginal or non-Aboriginal (which included a few who answered “Don’t know”). Within SPSS Complex Samples, χ2 tests and tests of independence were used to assess the differences in children’s sociodemographic characteristics according to Aboriginality. Logistic regression was used to assess the differences in the proportion of children who were overweight/obese and had WtHr ≥ 0.5 across surveys (1997, 2004 and 2010), stratified by Aboriginality and sex, controlling for SES and grade.

Differences in weight-related behaviour reported in the 2010 survey between Aboriginal and non-Aboriginal children were assessed using logistic regression, controlling for sex, grade and SES.

Results

Survey response rates for 1997, 2004 and 2010 were 87%, 65% and 57%, respectively. Students were aged 5–16 years. The characteristics of the sample by Aboriginality and survey year are given in the Appendix. About 2%–3% of the sample in each survey year identified as Aboriginal and were more likely to live in rural and low-SES areas than their non-Aboriginal peers.

Overall, between 1997 and 2010, the relative increase in the prevalence of overweight/obesity and WtHr ≥ 0.5 was 22.4% and 113.6%, respectively, among Aboriginal children, and 11.8% and 3.4%, respectively, among non-Aboriginal children. Trends in the prevalence of overweight/obesity and WtHr ≥ 0.5 differed according to Aboriginality and sex, after controlling for SES and grade (Box 1). The increase in prevalence of overweight/obesity over time was only statistically significant among non-Aboriginal boys (P = 0.003). There was a non-significant increase in the prevalence of overweight/obesity in Aboriginal boys (P = 0.56) and girls (P = 0.55). The prevalence of WtHr ≥ 0.5 increased overall, but this was only significant for non-Aboriginal children.

Among Aboriginal children, the average annual increase in overweight/obesity between 1997 and 2004 was 0.21 percentage points, and between 2004 and 2010 was 0.63 percentage points. For WtHr ≥ 0.5, the average annual increases were 0.60 and 0.97 percentage points, respectively. For non-Aboriginal children, overweight/obesity increased 0.44 percentage points annually between 1997 and 2004, but decreased 0.12 percentage points annually between 2004 and 2010. Conversely, WtHr ≥ 0.5 decreased 0.76 percentage points annually between 1997 and 2004 and increased 0.95 percentage points annually between 2004 and 2010.

In the 2010 survey, there were 254 Aboriginal children (109 in Grades K/2/4; 145 in Grades 6/8/10) and 7417 non-Aboriginal children (3568 in Grades K/2/4; 3849 in Grades 6/8/10). Box 2 shows the prevalence and unadjusted and adjusted odds ratios (AORs) of weight and weight-related behaviour, by Aboriginality, after controlling for sex, grade and SES. Aboriginal children had 1.52 (95% CI, 1.03–2.24) greater odds of having a WtHr ≥ 0.5 than non-Aboriginal children. Compared with non-Aboriginal children, Aboriginal children had significantly lower odds of eating breakfast daily (AOR, 0.72; 95% CI, 0.52–0.99) and significantly greater odds of drinking ≥ 1 cup of soft drink daily (AOR, 1.61; 95% CI, 1.13–2.29), having a television in their bedroom (AOR, 2.75; 95% CI, 2.04–3.70), having no ST rules (AOR, 1.34; 95% CI, 1.04–1.73) and exceeding ST recommendations on weekdays (AOR, 1.78; 95% CI, 1.32–2.39). There were no significant differences between Aboriginal and non-Aboriginal children’s physical activity measures, including daily activity, adequate fitness and competency in fundamental movement skills.

Discussion

This is the first large, representative study to report on temporal trends in overweight/obesity and WtHr ≥ 0.5 (an index of cardiometabolic disease risk) among Aboriginal children in NSW. While the increases in prevalence were statistically significant only for non-Aboriginal children, a clear increase in both weight measures across time was also observed in Aboriginal children, and the lack of statistical significance needs to be considered in the context of the small sample of Aboriginal children.

The strengths of our study include the large representative sample of school-aged children and, for weight status, comparability across survey years. Aboriginal children comprised 2%–3% of each survey sample, which approximates the population prevalence of about 5% of 5–15-year-olds in NSW.20 However, the small sample size of Aboriginal children was a limitation, which potentially underpowered our analyses and prevented stratifying the data by individual BMI categories and by sex. Additionally, while the questionnaires were validated, a further limitation was the use of self-report to characterise children’s weight-related behaviour.

Despite these limitations, our finding that almost one in three NSW Aboriginal children (29.0%) aged 5–16 years in 2010 was overweight/obese is comparable to the prevalence for Aboriginal children of a similar age in a national study conducted in 2006.21 Nearly one in five (18.8%) had WtHr ≥ 0.5 which, compared with non-Aboriginal children, equated to 52% higher odds of central adiposity, which is associated with cardiometabolic ill health. In Aboriginal children, waist circumference has been strongly associated with the metabolic syndrome,22 but the WtHr is considered a potentially superior indicator of cardiovascular risk clustering in young people23 and may be a more appropriate index of adiposity in Aboriginal children. However, the body habitus of Aboriginal children, where the limb-to-trunk ratio differs from non-Aboriginal children,24 may influence the 0.5 cut-point. Further research is required to ascertain the sensitivity of this cut-point in Aboriginal children. Given there is strong evidence that childhood obesity leads to adult obesity and related comorbidities,25 and behaviour including sedentariness and physical activity track into adulthood,26,27 child obesity prevention programs must be prioritised.

Overall, there were no differences between Aboriginal and non-Aboriginal children in physical activity measures, with less than half of all Grade K/2/4 children and two-thirds of Grade 6/8/10 children meeting daily physical activity recommendations. Few children were competent in fundamental movement skills and a third were deemed unfit. Parental modelling and support are important influences, but schools are a key setting for promoting children’s physical activity through the health and physical education (HPE) and school sport programs. While NSW primary schools have programs that promote healthy eating and physical activity (eg, Live Life Well @ School), a significant policy gap in Australia is the lack of specialised teachers to deliver HPE in primary schools, disadvantaging all children.

We found some similarities in children’s dietary patterns independent of Aboriginality, including the overconsumption of EDNP food, parental rewarding of good behaviour with sweets, and low vegetable intake. Interestingly, the dietary differences according to Aboriginality in our study are congruent with those from a study based on 24-hour recalls of food intake.28 Around a quarter of children in our study reported not eating breakfast daily, but this was more prevalent among Aboriginal children, who were also more likely to drink soft drink every day than their non-Aboriginal peers. The adjusted model showed that SES and rurality were confounders of daily breakfast and soft drink consumption, and our sample showed that the Aboriginal children were significantly more likely to be from rural and lower SES areas. Although breakfast programs are run in some NSW schools, our findings indicate that many children are not eating breakfast daily, which suggests these programs may not have the necessary reach into disadvantaged groups, including Aboriginal communities.

Soft drinks are associated with a range of morbidities including obesity, diabetes and dental caries.29 Both the school and home environments provide key opportunities for children to access soft drinks.30 A public education campaign would need to target these two environments, aimed at increasing parental awareness of the need to reduce soft drink availability in the home and to encourage schools to implement mandatory policies banning the sale of sugar-sweetened beverages.31 Reintroducing campaigns promoting water as the drink of first choice would also be of benefit, as these have been shown to be effective at increasing awareness of water-related nutrition and reducing consumption of soft drinks among children.32 Ensuring culturally appropriate school programs, such as Thumbs Up! (run under the auspices of the Jimmy Little Foundation), is one strategy to encourage young Aboriginal Australians to make better and healthier food choices.

The main difference in weight-related behaviour according to Aboriginality that we found was in ST. Over half of Aboriginal children had a television in their bedroom, a third had no ST rules, and almost two-thirds exceeded the daily ST recommendation on weekdays. While televisions are ubiquitous in most homes, research shows that high ST and televisions in the bedroom are associated with a range of adverse health outcomes including poor diet quality, lower prevalence of regular family meals, sleep disturbances and overweight and obesity.33 General community awareness of the negative aspects of ST is low,34 and given the higher weekday ST among Aboriginal children, alternative active after-school entertainment options, such as the Active After-School Communities Program, may hold promise in Aboriginal communities. However, such programs must be culturally relevant and engaging.

1 Temporal trends across 1997, 2004 and 2010 surveys in the prevalence of overweight/obesity and waist-to-height ratio ≥ 0.5 in New South Wales children aged 5–16 years, by Aboriginality*


Aboriginal


Non-Aboriginal


1997

2004

2010

P for trend

1997

2004

2010

P for trend


Boys (n)

74

61

112


2857

2697

3971


Overweight/obese

20.3%

26.2%

25.9%

0.56

19.8%

24.21%

22.8%

0.003

Waist-to-height ratio ≥ 0.5

8.3%

13.1%

16.1%

0.52

13.2%

7.9%

12.5%

< 0.001

Girls (n)

65

62

133


2480

2575

3636


Overweight/obese

27.7%

24.2%

31.6%

0.55

20.8%

22.6%

22.6%

0.37

Waist-to-height ratio ≥ 0.5

9.3%

12.9%

21.1%

0.13

9.8%

4.7%

11.7%

< 0.001

All (n)

139

123

245


5337

5272

7607


Overweight/obese

23.7%

25.2%

29.0%

0.52

20.3%

23.4%

22.7%

0.004

Waist-to-height ratio ≥ 0.5

8.8%

13.0%

18.8%

0.06

11.6%

6.3%

12.0%

< 0.001


* Adjusted for socioeconomic status and grade.

2 Weight and weight-related behaviour among New South Wales children aged 5–16 years in 2010 survey, by Aboriginality


Aboriginal (n = 254*)

Non-Aboriginal (n = 7417)

Odds ratio (95% CI)

Adjusted odds ratio
(95% CI)‡§


Weight status


Overweight/obese

29.0%

22.7%

1.39 (1.01–1.92)

1.28 (0.92–1.78)

Waist-to-height ratio ≥ 0.5

18.8%

12.0%

1.69 (1.14–2.50)

1.52 (1.03–2.24)

Dietary habits and behaviour


Meets daily fruit consumption recommendation

72.4%

76.5%

0.81 (0.55–1.18)

0.80 (0.58–1.12)

Meets daily vegetable consumption recommendation

38.5%

35.4%

1.14 (0.89–1.49)

1.24 (0.95–1.62)

Eats breakfast every day

70.0%

78.6%

0.64 (0.47–0.86)

0.72 (0.52–0.99)

Drinks ≥ 1 cup/day of soft drink

19.8%

12.5%

1.72 (1.20–2.46)

1.61 (1.13–2.29)

Drinks ≥ 1 cup/day of fruit juice

28.9%

27.9%

1.05 (0.73–1.51)

1.03 (0.72–1.46)

Consumes EDNP foods ≥ 3 times/week

78.7%

76.7%

1.12 (0.81–1.56)

1.12 (0.80–1.55)

Eats dinner in front of television ≥ 3 times/week

41.5%

34.2%

1.37 (1.03–1.82)

1.29 (0.97–1.72)

Parents usually/sometimes reward good behaviour with sweets

59.5%

51.1%

1.40 (1.07–1.84)

1.30 (0.99–1.71)

Screen time (ST)


Has a television in bedroom

55.6%

29.1%

3.04 (2.25–4.11)

2.75 (2.04–3.70)

No rules on television and electronic games

27.9%

21.1%

1.45 (1.06–1.97)

1.34 (1.04–1.73)

Exceeds daily ST recommendation on weekdays

62.8%

47.0%

1.90 (1.43–2.53)

1.78 (1.32–2.39)

Exceeds daily ST recommendation on weekends

81.0%

82.2%

0.92 (0.61–1.38)

0.93 (0.61–1.41)

Physical activity


Grade K/2/4 met daily physical activity recommendation

45.0%

46.6%

0.94 (0.58–1.52)

1.03 (0.61–1.73)

Grade 6/8/10 met daily physical activity recommendation

61.4%

62.0%

0.98 (0.71–1.34)

1.09 (0.78–1.52)

Competency in locomotor FMS (≥ 3/4 skills)

7.1%

8.9%

0.78 (0.49–1.26)

0.83 (0.50–1.38)

Competency in object control FMS (≥ 2/3 skills)

19.3%

19.3%

1.00 (0.68–1.47)

1.16 (0.72–1.87)

Adequately fit**

65.5%

68.1%

0.89 (0.60–1.32)

1.09 (0.72–1.63)


EDNP = energy-dense, nutrient-poor. FMS = fundamental movement skills. * Number of Aboriginal children in Grades K/2/4 = 37, 30, 42 respectively, and in Grades 6/8/10 = 48, 59, 38, respectively. † Number of non-Aboriginal children in Grades K/2/4 = 1072, 1191, 1305, respectively, and in Grades 6/8/10 = 1107, 1473, 1269, respectively. ‡ For Aboriginal children compared with non-Aboriginal children. Bold indicates significant values. § Adjusted for sex, grade and socioeconomic status. ¶ Also includes cordial and sports drinks. ** Fitness measured among students in Grades 4, 6, 8 and 10.