×

Let children cry

In reply: Doctors have a duty to relieve suffering, but with qualifications: the target is overall, not immediate, suffering; and the primary injunction is to do no harm.

McGorry and colleagues would presumably agree that interfering with healthy mourning does more harm than good, even if it lessens immediate suffering. Where we disagree is that I have faith in families’ own resources to deal with a broader range of distress, while McGorry and colleagues claim there are benefits from pre-emptively attracting distressed individuals into the mental health system. Evidence needs to be provided to support the idea that medical intervention does more good than harm for less than severe impairment. Too often, selective or exaggerated evidence is offered.1

While it is true that the majority of headspace clients at one site received interventions other than psychotropic medication,2 nevertheless, 20% (168/858) of those who fell short of threshold diagnosis were medicated. De-identified headspace data should be made accessible to allow independent research groups to analyse headspace‘s impact on disability and functioning.

The health of “emerging adults” in Australia: freedom, risk and rites of passage

To the Editor: I wish to thank Kang for her editorial on the health of “emerging adults”, articulating experience familiar to those who care for young people.1 The overview should be read in conjunction with Kang’s contributions as a senior co-editor of Youth health and adolescent medicine, which I reviewed in the Journal last year.2

The student health services developed in our universities during the past 50 years resemble facilities elsewhere; more than first-aid posts, they teach us to respect and cherish young people who seek help and spur us to find the best ways to work with them. Encounters with students may begin with consultations about everyday problems, but well managed sore throats and sprained ankles can be door openers for more serious questions.

An accepting environment encourages the exploration of personal concerns, many of them related to what Kang recognises as “The widening gap between biological and psychosocial maturation”. Student health workers become aware that young people often need simply to talk to accepting older people, which an appropriate attitude can facilitate.

Kang’s editorial waves a flag for the uniqueness of young people and challenges us to address a critical transitional period with thoughtful research and imagination.

Identified health concerns and changes in management resulting from the Healthy Kids Check in two Queensland practices

To the Editor: Thomas and colleagues, in their article on identification rates for health and developmental problems of preschoolers before and after Healthy Kids Check (HKC) services,1 make a valuable contribution to the literature on the outcomes of health assessments.

Their research showed that HKCs were more likely than routine general practitioner visits (in the first 4 years of life) to detect oral health, vision and behavioural problems (prevalence rates among 557 children of 1.8% v 0, 3.8% v 1.4% and 2.3% v 1.8%, respectively), suggesting that HKCs presented an opportunity for families to deal with previously unmet health needs. However, the numbers of height and weight problems and oral health problems reported in this study were surprisingly small. National prevalence rates of more than 20% for childhood overweight2 and 40% for untreated dental caries3 were not matched in this study, where the rates for height and weight problems and oral health problems were only 3.2% and 1.8%, respectively.

It is possible that the communities involved experienced exceptional health status (the socioeconomic status of clinic populations was not described) or that only healthy children attended HKCs — or it is perhaps more likely that these problems remained undetected. Such discrepancies in the rates are significant because HKCs were established, in part, to detect early lifestyle risk factors; an aim that cannot be realised if there is incomplete recording of these developmental indicators.

The findings of Thomas and colleagues suggest that HKCs are partially improving the early detection of lifestyle risk factors. However, a more comprehensive evaluation of HKC outcomes — incorporating the views of clinicians and parents with long-term follow-up of children across various health settings — is needed to determine the true impact.

Identified health concerns and changes in management resulting from the Healthy Kids Check in two Queensland practices

In reply: We thank Alexander and colleagues for their interest in our article. They query the low rate of detection of oral health problems and overweight and obesity. We are surprised that they question our failure to detect oral health problems, given that their analysis found this screening to be ineffective.1 Perhaps the general practitioners in our study did not embark on ineffective screening.

Our data show that the overall detection was 5% for problems related to height and weight. This might correspond to the 6%–7% of children aged 5–9 years with obesity2 (for whom action may be effective), rather than to the additional 15% with overweight.

More importantly, by viewing the prevalence of health problems in children as a general practitioner compliance and measurement concern, we lose sight of the bigger picture. Does the Healthy Kids Check detect problems that lead to better child outcomes? We do not know. This is a health policy that has been implemented without adherence to evidence-based practice principles. We agree — long-term follow-up is essential.

Mapping the diagnosis of autism spectrum disorders in children aged under 7 years in Australia, 2010–2012

The early diagnosis of children with autism spectrum disorder (ASD) is a critical step in gaining access to early intervention, providing optimal opportunity for developmental benefits by taking advantage of early brain plasticity.1 The age at which intervention begins has been associated with improved outcomes, with younger children showing greater gains from intensive early intervention.2,3 Although research suggests ASD can be reliably diagnosed by the age of 24 months,4,5 a recent review found that, on average, diagnosis is delayed until 3 years, with the average age at diagnosis ranging from 38 to 120 months across 42 studies conducted across the United States, United Kingdom, Europe, Canada, India, Taiwan and Australia.6

Many factors have been found to influence the age at which ASD is diagnosed, including the characteristics of the child, the clinical presentation, sociodemographic characteristics, and parental concerns and behaviour.6 These factors may interact with characteristics of the local community, the health professional and health service to differentially influence the age at which children are identified and diagnosed with ASD in any local area.6

There are limited data on the age and frequency of ASD diagnoses across all states and territories in Australia which, given the ethnically diverse and geographically dispersed population, would provide an important national and international comparison.

In this study, we sought to establish the age at which children registered with the Helping Children with Autism Package (HCWAP) in Australia currently receive a diagnosis. We also investigated trends in diagnosis across states, regional and rural areas, and child characteristics. Diagnostic groups within the autism spectrum, as specified in the fourth edition of the Diagnostic and statistical manual of mental disorders (DSM-IV),7 as well as the combined ASD group (consistent with fifth edition of the DSM8) were examined, to facilitate comparisons over time.

Methods

Study population and measures

We used de-identified data on 15 074 children (12 183 boys [81%] and 2891 girls [19%]) who received support through the HCWAP between 1 July 2010 and 30 June 2012. Data were collected and managed by the former Australian Government Department of Families, Housing, Community Services and Indigenous Affairs (FaHCSIA; now the Department of Social Services). To be eligible for the HCWAP, children must be Australian residents, aged under 7 years and have a documented diagnosis of ASD consistent with DSM-IV criteria from a paediatrician or psychiatrist, or after a multidisciplinary team assessment (involving a psychologist and speech pathologist).

The database contained the following information: age at diagnosis (months), state and postcode of residence, diagnosis, sex, Aboriginal and Torres Strait Islander status and culturally and linguistically diverse (CALD) status. The postcode was used to match age at diagnosis to geographical and population data.

Ethics approval was received from the La Trobe University Faculty of Science, Technology and Engineering Human Ethics Committee.

Age at diagnosis

Children’s age at diagnosis was calculated by subtracting their date of birth from the month and year that their diagnosis was confirmed, and rounded to the closest month.

Accessibility/remoteness index of Australia

The Accessibility/remoteness index of Australia (ARIA), developed by the Australian Bureau of Statistics, is a measure of remoteness, aggregated into the following categories: major cities; inner regional; outer regional; remote; very remote and migratory.

Estimates

The numbers of children at each year of age under 7 years (obtained from Australian Bureau of Statistics estimates) were summed and averaged over the period of 30 June 2010 to 30 June 2012 to create population estimates aligned to the study period and age group.

The estimated incidence of ASD was conservatively calculated as 1% of the population of children aged 0–7 years, based on estimates presented in the research literature from Australia (1/119 or 0.84%,9 1/106 or 0.94%10) the UK (98/10 000 or 0.98%)11 and US (1/68 or 1.47%).12

Statistical analysis

We conducted non-parametric comparisons (Kruskal–Wallis and Mann–Whitney U-Tests) because age at diagnosis for the study population was not normally distributed, and sample size varied across groups. Bonferroni adjustments controlled for multiple comparisons, and a conservative α (P < 0.01) was adopted.

Results

Age at diagnosis

The average age at diagnosis of ASD between 1 July 2010 and 30 June 2012 in children aged under 7 years and registered with the HCWAP was 49 months. As shown in Box 1, children with autistic disorder were diagnosed 7 months earlier than children with pervasive developmental disorder — not otherwise specified (PDD-NOS) and 16 months earlier than children with Asperger’s disorder (AspD) (χ2 = 1614.67; df = 2; P < 0.001; ɳ² = 0.11). Less than 3% of children with ASD were diagnosed by 24 months (Box 2). A clear spike in the frequency distribution of age at diagnosis was evident at 71 months (Box 3), indicating the most frequently reported age at diagnosis of ASD (under 7 years) nationwide in the HCWAP database.

Mapping the average age at diagnosis of ASD in children registered with the HCWAP across Australia showed small but significant differences between states (χ2 = 146.69; df = 7; P < 0.001; ɳ² = 0.01). To reduce the number of post-hoc comparisons, states were grouped into logical clusters by ascending age at diagnosis. There were significant differences in age at diagnosis between these clusters of states, with children registered with the HCWAP in Western Australia and New South Wales diagnosed earlier than in other states (Box 4).

Frequency of autism spectrum disorder diagnoses

On the basis of HCWAP data, 0.74% of children aged under 7 years in Australia (72/10 000) were diagnosed with ASD between 2010 and 2012. Case ascertainment rates were calculated to determine if differences could be attributed to the number of children at an eligible age. Using 95% CIs, state-level differences were evident, with the highest ascertainment rate in Victoria and lowest in the Northern Territory (Box 4). Differences were also evident between states across diagnostic subgroups; using 95% CIs, a smaller proportion of children than expected with AspD were diagnosed in WA, Tasmania and the NT compared with other states (Appendix 1).

Age at diagnosis by remoteness

Significant differences in age at diagnosis were evident between major cities and regional areas (χ2 = 61.64; df = 4; P < 0.001; ɳ² = 0.004; Appendix 2). There was no statistically significant difference in age at diagnosis across major cities, remote and very remote areas, probably because of differences in sample size between these groups. However, ASD was diagnosed, on average, slightly earlier in remote areas, and 5 months later in very remote areas, compared with in major cities, although these differences were not significant.

Age at and frequency of diagnosis by child characteristics

Although girls registered with HCWAP were diagnosed, on average, 1 month earlier (48 months) than boys (49 months), this difference was not significant considering the conservative α adopted (U = 17 177 845; z = − 2.06; P = 0.04; r = 0.02). No difference was evident in the age at diagnosis of children of Aboriginal and Torres Strait Islander origin registered with HCWAP (U = 3 455 468.5; z = − 1.77; P = 0.08; r = 0.02), but children from a CALD background were diagnosed, on average, 5 months earlier (U = 9 444 467.5; z = − 10.36; P < 0.001; r = 0.08). On the basis of 95% CIs, a smaller than expected proportion of children of CALD and Aboriginal and Torres Strait Islander backgrounds with AspD were identified (Appendix 3).

Discussion

The average age at diagnosis of ASD in children aged under 7 years registered with HCWAP is 49 months, with the most frequently reported age being 71 months. Given that research suggests a reliable and accurate diagnosis is possible for many children with ASD at 24 months,4,5 this finding represents a possible average delay of 2 years (and common delays of up to 4 years).

The increase in frequency of ASD diagnoses at 6 years of age may be attributable to children’s ASD being identified when they enter school, aged about 5 years, and the associated delay for diagnostic assessments. The end of the eligibility period for funding through the HCWAP (at age 7) may also contribute to the increase in diagnoses at 6 years of age. Further, there may be a subgroup of children who are diagnosed later because of factors in their clinical presentation, such as comorbid conditions or the presentation being less severe.

Previous research reported an average age at diagnosis of 4 years in WA and 3 years in NSW in 1999 to 2000,13 with a decrease in age at diagnosis from 4 to 3 years in WA between 1983 and 2004.14 In comparison, we found an average age at diagnosis of 3 years and 10 months in WA and 3 years and 11 months in NSW. These differences may reflect differences in study methods; for example, Nassar et al used the year of entering the data registry as a proxy variable for age at diagnosis in 77% of cases, and the difference between studies may therefore be explained by the limited accuracy of this variable.14

The number of children currently diagnosed with ASD and registered with the HCWAP suggests that the incidence of ASD in Australia has increased substantially from previous estimates. In 1999–2000, the incidence of ASD in 0–4-year-olds was reported to be 5.1 per 10 000 in NSW and 8.0 per 10 000 in WA.14 The national prevalence of ASD in 0–5-year-olds was estimated to increase from 16.1 to 22.0 per 10 000 from 2003 to 2005.15 Our study indicates that more than three times this many children are currently diagnosed with ASD and registered with the HCWAP. While reasons for the observed increase in ASD diagnoses remain largely unknown, many possible contributing factors have been suggested, including changes to the diagnostic criteria, improved awareness and diagnostic sensitivity.16

Delays of 3 to 6 months in age at diagnosis were evident between states, which may be clinically meaningful if they translate into equivalent delays in access to early intervention and family support services. Local differences in age at diagnosis have also been reported in the UK,17 US18 and Canada;19 suggesting that characteristics of local health care systems play a role in determining diagnostic timing.

Case ascertainment rates indicate that a larger proportion of children with ASD were identified in Vic and less than half of the expected children with ASD were identified in WA, the ACT and NT. There are many possible reasons for these differences, including the uptake of HCWAP across states, diagnostic substitution, and/or a greater tendency to diagnose ASD after the age of 7 years.

Children were diagnosed earlier in major cities compared with regional Australia. This is consistent with international research and probably the result of reduced access to health services.17,20,21 The possible earlier diagnosis of children in remote areas compared with major cities may reflect longer waiting times for specialist services in highly populated areas.22

This is the first study to investigate trends in the diagnosis of ASD in Indigenous Australians, with results indicating no difference in age at diagnosis. A smaller proportion of children of Aboriginal and Torres Strait Islander origin than expected were diagnosed with AspD before age 7 years, suggesting that children of Aboriginal and Torres Strait Islander origin with a less severe clinical presentation may not currently be identified early.

Children from a CALD background received a diagnosis 5 months earlier than other children. Most studies investigating age at diagnosis in ethnic minority groups have reported either no association21,23 or that children from a minority background are diagnosed later.24,25 A smaller proportion of children from a CALD background were diagnosed with AspD, which may account for the overall earlier age at diagnosis in these children.

A few limitations should be noted. The exclusion of children aged 7 years and over (in accordance with HCWAP eligibility) may have resulted in an underestimation of the age at diagnosis of ASD in Australia. The dataset only included families who registered to receive funding through the HCWAP. Although this is the most complete dataset currently available in Australia, it is possible that some cases were missed as families either chose not to register or were unaware of the HCWAP. Also, we were not able to confirm the reliability of diagnoses.

Despite these limitations, this study provides an important examination of trends in the diagnosis of ASD and suggests there may be a substantial gap between the age at which a reliable and accurate diagnosis is possible and the average age at which ASD is diagnosed in Australia. Future research should examine this gap, and investigate barriers that delay the diagnosis of ASD to ensure that families and communities can benefit from best-practice approaches to early intervention.

1 Average age at diagnosis of autism spectrum disorders across diagnostic groups

Diagnostic group

No. (%) of children

Mean age in months (SD)*

Median age in
months (95% CI)


Autistic disorder

10 263 (68.1%)

46.5 (13.6)

45 (45–46)

Asperger’s disorder

2 164 (14.4%)

59.5 (10.6)

61 (60–62)

Pervasive developmental disorder —
not otherwise specified

2 626 (17.4%)

51.1 (13.5)

52 (51–53)

Autism spectrum disorder (combined group)§

15 074

49.2 (14.0)

49 (49–49)


* Mean age in months (SD) is reported for comparison with other studies. † Significantly different from autistic disorder (P < 0.001). ‡ Significantly different from Asperger’s disorder (P < 0.001). § Children with childhood disintegrative disorder and Rett’s disorder are included in the total sample but are not reported by diagnostic group because of the very low frequency of these disorders.

2 Frequency of diagnoses and proportion of children diagnosed with autism spectrum disorder by age group

Age group

No. of children diagnosed

Percentage (95% CI)


< 24 months

395

2.6% (2.4%–2.9%)

25–36 months

2905

19.3% (18.6%–19.9%)

37–48 months

4052

26.9% (26.2%–27.6%)

49–60 months

3914

26.0% (25.3%–26.7%)

61–72 months

3578

23.7% (23.1%–24.4%)

73–84 months

230

1.5% (1.3%–1.7%)

3 Frequency distribution of age at diagnosis of autism spectrum disorder in children younger than 7 years in Australia


PDD-NOS = pervasive developmental disorder – not otherwise specified.

4 Frequency of and age at autism spectrum disorder diagnoses as a proportion of state population estimates


No. of children diagnosed

Age at diagnosis (months)


Case ascertainment


Cluster*

State

Median (95% CI)

Range

Population (N)

Expected Incidence

Ascertainment (95% CI)


1

Western Australia

930

46 (45–47)

15–81

218 051

2 181

42.6% (40.3%–45.8%)


New South Wales

4 735

47 (46–47)

19–83

656 880

6 569

72.1% (70.0%–74.0%)

2§

Tasmania

335

49 (48–51)

22–83

44 561

446

75.1% (67.0%–83.0%)


Victoria

4 771

50 (49–50)

15–84

489 659

4 897

97.4% (94.3%–99.8%)


South Australia

1 076

50 (48–51)

17–81

136 348

1 363

78.9% (74.3%–83.7%)

3§

Australian Capital Territory

149

51 (47–55)

16–83

33 411

334

44.6% (37.8%–52.2%)


Queensland

2 980

52 (51–52)

16–83

425 968

4 260

70.0% (67.5%–72.5%)


Northern Territory

97

53 (50–58)

25–75

25 811

258

37.6% (30.5%–45.5%)


Total

15 074

49 (49–49)

15–84

2 030 690

20 307

74.2% (72.8%–75.2%)


* WA and NSW were combined for analysis as there was no statistically significant difference in the average age at diagnosis between states (P = 0.36). There were no statistically significant differences between Tas, Vic and SA (P = 0.94), or between ACT, QLD and NT (P = 0.84), with these states also grouped for analysis. † State population estimates of children aged under 7 years. ‡ Expected incidence is calculated as 1% of the population (N). § Significantly different from cluster 1 (P < 0.001). ¶ Significantly different from cluster 2 (P < 0.001).

Respiratory tract infections among children younger than 5 years: current management in Australian general practice

Acute respiratory tract infections (RTIs) are managed at more than 6 million general practice visits each year in Australia.1 RTIs such as the common cold (acute upper respiratory tract infection [URTI]), acute bronchitis/bronchiolitis, acute tonsillitis and pneumonia create a severe health and economic burden.1 They are most prevalent among young children, especially when they attend preschools or day care centres. It is estimated that children younger than 5 years have a cold 23% of the time,2 with 70% of the costs attributed to carers’ lost time at work.3

Current guidelines on the treatment and management of RTIs in children include supportive management such as hydration and rest.4 Over-the-counter (OTC) medications such as analgesics and cough medications may reduce the severity of symptoms, but they do not cure or prevent the illness.

As most RTIs are caused by viruses, antibiotics have limited therapeutic value and should only be prescribed if an RTI is suspected to be bacterial in origin. However, overseas studies suggest high rates of antibiotic prescribing for RTIs among young children.5,6 Contributing factors include physicians’ diagnostic uncertainty, parents’ expectation of receiving antibiotics and physicians’ perception of parents’ satisfaction with the visit.7,8

The current management of RTIs among children in Australia, especially in general practice, is unclear. Much of the published data about the management of this cohort originated from the United Kingdom,9 Canada,5 and the United States.10,11 Therefore, we aimed to explore the current management of RTIs in children under the age of 5 years in Australian general practice using data from the Bettering the Evaluation and Care of Health (BEACH) program.

Methods

We analysed BEACH data collected from April 2007 to March 2012 inclusive. BEACH methods are described elsewhere in detail;12 however, in summary, BEACH is a continuous, paper-based, national study of general practitioner activity in Australia. Every year, as part of a rolling random sample of 1000 GPs, each GP provides information on 100 consecutive GP–patient encounters with consenting, unidentified patients. BEACH collects GP characteristics and, for each encounter: patient characteristics, reasons for encounter, number of problems managed and clinical actions initiated.13,14 Clinical actions may include medication, referral, pathology testing, and non-pharmacological treatment (eg, counselling, giving advice, education or minor surgery). The BEACH program is approved by the University of Sydney Human Research Ethics Committee.

BEACH study statistical analyses in SAS 9.3 (SAS Institute) are adjusted for clustering of encounters around each GP. Statistically significant differences are determined by non-overlapping 95% confidence intervals, equivalent to P < 0.006.

For this study, we identified all GP encounters with patients younger than 5 years (60 months) at the date of encounter. We analysed those encounters where at least one of the following four RTIs (by International Classification of Primary Care, second edition [ICPC-2] code) was recorded as problem managed:

  • upper respiratory infection, acute (“URTI”) [R74];
  • bronchitis/bronchiolitis, acute (“bronchitis”) [R78];
  • tonsillitis, acute (“tonsillitis”) [R76]; and
  • pneumonia [R81].

These RTIs were selected on the basis of their frequency and importance in general practice paediatric management.

The management rate of each of these four RTIs per 100 paediatric encounters was compared in terms of: season (summer [December–February] v winter [June–August]); GP sex; and GP age group (≥ 55 years v < 55 years).

We further examined the use and rate (per 100 of each specified RTI) of six management (“clinical action”) options:

  • antibiotic medications;
  • prescribed or supplied non-antibiotic medications;
  • medications advised for OTC purchase;
  • referrals (to specialists and/or allied health professionals);
  • pathology testing; and
  • counselling (including advice/education) at the encounter.

Results

From April 2007 to March 2012, there were 31 295 encounters (involving 4522 GPs) with children younger than 5 years. Of these children, 53.4% were boys, and 31.1% were aged under 1 year. One or more respiratory infections (ICPC-2 codes R71–R83) were managed at 9261 encounters — 29.6% (95% CI, 28.9%–30.3%) of these GP paediatric encounters.

Of these encounters, at least one of URTI, bronchitis or tonsillitis was recorded at 86.0% (results not shown), and at least one of URTI, bronchitis, tonsillitis or pneumonia was recorded at 88.1%. One or more of these four specified RTIs were managed at 8157 encounters, equating to 26.1% (95% CI, 25.4%–26.7%) of all GP paediatric encounters.

Box 1 presents patient demographics of all paediatric encounters and of those involving at least one of these four specified RTIs. For encounters where at least one of the four specified RTIs was recorded, there was a smaller proportion of patients in the < 1 year and a greater proportion in the 1 to < 4 years age groups and fewer patients new to the practice compared with all paediatric encounters. The characteristics of the two groups were otherwise similar.

The management rate (per 100 paediatric encounters) of each of the four specified RTIs (and the combined total) is shown in Box 2. For all four specified RTIs combined, the management rate was higher among older GPs (≥ 55 years) than among younger, higher among male GPs than female, and higher in winter than summer. URTI was the most frequently managed respiratory infection (18.6), followed by bronchitis (4.2), tonsillitis (2.7) and pneumonia (0.6). The problem management rates of URTI, bronchitis and pneumonia were significantly higher in winter than in summer.

The management rate of URTI and bronchitis was significantly higher among male GPs than among female GPs (Box 2). The rate of tonsillitis management was higher among older GPs than younger GPs (Box 2). There was no significant seasonal difference in the rate at which each management option (“clinical action”) was recorded for each of the specified RTI problems (results not shown).

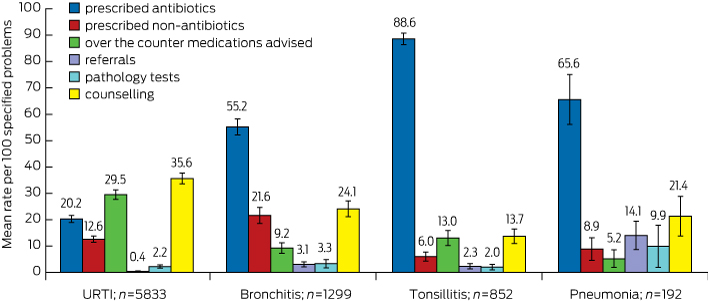
Box 3 illustrates the mean rate of management options recorded per 100 of each of the four specified RTI problems. The antibiotic prescribing rate for the management of tonsillitis (88.6), was statistically significantly higher than that for pneumonia (65.6), bronchitis (55.2) and URTI (20.2). URTI had the highest rate of OTC medications advised (29.5), compared with tonsillitis (13.0), bronchitis (9.2) and pneumonia (5.2). URTI also had the highest rate of counselling/advice/education (35.6), compared with bronchitis (24.1), pneumonia (21.4) and tonsillitis (13.7). The highest rate of prescribing non-antibiotic medications was for bronchitis (21.6). The highest rate of referrals given (14.1) and pathology tests ordered (9.9) were for pneumonia.

The rate of antibiotic prescribing per 100 URTI problems was higher among male GPs (22.5; 95% CI, 20.6–24.3) than female GPs (17.2; 95% CI, 15.3–19.1) and similarly for prescribed non-antibiotic medication per 100 URTI problems (14.0; 95% CI, 12.3–15.7 v 10.7; 95% CI, 9.1–12.3). The rate of pathology tests ordered per 100 tonsillitis problems was significantly higher among female GPs than among male GPs (3.9; 95% CI, 1.6–6.3 v 0.6 95% CI, 0.0–1.3). The rate of counselling/advice/education per 100 bronchitis problems was significantly higher among female GPs than among male GPs (31.2; 95% CI, 25.9–36.5 v 19.1; 95% CI, 15.7–22.5). No other significant differences were found on this GP sex comparison analysis.

The rate of antibiotic prescribing per 100 URTI problems was significantly higher among older GPs (≥ 55 years) than younger GPs (25.4; 95% CI, 22.8–28.0 v 18.0; 95% CI, 16.4–19.5). The rate of counselling/advice/education per 100 URTI problems was significantly higher among younger GPs than older GPs (38.1; 95% CI, 35.5–40.6 v 30.2; 95% CI, 26.4–33.9). The rate of advising OTC medications per 100 tonsillitis problems was significantly higher among younger GPs than among older GPs (16.2; 95% CI, 12.3–20.0 v 8.0; 95% CI, 4.1–12.0). No other significant differences were found on this GP age group comparison analysis.

Discussion

Our study provided insight into the current management of selected respiratory infections in children younger than 5 years by GPs in Australia.

Our study found that URTI was the most common RTI managed by GPs in this age group. This finding is similar to those reported from Australia, Malaysia and the UK.1,15,16 Studies have shown that parental decisions to consult for a young child with the common cold are influenced by the age of the child, type of symptoms, parents’ education level and their perception of the severity of the symptoms.17 Whereas 60% of parents would visit a GP if their child had a cold,11 parents from a lower income group were 1.5 times more likely to seek advice from health services.18

Despite our analyses showing URTI having the lowest antibiotic prescription rate of the four specified RTIs, guidelines suggest this is beyond clinical requirement. Nonetheless, this result compared favourably with overseas studies,6,19,20 where the reported antibiotic prescription rate for URTI was as high as 42%.6 Similarly, those studies reported the antibiotic prescription rate for bronchitis to be as high as 86%.6,19

Several studies have suggested reasons why antibiotics might be prescribed unnecessarily for (non-bacterial) RTIs.7,15,18,19,21 These include diagnostic uncertainty in children,7 possibly poor medical knowledge of respiratory infections,21 physicians’ perception of parental satisfaction,8 and parents’ misconceptions and expectations regarding the treatment of RTIs, especially the perceived benefits of antibiotics.7,10,11,18 Some of these studies have recommended education about RTIs and antibiotics for parents and carers,10,15 and for physicians to aid decision making and optimal management.22

While URTIs had the lowest antibiotic prescription rate of the four RTIs in our study, they have the highest rate of OTC medications advised. Although physicians, researchers and paediatricians agree that common cold treatments and remedies do not reduce illness duration and offer little benefit,23 GPs might still advise OTC medications (rather than prescribe antibiotics) to address some parents’ expectations that medication will cure the common cold.

For each of the four RTIs, we found that the rate of pathology tests ordered was lower than the rate of antibiotic prescribing. Possible reasons for this include the technical difficulty of pathogen identification in RTIs; the invasive nature of throat swabs in young children; the cost; and the likelihood that management would not be altered by the microbiological results, which are often delayed.22,24,25

There were differences in the management of paediatric RTIs by GP age and sex; male GPs prescribed medication (antibiotics and non-antibiotics) for URTI significantly more frequently than female GPs, and were less likely to provide counselling and education for bronchitis than female GPs. Older GPs prescribed antibiotics for URTI more frequently, but were less likely to provide counselling/advice/education for URTI than younger GPs.

In our study, antibiotic prescribing rates for URTI, bronchitis and tonsillitis were higher than recommended by the current Therapeutic guidelines.4 However, our study was limited by a lack of data on patient comorbidities, which could have influenced GPs’ diagnostic and management decisions. Similarly, the practice of “wait and see” before filling antibiotic prescriptions or buying OTC medications was not recorded, leading to possible overreporting of prescribed and OTC medications.

Nevertheless, the rigour of BEACH data has been well established, and this study gives a detailed estimate of the frequency of and management options for specified paediatric RTIs. Our results open several promising avenues for further research into parents’ and health professionals’ attitudes and practices regarding antibiotic prescribing and OTC medications for managing RTIs in young children. Better understanding of these factors will help maintain favourable management practices.

1 Demographics of general practice patients younger than 5 years, overall and with respiratory infections, 2007–2012


All patients (n = 31 295)


Patients with at least one of the four specified respiratory tract infections* (n = 8157)


Demographics

No.

% (95% CI)

No.

% (95% CI)


Sex


Male

16 548

53.4% (52.7%–54.0%)

4319

53.3% (52.2%–54.4%)

Female

14 468

46.6% (46.0%–47.3%)

3782

46.7% (45.6%–47.8%)

Missing data

279


56


Age group in years


< 1

9730

31.1% (30.4%–31.8%)

2056

25.2% (24.2%–26.2%)

1 to < 2

8053

25.7% (25.2%–26.3%)

2233

27.4% (26.4%–28.4%)

2 to < 3

4917

15.7% (15.3%–16.2%)

1559

19.1% (18.2%–20.0%)

3 to < 4

4240

13.5% (13.1%–14.0%)

1251

15.3% (14.5%–16.1%)

4 to < 5

4355

13.9% (13.5%–14.3%)

1058

13.0% (12.2%–13.7%)

Missing data

0


0


Indigenous status


Aboriginal and/or Torres Strait Islander

699

2.5% (2.1%–2.9%)

160

2.2% (1.7%–2.7%)

Non-Indigenous

27 153

97.5% (97.1%–97.9%)

7121

97.8% (97.3%–98.3%)

Missing data

3443


876


HCC status


HCC

7380

25.9% (24.8%–27.0%)

2042

27.4% (25.9%–28.9%)

No HCC

21 116

74.1% (73.0%–75.2%)

5416

72.6% (71.1%–74.1%)

Missing data

2799


699


Practice status


New to practice

4754

15.4% (14.7%–16.0%)

1051

13.0% (12.1%–14.0%)

Seen previously

26 199

84.6% (84.0%–85.3%)

7012

87.0% (86.0%–87.9%)

Missing data

342


94


HCC = Health Care Card. * Acute upper respiratory tract infection, acute bronchitis/bronchiolitis, acute tonsillitis and pneumonia. † Missing data were removed from calculations.


2 Respiratory problems among children younger than 5 years per 100 encounters, by general practitioner age and sex, and by season, for the four specified respiratory tract infections, 2007–2012


No. of encounters with patients < 5 years

Problems managed per 100 encounters (95% CI)


URTI

Bronchitis

Tonsillitis

Pneumonia

Total


Total

31 295

18.64 (18.05–19.23)

4.15 (3.89–4.42)

2.72 (2.51–2.93)

0.61 (0.51–0.71)

26.13 (25.48–26.78)

GP age group in years*

< 55

21 947

18.51 (17.82–19.20)

3.96 (3.65–4.27)

2.42 (2.19–2.66)

0.61 (0.49–0.73)

25.51 (24.76–26.25)

≥ 55

9195

18.99 (17.84–20.14)

4.64 (4.12–5.17)

3.39 (2.96–3.83)

0.62 (0.43–0.81)

27.65 (26.34–28.96)

GP sex


Female

14 410

16.99 (16.18–17.80)

3.71 (3.34–4.09)

2.46 (2.17–2.76)

0.73 (0.56–0.90)

23.89 (22.97–24.81)

Male

16 885

20.05 (19.20–20.90)

4.52 (4.16–4.89)

2.94 (2.65–3.24)

0.52 (0.40–0.63)

28.03 (27.12–28.94)

Season of consultation

Summer

6571

14.35 (13.22–15.48)

2.48 (2.08–2.88)

2.71 (2.24–3.18)

0.41 (0.23–0.59)

19.95 (18.71–21.19)

Winter

8636

21.86 (20.60–23.12)

5.33 (4.72–5.93)

2.84 (2.43–3.25)

0.88 (0.65–1.11)

30.91 (29.47–32.34)


URTI = upper respiratory tract infection. Summer = December–February. Winter = June–August. * Age was missing for 153 GPs; their data were removed from calculations.


3 Mean rate (95% CI) of treatment options recorded per 100 specified respiratory problems treated in general practice among children younger than 5 years, 2007–2012


URTI = upper respiratory tract infection.

Ethical challenges for doctors working in immigration detention

To the Editor: As psychiatrists and physicians working with adults and children in mandatory, often prolonged, immigration detention, we confirm Sanggaran and colleagues’ account.1

Quality evidence from diverse, independent, multinational sources, including legal and medical investigations over two decades, finds that immigration detention:

  • contravenes multiple international conventions that Australia has signed;2
  • harms mental health of detained children and adults, and detention employees, in a process likened to torture;3
  • incurs vastly greater financial and legal costs than alternatives, and makes profits for multinational companies from desperate, traumatised people;4
  • fails to deter people from seeking asylum and is unnecessary to prevent their absconding (because they rarely abscond);2
  • compromises ethics, through mandating secrecy, neutralising advocacy and destroying independent oversight;5 and
  • fosters conditions for systematic institutional child abuse and its lifelong consequences.6

Immigration detention fails every standard of medicine — science, ethics, health economics, pragmatics and human rights (including freedom from abuse and the right to highest attainable health standards). Yet despite accumulated evidence and established opposition from national professional bodies — including medicine, paediatrics, psychiatry, public health, psychology, nursing, social work and medical students — successive governments deny or rationalise inveterate harms, arguably implicate professionals in legitimating abuses the professionals cannot prevent, and deflect needed policy change.7 The case against immigration detention is irrefutable.

As immigration detention’s damages are unmitigated by any (mental) health intervention, and immigration detention renders clinicians ineffectual, a strong clinical and ethical argument exists for withdrawing services. Rather than health care for asylum seekers and detainees remaining with the Department of Immigration and Border Protection or being outsourced, federal or state health departments should provide and manage services and monitor standards independently. This will not resolve the problem of immigration detention, but it may attenuate some of its worst effects.

Barking up the wrong tree: injuries due to falls from trees in Solomon Islands

Tree crops form an important component of the export market of lower-income countries such as Solomon Islands.14 Specifically, up to 70% of the country’s population is directly dependent on the coconut industry for income or nutrition.5 In Solomon Islands, important tree crops that provide staple foods include the breadfruit tree, guava tree and the seasonal ngali nut tree.1,6 The proximity of the population to trees, coupled with the country’s heavy reliance on tree-based crops, ensures that injuries from interactions with trees form a considerable health care burden within the country.

Indeed, what little prior research exists has indicated that hospital presentations due to tree-related injuries are common within countries heavily reliant on tree-based crops. Barss and colleagues found that in Papua New Guinea, falls from trees accounted for up to 27% of admissions to trauma wards.7 It is apparent that tree injuries place a significant burden on the health care sector, particularly with respect to injuries sustained by younger people.8 This study uses 18 years of data from the National Referral Hospital (NRH) in Honiara, Solomon Islands, to investigate tree-related injuries within the country, by identifying the types of trees involved in injuries, the groups affected by these injuries, and the prominent types of injuries incurred by falls from trees.

Methods

Our study is a descriptive case series analysis of all injuries related to trees presenting to the NRH, the nation’s only tertiary facility, over 18 years. Data were routinely collected from a database of all patients who were treated by the NRH general surgery and orthopaedic departments between 1994 and 2011.

These data arise from a larger dataset on all injuries collected by the NRH over this period. At the NRH, these data are collected by the attending clinician using a Trauma Epidemiology form. Anonymised patient data are then entered into a Microsoft Access database by clinic staff.

There were 7651 cases of injury in the database. These cases were classified into locally defined cause codes for the mechanism of injury. For the purposes of our study, we analysed the injuries that had been classified as “tree”. We then reviewed the notes available in the dataset that specified the type of tree and provided anonymised demographic information about the patient as well as information about the injury itself.

Ethics approval to conduct the research study was granted by the Solomon Islands National Health Research Ethics Committee.

Results

Of the 7651 injuries in the database, 1107 (14%) were caused by falls from trees. Analysis by type of tree found that falls from coconut trees accounted for the highest number of injuries, followed by falls from mango and guava trees (Box 1). Along with apple and nut (including ngali) trees, these five types of trees were involved in over half of all tree-related injuries that led to NRH visits.

Analysis of injuries by age found that, overall, 85% of injuries occurred in individuals aged < 20 years. For injuries involving guava trees, 77% of patients were < 10 years of age, compared with 33% for coconut tree-related injuries and 46% for all five most commonly involved tree types in this age group (Box 2). More than 98% of all apple and guava tree injuries occurred among people aged < 20 years. Conversely, coconut tree-related injuries occurred more frequently among adults aged ≥ 20 years, with 17% of injuries occurring in that age group.

Overall, 71% of injuries occurred among males (Box 3). Females accounted for about a third of coconut and guava tree-related injuries, whereas nut tree injuries occurred predominantly among males.

Of all injuries, 92% were fractures, 3% were dislocations and 5% were non-fracture injuries including contusions and concussions. The arm (including wrist, elbow and hand) was the most common location of injury across all major tree types (Box 4). The highest proportions of injuries to the torso and to the head and neck resulted from falls from coconut trees. About one in six falls led to injuries in multiple locations of the body — the most common type of multiple fracture involved both the radius and ulna. Distal radius fractures in the forearm were particularly common, and supracondylar fractures were common among children.

Among individuals aged < 10 years, the most common injury caused by falls from trees was arm fracture (Box 5). Fractures involving the head and neck were most likely to be caused by falls from coconut trees.

Discussion

Mangos, guavas and coconuts are undeniably delicious but the quest for their fruit can be hazardous.

Given the centrality of coconuts to the Solomon Islands economy, it is perhaps not surprising that falls from coconut trees resulted in the greatest number of injuries requiring a hospital visit. Fruit trees (mango, guava and apple) were the next most common source of injuries. In addition, these injuries were more common among children, suggesting that children might be climbing trees for food as well as for fun.

Other comparable studies also found that young people are disproportionately affected by these injuries.7,912 Data from the Pacific Islands on productive tree crops further support the notion that young people are typically those who fall from trees.7,11,12 Further, boys tend to sustain more injuries from falls than girls in both high-income and lower-income countries.7,11,13,14

There are a number of limitations to this study. The type of tree was recorded by the clinician on duty based on the recall of the injured patient or friends and family leading to possible bias or inaccuracies. Further, our analysis only includes those injuries that led to a visit to the NRH. Many other falls would undoubtedly not have led to visits to the hospital, because of distance, severity or other factors. Nevertheless, hospital-based injury databases can provide critical information to inform policy and population-based data collection.15

Solomon Islanders use trees for play, food and livelihoods. More supervision of children and awareness of the dangers of falls from trees might reduce the burden of injury.

1 Number of injuries resulting from falls from trees, by tree type (n = 1107)

Tree

No. of injuries


Coconut

239 (22%)

Mango

151 (14%)

Guava

111 (10%)

Apple

46 (4%)

Nut

41 (4%)

Frangipani

24 (2%)

Pawpaw

20 (2%)

Betel nut

19 (2%)

Cocoa

19 (2%)

Five corner (carambola)

18 (2%)

Breadfruit

13 (1%)

Other

406 (37%)

2 Number of injuries resulting from falls from trees, by age and most commonly involved tree type*

Tree

< 10 years

10–19 years

20–29 years

30–39 years

40–49 years

≥ 50 years


Apple

24 (55%)

20 (45%)

0

0

0

0

Coconut

60 (33%)

89 (49%)

8 (4%)

1 (2%)

7 (4%)

12 (7%)

Guava

78 (77%)

22 (22%)

0

1 (1%)

0

1 (1%)

Mango

55 (43%)

71 (55%)

1 (1%)

1 (1%)

0

1 (1%)

Nut

12 (33%)

22 (62%)

1 (3%)

0

0

1 (3%)


* Note: age data were available for 501 of 587 injuries among the most commonly involved tree types.

3 Injuries resulting from falls from trees, by sex and most commonly involved tree type

4 Body location of injuries, by most commonly involved tree type


Total

Coconut

Mango

Guava

Apple

Nut


Arm

593 (59%)

100 (46%)

83 (61%)

79 (77%)

26 (58%)

21 (57%)

Leg

116 (12%)

26 (12%)

7 (5%)

2 (2%)

7 (16%)

7 (19%)

Torso

71 (7%)

29 (13%)

10 (7%)

3 (3%)

3 (7%)

1 (3%)

Head and neck

34 (3%)

16 (7%)

4 (3%)

0

0

0

Multiple*

178 (16%)

46 (21%)

28 (21%)

16 (14%)

6 (13%)

8 (22%)

Unspecified

19 (2%)

2 (1%)

4 (3%)

3 (3%)

3 (7%)

0


* Multiple injuries either to one part of the body or to multiple parts of the body.

5 Body location of fracture among individuals aged < 10 years, by tree type*


Total

Coconut

Mango

Guava


Arm

331 (68%)

31 (52%)

38 (69%)

60 (77%)

Leg

34 (7%)

4 (7%)

2 (4%)

2 (3%)

Torso

9 (2%)

3 (5%)

0

1 (1%)

Head and neck

21 (4%)

12 (20%)

2 (4%)

0

Multiple

79 (16%)

10 (17%)

11 (22%)

13 (17%)

Unspecified

11 (2%)

0

2 (4%)

2 (3%)


* Only includes trees with > 30 injuries resulting from falls.

Should the legal age for buying alcohol be raised to 21 years?

In reply: We disagree with the points raised by Lindo and Siminski. All systematic reviews show harm associated with lowering the purchasing age and reduction in harm from increasing it. We stand by our decision to emphasise findings published in peer-reviewed journals. They cite their non-peer-reviewed New South Wales study to claim that reaching the legal age of 18 years for purchasing alcohol did not increase serious motor vehicle accident risk. However, their comparison to novice drivers aged 17 years is flawed, as inexperienced drivers in their first year are at their highest lifetime risk of vehicle accidents. To support their criticisms of New Zealand research, they cite one non-peer-reviewed report. Our conclusions are based on two independent peer-reviewed studies, supported by additional studies,1 including recent evidence of long-term negative effects of the New Zealand law change2 not confined to traffic injury.3

They claim that we ignore illicit drug substitution studies showing that up to 2% of adolescents in the United States use cannabis and then change to alcohol at 21 years of age, when they can legally purchase it. However, these effects are inconsistent across models,4 and some studies report no effect.5 In contrast, the epidemiological trend and cross-national comparative findings that we cite demonstrate that the US age-21 laws have been associated with robust reductions in all forms of substance use, with 69% of US adolescents being abstinent.6

The safety of seasonal influenza vaccines in Australian children in 2013

Fever and febrile convulsions in young Australian children were widely reported after vaccination with one brand of influenza vaccine (Fluvax and Fluvax Junior; bioCSL) in 2010.1 This unexpected increase in risk (estimated incidence of 4.4 seizures per 1000 doses) was confirmed in several studies.26 The method of manufacture of the Fluvax vaccine, which unknowingly preserved strain-specific viral components of new influenza strains in 2010, appears to have been responsible for the higher rate of fever in children.7,8 Despite reassuring data on the safety of other brands of influenza vaccine6,9 and the recommendation that Fluvax vaccine not be administered to young children,10,11 there has been a loss of confidence in the safety of influenza vaccines. In Western Australia, where influenza vaccine is available free of charge for all children aged 6 months to < 5 years, influenza (but not other routine) vaccine uptake was substantially reduced in children during 2010–2012.12

To provide more information on the safety of influenza vaccines in children, the Australian Government Department of Health funded a national pilot of active postmarketing surveillance of influenza vaccines registered by the Therapeutic Goods Administration for use in children. As influenza vaccines can vary in composition each year, studies to ensure that each annual vaccine has a consistently low rate of side effects are important. Further, a government review after the adverse events of 2010 suggested that additional surveillance mechanisms to ensure vaccine safety be evaluated.13 Here, we report the results of prospective active surveillance of influenza vaccine safety in children using solicited parent and carer reporting in 2013.

Methods

Parents and carers of all children aged 6 months to < 10 years who received influenza vaccine in outpatient clinics at six paediatric hospitals in Australia (the Children’s Hospital at Westmead, Sydney; Royal Children’s Hospital, Melbourne; Monash Medical Centre, Melbourne; Women’s and Children’s Hospital, Adelaide; Princess Margaret Hospital for Children, Perth; and Royal Children’s Hospital, Brisbane) and from primary health care providers (Central Immunisation Clinic, Perth; and general practices in the Western Sydney Medicare Local, Sydney) were invited to participate in the study. Participation rate was not formally recorded across the sites. In WA, the upper age limit for inclusion was 59 months (< 5 years).

Recruitment commenced on 18 March 2013 and concluded on 19 July 2013. Data on age, sex, presence of any pre-existing chronic medical conditions for which annual influenza vaccine is highly recommended,14 brand of influenza vaccine, and concomitant vaccines received were recorded. Information was collected in a brief telephone interview conducted by surveillance nurses 3–5 days after vaccination.

Antipyretic or analgesic medications were not routinely recommended for children before or after vaccination; their use was at the discretion of the parent or carer.

Approval for this surveillance was granted by the human research ethics committees of each participating hospital and by the Australian Government Department of Health.

Vaccines

Influenza vaccination is recommended and in most cases funded under the National Immunisation Program (NIP) for people in Australia aged ≥ 6 months with conditions predisposing to severe outcomes from influenza infection. Additionally, in WA, influenza vaccine is offered free of charge to all children aged 6–59 months. Influenza vaccines used in 2013 contained the vaccine virus strains: A(H1N1) — an A/California/7/2009(H1N1)-like virus; A(H3N2) — an A/Victoria/361/2011(H3N2)-like virus; and B — a B/Wisconsin/1/2010-like virus. The four vaccines registered and recommended for use in children aged 6 months to < 10 years were Fluarix (GlaxoSmithKline Australia), Vaxigrip (Sanofi Pasteur), Influvac (Abbott Australasia) and Agrippal (Novartis Australia). The vaccines funded under the NIP were Fluarix and Vaxigrip. Fluvax was not included in this study as it is not registered for use in children aged < 5 years and is not recommended for routine use in children aged 5 to < 10 years.15

Outcome measures

Primary outcomes were the frequency within 72 hours after vaccination of systemic reactions (fever, headache, nausea, abdominal symptoms, convulsions, rash, rigors and fatigue) and injection site reactions (erythema, swelling and/or pain at the injection site). All outcome measures were recorded according to information provided by the parent or carer. Fever (or feeling hot) was recorded either by parental report (yes/no) or, if temperature was measured, fever was defined as ≥ 37.5°C by any route. Severity of injection site reactions was recorded for non-WA sites only and was classified on the basis of parental description as: “severe” when erythema or swelling was estimated as ≥ 50 mm diameter and/or pain prevented normal everyday activities or required medical attention; “moderate” when diameter was > 10 to < 50 mm; and “mild” when diameter was ≤ 10 mm. Information was also collected on use of antipyretics or analgesics after vaccination, and whether medical attention or advice was sought.

Sample size calculation and data analysis

The number of study participants was determined from power calculations using estimates of the expected percentage of fever in vaccinees (5%–10%).16,17 A sample size of 865 was calculated to achieve the point estimate with 95% confidence intervals of 2%–5% absolute precision.

Data were recorded in a REDCap online database,18 and Stata/SE version 12.0 (StataCorp) was used for analysis. Subgroup analyses were performed for dose number (1 versus 2), concomitant versus sole administration of influenza vaccine, and vaccine brand received. To test the difference between binomial variables, the χ2 test was used for independent samples, and the McNemar test for paired samples. The Wilcoxon rank-sum test was used to compare the median values of non-normal continuous variables.

Results

Of 981 children enrolled in the surveillance, 88 (9.0%) were excluded from the analysis: eight of these were aged ≥ 10 years; influenza vaccine was inadvertently given just below the age of 6 months for one; and parents were unable to be contacted for 79 (non-response rate of 8.1%). Of the 893 children eligible for inclusion in the analysis, 419 (46.9%) were from WA, and 474 (53.1%) from other states.

Data on participant characteristics and vaccines received are shown in Box 1. The 893 children received 1052 influenza vaccinations: data were obtained after a single dose (Dose 1) for 693 children; after two doses (Doses 1 and 2) for 159 children; and after Dose 2 only for 41 children (totals: Dose 1, 852; Dose 2, 200). The mean age was 3.6 years (median, 3.1 years), and 484 children (54.2%) had at least one chronic medical condition. Of these, 196 (40.5%) had a respiratory condition and 55 (11.4%) had a cardiac condition. More children aged ≥ 3 years had a chronic medical condition than those aged < 3 years (61.2% v 47.0%).

Most vaccinations given were Vaxigrip or Vaxigrip Junior (776; 73.8%). No children were recorded as receiving Agrippal. Concomitant vaccines were administered with influenza vaccine in 60 of 1052 encounters (5.7%), all of which were with Dose 1 of the influenza vaccine. The median age of children receiving concomitant vaccines was lower than that for those receiving influenza vaccine only (2.7 v 3.3 years, P = 0.033 with Wilcoxon rank-sum test).

Safety outcome data

Data on the frequency of systemic and injection site reactions are shown in Box 2. Overall, reactions occurred in about one in five influenza vaccine recipients. Injection site reactions were more common after Dose 1 than Dose 2 (21.2% v 6.0%), whereas frequency of systemic reactions was similar after Doses 1 and 2 (18.4% v 16.5%). Fever was reported in 47 of 852 children (5.5%) after Dose 1, with a similar rate after Dose 2 (13/200; 6.5%) (P = 0.61). Among the 159 vaccinees with data available for both doses, no obvious differences in the risk of adverse events after vaccination compared with the whole cohort analysis were evident (data not shown).

Overall, there were 60 children whose parents or carers reported fever (either measured temperature elevation or feeling hot) during the 3 days of observation (Box 2). After Dose 1, most children experienced fever on Day 1 (29/47; 61.7% [95% CI, 46.4%–75.5%]), with fewer having fever on Day 2 (18/47; 38.3% [95% CI, 24.5%–53.6%]). After Dose 2, fever occurred on Day 1 in seven of 13 children (53.8% [95% CI, 25.1%–80.8%]). There was no significant difference in fever between age groups.

After Dose 1, older children (aged 3 to < 10 years) had significantly higher rates than younger children of injection site reactions (31.6% v 9.7%; < 0.001), as did children who had received influenza vaccine previously compared with vaccine-naive children (27.7% v 17.7%; P = 0.001).

Certain adverse events were more common after influenza vaccine was given concomitantly with other vaccines than after influenza vaccine given alone. For occurrence of fever with concomitant versus sole administration (13.3% [95% CI, 5.9%–24.6%] v 4.9% [3.5%–6.7%]; = 0.013), the relative risk (RR) was 2.7 (95% CI, 1.3–5.5). Systemic reactions (36.7% [95% CI, 24.6%–50.1%] v 17.0% [95% CI, 14.5%–19.8%]; < 0.001) and analgesic or antipyretic use (30.0% [95% CI, 18.8%–43.2%] v 18.4% [95% CI, 15.8%–21.3%]; = 0.04) were also more common after concomitant administration with other vaccines (RR, 2.2 [95% CI, 1.5–3.1] and 1.6 [95% CI, 1.1–2.5], respectively).

There were some differences between vaccine brands, but they were not consistent across all outcome measures and age groups. Fever rates did not exceed 6.7% for any of the three vaccine brands (data not shown).

Severity of adverse events

Of the 181 injection site reactions reported after Dose 1, severity was reported for 154, and only 11 of these (7.1%) were reported as severe. Of the 60 children for whom fever was reported, 46 had their temperature recorded: four (defined as having fever based on parental report) had a temperature less than 37.5°C, 22 were between 37.5°C and 38.5°C, 18 were between 38.6°C and 39.5°C, and two were > 39.5°C. One child had a febrile convulsion after Dose 1. This child was known to have a seizure disorder and had a history of seizures after vaccination. Despite administration of paracetamol after vaccination, he had a seizure on Day 1 and was hospitalised, but made a complete recovery. Nearly one in five children used analgesics or antipyretics within 3 days of vaccination (Box 2).

Medical attention or advice was sought in the 72 hours after influenza vaccination for 22 children (2.6%) after Dose 1, and 11 (5.5%) after Dose 2 (Box 2). Of the children for whom medical attention was sought after Dose 1, eight attended a hospital emergency department, 10 went to their local medical practitioner, and telephone or email advice was sought for four. The eight children who attended an emergency department included one child with a febrile seizure, two with urticarial rashes, two with croup or bronchitis, one with diarrhoea, one with headache and vomiting, and one with unspecified illness. Two children saw their local medical practitioner because of parental concern about fever. The reasons for medical presentations after Dose 2 were not recorded.

Discussion

This is the first time that active surveillance of influenza vaccine safety has been conducted across multiple states in Australia. The results from this large cohort offer reassurance to parents and health care providers that the seasonal influenza vaccines recommended for use in young children are safe. We found that a low proportion of children (5.5%–6.5%) had fever after vaccination, and recorded temperature elevations were generally low-grade. Although injection site and systemic reactions occurred in about one in five vaccine recipients, these were generally mild.

Our data are similar to two smaller Australian studies in children aged < 5 years: one in WA in 2011, in which 6.9% of children (10/144) reported fever;19 and another in New South Wales in 2010–2011, in which the prevalence of fever was 6.3%–7.1% after use of non-bioCSL vaccine.6 A recent systematic review found a similar overall rate of fever in children aged 6 to < 36 months. After one dose of influenza vaccine, the median average weekly risk of any fever was 8.2% (range, 5.3%–28.3%) in published reports and 26.0% (range, 10.3%–70.0%) in unpublished trials.16 The latter estimate included results from bioCSL Fluvax studies, including a Phase IV clinical trial conducted in 2009 but not published until 2013 (in which 28.6% of children aged 6 months to < 3 years and 19.5% of children aged 3 to < 9 years experienced fever).20

Although one in five parents in our study reported injection site reactions after Dose 1, very few of these were considered severe. Injection site reactions were more common in older children and in those previously vaccinated; however, this may be confounded by older children being more likely to verbally report pain and tenderness. Similar to previous studies,6,19 very few families sought medical advice after vaccination, and in some instances this was for events that were likely to be unrelated to vaccination.

Our study suggests that the risk of fever and other systemic reactions is increased in those who are given influenza vaccine on the same day as other routine vaccines. Similarly, a prospective cohort study in the United States demonstrated that children aged 6–23 months who received influenza vaccine concomitantly with 13-valent pneumococcal conjugate vaccine (PCV13) had higher rates of fever (37.6%) than children who received influenza vaccine (7.5%) or PCV13 (9.5%) on separate days.21 Another study showed an increased, albeit low, absolute risk of febrile seizure associated with concurrent administration of influenza vaccine and PCV13.22

The strengths of this surveillance included the prospective follow-up of vaccinated children, with a short interval between receipt of influenza vaccine and collection of safety outcome data. However, the use of nurse phone calls for soliciting parental reports was labour-intensive. Recently, the use of mobile phone text messaging and web-based technology to contact patients or parents has been shown to be effective for follow-up after vaccination.2325 Although potential variability in data quality due to parental reporting may limit detailed analysis and interpretation, the consistency of our findings with multiple other studies for outcome measures such as fever suggests this was not a limitation.

Vaccination providers and the public can feel confident that a range of measures, including surveillance that employs parent and carer reporting of adverse events, provide information on the safety of the influenza vaccines currently recommended for use in Australian children. This surveillance is ongoing in 2014 and has continued to provide reassuring data on the current season’s influenza vaccines.26

1 Characteristics of study participants and influenza vaccines administered, by age group*


Age


Characteristic

6 months to < 3 years

3 to < 10 years

Total


Total children

436

456

893

Male

158/298 (53.0%)

92/173 (53.2%)

250/471 (53.1%)

Mean age, years (SD)

1.7 (0.7)

5.3 (1.9)

3.6 (2.4)

Median age, years (interquartile range)

1.6 (1.0–2.3)

4.7 (3.7–6.8)

3.1 (1.6–4.8)

Previous influenza vaccine


At least one dose in previous 3 years

91 (20.9%)

209 (45.8%)

300 (33.6%)

Never received

344 (78.9%)

247 (54.2%)

592 (66.3%)

Not recorded

1 (0.2%)

0

1 (0.1%)

Chronic medical conditions


At least one chronic medical condition

205 (47.0%)

279 (61.2%)

484 (54.2%)

No chronic medical conditions

231 (53.0%)

177 (38.8%)

409 (45.8%)

Data on doses recorded


Dose 1

283 (64.9%)

409 (89.7%)

693 (77.6%)

Dose 2

35 (8.0%)

6 (1.3%)

41 (4.6%)

Both Doses 1 and 2

118 (27.1%)

41 (9.0%)

159 (17.8%)

Total vaccines administered

553

498

1052

Fluarix

30 (5.4%)

100 (20.1%)

131 (12.5%)

Influvax or Influvac Junior

54 (9.8%)

55 (11.0%)

109 (10.4%)

Vaxigrip or Vaxigrip Junior

444 (80.3%)

332 (66.7%)

776 (73.8%)

Not recorded

25 (4.5%)

11 (2.2%)

36 (3.4%)


* Age groups were chosen to coincide with the ages at which children are recommended to receive different doses of influenza vaccine, as per the Australian immunisation handbook (children aged 6 months to < 3 years receive a 0.25 mL dose, and children aged 3 to < 10 years receive a 0.5 mL dose).14 Percentages may not sum to 100% due to rounding. † Totals include one child whose age was not recorded. This child had never received influenza vaccine, had no chronic medical conditions and received Dose 1 of Fluarix. ‡ Information on sex was received for 471 participants (data not collected in Western Australia).


2 Safety outcomes and management of children aged 6 months to < 10 years who received influenza vaccines*


Dose 1 (n = 852)


Dose 2 (n = 200)


Chronic medical conditions


Previous influenza vaccine


Age


Outcome

Total

Yes

No

Yes

No

6 m to < 3 y

3 to < 10 y

Total


Systemic reaction of any severity


Fever

47 (5.5%) [4.1%–7.3%]

29 (6.1%) [4.1%–8.7%]

18 (4.7%) [2.8%–7.4%]

20 (6.7%) [4.1%–10.1%]

27 (4.9%) [3.2%–7.0%]

26 (6.4%) [4.3%–9.4%]

21 (4.7%) [2.9%–7.0%]

13 (6.5%) [3.5%–10.9%]

Headache

26 (3.1%) [2.0%–4.4%]

19 (4.0%) [2.4%–6.2%]

7 (1.8%) [0.7%–3.8%]

15 (5.0%) [2.8%–8.1%]

11 (1.9%) [1.0%–3.5%]

1 (0.2%) [0.01%–1.4%]

25 (5.6%) [3.6%–8.1%]

1 (0.5%) [0.01%–2.8%]

Nausea, vomiting or abdominal pain

39 (4.6%) [3.3%–6.2%]

23 (4.9%) [3.1%–7.2%]

16 (4.2%) [2.4%–6.8%]

14 (4.7%) [2.6%–7.7%]

25 (4.5%) [2.9%–6.6%]

18 (4.5%) [2.7%–7.0%]

21 (4.7%) [2.9%–7.0%]

5 (2.5%) [0.8%–5.7%]

Convulsion

1 (0.1%) [0.01%–0.7%]

1 (0.2%) [0.01%–1.2%]

0 (0)
[0–1.0%]

1 (0.3%) [0.01%–1.8%]

0 (0)
[0–0.7%]

0 (0)
[0–0.9%]

1 (0.2%) [0.01%–1.2%]

0 (0)
[0–1.8%]

Rash

15 (1.8%) [1.0%–2.9%]

11 (2.3%) [1.2%–4.1%]

4 (1.1%) [0.3%–2.7%]

8 (2.7%) [1.2%–5.2%]

7 (1.2%) [0.5%–2.6%]

7 (1.7%) [0.7%–3.6%]

8 (1.8%) [0.8%–3.4%]

1 (0.5%) [0.01%–2.8%]

Rigors

6 (0.7%) [0.3%–1.5%]

5 (1.1%) [0.3%–2.4%]

1 (0.3%) [0.01%–1.5%]

2 (0.7%) [0.1%–2.4%]

4 (0.7%) [0.2%–1.8%]

3 (0.7%) [0.2%–2.2%]

3 (0.7%) [0.1%–1.9%]

0 (0)
[0–1.8%]

Fatigue

73 (8.6%) [6.8%–10.7%]

48 (10.1%) [7.6%–13.2%]

25 (6.6%) [4.3%–9.6%]

24 (8.0%) [5.2%–11.7%]

49 (8.8%) [6.6%–11.5%]

35 (8.7%) [6.2%–11.9%]

38 (8.4%) [6.0%–11.4%]

6 (3.0%) [1.1%–6.4%]

Any systemic reaction

157 (18.4%) [15.9%–21.2%]

92 (19.4%) [15.9%–23.3%]

65 (17.2%) [13.5%–21.3%]

60 (20.1%) [15.7%–25.1%]

97 (17.5%) [14.4%–20.9%]

77 (19.2%) [15.5%–23.4%]

80 (17.8%) [14.3%–21.6%]

33 (16.5%) [11.6%–22.4%]

Injection site reaction of any severity


Swelling or lump

49 (5.8%) [4.3%–7.5%]

34 (7.2%) [5.0%–9.9%]

15 (4.0%) [2.2%–6.4%]

26 (8.7%) [5.8%–12.5%]

23 (4.2%) [2.6%–6.2%]

12 (2.9%) [1.6%–5.2%]

37 (8.2%) [5.9%–11.2%]

6 (3.0%) [1.1%–6.4%]

Pain or tenderness

158 (18.5%) [16.0%–21.3%]

106 (22.4%) [18.7%–26.4%]

52 (13.7%) [10.4%–17.6%]

72 (24.1%) [19.3%–29.3%]

86 (15.5%) [12.6%–18.8%]

27 (6.7%) [4.5%–9.6%]

131 (29.1%) [25.0%–33.5%]

7 (3.5%) [1.4%–7.1%]

Any injection site reaction

181 (21.2%) [18.5%–24.1%]

119 (25.1%) [21.3%–29.3%]

62 (16.4%) [12.8%–20.5%]

83 (27.7%) [22.8%–33.2%]

98 (17.7%) [14.6%–21.1%]

39 (9.7%) [7.0%–13.1%]

142 (31.6%) [27.3%–36.1%]

12 (6.0%) [3.1%–10.2%]

Management


Analgesic or antipyretic after vaccination§

164 (19.2%) [16.7%–22.1%]

103 (21.7%) [18.1%–25.7%]

61 (16.1%) [12.5%–20.2%]

69 (23.1%) [18.4%–28.3%]

95 (17.1%) [14.1%–20.6%]

85 (21.2%) [17.3%–25.5%]

79 (18.3%) [14.5%–21.9%]

35 (17.5%) [12.5%–23.5%]

Sought medical attention

22 (2.6%) [1.6%–3.9%]

14 (2.9%) [1.6%–4.9%]

8 (2.1%) [0.9%–4.1%]

10 (3.3%) [1.6%–6.1%]

12 (2.2%) [1.1%–3.8%]

11 (2.7%) [1.4%–4.9%]

11 (2.5%) [1.3%–4.4%]

11 (5.5%) [2.8%–9.6%]


* Data are number (%) [95% CI]. Some children reported more than one symptom. † Missing data for Dose 1, n = 1. ‡ Missing data for Dose 1, n = 5. “Any injection site reaction” includes erythema. § Missing data for Dose 1, n =1. ¶ Missing data for Dose 1, n =2.