We write as sponsors of the motion passed at the UK Royal College of Paediatrics and Child Health (RCPCH) Annual General Meeting (AGM) in April, 2016, opposing acceptance of funding from companies that market products within the scope of the International Code of Marketing of Breast-milk Substitutes (also known as the International Code).1
Preference: Paediatrics
792
[Correspondence] Health professional associations and industry funding—reply from Savage
The World Alliance for Breastfeeding Action (WABA) applauds the letter from Costello and colleagues1 criticising the tragic decision of the UK Royal College of Paediatrics and Child Health (RCPCH) to continue accepting money from the infant formula industry to support their activities. In our work to protect, promote, and support breastfeeding, WABA and its partners all over the world encounter promotional activities of this industry, which undermine mothers’ ability to breastfeed, and mislead the health professionals who might support them.
[Correspondence] Health professional associations and industry funding—reply from Parry et al
We write to commend Anthony Costello and colleagues1 for their Correspondence regarding the recent decision by the UK Royal College of Paediatrics and Child Health (RCPCH) to continue accepting funds from manufacturers of breast milk substitutes (BMS). This decision violates the World Health Assembly International Code of Marketing of Breast-milk Substitutes (also known as the International Code).
[Correspondence] Health professional associations and industry funding—reply from Modi et al
We are writing to clarify the position of the UK Royal College of Paediatrics and Child Health (RCPCH) with respect to engagement with industry, including infant formula companies. Revisions to our long-standing policy were agreed by the RCPCH Council in October, 2016, after a detailed membership consultation that provided a strong majority mandate. In brief (full details are available on our website),1 the RCPCH’s policy for accepting donations encourages donors, including infant formula manufacturers, subject to due diligence, to contribute to funds that support activities that benefit infants, children, and young people.
Prevalence of microcephaly in an Australian population-based birth defects register, 1980–2015
The known Microcephaly has recently received increased attention because it is associated with congenital Zika virus infection. The World Health Organization recommends that countries at risk of Zika virus transmission collate baseline data on the historical prevalence of microcephaly.
The new We report the prevalence and characteristics of microcephaly in a geographically defined Australian population over a 35-year period. Significant rate differences between Aboriginal and non-Aboriginal births were identified.
The implications Our study provides a useful baseline that will allow changes in microcephaly prevalence to be measured, and raises important matters for consideration by other jurisdictions reviewing their birth defects surveillance systems.
Microcephaly is a birth defect in which a child’s head is smaller than expected for their age, sex and ethnicity; there are, however, varying operational definitions of how much smaller (eg, head circumference below the first or third percentile, or more than two or three standard deviations below the mean value). The lack of a universally accepted definition complicates the comparison of prevalence estimates, which range from 2 to 12 per 10 000 live births in the United States,1 0.5 to 10 per 10 000 total births in EUROCAT registries (source: http://www.eurocat-network.eu/accessprevalencedata/prevalencetables), and 2 to 6 per 10 000 total births in Australia.2–4
Known causes of microcephaly include genetic conditions, metabolic diseases, teratogens (eg, alcohol), severe malnutrition (eg, extreme placental insufficiency), and transplacental infections.5 For many children the cause is unknown.
Microcephaly has recently gained increased attention because of its association with congenital Zika virus infection.6 It is predicted that more than 2.2 billion people live in areas where there is a risk of Zika virus infection.7 Local transmission has recently been reported in Singapore8 and in other common travel destinations for Australians.9 The most common vector, the mosquito Aedes aegypti, is found in northern and central Queensland; although local transmission of Zika virus has not been reported, returning travellers with Zika viraemia could infect local mosquitoes and thereby cause a local outbreak. A. aegypti was once present in other Australian states and territories, and there is concern that the mosquito could become re-established outside Queensland.10
Because of the many travellers returning from Zika-affected countries and the potential for Zika virus transmission to become established in Australia, we report baseline data on the prevalence and characteristics of microcephaly in a geographically defined Australian population over a 35-year period (1980–2015).
Methods
Cases of microcephaly were identified in the Western Australian Register of Developmental Anomalies (WARDA), a population-based statutory register with high ascertainment of developmental anomalies (cerebral palsy and birth defects).3,11 Birth defects are defined as structural or functional abnormalities present from conception or before the end of pregnancy and ascertained after a live birth (diagnosed by 6 years of age), stillbirth (minimum 20 weeks’ gestation), or a pregnancy terminated because of detected fetal anomalies (regardless of gestational age). Each defect (up to ten per case) is coded according to the British Paediatric Association extension to the International Classification of Diseases, ninth revision (BPA–ICD9).12
WARDA defines microcephaly as an occipito-frontal head circumference below the third percentile or more than two standard deviations (SDs) below the mean sex- and age-appropriate distribution curve. Any known primary cause (eg, infection, clinical syndrome) is recorded, but the head circumference measurements are not recorded. All identified cases fulfilled the third percentile criterion; either the head circumference measurement was validated by WARDA staff, or the notifier (specialist, genetics services, neonatal units) confirmed applying this criterion. The definition and registration criteria have not changed since 1980.
We identified all cases of microcephaly (BPA–ICD9, 742.10) recorded during January 1980 – December 2015. Each case was reviewed and classified according to aetiology:
-
cause unknown;
-
microcephaly associated with a chromosomal defect;
-
monogenic disorder known to affect head size;
-
known environmental cause (eg, fetal alcohol spectrum disorder [FASD]);
-
congenital infection; or
-
other cause.
We also grouped cases according to whether microcephaly was the only defect (“isolated”), or further major birth defects were reported (“associated”). We examined the age at diagnosis and notification sources.
Microcephaly prevalence was defined as the total number of cases (in live births, stillbirths and terminations of pregnancy for fetal anomaly) divided by the number all births in WA, expressed as number per 10 000 births. Tabulated denominator data for all WA live and stillbirths of at least 20 weeks’ gestation during the study period were obtained from the statutory WA Midwives Notification System. The average annual change in prevalence was calculated by Poisson regression with an offset term. Birth prevalence rates were analysed according to sex, mother’s Aboriginal status, region of residence, known v unknown cause, and isolated v associated microcephaly. We examined associated defects by organ system in cases with known and unknown causes. The prevalence of microcephaly of known and unknown cause in Aboriginal births (5.7% of births during the study period) was compared with that in non-Aboriginal births as prevalence ratios (PRs) with 95% confidence intervals (CIs). Analyses were performed in SPSS 23 (IBM) and EpiBasic (Aarhus University, Denmark).
Ethics approval
Ethics approval was obtained from the Human Research Ethics Committee of the WA Health Department (reference, 2016/19).
Results
Among 963 126 births during 1980–2015, 478 cases of microcephaly were ascertained, a prevalence of 5.0 per 10 000 births (95% CI, 4.53–5.43). For births during 1980–2009 (ie, with at least 6 years’ follow-up and therefore with complete case ascertainment), 416 cases were identified, a prevalence of 5.5 per 10 000 births (95% CI, 4.95–6.02), or 1 in 1830 births.
Of the cases from 1980–2009, 389 (93.5%) involved live births; there were seven stillbirths (1.7%) and 20 terminations of pregnancy for fetal anomaly (4.8%). A cause of microcephaly was identified in 186 cases (45%), and more frequently for Aboriginal (64 cases, 70%) than non-Aboriginal births (122, 38%). The most frequent known cause in Aboriginal births was FASD (11 per 10 000 births; 95% CI, 8.2–14.6); in non-Aboriginal births the most frequent causes were monogenic disorders (0.68 per 10 000 births; 95% CI, 0.51–0.90) and chromosomal defects (0.59 per 10 000 births; 95% CI, 0.42–0.79) (Box 1).
The prevalence of microcephaly of unknown cause was higher among Aboriginal than non-Aboriginal births (6.1 v 2.8 per 10 000 births; PR, 2.2; 95% CI, 1.38–3.22); this was also true for each type of known cause, but was statistically significant only for known environmental (PR, 200; 95% CI, 73–756) and infectious causes (PR, 4.2; 95% CI, 1.40–10.6) (Box 1).
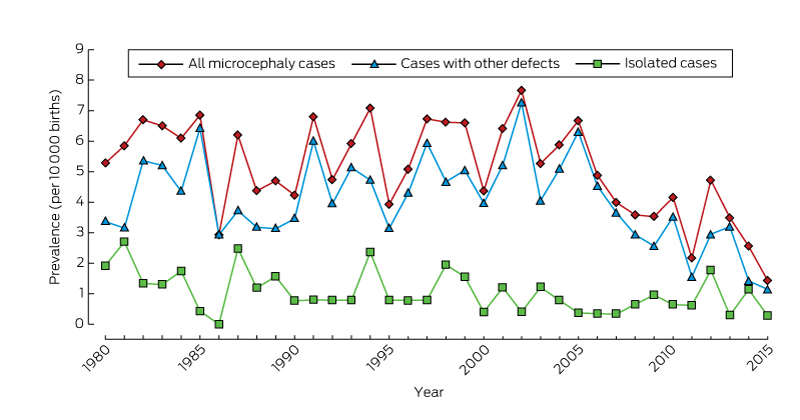
There was no significant temporal trend in microcephaly prevalence during 1980–2009 (Wald χ2 test, P = 0.23; Box 2). The prevalence of microcephaly of unknown cause declined from 3.4 per 10 000 births (95% CI, 2.7–4.2) during 1980–1989 to 2.6 per 10 000 births (95% CI, 2.0–3.2) during 2000–2009, a mean decline of 1.3% per year (95% CI, –2.4% to –0.2%; P = 0.02); that of microcephaly with a known cause increased by a mean 0.4% per year (95% CI, –1.3% to 2.0%; P = 0.67). The average annual increases in the prevalence of microcephaly associated with chromosomal defects (0.6%; 95% CI, –2.1% to 3.4%; P = 0.64), monogenic disorders (0.6%; 95% CI, –2.2% to 3.4%; P = 0.67), and environmental causes (2.6%; 95% CI, –0.3% to 5.4%; P = 0.08) were statistically non-significant. We found a significant 5.6% average annual decline in the prevalence of microcephaly associated with congenital infection (95% CI, –10.0% to –1.1%; P = 0.01); the change was evident for both Aboriginal (4.4% decline; 95% CI, –12.9% to 4.2%; P = 0.32) and non-Aboriginal births (6.0% decline; 95% CI, –10.6% to –1.5%; P = 0.008), but was statistically significant only for non-Aboriginal births.
The prevalence of microcephaly was similar for male and female children, but higher for Aboriginal than non-Aboriginal Australians (PR, 4.5; 95% CI, 3.55–5.73; Box 1). Prevalence was much higher in remote regions, particularly that of microcephaly of known cause (Box 3); this was influenced by the higher proportion of Aboriginal births (and FASD) in these areas (data not shown).
The 81 cases of isolated microcephaly (20% of all cases) were all of unknown cause. All 186 cases with a known cause were associated with other major birth defects, compared with 65% of the 230 cases without a known cause (Box 4).
The overall prevalence of isolated microcephaly declined by a mean 3.4% per year (95% CI, –5.3% to –1.4%; P = 0.001); there was no significant change in the prevalence of microcephaly with associated defects (P = 0.86) (Box 2). Temporal changes in the availability of folate supplements and the introduction of folic acid fortification of some foods were not associated with changes in the prevalence of microcephaly (data not shown).
Microcephaly was diagnosed after the age of 12 months in 27% of cases, increasing from 19% during the 1980s to 29% in the 1990s and 31% during 2000–2009 (Box 5). Isolated cases were more likely to be diagnosed later (35% after 12 months of age), as were cases with a known cause (30% after 12 months of age). For most cases with a known cause diagnosed after 12 months of age, the cause was FASD (52%).
The major notification sources were geneticists, paediatricians, and obstetric and paediatric hospitals. While paediatric and obstetric hospitals maintained steady notification rates, genetics services played an increasingly important role; they contributed more than one-quarter of reported cases during 2000–2009 (data not shown). Most cases were notified by more than one source (mean, 2.8 notifications per case [SD, 1.76]; median, 2 notifications per case [interquartile range, 1–4]).
Discussion
Our study, the first descriptive epidemiological investigation of microcephaly in Australia, provides baseline data on the prevalence of microcephaly in Western Australia over a 35-year period. Most cases of microcephaly were in live-born infants (93.5%), and the overall prevalence was 5.5 per 10 000 births, with annual rates ranging between 2.9 and 7.7 per 10 000 births.
There are few published epidemiological studies of microcephaly, and comparisons are complicated by differences in case definition, period of ascertainment, pregnancy outcomes included, underlying population differences, and environmental variables. These difficulties were illustrated by a recent report of important variations in the prevalence of microcephaly recorded by 16 European birth defects registries.13 In Australia, national estimates are difficult because of major differences between states in the scope of birth defects data collections.14 The most recent national data (for births during 2002–2003),2 which did not include data from the Northern Territory, found a lower prevalence of microcephaly (1.9 per 10 000 births) than we did. Our results, however, are similar to those reported by other registers using the same case definition and equivalent follow-up periods, including the Atlanta Congenital Defects Program1 and the South Australian Register4 (5.0–5.2 per 10 000 births).
Our prevalence estimates, and those reported by birth defects registries in other countries, are well below the rate of 230 cases per 10 000 births expected when a case definition of an occipito-frontal head circumference more than two SDs below the mean for age and sex is applied. This implies that specialists are moderating their notifications according to criteria other than head circumference; these may include notifying cases when they have clinical concern about the child, or when there is an association with a particular cause (eg, trisomy 18). This moderation probably operates in most surveillance systems, including our own. Although head circumference or percentile measures were checked before registering a case of microcephaly in the database, the measurements themselves are not recorded by WARDA. Adding these data to the collection is planned, facilitating assessment of case severity and comparisons with registries using different registration criteria.
We identified a cause for microcephaly in 45% of cases, and more frequently for births to Aboriginal (70%) than to non-Aboriginal mothers (38%). The figure for non-Aboriginal births was similar to those reported from Atlanta (40%)15 and by a German clinic-based study in which the most common cause was genetic in nature (29% of 680 cases;16 similar to the 28% of non-Aboriginal births in our study). We found an average annual decline in microcephaly cases of unknown cause of 1.3%; this may be attributable to improved genetic diagnostic technologies and increasing diagnosis of FASD, factors that may also account for the declining number of cases of isolated microcephaly.
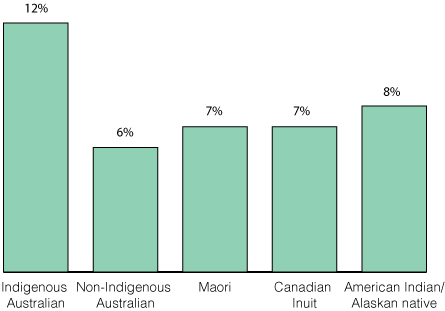
Our results highlight the contribution of FASD to microcephaly in Aboriginal children, with a prevalence of FASD-associated microcephaly (11 per 10 000 births) 260 times that for non-Aboriginal births (0.04 per 10 000 births). FASD also contributed to higher prevalence rates in remote areas of WA. A recent study found that the prevalence of fetal alcohol syndrome in remote WA Aboriginal communities among 7–8-year-old children was 12%, and that 69% of these children had microcephaly;17 another study reported a twofold increase in FASD notifications to WARDA for both Aboriginal and non-Aboriginal births during 1980–2010, coinciding with increased state and national awareness of FASD.18 Nevertheless, FASD is still underdiagnosed, and this may partly explain the higher prevalence of microcephaly of unknown cause in Aboriginal children (6.1 v 2.8 per 10 000 non-Aboriginal births), and may also account for some cases of unknown cause in non-Aboriginal infants. The higher prevalence of microcephaly of unknown cause among Aboriginal Australians may also be related to the relative lack of access to or engagement with health care services and the paucity of genomic reference data for Aboriginal Australians.19 The release of the Australian guide for diagnosing FASD20 and the Partnership Grants (“Models and quality of genetic health services for Aboriginal and Torres Strait Islander people”) co-funded by the National Health and Medical Research Council and the Lowitja Institute may advance aetiological investigations. In addition, a major research program for investigating the diagnosis, prevention and management of FASD is underway in WA.21
In 27% of cases, microcephaly was diagnosed in children more than 12 months old. This large proportion would be missed were ascertainment periods shorter. This factor may be particularly important when differentiating cases of known and unknown cause, especially when microcephaly is associated with conditions (such as FASD and specific genetic anomalies) that are often diagnosed at a later age.18
Further major birth defects were associated with 80% of cases of microcephaly. The most frequent in cases of unknown cause were those affecting the nervous system (61% of associated defects), including neural tube defects (13%). The US National Birth Defects Prevention Network suggests excluding microcephaly associated with neural tube defects, holoprosencephaly, craniosynostosis, and conjoined twins.5 We favour broader inclusion criteria, especially in light of the evolving understanding of the full spectrum of defects that may be associated with congenital Zika infection. One in five definite or probable cases of congenital Zika syndrome in a large case series from Brazil were associated with brain abnormalities in infants without microcephaly, suggesting that surveillance should not focus on microcephaly alone.22 Other defects associated with Zika infection include intracranial calcifications, craniofacial malformations, severe arthrogryposis, and eye defects.23 WARDA includes each of these in its data collection.
Zika virus is the first mosquito-borne virus associated with human birth defects, and is also sexually transmissible. A recent editorial in the MJA24 highlighted the robust Australian systems that enable rapid responses to newly identified communicable diseases, but our capacity for monitoring birth defects was not discussed. Medical practitioners have been advised to ask pregnant women about their recent travel history and to offer testing to those who have visited Zika-affected areas. Birth defect registries that record the causes of birth defects are therefore likely to capture cases of microcephaly or other defects associated with Zika virus exposure in returned travellers. Our capacity to detect changes in the prevalence of microcephaly caused by local transmission of the virus is less clear, as infection is frequently asymptomatic, and the collection of data on birth defects in this country is not standardised, with wide variability between states in case ascertainment.14
As remote regions in Northern Australia either already harbour or are at risk of harbouring A. aegypti mosquitoes, enhanced monitoring of birth defects in these areas (and also of FASD) is important. The Australian Paediatric Surveillance Unit project for the surveillance of microcephaly in infants under 12 months of age is important for responding to the challenges of geographically equitable case ascertainment.25
Attempts to standardise state and territory birth defects data collections have been unsuccessful.26 In the absence of national data, our study provides a useful baseline for measuring changes in microcephaly prevalence, and highlights important matters for consideration by other jurisdictions reviewing their birth defects surveillance systems.
Box 1 –
Prevalence of microcephaly (per 10 000 births) by cause and Aboriginal status of the mother, Western Australia, 1980–2009
|
Cause |
All cases |
Aboriginal |
Non-Aboriginal |
Prevalence ratio (95% CI) |
|||||||||||
|
Number |
Prevalence (95% CI) |
Number |
Prevalence (95% CI) |
Number |
Prevalence (95% CI) |
||||||||||
|
|
|||||||||||||||
|
Total number of cases |
416 |
5.5(4.95–6.02) |
91 |
21(16.5–25.2) |
325 |
4.5(4.05–5.05) |
4.5(3.55–5.73) |
||||||||
|
Unknown cause |
230 (55%) |
3.0(2.64–3.44) |
27 |
6.1(4.01–8.86) |
203 |
2.8(2.46–3.25) |
2.2(1.38–3.22) |
||||||||
|
Known cause |
186 (45%) |
2.4(2.10–2.82) |
64 |
14(11.11–18.43) |
122 |
1.7(1.41–2.03) |
8.5(6.17–11.6) |
||||||||
|
Chromosomal |
47 (11%) |
0.62(0.45–0.82) |
5 |
1.1(0.37–2.63) |
42 |
0.59(0.42–0.79) |
1.9(0.59–4.86) |
||||||||
|
Monogenic |
54 (13%) |
0.71(0.53–0.93) |
5 |
1.1(0.37–2.63) |
49 |
0.68(0.51–0.90) |
1.6(0.51–4.12) |
||||||||
|
Environmental |
53 (13%) |
0.70(0.52–0.91) |
49* |
11(8.2–14.6) |
< 5 |
0.06(0.01–0.14) |
200(73–756) |
||||||||
|
Fetal alcohol spectrum disorder* |
52 |
0.68(0.51–0.90) |
49* |
11(8.2–14.6) |
< 5 |
0.04(0.01–0.12) |
260(85–1320) |
||||||||
|
Infectious |
29 (7%) |
0.38(0.26–0.55) |
6* |
1.4(0.50–2.94) |
23 |
0.32(0.20–0.48) |
4.2(1.40–10.6) |
||||||||
|
Cytomegalovirus* |
24 |
0.32(0.20–0.47) |
5* |
1.1(0.37–2.63) |
19 |
0.26(0.16–0.41) |
4.2(1.24–11.8) |
||||||||
|
Other infections |
5 |
0.07(0.02–0.15) |
< 5 |
0.22(0.01–1.26) |
< 5 |
0.06(0.01–0.14) |
4.0(0.08–40.8) |
||||||||
|
Other cause |
< 5 |
0.05(0.01–0.14) |
0 |
— |
< 5 |
0.06(0.01–0.14) |
— |
||||||||
|
|
|||||||||||||||
|
* One child was diagnosed with both cytomegalovirus infection and fetal alcohol spectrum disorder. |
|||||||||||||||
Box 2 –
Prevalence of microcephaly in Western Australia, 1980–2015: overall prevalence, and prevalence of cases with and without associated anomalies*
* From 2009, there is less than 6 years’ follow-up of births, so that ascertainment of cases will be incomplete.
Box 3 –
Prevalence (per 10 000 births) of microcephaly in Western Australia, 1980–2009
|
|
All cases |
Microcephaly of known cause |
Microcephaly of unknown Cause |
||||||||||||
|
Number |
Prevalence (95% CI) |
Number |
Prevalence (95% CI) |
Number |
Prevalence (95% CI) |
||||||||||
|
|
|||||||||||||||
|
All |
416 |
5.5 (4.95–6.02) |
186 |
2.4 (2.10–2.82) |
230 |
3.0 (2.64–3.44) |
|||||||||
|
Sex |
|
|
|
|
|
|
|||||||||
|
Male |
199 |
5.1 (4.41–5.85) |
85 |
2.2 (1.74–2.69) |
114 |
2.9 (2.41–3.51) |
|||||||||
|
Female |
216 |
5.8 (5.08–6.66) |
101 |
2.7 (2.22–3.31) |
115 |
3.1 (2.56–3.72) |
|||||||||
|
Missing data |
1 |
|
|
|
1 |
|
|||||||||
|
Aboriginal status of mother |
|
|
|
|
|
|
|||||||||
|
Aboriginal |
91 |
21 (16.52–25.2) |
64 |
14 (11.11–18.4) |
27 |
6.1 (4.01–8.86) |
|||||||||
|
Non-Aboriginal |
325 |
4.5 (4.05–5.05) |
122 |
1.7 (1.41–2.03) |
203 |
2.8 (2.46–3.25) |
|||||||||
|
Residential location* |
|
|
|
|
|
|
|||||||||
|
Metropolitan |
261 |
4.8 (4.24–5.42) |
103 |
1.9 (1.55–2.30) |
158 |
2.9 (2.47–3.40) |
|||||||||
|
Rural |
74 |
5.2 (4.12–6.50) |
31 |
2.2 (1.49–3.12) |
43 |
3.0 (2.21–4.10) |
|||||||||
|
Remote |
81 |
11 (8.56–13.4) |
52 |
6.9 (5.17–9.07) |
29 |
3.9 (2.59–5.54) |
|||||||||
|
|
|||||||||||||||
|
* According to the postcode of the mother as recorded by WARDA at the time of her child’s birth. The eight WA Department of Health residential location categories were grouped into three classes: metropolitan; rural (Great Southern, South-West, Wheatbelt, Midwest Murchison); and remote (Kimberley, Pilbara–Gascoyne, Goldfields–Southeast). |
|||||||||||||||
Box 4 –
Association of microcephaly (of known and unknown cause) with other congenital anomalies, Western Australia, 1980–2009
|
|
All cases |
Microcephaly of known cause |
Microcephaly of unknown Cause |
||||||||||||
|
|
|||||||||||||||
|
Total number of cases |
416 |
186 |
230 |
||||||||||||
|
Isolated microcephaly |
81 (20%) |
0 |
81 (35%) |
||||||||||||
|
Microcephaly associated with other defects |
335 (80%) |
186 (100%) |
149 (65%) |
||||||||||||
|
Associated defects by diagnostic category |
335 |
186 |
149 |
||||||||||||
|
Nervous system, apart from microcephaly |
141 (34%) |
50 (27%) |
91 (61%) |
||||||||||||
|
Neural tube defects |
25 (6%) |
6 (3%) |
19 (13%) |
||||||||||||
|
Chromosomal |
47 (11%) |
47 (25%) |
0 |
||||||||||||
|
Cardiovascular |
49 (12%) |
29 (16%) |
20 (13%) |
||||||||||||
|
Respiratory |
15 (4%) |
10 (5%) |
5 (3%) |
||||||||||||
|
Gastrointestinal |
48 (12%) |
20 (11%) |
28 (19%) |
||||||||||||
|
Musculoskeletal |
72 (17%) |
35 (19%) |
37 (25%) |
||||||||||||
|
Urogenital |
68 (16%) |
43 (23%) |
25 (17%) |
||||||||||||
|
Eye |
36 (9%) |
24 (13%) |
12 (8%) |
||||||||||||
|
Ear, face, neck |
8 (2%) |
3 (2%) |
5 (3%) |
||||||||||||
|
Integument |
4 (1%) |
2 (1%) |
2 (1%) |
||||||||||||
|
Other major diagnoses |
158 (38%) |
142 (76%) |
16 (11%) |
||||||||||||
|
Monogenic condition |
58 (14%) |
54 (29%) |
4 (3%) |
||||||||||||
|
Fetal alcohol spectrum disorder |
52 (12%) |
52 (28%) |
0 |
||||||||||||
|
|
|||||||||||||||
|
|
|||||||||||||||
Box 5 –
Number of cases of microcephaly in Western Australia, 1980–2015, by age at diagnosis
|
Age at diagnosis |
Follow-up period |
||||||||||||||
|
At least 6 years (416 cases) |
Less than 6 years (62 cases) |
||||||||||||||
|
1980–1989 |
1990–1999 |
2000–2009 |
2010–2015 |
||||||||||||
|
|
|||||||||||||||
|
Prenatal |
16 (12%) |
25 (17%) |
18 (13%) |
18 (29%) |
|||||||||||
|
Within first month of life |
47 (36%) |
49 (33%) |
40 (29%) |
16 (26%) |
|||||||||||
|
> 1 month to 1 year |
33 (26%) |
26 (18%) |
36 (26%) |
16 (26%) |
|||||||||||
|
> 1 year to 3 years |
16 (12%) |
24 (16%) |
27 (19%) |
7 (11%) |
|||||||||||
|
> 3 years to 6 years |
9 (7%) |
19 (13%) |
17 (12%) |
3 (5%) |
|||||||||||
|
Post mortem |
8 (6%) |
4 (3%) |
2 (1%) |
2 (3%) |
|||||||||||
|
|
|||||||||||||||
|
|
|||||||||||||||
The Australasian Society for Infectious Diseases and Refugee Health Network of Australia recommendations for health assessment for people from refugee-like backgrounds: an abridged outline
There are currently more than 65 million people who have been forcibly displaced worldwide, including 21.3 million people with formal refugee status, over half of whom are aged under 18 years.1 More than 15 000 refugees have resettled in Australia in the 2015–16 financial year, which includes a proportion of the 12 000 refugees from Syria and Iraq recently added to Australia’s humanitarian intake.2 In addition, around 30 000 asylum seekers who arrived by plane or boat are currently in Australia awaiting visa outcomes.3
People from refugee-like backgrounds are likely to have experienced disruption of basic services, poverty, food insecurity, poor living conditions and prolonged uncertainty; they may have experienced significant human rights violations, trauma or torture. These circumstances place them at increased risk of complex physical and mental health conditions. They face numerous barriers to accessing health care after arrival in Australia, such as language, financial stress, competing priorities in the settlement period, and difficulties understanding and navigating the health care system.4–6 Most people require the assistance of an interpreter for clinical consultations.7 Offering a full health assessment to newly arrived refugees and asylum seekers is a positive step towards healthy settlement, and helps manage health inequity through the provision of catch-up immunisation and the identification and management of infectious and other health conditions.
These guidelines update the Australasian Society of Infectious Diseases (ASID) guidelines for the diagnosis, management and prevention of infectious diseases in recently arrived refugees8 published in 2009 and previously summarised in the MJA.9 When these recommendations were first published, more than 60% of humanitarian entrants arriving in Australia were from sub-Saharan Africa10 and had a high prevalence of malaria, schistosomiasis and hepatitis B virus (HBV) infection.11–15 The initial guidelines were primarily intended to help specialists and general practitioners to diagnose, manage and prevent infectious diseases. Since then, there have been changes in refugee-source countries — with more arrivals from the Middle East and Asia and fewer from sub-Saharan Africa16,17 — and an increased number of asylum seekers arriving by boat,18 alongside complex and changing asylum seeker policies and changes in health service provision for these populations. In this context, we reviewed the 2009 recommendations to ensure relevance for a broad range of health professionals and to include advice on equitable access to health care, regardless of Medicare or visa status. The revised guidelines are intended for health care providers caring for people from refugee-like backgrounds, including GPs, refugee health nurses, refugee health specialists, infectious diseases physicians and other medical specialists.
This article summarises the full guidelines, which contain detailed literature reviews, recommendations on diagnosis and management along with explanations, supporting evidence and links to other resources. The full version is available at http://www.asid.net.au/documents/item/1225.
Methods
The guideline development process is summarised in Box 1. The two key organisations developing these guidelines are ASID and the Refugee Health Network of Australia. ASID is Australia’s peak body representing infectious diseases physicians, medical microbiologists and other experts in the fields of the prevention, diagnosis and treatment of human and animal infections. The Refugee Health Network is a multidisciplinary network of health professionals across Australia with expertise in refugee health.20
We defined clinical questions using the PIPOH framework (population, intervention, professionals, outcomes and health care setting).21 The chapter authors and the Expert Advisory Group developed recommendations based on reviews of available evidence, using systematic reviews where possible. Australian prevalence data also informed screening recommendations; for example, the low reported prevalence of chlamydia (0.8–2.0%) infections and absence of gonorrhoea infections in refugee cohorts in Australia13,22–24 (and in other developed countries25–27) informed the new recommendation for risk-based sexually transmitted infection (STI) screening.
Despite the intention to assign levels of evidence to each recommendation, there was limited published high level evidence in most areas, and virtually all recommendations are based on expert consensus. Consensus was not reached regarding the recommendations relating to human immunodeficiency virus (HIV) and STIs.
The term “refugee-like” is used to describe people who are refugees under the United Nations Refugee Convention,28 those who hold a humanitarian visa, people from refugee-like backgrounds who have entered under other migration streams, and people seeking asylum in Australia. “Refugee-like” acknowledges that people may have had refugee experience in their countries of origin or transit, but do not have formal refugee status.
Current pre-departure screening
All permanent migrants to Australia have a pre-migration immigration medical examination 3–12 months before departure,29 which includes a full medical history and examination. Investigations depend on age, risk factors and visa type,30 and include:
-
a chest x-ray for current or previous tuberculosis ([TB]; age ≥ 11 years);
-
screening for latent TB infection with an interferon-γ release assay or tuberculin skin test (for children aged 2–10 years, if they hold humanitarian visas, come from high prevalence countries or have had prior household contact);
-
HIV serology (age ≥ 15 years, unaccompanied minors);
-
hepatitis B surface antigen (HBsAg) testing (pregnant women, unaccompanied minors, onshore protection visas, health care workers);
-
hepatitis C virus (HCV) antibody testing (onshore protection visas, health care workers); and
-
syphilis serology (age ≥ 15 years, humanitarian visas, onshore protection visas).
Humanitarian entrants are also offered a voluntary pre-departure health check depending on departure location and visa subtype.31 The pre-departure health check includes a rapid diagnostic test and treatment for malaria in endemic areas; empirical treatment for helminth infections with a single dose of albendazole; measles, mumps and rubella vaccination; and yellow fever and polio vaccination where relevant. The current cohort of refugees arriving from Syria will have extended screening incorporating the immigration medical examination and pre-departure health check, with additional mental health review and immunisations.
People seeking asylum who arrived by boat have generally had a health assessment on arrival in immigration detention — although clinical experience suggests that investigations and detention health care varies, especially for children. However, asylum seekers who arrived by plane will not have had a pre-departure immigration medical examination.
General recommendations
Our overarching recommendation is to offer all people from refugee-like backgrounds, including children, a comprehensive health assessment and management plan, ideally within 1 month of arrival in Australia. This assessment can be offered at any time after arrival if the initial contact with a GP or clinic is delayed, and should also be offered to asylum seekers after release from detention. Humanitarian entrants who have been in Australia for less than 12 months are eligible for a GP Medicare-rebatable health assessment. Such assessments may take place in a primary care setting or in a multidisciplinary refugee health clinic. Documented overseas screening and immunisations, and clinical assessment should also guide diagnostic testing.
Health care providers should adhere to the principles of person-centred care when completing post-arrival assessments.32,33 These include: respect for the patient’s values, preferences and needs; coordination and integration of care with the patient’s family and other health care providers; optimising communication and education, provision of interpreters where required (the Doctors Priority Line for the federal government-funded Translating and Interpreting Service is 1300 131 450) and use of visual and written aids and teach-back techniques to support health literacy.34 It is important to explain that a health assessment is voluntary and results will not affect visa status or asylum claims.
Specific recommendations
Recommendations are divided into two sections: infectious and non-infectious conditions. Box 2 provides a checklist of all recommended tests, and Box 3 sets out details of country-specific recommendations. A brief overview is provided below. For more detailed recommendations regarding management, follow-up and considerations for children and in pregnancy, see the full guidelines.
Infectious conditions
TB:
-
Offer latent TB infection testing with the intention to offer preventive treatment and follow-up.
-
Offer screening for latent TB infection to all people aged ≤ 35 years.
-
Children aged 2–10 years may have been screened for latent TB infection as part of their pre-departure screening.
-
Screening and preventive treatment for latent TB infection in people > 35 years will depend on individual risk factors and jurisdictional requirements in the particular state or territory.
-
Use either a tuberculin skin test or interferon-γ release assay (blood) to screen for latent TB infection.
-
A tuberculin skin test is preferred over interferon-γ release assay for children < 5 years of age.
-
Refer patients with positive tuberculin skin test or interferon-γ release assay results to specialist tuberculosis services for assessment and exclusion of active TB and consideration of treatment for latent TB infection.
-
Refer any individuals with suspected active TB to specialist services, regardless of screening test results.
Malaria:
-
Investigations for malaria should be performed for anyone who has travelled from or through an endemic malaria area (Box 3), within 3 months of arrival if asymptomatic, or any time in the first 12 months if there is fever (regardless of pre-departure malaria testing or treatment).
-
Test with both thick and thin blood films and an antigen-based rapid diagnostic test.
-
All people with malaria should be treated by, or in consultation with, a specialist infectious diseases service.
HIV:
-
Offer HIV testing to all people aged ≥ 15 years and all unaccompanied or separated minors, as prior negative tests do not exclude the possibility of subsequent acquisition of HIV (note that consensus was not reached regarding this recommendation).
HBV:
-
Offer testing for HBV infection to all, unless it has been completed as part of the immigration medical examination.
-
A complete HBV assessment includes HBsAg, HB surface antibody and HB core antibody testing.
-
If the HBsAg test result is positive, further assessment and follow-up with clinical assessment, abdominal ultrasound and blood tests are required.
HCV:
-
Offer testing for HCV to people if they have:
-
risk factors for HCV;
-
lived in a country with a high prevalence (> 3%) of HCV (Box 3); or
-
an uncertain history of travel or risk factors.
-
-
Initial testing is with an HCV antibody test. If the result is positive, request an HCV RNA test.
-
If the HCV RNA test result is positive, refer to a doctor accredited to treat HCV for further assessment.
Schistosomiasis:
-
Offer blood testing for Schistosoma serology if people have lived in or travelled through endemic countries (Box 3).
-
If serology is negative, no follow-up is required.
-
If serology is positive or equivocal:
-
treat with praziquantel in two doses of 20 mg/kg, 4 hours apart, orally; and
-
perform stool microscopy for ova, urine dipstick for haematuria, and end-urine microscopy for ova if there is haematuria.
-
-
If ova are seen in urine or stool, evaluate further for end-organ disease.
Strongyloidiasis:
-
Offer blood testing for Strongyloides stercoralis serology to all.
-
If serology is positive or equivocal:
-
check for eosinophilia and perform stool microscopy for ova, cysts and parasites; and
-
treat with ivermectin 200 μg/kg (weight ≥ 15 kg), on days 1 and 14 and repeat eosinophil count and stool sample if abnormal.
-
-
Refer pregnant women or children < 15 kg for specialist management.
Intestinal parasites:
-
Check full blood examination for eosinophilia.
-
If pre-departure albendazole therapy is documented:
-
if there are no eosinophilia and no symptoms, no investigation or treatment is required; and
-
if there is eosinophilia, perform stool microscopy for ova, cysts and parasites, followed by directed treatment.
-
-
If no documented pre-departure albendazole therapy, depending on local resources and practices, there are two acceptable options:
-
empirical single dose albendazole therapy (age > 6 months, weight < 10 kg, dose 200 mg; weight ≥ 10 kg, dose 400 mg; avoid in pregnancy, class D drug); or
-
perform stool microscopy for ova, cysts and parasites, followed by directed treatment.
-
Helicobacter pylori:
-
Routine screening for H. pylori infection is not recommended.
-
Screen with either stool antigen or breath test in adults from high risk groups (family history of gastric cancer, symptoms and signs of peptic ulcer disease, or dyspepsia).
-
Children with chronic abdominal pain or anorexia should have other common causes of their symptoms considered in addition to H. pylori infection.
-
Treat all those with a positive test (see the full guidelines for details, tables 1.5 and 9.1).
STIs:
-
Offer an STI screen to people with a risk factor for acquiring an STI or on request. Universal post-arrival screening for STIs for people from refugee-like backgrounds is not supported by current evidence.
-
A complete STI screen includes a self-collected vaginal swab or first pass urine nucleic acid amplification test and consideration of throat and rectal swabs for chlamydia and gonorrhoea, and serology for syphilis, HIV and HBV.
-
Syphilis serology should be offered to unaccompanied and separated children < 15 years.
Skin conditions:
-
The skin should be examined as part of the initial physical examination.
-
Differential diagnoses will depend on the area of origin (see table 11.1 in full guidelines for details).
Immunisation:
-
Provide catch-up immunisation so that people of refugee background are immunised equivalent to an Australian-born person of the same age.
-
In the absence of written immunisation documentation, full catch-up immunisation is recommended.
-
Varicella serology is recommended for people aged ≥ 14 years if there is no history of natural infection.
-
Rubella serology should be completed in women of childbearing age.
Non-infectious conditions
Anaemia and other nutritional problems:
-
Offer full blood examination screening for anaemia and other blood conditions to all.
-
Offer screening for iron deficiency with serum ferritin to children, women of childbearing age, and men who have risk factors.
-
Check vitamin D status as part of initial health screening in people with one or more risk factors for low vitamin D.
-
People with low vitamin D should be treated to restore their levels to the normal range with either daily dosing or high dose therapy, paired with advice about sun exposure.
-
Consider screening for vitamin B12 deficiency in people with history of restricted food access, especially those from Bhutan, Afghanistan, Iran and the Horn of Africa.
Chronic non-communicable diseases in adults:
-
Offer screening for non-communicable diseases in line with the Royal Australian College of General Practitioners Red Book35 recommendations, including assessment for:
-
smoking, nutrition, alcohol and physical activity;
-
obesity, diabetes, hypertension, cardiovascular disease, chronic obstructive pulmonary disease and lipid disorders; and
-
breast, bowel and cervical cancer.
-
-
Assess diabetes and cardiovascular disease risk earlier for those from regions with a higher prevalence of non-communicable diseases, or those with an increased body mass index or waist circumference.
Mental health:
-
A trauma informed assessment of emotional wellbeing and mental health is part of post-arrival screening. Being aware of the potential for past trauma and impact on wellbeing is essential, although it is generally not advisable to ask specifically about details in the first visits.
-
Consider functional impairment, behavioural difficulties and developmental progress as well as mental health symptoms when assessing children.
Hearing, vision and oral health:
-
A clinical assessment of hearing, visual acuity and dental health should be part of primary care health screening.
Women’s health:
-
Offer women standard preventive screening, taking into account individual risk factors for chronic diseases and bowel, breast and cervical cancer.
-
Consider pregnancy and breastfeeding and offer appropriate life stage advice and education, such as contraceptive advice where needed, to all women, including adolescents.
-
Practitioners should be aware of clinical problems, terminology and legislation related to female genital mutilation or cutting and forced marriage.
Box 1 –
Guideline development process
|
|
|||||||||||||||
|
|
|||||||||||||||
|
|
|||||||||||||||
|
AChSHM = Australasian Chapter of Sexual Health Medicine. ASID = Australasian Society for Infectious Diseases. EAG = Expert Advisory Group. GP = general practitioner. ID = infectious diseases. NTAC = National Tuberculosis Advisory Council. RACGP = Royal Australian College of General Practitioners. RACP = Royal Australasian College of Physicians. RHeaNA = Refugee Health Network of Australia. Adapted from the ASID and RHeaNA Recommendations for comprehensive post-arrival health assessment for people from refugee-like backgrounds (2016; https://www.asid.net.au/documents/item/1225) with permission from ASID. |
|||||||||||||||
Box 2 –
Short checklist of recommendations for post-arrival health assessment of people from refugee-like backgrounds
|
Offer test to |
Test |
Comments and target condition |
|||||||||||||
|
|
|||||||||||||||
|
All |
Full blood examination |
Anaemia, iron deficiency, eosinophilia |
|||||||||||||
|
Hepatitis B serology (HBsAg, HBsAb, HBcAb) |
HBsAg testing introduced overseas in 2016 for Syrian and Iraqi refugee cohort and may have been completed in other groups |
||||||||||||||
|
Strongyloides stercoralis serology |
Strongyloidiasis |
||||||||||||||
|
HIV serology* |
≥ 15 years or unaccompanied or separated minor |
||||||||||||||
|
TST or IGRA |
Offer test if intention to treat. All ≤ 35years; if≥ 35 years, depends on risk factors and local jurisdiction. TST preferred for children < 5 yearsTST or IGRA testing introduced in 2016 as part of IME for children 2–10 years (humanitarian entrants, high prevalence countries, prior household contact) |
||||||||||||||
|
Varicella serology |
≥ 14 years if no known history of disease |
||||||||||||||
|
Visual acuity |
Vision status, other eye disease |
||||||||||||||
|
Glaucoma assessment |
Africans > 40 years and others > 50 years |
||||||||||||||
|
Dental review |
Caries, periodontal disease, other oral health issues |
||||||||||||||
|
Hearing review |
Hearing impairment |
||||||||||||||
|
Social and emotional wellbeing and mental health |
Mental illness, trauma exposure, protective factors |
||||||||||||||
|
Developmental delay or learning concerns |
Children and adolescents |
||||||||||||||
|
Preventive health as per RACGP35 |
Non-communicable diseases, consider screening earlier than usual age |
||||||||||||||
|
Catch-up vaccinations |
Vaccine preventable diseases, including hepatitis B |
||||||||||||||
|
Risk-based |
Rubella IgG |
Women of childbearing age |
|||||||||||||
|
Ferritin |
Men who have risk factors, women and childrenIron deficiency anaemia |
||||||||||||||
|
Vitamin D, also check calcium, phosphate, and alkaline phosphatase in children |
Risk factors if dark skin or lack of sun exposure |
||||||||||||||
|
Vitamin B12 |
Arrival < 6 months, food insecurity, vegan diet or from Bhutan, Afghanistan, Iran or Horn of Africa |
||||||||||||||
|
First pass urine or self-obtained vaginal swabs for gonorrhoea and chlamydia PCR |
Risk factors for STI or on request* |
||||||||||||||
|
Syphilis serology |
Risk factors for STIs, unaccompanied or separated minors. Part of IME in humanitarian entrants aged ≥ 15 years |
||||||||||||||
|
Helicobacter pylori stool antigen or breath test |
Gastritis, peptic ulcer disease, family history of gastric cancer, dyspepsia |
||||||||||||||
|
Stool microscopy (ova, cysts and parasites) |
If no documented pre-departure albendazole or persisting eosinophilia despite albendazoleIntestinal parasites |
||||||||||||||
|
Country-based (Box 3) |
Schistosoma serology |
Schistosomiasis |
|||||||||||||
|
Malaria thick and thin films and rapid diagnostic test |
Malaria |
||||||||||||||
|
HCV Ab, and HCV RNA if HCV Ab positive |
HCV, also test if risk factors, regardless of country of origin |
||||||||||||||
|
|
|||||||||||||||
|
HBcAb = hepatitis B core antibody. HBsAb = hepatitis B surface antibody. HBsAg = hepatitis B surface antigen. HCV = hepatitis C virus. HCV Ab = hepatitis C antibody. HIV = human immunodeficiency virus. IGRA = interferon-γ release assay. IME = immigration medical examination. LBTI = latent tuberculosis infection. PCR = polymerase chain reaction. TST = tuberculin skin test. * The panel did not reach consensus on these recommendations. See full guideline at http://www.asid.net.au/documents/item/1225 for details. |
|||||||||||||||
Box 3 –
Top 20 countries of origin for refugees and asylum seekers2,3,16 and country-specific recommendations for malaria, schistosomiasis and hepatitis C screening*
|
Country of birth |
Malaria36 |
Schistosomiasis37 |
Hepatitis C†38 |
||||||||||||
|
|
|||||||||||||||
|
Afghanistan |
No |
No |
No |
||||||||||||
|
Bangladesh |
Yes |
No |
No |
||||||||||||
|
Bhutan |
Yes |
No |
No |
||||||||||||
|
Burma |
Yes |
Yes |
No |
||||||||||||
|
China |
No |
No |
No |
||||||||||||
|
Congo |
Yes |
Yes |
Yes |
||||||||||||
|
Egypt |
No |
Yes |
Yes |
||||||||||||
|
Eritrea |
Yes |
Yes |
No |
||||||||||||
|
India |
Yes |
Yes |
No |
||||||||||||
|
Iran |
No |
No |
No |
||||||||||||
|
Iraq |
No |
Yes |
Yes |
||||||||||||
|
Lebanon |
No |
No |
No |
||||||||||||
|
Pakistan |
Yes |
No |
Yes |
||||||||||||
|
Somalia |
Yes |
Yes |
No |
||||||||||||
|
Sri Lanka |
Yes |
No |
No |
||||||||||||
|
Stateless‡ |
Yes |
Yes |
No |
||||||||||||
|
Sudan |
Yes |
Yes |
No |
||||||||||||
|
Syria |
No |
Yes |
Consider |
||||||||||||
|
Vietnam |
No |
No |
No |
||||||||||||
|
|
|||||||||||||||
|
* There are regional variations in the prevalence of these conditions within some countries. We have taken the conservative approach of recommending screening for all people from an endemic country rather than basing the recommendation on exact place of residence. Note that some refugees and asylum seekers may have been exposed during transit through countries not listed here. See full guideline for further details. † People with risk factors for hepatitis C should be tested regardless of country of origin. ‡ “Stateless” in this table refers to people of Rohingyan origin. Adapted from the ASID and RHeaNA Recommendations for comprehensive post-arrival health assessment for people from refugee-like backgrounds (2016; https://www.asid.net.au/documents/item/1225) with permission from ASID. |
|||||||||||||||
The Australasian Diabetes Data Network: first national audit of children and adolescents with type 1 diabetes
The known International diabetes registries report that many young people with type 1 diabetes do not meet recommended targets for glycaemic control. Relevant Australian data have been lacking.
The new 73% of Australian children and adolescents with type 1 diabetes do not meet the recommended target for glycaemic control. Uptake of intensive insulin therapy varies between diabetes centres. Rates of overweight and obesity were higher than for this age group in the general population.
The implications Strategies for improving glycaemic control in young people with diabetes are urgently needed to prevent the acute and chronic complications of this disorder.
Large population-based diabetes registers in several countries have collated data on glycaemic control, management and clinical outcomes for young people with diabetes, facilitating the international benchmarking of paediatric diabetes centres.1 Analysis of these databases has indicated that glycaemic control in many young people with type 1 diabetes is suboptimal; 54–84% do not achieve the internationally established target haemoglobin A1c (HbA1c) level for young people (below 58 mmol/mol).2,3 This statistic has prompted discussion of the evidence-based management of childhood diabetes and the most effective application of emerging therapies. Several registers have reported improved glycaemic control over time,4,5 and it has been proposed that benchmarking activity, consisting of actively identifying problems and adopting systematic improvement methods (including reporting of results by centre), has contributed to improving patient outcomes.5
In Australia, state-based diabetes incidence registers have operated for more than 20 years; the National Diabetes Register (NDR), which sources data from these registers, was established in 1999.6 However, the NDR reports only the overall incidence and prevalence of insulin-treated diabetes in Australia. While a number of paediatric diabetes centres with established clinical databases have reported clinical outcomes for younger patients over recent decades,7–10 there has been no national surveillance of glycaemic control or the management of diabetes in young people. More recently, a national audit of paediatric diabetes centres described variations in staffing and resources, and reported that clinician-to-patient ratios were below recommended levels, particularly in allied health care and psychological services.11
The Australasian Diabetes Data Network (ADDN) is a prospective longitudinal diabetes register that provides the first opportunity for the long term monitoring of diabetes outcomes of a national sample of Australian patients. The ADDN is an initiative of the Australasian Paediatric Endocrine Group (APEG), the Australian Diabetes Society (ADS), and the Juvenile Diabetes Research Foundation Australia Clinical Research Network. The development of the ADDN has been described in detail elsewhere.12 In this article, we report on glycaemic control, anthropometry, and insulin regimens in a cross-section of Australian children and adolescents with type 1 diabetes.
Methods
The ADDN model involves the transfer of de-identified, prospectively collected patient data from the clinical databases or electronic medical record systems of participating ADDN centres to a web-based staging server hosted by the University of Melbourne. Participating centres collect data using a common data dictionary. Data are transferred every 6 months to the ADDN registry from the five largest paediatric diabetes centres in Australia, located in New South Wales, Queensland, South Australia, Victoria and Western Australia.
We analysed data extracted from the ADDN registry for 1 January 2015 – 31 December 2015 for patients who had been diagnosed with type 1 diabetes at least 12 months before their visit to the paediatric diabetes centre, and who were 18 years old or younger at the time of the visit.
Glycaemic control was assessed by measuring HbA1c levels, using either point-of-care or laboratory methods that complied with national accreditation programs for laboratory testing. Body mass index standard deviation scores (BMI-SDS; measures of relative weight adjusted for child age and sex) were calculated from height and weight, using the Centers for Disease Control and Prevention 2000 reference scale for children aged 2–18 years (CDC-2000).13 Children were classified as either normal/underweight, overweight, or obese according to the International Obesity Task Force guidelines.14 Insulin regimens were classified as twice-daily injections (BD), multiple daily injections (MDI; ie, at least three injection times per day), or continuous subcutaneous insulin infusion (CSII). Mean HbA1c levels and BMI-SDS were estimated for each participant over the 12-month study period, with the most recent recorded insulin regimen used for analysis. The descriptive statistics reported are means with standard deviations (SDs) for normally distributed variables and medians with interquartile ranges (IQRs) for skewed data. Statistical analyses were performed in Stata IC 14.0 (StataCorp).
Ethics approval
Ethics approval was granted by the Hunter New England Human Research Ethics Committee (HREC) (for all New South Wales sites: reference, 08/11/19/5.04), the Children’s Health Services Queensland HREC (for all Queensland sites: reference, HREC/09/QRCH/68; amendment: HREC/09/QRCH/68/AM02), the Women’s and Children’s Health Network HREC (for all South Australian sites: reference, REC1048/2/16), the Royal Children’s Hospital HREC (for all Victorian sites: reference, DAF DA032-2014-01), and the Princess Margaret Hospital for Children HREC (for all Western Australian sites: reference, 2013051EP). Informed consent was obtained from parents and from adolescents over 14 years old, and, when required by the HREC, assent was obtained from children aged 10–14 years.
Results
The clinical characteristics of the 3279 children and adolescents meeting the inclusion criteria for whom data were registered in the ADDN registry during 2015 are shown in Box 1, stratified by centre. 52% were boys. Clinical characteristics stratified by age group and insulin regimen are presented in Box 2.
Glycaemic control
The mean number of HbA1c measurements per patient was 3.0 (SD, 1.1); 99% of the patients had at least one recorded HbA1c measurement during 2015. The mean HbA1c level was 67 mmol/mol (SD, 15 mol/mol; Box 1). Mean HbA1c level increased with age, from 63 mmol/mol (SD, 11 mol/mol) in children aged 6 years or under to 69 mmol/mol (SD, 17 mol/mol) in adolescents 14–18 years old (Box 2). Overall, 3% of patients had HbA1c levels greater than 108 mmol/mol; only 27% met the APEG/ADS national guidelines target level of less than 58 mmol/mol,3 and the proportion of children and adolescents meeting this target declined with age, from 34% of those aged 6 years or less to 25% of those aged 14–18 years (Box 3). When stratified by insulin regimen, there was little difference in mean HbA1c level within age groups, but adolescents (14–18 years old) treated with BD insulin had the highest mean HbA1c levels (77 mmol/mol; SD, 19 mmol/mol; Box 2).
Anthropometry
Anthropometric measurements were available for 99% of participants. The mean BMI-SDS was 0.6 (SD, 0.9). Children aged 6 or less had higher BMI-SDS scores than older children and adolescents. The prevalence of being overweight was 25% and of obesity 8%, with the highest proportions in the youngest and the oldest children (Box 1, Box 2).
Insulin regimen
The insulin regimen was recorded for 98% of participants: CSII was used by 44%, MDI by 38%, and BD by 18%. The pattern of insulin regimen use varied between ADDN centres (Box 1) and age groups (Box 2); BD regimens were more frequent in the youngest age groups, with more than one-third of children under 10 using BD insulin therapy.
Discussion
In this first nationwide snapshot of Australian children and adolescents with type 1 diabetes, fewer than one-third had attained the national and international recommended HbA1c target level of less than 58 mmol/mol.2,3 It has been established that the risk of microvascular and macrovascular complications is increased for children and adolescents who do not reach this target; evidence is also emerging that poor glycaemic control in childhood persists into adulthood, increasing the lifetime risk of complications.15 One-third of children and adolescents in our snapshot were overweight or obese, conditions also associated with a greater risk of complications and other comorbidities.16
The proportion of Australian children and adolescents achieving appropriate glycaemic control is comparable with that reported by a number of overseas registries,1 but lower than that in Sweden and Germany, where 41% and 49% respectively achieved the target.4,5 It is concerning that the national median HbA1c level in 2015 was similar to that reported in NSW in 1999 (8.2% = 66 mmol/mol)17 and that the proportion of young people reaching the recommended glycaemic control target in 2015 was similar to that in Brisbane in 1998 (33%).7 Further, our participants were all treated in specialist tertiary referral diabetes centres; as the ADDN database expands to include children from less specialised centres, the characteristics of the participant group may change. Our results indicate a need to substantially improve outcomes, a common theme worldwide.
Managing diabetes in adolescents is particularly challenging for clinicians. Parental involvement in the self-management of diabetes by adolescents often declines at the same time as the changes associated with the metabolic effects of puberty and growth commence. Only one-quarter of the 1425 adolescents (14–18 years) in our study met the recommended target for glycaemic control. We did not assess people over 18, but evidence is emerging that the deterioration of glycaemic control during adolescence continues into early adulthood, and does not improve to recommended levels before age 30;15 limited Australian data also indicate that targets for glycaemic control are not even closely approached by young adults.18
The ADDN centres included in this report are all publicly funded hospitals in metropolitan areas with comparable patient numbers, so we were not surprised to find similar levels of glycaemic control. We had incomplete data about the ethnic background and socio-economic status of the participants, factors known to influence glycaemic control in other populations; children from minority groups or socio-economically disadvantaged backgrounds in the United Kingdom, for example, were reported to have higher HbA1c levels.19 Ideally, the effect of these and other modifiable factors on levels of glycaemic control should be explored using longitudinal data adjusted for confounders. This is one of the major goals of the ADDN, and our report provides important baseline data.
The mean of 3.1 visits by patients to diabetes centres each year is lower than the 3.7 reported by a national audit in 2010.11 HbA1c is assessed routinely during such visits, and the mean annual number of HbA1c measurements was 3.0 per patient in our sample. In a recent report based on data for more than 79 000 patients with diabetes in the UK, less frequent HbA1c assessment was associated with poorer glycaemic control; the optimal frequency was four times per year.20 The ADDN centres included in this report are tertiary referral centres with multidisciplinary diabetes teams, but we did not examine the types of health professional seen by the patient, nor the overall staff structure of the diabetes teams. Nevertheless, limited access to the full range of allied health professionals recommended for the intensive management of diabetes was reported in 2010,11 and the relationship between staffing levels and glycaemic control should be investigated in future analyses.
To reduce the risk of vascular complications, intensive insulin therapy, including MDI or CSII therapy, is recommended for children, adolescents and adults with type 1 diabetes.3 Clinicians must balance this recommendation against individual patient characteristics and the specific clinical situation. In our study, more than one-third of children under 10 years of age were treated with BD insulin therapy. This may reflect the challenges of managing diabetes in the school setting and the capacity of schools to provide adequate support for intensive insulin therapy.21
The overall uptake of CSII in this sample was 44%; the rate varied little between age groups, but differed between ADDN centres. The consistency of CSII uptake across age groups contrasts with a recent report from three registries including data for 54 410 children and adolescents with type 1 diabetes recruited from clinics in Germany and Austria, the United States and the UK.22 In Germany and Austria, about 70% of children under 6 years of age with type 1 diabetes were treated with CSII, compared with 35–40% of older children. In the US, 30% of children under 6 used CSII, compared with 40–45% of older children, while in the UK 15–20% of children across all age groups used CSII. In a pooled cross-sectional analysis of data from the three registries, the mean HbA1c level was 5.5 mmol/mol lower in children and adolescents treated with CSII than in those using insulin injections. Similarly, an Australian study of children and adolescents with type 1 diabetes found a mean reduction of 6.6 mmol/mol HbA1c associated with CSII.23
In our sample, there was little variation in mean HbA1c levels between centres, despite the differing uptake of CSII. However, patient selection bias is possible when comparing outcomes according to their insulin regimens. For example, adolescents with high HbA1c levels may be moved from more intensive treatment to the simpler BD therapy in an attempt to improve glycaemic control. The relationship between HbA1c level and insulin therapy should be examined by multivariable analysis of longitudinal data, with adjustment for potential confounders. The rates of CSII use in different countries may reflect variations in funding models, clinical practice, and patient demand. In Australia, insulin pumps are available to patients with private health insurance, or through a means-tested pump access program administered by Juvenile Diabetes Research Foundation (JDRF) Australia. It would be valuable to further explore the factors that influence choice of therapeutic regimen for Australian children and adolescents with type 1 diabetes.
In our sample, 33% of children and adolescents with type 1 diabetes were overweight or obese, with little difference between ADDN centres. This is higher than the rate (27%) for children and adolescents in the general population.24 Our finding is consistent with the reported rate for children and adolescents under 16 with type 1 diabetes in NSW.25 The youngest children had the highest mean BMI-SDS scores; the proportions who were overweight or obese were highest for the youngest and oldest children. This contrasts with a 2007 report from Victoria that the mean BMI-SDS was lowest (0.64) in children with type 1 diabetes under 5 years of age.26 Healthy weight is an important goal for children and adolescents with type 1 diabetes, as being overweight has implications for long term health. Further, obesity, as a marker of insulin resistance, is associated with early neuropathy16 and retinopathy, as well as with higher HbA1c levels and rates of severe hypoglycaemia.27 The challenges for maintaining healthy weight associated with type 1 diabetes include weight gain as the result of supra-physiological insulin doses, and overeating to avoid or treat hypoglycaemia.
Our survey of glycaemic control involved more than 3000 children and adolescents with type 1 diabetes from diverse geographic regions, but we do not know if our data are representative of all Australian children with type 1 diabetes, as the participants were seen in five large tertiary, city-based diabetes centres. Further, ascertainment of data differed between states: most children with type 1 diabetes in WA are managed at one centre, in contrast to other states, where diabetes care is less centralised. As the ADDN enters phase 2, when it will include regional and remote and adult diabetes centres, the representativeness of the available data will improve.
In conclusion, the ADDN project has shown that benchmarking glycaemic control, use of insulin therapies, and anthropometry across Australian paediatric diabetes centres is feasible. It is worrying that less than one-third of Australian children and adolescents with diabetes type 1 met the recommended target for glycaemic control, and that rates of being overweight or obese were higher than in the general Australian population of children and adolescents. As the ADDN registry grows, so will its ability to explore and understand the factors that influence clinical outcomes for Australian children and adolescents, supporting our aim of continually appraising and improving the diabetes services we provide.
Box 1 –
Clinical characteristics of Australian children and adolescents with type 1 diabetes, as registered in the Australasian Diabetes Data Network (ADDN) registry during 2015, by ADDN centre
|
|
All centres |
Australasian Diabetes Data Network centre |
|||||||||||||
|
New South Wales |
Queensland |
Western Australia |
Victoria |
South Australia |
|||||||||||
|
|
|||||||||||||||
|
Number of children and adolescents |
3279 |
614 |
382 |
832 |
927 |
524 |
|||||||||
|
Age (years), mean (SD) |
12.8 (3.7) |
13.0 (3.5) |
12.0 (3.4) |
12.8 (3.7) |
13.0 (3.8) |
12.4 (3.8) |
|||||||||
|
Sex (male) |
1705 (52%) |
315 (51%) |
202 (53%) |
419 (50%) |
484 (52%) |
285 (54%) |
|||||||||
|
Duration of diabetes (years), mean (SD) |
5.7 (3.7) |
6.3 (3.7) |
4.8 (3.4) |
5.8 (3.8) |
5.8 (3.6) |
5.6 (3.8) |
|||||||||
|
Number of visits to centre, mean (SD) |
3.1 (1.1) |
3.2 (1.4) |
3.0 (1.2) |
3.4 (1.1) |
3.0 (0.9) |
3.0 (1.1) |
|||||||||
|
Number of HbA1c measurements, mean (SD) |
3.0 (1.1) |
3.1 (1.3) |
2.8 (1.1) |
3.3 (1.0) |
2.9 (0.9) |
2.9 (1.1) |
|||||||||
|
HbA1c level (mmol/mol), mean (SD) |
67 (15) |
69 (16) |
67 (15) |
66 (16) |
66 (13) |
70 (15) |
|||||||||
|
HbA1c level (mmol/mol), median (IQR) |
65 (58–74) |
66 (59–77) |
65 (57–73) |
63 (55–71) |
64 (58–71) |
67 (61–78) |
|||||||||
|
HbA1c level < 58 mmol/mol |
876 (27%) |
145 (24%) |
103 (27%) |
300 (36%) |
242 (26%) |
86 (16%) |
|||||||||
|
Body mass index–standard deviation score, mean (SD) |
0.6 (0.9) |
0.7 (0.9) |
0.6 (0.9) |
0.5 (0.9) |
0.8 (0.9) |
0.6 (0.9) |
|||||||||
|
Underweight/normal weight* |
2168 (67%) |
391 (64%) |
256 (68%) |
604 (73%) |
560 (61%) |
357 (69%) |
|||||||||
|
Overweight* |
828 (25%) |
159 (26%) |
85 (23%) |
191 (23%) |
263 (29%) |
130 (25%) |
|||||||||
|
Obese* |
257 (8%) |
60 (10%) |
34 (9%) |
36 (4%) |
98 (10%) |
29 (6%) |
|||||||||
|
Insulin regimen |
|
|
|
|
|
|
|||||||||
|
Two injections per day |
564 (18%) |
12 (2%) |
12 (4%) |
124 (15%) |
352 (38%) |
64 (12%) |
|||||||||
|
Three or more daily injection times |
1219 (38%) |
227 (37%) |
171 (52%) |
339 (41%) |
299 (32%) |
183 (35%) |
|||||||||
|
Continuous subcutaneous insulin infusion pump |
1428 (44%) |
373 (61%) |
144 (44%) |
368 (44%) |
269 (29%) |
274 (53%) |
|||||||||
|
|
|||||||||||||||
|
* Defined according to International Obesity Task Force guidelines, adjusted for age (2–18 years of age) and sex. |
|||||||||||||||
Box 2 –
Clinical characteristics of Australian children and adolescents with type 1 diabetes, as registered in the Australasian Diabetes Data Network registry during 2015, by age group and insulin regimen
|
|
Average age over 12 months (2015) |
||||||||||||||
|
≤ 6 years |
< 6–10 years |
> 10–14 years |
> 14–18 years |
||||||||||||
|
|
|||||||||||||||
|
Number of children and adolescents (proportion of all participants) |
185 (6%) |
575 (18%) |
1094 (33%) |
1425 (44%) |
|||||||||||
|
Sex (male) |
109 (59%) |
308 (54%) |
540 (49%) |
748 (52%) |
|||||||||||
|
Duration of diabetes (years), mean (SD) |
2.2 (1.0) |
3.7 (2.0) |
5.3 (3.1) |
7.4 (4.0) |
|||||||||||
|
Insulin regimen |
|
|
|
|
|||||||||||
|
Two injections per day |
61 (34%) |
193 (34%) |
162 (15%) |
148 (10%) |
|||||||||||
|
Three or more daily injection times |
41 (23%) |
124 (22%) |
396 (37%) |
658 (46%) |
|||||||||||
|
Continuous subcutaneous insulin infusion pump |
79 (43%) |
243 (44%) |
510 (48%) |
596 (43%) |
|||||||||||
|
HbA1c level (mmol/mol), mean (SD) |
|
|
|
|
|||||||||||
|
All regimens |
63 (11) |
62 (10) |
68 (14) |
69 (17) |
|||||||||||
|
Two injections per day |
65 (12) |
64 (11) |
70 (15) |
77 (19) |
|||||||||||
|
Three or more daily injection times |
63 (10) |
63 (10) |
69 (15) |
70 (17) |
|||||||||||
|
Continuous subcutaneous insulin infusion pump |
62 (9) |
60 (8) |
66 (11) |
67 (15) |
|||||||||||
|
HbA1c < 58 mmol/mol |
62 (34%) |
202 (35%) |
260 (24%) |
352 (25%) |
|||||||||||
|
Body mass index–standard deviation score, mean (SD) |
1.0 (0.9) |
0.6 (0.7) |
0.5 (0.9) |
0.7 (0.9) |
|||||||||||
|
Underweight/normal weight* |
112 (61%) |
436 (76%) |
753 (69%) |
867 (61%) |
|||||||||||
|
Overweight* |
56 (31%) |
107 (19%) |
261 (24%) |
404 (29%) |
|||||||||||
|
Obese* |
15 (8%) |
32 (6%) |
70 (7%) |
140 (10%) |
|||||||||||
|
|
|||||||||||||||
|
* Defined according to International Obesity Task Force guidelines, adjusted for age (2–18 years of age) and sex. |
|||||||||||||||
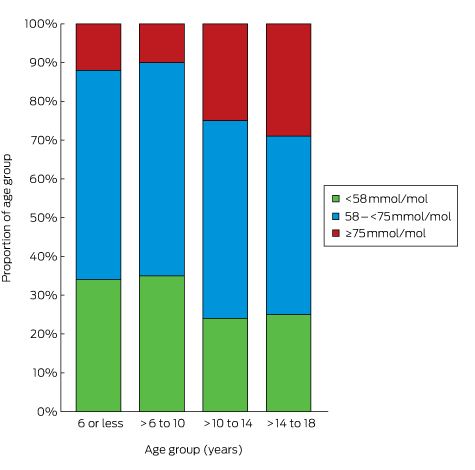
Dangerous toys: the expanding problem of water-absorbing beads
Water-absorbing beads are made from superabsorbent polymer, and can swell to 400 times their original size when immersed in water. They begin as small pellets (1–15 mm) but expand to as much as 6 cm in diameter (Box 1).1,2 Water beads have been marketed for some time for decorative and horticultural purposes, but have recently been promoted as toys (fairy eggs, dragon eggs, jelly beads, water orbs, hydro orbs, polymer beads, gel beads) and as learning aids for autistic children. Due to their progressive expansion after being immersed in fluids, they present a unique foreign body challenge. While most objects that pass the pylorus will also pass through the rest of the gastrointestinal tract, water-absorbing beads that pass the pylorus can later pose an obstruction risk as they swell. There have been reports of serious bowel obstruction (including one death) in children ingesting water beads.1,3,4
We examined cases reported to the New South Wales Poisons Information Centre (NSWPIC) in which children (0–14 years old) had ingested water beads. The NSWPIC database has been described previously.5 We extracted cases for a 12.5-year period (January 2004 – June 2016) in which “bead” or “ball” was mentioned in the substance field, and then manually reviewed records for inclusion. Ethics approval was obtained from the Human Research Ethics Committee of the Sydney Children’s Hospitals Network (reference, LNR/16/SCHN/44).
Since 2004, 129 incidents involving water-absorbing beads were reported to the NSWPIC. Call numbers have increased rapidly in recent years, with 112 exposures (87%) occurring since 2013 (Box 2). Age was recorded in 117 cases; the median was 24 months (interquartile range, 18–48 months). Fifty per cent of the patients (65) were boys, 46% (59) were girls, and sex was not recorded for five cases. Three children were documented as having autism. Most cases were managed at home, with callers advised to watch for signs of obstruction, but 16 calls originated from hospitals, while a further five patients were referred to hospital. Ten children had symptoms suggesting possible obstruction (vomiting, abdominal pain, constipation) that developed between 6 hours and 5 days after ingestion.
Our study indicates that water beads are an emerging foreign body risk to Australian children. The Australian Competition and Consumer Commission has issued a warning, urging companies not to market water beads as toys, and alerting consumers of the risks.2 While the polymer is non-toxic, it is important for clinicians to recognise the unique challenge posed by these products. They are radiolucent, but other imaging modalities, including ultrasound and computed tomography, are potential options for their detection.1 The NSWPIC does not routinely make follow-up calls, so the outcomes of the cases described here are unknown, but serious complications have been reported in other cases, including water beads lodged in the jejunum1 or distal ileum3 requiring surgical removal. A 6-month-old infant with a jejunal obstruction underwent surgical removal, but developed an anastomotic leak and died of sepsis.4 Patients ingesting multiple or larger sized beads are at increased risk of obstruction, and early hospital referral should be considered. Any patient who has ingested a water bead and has gastrointestinal symptoms should be assessed for potential obstruction.
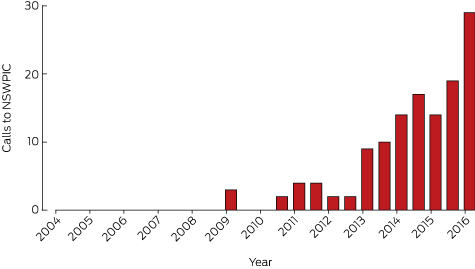
[Editorial] Climate and health: joining up the pieces, scaling up the action
On Oct 18, the UK Health Alliance on Climate Change published its inaugural report, A Breath of Fresh Air, Addressing Climate Change and Air Pollution Together for Health. The report builds on the Royal College of Physicians and Royal College of Paediatrics and Child Health report Every Breath We Take, published February, 2016.
Improving maternity services for Indigenous women in Australia: moving from policy to practice
The disparities in health outcomes between Aboriginal and Torres Strait Islander (hereafter called Indigenous) and non-Indigenous Australians are well established, with the life expectancy gap being among the worst in the world.1 There is growing evidence that the chronic diseases that are prevalent in Indigenous Australian adults (diabetes, hypertension, cardiovascular and renal disease) have their genesis in utero and in early life.2,3 One of the greatest medical threats to the wellbeing of Indigenous children is being born preterm or at a low birthweight (LBW). Australian Indigenous babies are almost twice as likely to be born LBW than Australian non-Indigenous babies or Indigenous babies from similar countries (Box). Other contributors to poor outcomes include the enduring effects of colonisation, social exclusion, sustained institutionalised racism, and stark inequities across many of the social determinants of health, including income, employment, education, and access to goods, services and health care.6,7
Australia’s National Maternity Services Plan (NMSP) states that Australia is “one of the safest countries in the world in which to give birth or to be born. However, this is not the case for Aboriginal and Torres Strait Islander people.”8 The NMSP was based on an extensive review of maternity services.9 It set out a 5-year vision for the years 2010–2015, and a framework for implementation with the federal, state and territory governments endorsing the plan and committing to long term improvements, investments and service developments under four key areas: access, service delivery, workforce and infrastructure. Actions for the initial, middle and later years were identified, as were indicators to measure the signs of success. The NMSP identified three priority areas for Indigenous women: (i) increasing the Indigenous workforce; (ii) increasing culturally competent maternity care; and (iii) developing dedicated programs for Birthing on Country.8
We reviewed government documents that are freely available and related to the NMSP, including annual reports.10–12 We included relevant literature published since the release of the Review of Maternity Services in 2009,9 and other literature related to maternity services for Indigenous women. We examined the four key areas in relation to the priority areas for Indigenous women. We note that the NMSP did result in additional benefits to all Australian women that are not detailed in our review, for example the development of the National Evidence-Based Antenatal Care Guidelines.
Priority 1: The Indigenous maternity workforce
Action 3.2 of the NMSP was to develop and support an Indigenous maternity workforce across all disciplines and qualifications, and to provide more scholarships (such as the Puggy Hunter Memorial Scheme) to facilitate this action. Small one-off initiatives are seeing slow progress in this area with some jurisdictions doing better than others. In 2015, there were 230 Indigenous midwives nationally, comprising only 1% of the midwife population, while Indigenous Australians constitute 3% of the population and 6% of all Australian births.13 Additionally there is a marked drop-out of midwifery graduates from clinical roles soon after graduation, and this highlights a need for ongoing support.14
Across Australia, we are seeing an increasing number of maternity models that recognise the contribution of Indigenous workers who have a variety of titles and job descriptions. Some recognise the importance and cultural expertise of elders and grandmothers like the Strong Women Workers,15 while others aim to provide women support through bicultural partnerships between midwives and maternal infant health workers,14–19 with some supporting Indigenous student midwives (Appendix). This is a positive start that needs dedicated funding for scaling up and monitoring. In Canada, the Inuit have managed this in very remote settings,20 but we see little of this in Australia. Increasing the Indigenous workforce is likely to increase the cultural competence of the whole workforce and the workplace.14
Priority 2: Culturally competent maternity care
Action 2.2 of the NMSP was to develop and expand culturally competent maternity care for Indigenous Australians. Cultural competency is best comprehended as a philosophy and paradigm for transformational heath practice. Importantly, the ideologies with cultural competence, safety, security and respect are to embed knowledge, skills and values to create change to enable culturally responsive and informed care. Evidence from America has shown that the use of this approach in government-funded agencies has improved the knowledge and attitudes of health professionals working with clients from marginalised groups, whose disparities are costing health services greatly.21 The NMSP tackled this by commissioning a literature review to document the characteristics of culturally competent maternity care and draft indicators for measurement.22 Further work was to develop mechanisms for evaluating cultural competence in maternity care and undertake a national stocktake of access to culturally competent maternity care; both have yet to be completed. However, the establishment of the National Centre for Cultural Competence, a joint venture of the Australian Government and the University of Sydney, is likely to have an impact nationally with online and workshop cultural competency training and resources available for a broad audience. Additionally, the Congress of Aboriginal and Torres Strait Islander Nurses and Midwives provide face-to-face health-specific training in cultural safety.
Cultural competency education and training is a strategy aimed at addressing health disparities, although further development and work are required to appreciate the most effective methods, the flow-on effect of training to patients, and the best tools for measuring cultural competence in individuals, organisations and in the maternity setting.21–23 Critically, “racism constitutes a ‘double burden’ for Indigenous Australians, encumbering their health as well as access to effective and timely health care services.”24 Achieving culturally competent maternity services is key to improving maternity care and good health for mothers and babies.25
Another emerging area in developing a cultural competent workforce is that of trauma-informed care and practice, whereby care providers understand the ongoing impact of intergenerational trauma resulting from historical injustices, colonisation, removal from and dispossession of land, and continuing racism.26 This is particularly important given that Indigenous children are overrepresented in out-of-home care compared with non-Indigenous children (nine times higher; 35%27), with some women encountering the child protection system during pregnancy, leading to the removal of their babies at birth. This is an incredibly distressing situation for all involved, but most particularly the mother. Redirecting funding from removal to supporting vulnerable families would see greater short and long term benefits.
Although maternity services in Australia are designed to offer women the best care, they largely reflect modern western medical values and perceptions of health, risk and safety.28 This is unlike the Indigenous world view, reflected in their definition of health, which incorporates not just physical wellbeing, but also the social, emotional and cultural wellbeing of individuals and the whole community.7
Maternity systems have failed to incorporate the evidence provided by Indigenous women on the impact of social risks that include cultural risk (eg, the belief that not being born on their land threatens claims to land rights) and emotional risks (having to spend weeks removed from family and other children while awaiting birth).29,30 Recent empirical work in Australia reconfirms that these risks are still valid, highlighting that they not only cause distress to women and families, but also increase clinical and medical risks (eg, women not attending antenatal care, or presenting late in labour, to avoid being flown out of their community for birth); this is a factor not well understood by health service leaders.28 The risks are greater for Indigenous women from remote and very remote communities, some of whom feel that giving birth in hospitals, many miles from their home, may be the cause of ill health as it breaks the link between strong culture, strong health and the land, a link that is strengthened during birth.31 While away from community and other children awaiting the birth, pregnant women are susceptible to anxiety, stress and depression, and often have particular concerns that their other children may be vulnerable to child protection services in their absence.30
We acknowledge the importance of clinical and medical risk, but suggest that the definition of risk needs be broader, to incorporate the social (cultural, emotional and spiritual) risks as valid and important dimensions of risk assessment requiring risk management processes. For example, when women need to leave their community for specialist care, strategies to ensure her other children are safe, or can travel with her, must be implemented as part of the risk management process. The disconnection between social, cultural and spiritual risk and western clinical and medical biophysical risk is a critical and understudied phenomenon that needs further work.
Priority 3: Dedicated programs for “Birthing on Country”
Action 1.4 of the NMSP was to increase access to high quality maternity care for women and their family members in remote Australia. Twenty-four per cent of Indigenous women who give birth each year live in remote and very remote Australia (versus 2% of non-Indigenous women), highlighting the importance of services in these areas. Although there has been some improvement in pregnancy care in some communities,32 empirical studies continue to report the challenges of providing maternity services in these areas, a lack of regular access to midwifery care and suboptimal quality of care caused by the lack of a systematic approach, appropriate clinical governance and cultural competence among health care providers.18,33,34 One approach to solving this in some of the larger remote and very remote communities is to establish Birthing on Country sites.
Action 2.2.3 of the Plan addressed Birthing on Country, which was defined as maternity services designed and delivered for Indigenous women that encompassed some or all of the following elements:
-
were community based or governed;
-
incorporated traditional practice;
-
recognised the connection with land and country;
-
incorporated a holistic definition of health;
-
valued both Indigenous and non-Indigenous ways of knowing, learning and risk assessment; and;
-
were culturally competent and developed by, or with, Indigenous people.35
The Maternity Services Inter-Jurisdictional Committee brokered a literature review of Birthing on Country programs in Australia, New Zealand, Canada and America to determine if any had made a significant improvement to outcomes. The review found a number of programs met the criteria, but there was a dearth of high quality research, with most studies having short term evaluations, small numbers and potential selection bias. Despite this, some programs show significant improvements in antenatal attendance, screening and treatment; immunisation rates; mean birth weight; reduced preterm birth and cost; and women report increased satisfaction (see full report35 for details, and the Appendix to this article for examples).
The Inuit model in Northern Quebec provided the most robust evidence of an “exemplar model”, where three Birthing on Country services operate in places that are many hours by plane from facilities where caesarean delivery can be performed. These facilities meet community expectations, address clinical/medical, social/cultural, spiritual and emotional risks and have improved maternal and infant health outcomes while supporting local midwifery training.20 Increasing numbers of these services are operating in Canada, with some having been sustainable since the mid-1980s and early 1990s.20 The benefits of community-based birthing services, over and above the improvements in maternal infant health outcomes, include community healing, comprehensive tailored care, support of the community, local training and employment and reduced family separation at critical times.20 The evidence suggested that a Birthing on Country model of maternity care would most likely produce significantly improved outcomes for Indigenous women in very remote through to urban areas.35
The review was followed by a national Birthing on Country workshop, facilitated by the Maternity Services Inter-Jurisdictional Committee and Congress Alukura in Alice Springs in 2012. Participants voiced concern that “Birthing on Country”, as a term, lacked clarity which may have contributed to a lack of engagement from key service providers and government departments. Nevertheless, participants proposed that Birthing on Country be retained and understood as “a metaphor for the best start in life for Aboriginal and Torres Strait Islander babies and their families, an appropriate transition to motherhood and parenting for women, and an integrated, holistic and culturally appropriate model of care.”36 The middle and later years of the NMSP were to see Birthing on Country programs developed and evaluated, with the workshop recommending that “exemplar sites” be established in urban, rural, remote and very remote areas to deliver “… not only bio-physical outcomes … it’s much, much broader than just the labour and delivery … [Birthing on Country] deals with socio-cultural and spiritual risk that is not dealt with in the current systems”36
Birthing on Country in remote and very remote Australia
Despite policy frameworks that support primary maternity services delivering culturally competent care closer to home,7,8,37 demand from Indigenous women and communities,38,39 and multiple recommendations over 25 years,8,38–41 there has been no progress towards establishing and evaluating Birthing on Country services in remote or very remote Australia. In these areas, such services would need to be Primary Maternity Units or Services, which are defined in the National Maternity Services Capability Framework42 (Action 4.2.2 of the Plan saw the development of this Framework) as Level 2 services. Internationally, there is strong empirical evidence that Primary Maternity Units/Services provide safe perinatal care for women classified as being at low risk of complications,43,44 including in rural and remote areas.20,45 Despite this, few such services operate in Australia (3 urban/regional; 17 rural; 0 remote),46 reflecting a centralisation of services, a lack of medical support in some cases, safety and sustainability concerns in others.44,47 In fact, Australia has seen a 41% decline in maternity services over the 20 years from 1992 to 2011, especially in rural areas, correlating with a 47% increase in unplanned out-of-hospital births (22 814 births).48 There is an unequivocal relationship between distance to maternity services and poorer clinical49 and psychosocial outcomes.50,51 This lends support to the argument to prioritise Birthing on Country models in remote and very remote areas, where some of the most disadvantaged women in Australia live the furthest from maternity services.
Determining the appropriate level of maternity services that are safe and will be sustainable in a given location is challenging. Action 4.2.1 in the NMSP was to develop rigorous methods to help with planning maternity care in rural and remote communities. This work was completed with the development of the Australian Rural Birth Index, which can be used to determine the appropriate level of maternity service for a community, based on the average number of births in a community, the vulnerability of the community, and distance to a facility that can perform caesarean delivery.52 The work accompanying this project found disparities in access to services across Australia and minimal adjustment for the needs of vulnerable, rural and remote populations. Additionally, the project identified that the perceived risks to health services of operating services in remote areas is given priority over the clinical and social risks experienced by families (when they do not have local maternity services).28
Where to from here?
The Review of Maternity Services outlined serious challenges that needed attention in Australia and recognised a clear role for leadership by the Australian Government in concert with state and territory governments.9 The NMSP was developed to address these issues and to measure progress.8 There is little doubt that it resulted in the strengthening of maternity services in some areas. Additionally, three National Health and Medical Research Council Partnership projects are advancing Birthing on Country in urban areas. In Perth, there is a project exploring the Cultural Security of Aboriginal Birthing Women;53 in Melbourne, the Aboriginal Community Controlled Health Organisations (ACCHOs) and three large hospitals are offering all Indigenous women one-on-one midwifery care with a known midwife antenatally, in labour and up to 6 weeks postnatally;54 and, in Brisbane, one of us (S K) is working with two ACCHOs and two large maternity hospitals to develop and evaluate an Urban Birthing on Country service model. Several jurisdictions are developing models incorporating some of the principles of Birthing on Country; most are successfully engaging pregnant women earlier and more often than standard care, and early evaluations are starting to show improved outcomes (Appendix).
We must not lose this momentum. It is time for a new maternity services plan with high level monitoring to continue to tackle emerging priorities and complete unfinished business, particularly for Indigenous women in rural and remote communities. Three professional organisations (the Australian College of Midwives, the Congress of Aboriginal and Torres Strait Islander Nurses and Midwives and the Remote Health Organisation, CRANAplus) have released a position statement calling for action,55 and recommending the Australian government show leadership and develop a strategic approach to implementing and evaluating Birthing on Country programs. We believe that leadership in this area must continue to come from the Australian government, with greater urgency than has been evident to date. Dedicated funding must be allocated towards supporting the Indigenous maternity workforce, developing and measuring culturally competent care and establishing Birthing on Country sites in urban, rural and particularly in remote and very remote communities. This recommendation is based on international evidence that already exists, and government funding should extend to generating further evidence so the lessons learned can be applied to sites elsewhere.