A 26-year-old man was referred to the ophthalmology department with a 1-week history of blurred vision of the left eye; there was no pain or redness. Ophthalmological examination found unilateral choriocapillaropathy with optic nerve oedema. He was in a stable relationship and had not travelled abroad recently, nor had he been in contact with any animals or pets. He had a history of ulcerative colitis diagnosed 2 years earlier for which he was treated for 1 year with azathioprine and oral corticosteroids.
Preference: Ophthalmology
754
How eye disorders have influenced the work of famous painters
Vision is an important tool when creating a painted artwork. Vision is used to survey a scene, guide the artist’s movements over the canvas and provide feedback on the colour and form of the work. However, it’s possible for disease and disorders to alter an artist’s visual perception.
There is a long history of scientists and clinicians arguing particular artists were affected by vision disorders, based on signs in their works. Some argued the leaders of the Impressionist movement were short-sighted, for instance, and that their blurry distance vision when not using spectacles may explain their broad, impetuous style.
Supporting evidence of such disorders and their influence on artworks is often speculative, and hampered by a lack of clinical records to support the diagnosis. A particular challenge to verifying these speculations is that artists are, of course, free to represent the world in whatever fashion they like.
So, is a particular style the result of impoverished vision, or rather a conscious artistic choice made by the artist? Here are three artists who it has been claimed suffered vision impairments.
El Greco
Architect, painter and sculptor of the Spanish Renaissance, El Greco (1541-1614) is known for vertically elongating certain figures in his paintings. In 1913, ophthalmologist Germán Beritens argued this elongation was due to astigmatism.

Wikimedia Commons
Astigmatism typically results when the cornea – the front surface of the eye and the principal light-focusing element – is not spherical, but shaped more like a watermelon.
This means the light bends in different amounts, depending on the direction in which it’s passing through the eye. Lines and contours in an image that are of a particular orientation will be less in focus than others.
But there are several problems with Beriten’s theory. A common objection is that any vertical stretching should have affected El Greco’s view of both the subject being painted and the canvas being painted on. This would mean the astigmatism effects should largely cancel out. Possibly more problematic is that uncorrected astigmatism mainly causes blurry vision, rather than a change in image size.Beritens would demonstrate his astigmatism theory to house guests using a special lens that produced El Greco-like vertical elongations.
Plus, other evidence suggests El Greco’s use of vertical elongation was a deliberate artistic choice. For example, in his 1610 painting, St Jerome as Scholar (above), the horizontally oriented hand of the saint is also elongated, just like the figure. If El Greco’s elongated figures were due to a simple vertical stretching in his visual perception, we would expect the hand to look comparatively stubby.
Claude Monet
Elsewhere, the influence of eye anomalies in artworks is more compelling. Cataracts are a progressive cloudiness of the lens inside the eye, producing blurred and dulled vision that can’t be corrected with spectacles.
Cataracts are often brown, which filter the light passing through them, impairing colour discrimination. In severe cases, blue light is almost completely blocked.
Claude Monet was diagnosed with cataracts in 1912, and recommended to undergo surgery. He refused. Over the subsequent decade, his ability to see critical detail reduced, as is documented in his medical records.

Wikimedia Commons
Importantly, his colour vision also suffered. In 1914, he noted how reds appeared dull and muddy, and by 1918 he was reduced to selecting colours from the label on the paint tube.
The visual impact of his cataracts is demonstrated in two paintings of the same scene: the Japanese footbridge over his garden’s lily pond. The first, painted ten years prior to his cataract diagnosis, is full of detail and subtle use of colour.
In contrast, the second – painted the year prior to his eventually relenting to surgery – shows colours to be dark and murky, with a near absence of blue, and a dramatic reduction in the level of painted detail.

Wikimedia Commons
There is good evidence such changes were not a conscious artistic choice. In a 1922 letter to author Marc Elder, Monet confided he recognised his visual impairment was causing him to spoil paintings, and that his blindness was forcing him to abandon work despite his otherwise good health.
One of Monet’s fears was that surgery would alter his colour perception, and indeed after surgery he complained of the world appearing too yellow or sometimes too blue. It was two years before he felt his colour vision had returned to normal.
Experimental work has confirmed colour perception is measurably altered for months after cataract surgery, as the eye and brain adapt to the increased blue light previously blocked by the cataract.
Clifton Pugh
In addition to eye disease, colour vision can be altered by inherited deficiencies. Around 8% of men and 0.5% of women are born with abnormal colour vision – sometimes erroneously called “colour blindness”.
In one of its most common severe forms, people see colours purely in terms of various levels of blue and yellow. They can’t distinguish colours that vary only in their redness or greenness, and so have trouble distinguishing ripe from unripe fruit, for example.
It has been argued no major artist is known to have abnormal colour vision. But subsequent research argues against this.
Australian artist Clifton Pugh can readily lay claim to the title of “major artist”: he was three-times winner of the Archibald Prize for Portraiture, is highly represented in national galleries, and even won a bronze medal for painting at the Olympics (back when such things were possible).
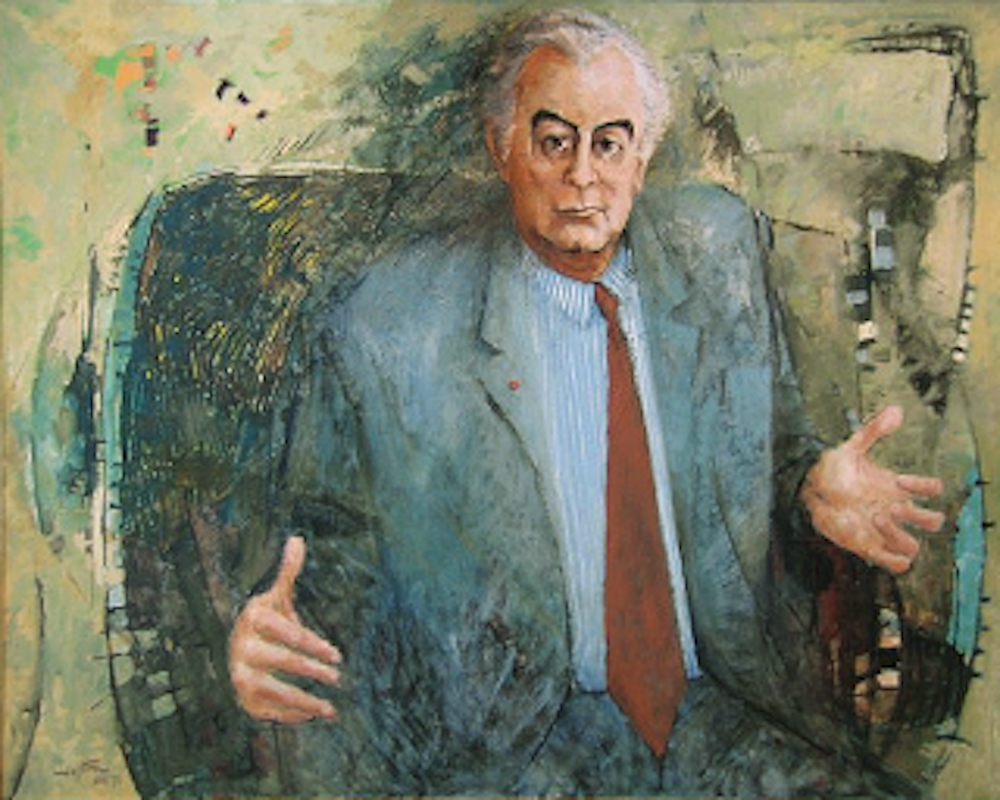
Low res version of Gough Whitlam, 1972/Wikimedia Commons.
His abnormal colour vision is well documented in biographical information. Owing to the inherited nature of colour vision deficiencies, researchers were able to test the colour vision of surviving family members to support their case that Pugh almost certainly had a severe red-green colour deficiency.
![]() But an analysis of the colours used in Pugh’s paintings failed to reveal any signatures that would suggest a colour vision deficiency. This is consistent with previous work, demonstrating it was not possible to reliably diagnose a colour vision deficiency based on an artist’s work.
But an analysis of the colours used in Pugh’s paintings failed to reveal any signatures that would suggest a colour vision deficiency. This is consistent with previous work, demonstrating it was not possible to reliably diagnose a colour vision deficiency based on an artist’s work.
Andrew Anderson, Associate Professor, Department of Optometry & Vision Sciences, University of Melbourne
This article was originally published on The Conversation. Read the original article.
AMA shines in Australia Day Honours
Former Australian Medical Association President Dr Mukesh Haikerwal has been awarded the highest honour in this year’s Australia Day awards by being named a Companion of the Order of Australia (AC).
He is accompanied by the current Editor-in-Chief of the Medical Journal of Australia, Laureate Professor Nick Talley, as well as longstanding member Professor Jeffrey Rosenfeld – who both also received the AC.
The trio top a long and impressive list of AMA members to receive Australia Day Honours this year.
AMA Federal Councillor, Associate Professor Julian Rait, received the Medal of the Order (OAM).
A host of other members honoured in the awards are listed below.
AMA President Dr Michael Gannon said the accolades were all well-deserved and made he made special mention of those receiving the highest Australia Day Honours.
“They have dedicated their lives and careers to helping others through their various roles as clinicians, researchers, teachers, authors, administrators, or government advisers – and importantly as leaders in their local communities,” Dr Gannon said.
“On behalf of the AMA, I pay tribute to all the doctors and other health professionals who were honoured today for their passion for their profession and their dedication to their patients and their communities.
“The great thing about the Honours is that they acknowledge achievement at the international, national, and local level, and they recognise excellence across all avenues of human endeavour.
“Doctors from many diverse backgrounds have been recognised and honoured again this year.
“There are pioneering surgeons and researchers, legends across many specialties, public health advocates, researchers, administrators, teachers, and GPs and family doctors who have devoted their lives to serving their local communities.
“The AMA congratulates all the doctors and other health advocates whose work has been acknowledged.
“We are, of course, especially proud of AMA members who are among the 75 people honoured in the medicine category.”
Dr Haikerwal, who was awarded the Officer in the Order of Australia (AO) in 2011, said this further honour was “truly mind-blowing” and another life-changing moment.
“To be honoured on Australia Day at the highest level in the Order of Australia is beyond imagination, beyond my wildest dreams and extremely humbling,” Dr Haikerwal said.
“For me to be in a position in my life and career to receive such an honour has only been made possible due to the unflinching support and unremitting encouragement of my closest circle, the people who have been with me through every step of endeavour, adversity, achievement, and success.”
CHRIS JOHNSON
AMA MEMBERS IN RECEIPT OF HONOURS
COMPANION (AC) IN THE GENERAL DIVISION
Dr Mukesh Chandra HAIKERWAL AO
Altona North Vic 3025
For eminent service to medical governance, administration, and technology, and to medicine, through leadership roles with a range of organisations, to education and the not-for-profit sector, and to the community of western Melbourne.
Professor Jeffrey Victor ROSENFELD AM
Caulfield North, Vic
For eminent service to medicine, particularly to the discipline of neurosurgery, as an academic and clinician, to medical research and professional organisations, and to the health and welfare of current and former defence force members.
Professor Nicholas Joseph TALLEY
Black Hill, NSW
For eminent service to medical research, and to education in the field of gastroenterology and epidemiology, as an academic, author and administrator at the national and international level, and to health and scientific associations.
OFFICER (AO) IN THE GENERAL DIVISION
Emeritus Professor David John AMES
East Kew, Vic
For distinguished service to psychiatry, particularly in the area of dementia and the mental health of older persons, as an academic, author and practitioner, and as an adviser to professional bodies.
Dr Peggy BROWN
Sanctuary Cove, Qld
For distinguished service to medical administration in the area of mental health through leadership roles at the state and national level, to the discipline of psychiatry, to education, and to health care standards.
Professor Creswell John EASTMAN AM
St Leonards, NSW
For distinguished service to medicine, particularly to the discipline of pathology, through leadership roles, to medical education, and as a contributor to international public health projects.
Professor Suzanne Marie GARLAND
Docklands, Vic
For distinguished service to medicine in the field of clinical microbiology, particularly to infectious diseases in reproductive and neonatal health as a physician, administrator, researcher and author, and to professional medical organisations.
Dr Paul John HEMMING
Queenscliff, Vic
For distinguished service to higher education administration, to medicine through contributions to a range of professional medical associations, and to the community of central Victoria, particularly as a general practitioner.
Professor Anthony David HOLMES
Melbourne, Vic
For distinguished service to medicine, particularly to reconstructive and craniofacial surgery, as a leader, clinician and educator, and to professional medical associations.
Dr Diana Elaine O’HALLORAN
Glenorie, NSW
For distinguished service to medicine in the field of general practice through policy development, health system reform and the establishment of new models of service and care.
MEMBER (AM) IN THE GENERAL DIVISION
Dr Michael Charles BELLEMORE
Croydon, NSW
For significant service to medicine in the field of paediatric orthopaedics as a surgeon, to medical education, and to professional medical societies.
Dr Colin Ross CHILVERS
Launceston, Tas
For significant service to medicine in the field of anaesthesia as a clinician, to medical education in Tasmania, and to professional societies.
Associate Professor Peter HAERTSCH OAM
Breakfast Point, NSW
For significant service to medicine in the field of plastic and reconstructive surgery as a clinician and administrator, and to medical education.
Professor Ian Godfrey HAMMOND
Subiaco, WA
For significant service to medicine in the field of gynaecological oncology as a clinician, to cancer support and palliative care, and to professional groups.
Dr Philip Haywood HOUSE
WA
For significant service to medicine as an ophthalmologist, to eye surgery foundations, and to the international community of Timor Leste.
Adjunct Professor John William KELLY
Vic
For significant service to medicine through the management and treatment of melanoma, as a clinician and administrator, and to education.
Dr Marcus Welby SKINNER
West Hobart, Tas
For significant service to medicine in the field of anaesthesiology and perioperative medicine as a clinician, and to professional societies.
Professor Mark Peter UMSTAD
South Yarra, Vic
For significant service to medicine in the field of obstetrics, particularly complex pregnancies, as a clinician, consultant and academic.
Professor Barbara S WORKMAN
East Hawthorn, Vic
For significant service to geriatric and rehabilitation medicine, as a clinician and academic, and to the provision of aged care services.
MEDAL (OAM) IN THE GENERAL DIVISION
Professor William Robert ADAM PSM
Vic
For service to medical education, particularly to rural health.
Dr Marjorie Winifred CROSS
Bungendore, NSW
For service to medicine, particularly to doctors in rural areas.
Associate Professor Mark Andrew DAVIES
Maroubra, NSW
For service to medicine, particularly to neurosurgery.
Dr David William GREEN
Coombabah, Qld
For service to emergency medicine, and to professional organisations.
Dr Barry Peter HICKEY
Ascot, Qld
For service to thoracic medicine.
Dr Fred Nickolas NASSER
Strathfield, NSW
For service to medicine in the field of cardiology, and to the community.
Dr Ralph Leslie PETERS
New Norfolk, Tas
For service to medicine, and to the community of the Derwent Valley.
Associate Professor Julian Lockhart RAIT
Camberwell, Vic
For service to ophthalmology, and to the development of overseas aid.
Mr James Mohan SAVUNDRA
South Perth, WA
For service to medicine in the fields of plastic and reconstructive surgery.
Dr Chin Huat TAN
Glendalough, WA
For service to the Chinese community of Western Australia.
Dr Karen Susan WAYNE
Toorak, Vic
For service to the community of Victoria through a range of organisations.
Dr Anthony Paul WELDON
Melbourne, Vic
For service to the community, and to paediatric medicine.
PUBLIC SERVICE MEDAL (PSM)
Dr Sharon KELLY
Yeronga, Qld
For outstanding public service to the health sector in Queensland.
Professor Maria CROTTY
Kent Town, SA
For outstanding public service in the rehabilitation sector in South Australia.
Medicare Benefits Schedule Review update
The MBS Review Taskforce continues its work into 2018, with the next round of public consultations expected for release in February.
In the meantime, a number of clinical committees have yet to begin. The Department of Health’s MBS Review team is currently accepting nominations from medical practitioners with the relevant background to participate on the following reviews:
Aboriginal and Torres Strait Islander Health, Neurology, Pain Management, Urology, Allied Health, Colorectal Surgery, Consultation Services, General Surgery, Mental Health Services, Nurse Practitioner & Participating Midwife, Ophthalmology, Optometry, Oral & Maxillofacial Surgery, Paediatric Surgery, Plastic & Reconstructive Surgery, Thoracic Surgery, Vascular Surgery
The MBS Review Taskforce also has an interest in participants (both specialists and consultant physicians) for the review of specialist consultation items.
The success of the MBS reviews is contingent on the reviews being clinician-led and the AMA encourages medical practitioners with the relevant skillset to consider nominating to the clinical committees. Follow the online links to learn more about the individual items under review by each committee.
For more information or to submit a nomination, contact the MBS Review team.
The AMA’s approach has always been to defer recommendations relating to specialty items to the relevant Colleges, Associations and Societies (CAS) and comment on the broader policy. As such, the AMA does not have direct representation on individual clinical committees but supports the commitment made by members who do contribute their expertise to the review.
Through feedback mechanisms involving the CAS, a member-based AMA Working Group and the Medical Practice Committee, the AMA has responded to every single MBS review consultation – raising issues from across our membership, while stressing where systematic improvements need to be made. The AMA Secretariat and the President have done this through direct representations with the Health Minister, the Department of Health and in writing to the Chair of MBS Review Taskforce.
Recent submissions highlighted a number clear deficiencies and significant variations in the MBS review process, signalling a need for absolute transparency from the Taskforce and leadership on the clinical committees through early engagement of the relevant CAS.
This year, the AMA will continue to press Government to ensure the reviews result in sensible reinvestment into the MBS while protecting clinical decision making. It is therefore crucial that each committee has the input of practicing clinicians and consistent, practical advice from the CAS.
The AMA continues to monitor the reviews with interest and update members along the way. The profession and the wider CAS are encouraged to do the same by engaging early with the clinical committees and public consultations. The full schedule of MBS reviews can be found on the Department of Health website: http://www.health.gov.au/internet/main/publishing.nsf/content/MBSR-about
For more information on AMA’s advocacy with the MBS reviews, contact Eliisa Fok
Senior Policy Adviser, Medical Practice efok@ama.com.au
Eliisa Fok
AMA Senior Policy Adviser
AMA Gold Medal presented for exceptional service to a ‘one of a kind’
Dr William Glasson AO, the AMA President who steered a course through the medical indemnity crisis in the early 2000s, has been recognised with the highest honour the peak medical body can bestow – the AMA Gold Medal.
Dr Glasson, universally known as Bill, received the Medal in recognition of his exceptional service to the AMA over many years, and his long-term and ongoing commitment to the eye health of Indigenous people.
AMA President, Dr Michael Gannon, who nominated Dr Glasson for the Medal, said that the distinguished ophthalmologist is one of a kind – a truly deserving recipient of the AMA Gold Medal.
Dr Gannon said: “Bill’s generosity and altruism know no bounds. His work extends to outback Queensland, Indigenous communities, and East Timor.
“Bill was always a strong and passionate advocate for the AMA, the medical profession, the health system, and patients throughout his time as President, at both State and national level.”
Dr Gannon acknowledged when presenting the award that Dr Glasson’s leadership produced a very positive outcome for the profession and the Australian people, following many years of hard work by his predecessors, the AMA Federal Council, and the State and Territory AMAs.
“His hours, days, and weeks of tense negotiations with the then Health Minister Tony Abbott paid off. Bill and Tony survived those tough days, and remain close friends to this day,” Dr Gannon said.
“Bill always wears his heart on his sleeve. His style of advocacy is direct and to the point, tinged with a typical Queensland bush sense of humour, which reflects his origins in outback Winton, and characterised by his expert use of the Australian vernacular.”
Dr Glasson has been President of the Royal Australian and New Zealand College of Ophthalmologists.
He is a member of professional organisations such as the Royal Australasian College of Surgeons, the American Academy of Ophthalmology, the Australian Society of Cataract and Refractive Surgery, the American Society of Cataract and Refractive Surgery, and the Australian Optometry Association.
Dr Glasson is an Adjunct Associate Professor with the University of Queensland School of Medicine.
Meredith Horne
Adherence to diabetic eye examination guidelines in Australia: the National Eye Health Survey
The known Adherence to NHMRC diabetic eye examination guidelines in Australia is reported to be suboptimal, but the accuracy of estimates is questionable, as they are derived from studies with small sample sizes and recruitment bias.
The new In a national sample stratified by remoteness, about half of all Indigenous Australians with diabetes and almost one-quarter of non-Indigenous Australians with diabetes did not have their eyes examined at the recommended frequency, placing them at risk of vision-threatening retinopathy.
The implications Improving the provision and uptake of screening services is needed, particularly in Indigenous communities.
The number of adults with diabetes worldwide has almost quadrupled in the past 35 years, from 108 million in 1980 to 422 million in 2014.1 This rise is largely attributable to population growth and ageing.2 In Australia, about 1.5 million adults have diabetes, and it is estimated that an additional 280 people are diagnosed each day.3 Diabetic retinopathy is a frequent complication of diabetes, and is the leading cause of blindness in working age adults in most developed nations.4 This is disturbing, as most blindness caused by diabetes can be avoided by early detection and timely intervention.5
The National Health and Medical Research Council (NHMRC) has developed guidelines that recommend annual retinal screening and visual acuity assessment of Indigenous Australians and biennial assessment of non-Indigenous Australians with diabetes but without significant risk factors for retinopathy (longer diabetes duration, poor glycaemic control, elevated blood pressure or blood lipid levels).6 The difference in the recommended intervals for Indigenous and non-Indigenous Australians reflects epidemiological evidence that retinopathy is more common in Indigenous than in non-Indigenous Australians.7 Rates of adherence to these guidelines are reported to be unsatisfactory, as low as 50% for non-Indigenous Australians and 20% for Indigenous Australians, although the studies providing these estimates may have been limited by small sample sizes and recruitment bias.8
Projections for the future prevalence of diabetes in Australian adults have been provided by the Australian Diabetes, Obesity and Lifestyle (AusDiab) study.9 If the incidence of diabetes observed during 2000–2005 continues, its prevalence will rise from 7.6% in 2000 to 11.4% by 2025.9 As 25–35% of Australians with diabetes have some degree of retinopathy, it follows that a significant increase in the health impact and economic burden of diabetic retinopathy is likely.7
The National Eye Health Survey (NEHS) was undertaken to provide national prevalence data on vision impairment and blindness. The study also sought to determine the proportion of Australians with self-reported diabetes who adhere to the NHMRC retinal screening guidelines. We report in this article the rates of adherence to the guidelines by Indigenous (aged 40 years or more) and non-Indigenous Australians (aged 50 years or more).
Methods
Study design
Multistage, random cluster sampling was used to select 30 geographic sites in the five mainland Australian states and the Northern Territory, based on data from the 2011 Australian census by the Australian Bureau of Statistics.10 In the first sampling phase, Level 2 Statistical Areas (SA2s) were stratified by remoteness into major city, inner regional, outer regional, remote and very remote areas; respectively twelve, six, six, four and two SA2s were randomly selected from these categories. A Level 1 Statistical Area (SA1) or cluster of SA1s containing about 100 non-Indigenous Australians aged 50 years or more and 50 Indigenous Australians aged 40 years or more was selected from within each SA2 and designated as the recruitment site. The lower age criterion for Indigenous Australians was selected because of the younger age of onset and more rapid progression of eye disease and diabetes in this group. Recruiters proceeded door to door to recruit 1738 Indigenous Australians and 3098 non-Indigenous Australians between March 2015 and April 2016. A positive response rate of 82.5% (3729 of 4520) and a clinical examination rate of 68.5% (3098 of 4520) were achieved for non-Indigenous recruitment, while positive response and examination rates for Indigenous participants were 90.9% (2035 of 2240) and 77.6% (1738 of 2240) respectively. Participants were examined with a series of standard clinical eye tests; the results of these examinations are not reported in this article.
Interviewer-administered general questionnaire
Information about ethnic background (including Indigenous status and country of birth), highest educational level, and history of ocular problems, stroke and diabetes was collected by an interviewer administering a questionnaire. Participants were asked whether they had been told by a doctor or nurse that they had diabetes (ie, diabetes in this study was self-reported). The age at diagnosis for those with self-reported diabetes was recorded. Participants were asked whether they had seen an ophthalmologist or optometrist for a diabetic eye examination, and if so, how long ago (in years). This information was used to determine the proportion of participants who adhered to the NHMRC guidelines. Those who reported that they had not undergone a diabetic eye check were asked for a reason, and their answer was recorded according to a standardised list: “I did not know about the guideline”; “I missed the appointment”; “I have no time”; and other.
Statistical analysis
The primary outcome was adherence to the NHMRC diabetic eye examination guidelines. Demographic characteristics were summarised as means and standard deviations (SDs) for normally distributed continuous data, and as medians with interquartile ranges (IQRs) for skewed data. Normality was assessed in boxplots, and with Kolmogorov–Smirnov and Shapiro–Wilks tests. Univariate and multivariable logistic regression analysis was used to identify risk factors associated with adherence. Adjusted proportions were calculated by generalised logit regression models taking into account the sampling weight and non-response rate. A plot of the residuals against estimates was examined to determine whether the assumptions of linearity and homoscedasticity were met. The Stata module NLCHECK was used to test assumptions of linearity after model estimation. A Box–Tidwell model was used to transform a predictor using power transformations to find the best power for model fit based on maximal likelihood estimate. Because of the small numbers of participants with self-reported diabetes from very remote sites (17 Indigenous and 18 non-Indigenous people), the remote and very remote strata were collapsed in the regression analysis. Variables found to be non-significant in univariate analysis were excluded from the multivariable model. All analyses were performed by incorporating sampling weights and non-response rate. Analyses were conducted in Stata 14.2.0 (StataCorp). P < 0.05 (two-tailed) was deemed statistically significant.
Ethics approval
The protocol for this study was approved by the Royal Victorian Eye and Ear Hospital Human Research Ethics Committee (reference, HREC-14/1199H). Additional ethics approvals for conducting research in Indigenous communities were obtained at the state level. The research complied with the tenets of the Declaration of Helsinki.
Results
Study participants
A total of 1738 Indigenous Australians (men, 41.1%) aged 40–92 years (mean, 55.0 years; SD, 10.0 years) were examined, of whom 645 (men, 37.5%; mean age, 68.6 years [SD, 8.9]) had self-reported diabetes (crude prevalence, 37.1%; age- and sampling-adjusted prevalence, 42.6%). Of the 3098 non-Indigenous Australians (men, 46.4%) aged 50–98 years (mean, 66.6 years; SD, 9.7 years) examined, 431 had self-reported diabetes (men, 58.3%; mean age, 58.3 years [SD, 9.8]); the prevalence was significantly lower than for the Indigenous participants (crude prevalence, 13.9%; adjusted prevalence, 13.3%; P < 0.001). The mean age of non-Indigenous participants who adhered to the NHMRC diabetic eye examination guidelines was 68.4 years (SD, 8.7 years), and the median duration of diabetes since diagnosis was 10 years (IQR, 5–18 years). The mean age of Indigenous Australians who had undergone recommended eye examinations was 58.7 years (SD, 9.7 years), and the median duration of diabetes was 11 years (IQR, 5–20 years) (Box 1).
Adherence to the NHMRC diabetic eye examination guidelines
More than half the Indigenous participants with self-reported diabetes (341 participants; unadjusted rate, 52.9%; age- and sampling-adjusted rate, 52.7%) reported that they had had a diabetic eye examination in the past 12 months, in accordance with the NHMRC guidelines. Of the non-Indigenous Australians with self-reported diabetes, 77.7% (adjusted rate, 77.5%) had had eye examinations in the preceding 2 years (v Indigenous proportion: P < 0.001; Box 2). In total, 26.2% of Indigenous Australians with diabetes reported that they had never undergone a diabetic eye examination, compared with 15.3% of non-Indigenous participants (P < 0.001).
The major reason for non-adherence reported by both Indigenous (72.6%) and non-Indigenous participants (74.3%) was that they were unaware of the need for regular eye examinations.
Effects of associated risk factors on adherence to the NHMRC guidelines
Indigenous and non-Indigenous Australians combined
Univariate logistic regression indicated that Indigenous status was significantly associated with a lower likelihood of having adhered to the NHMRC guidelines (odds ratio [OR], 0.37; P < 0.001). After adjusting for covariates, longer duration of diabetes (OR, 1.11 per 5 years; P = 0.012) and inner regional residence (adjusted OR [aOR], 1.60; P = 0.012) were associated with a greater likelihood of adhering, while Indigenous status remained a strong risk factor for non-adherence (aOR, 0.29; P < 0.001) (Box 3).
Indigenous and non-Indigenous Australians separately
Data for Indigenous and non-Indigenous participants were also analysed separately to account for differences in inclusion criteria. In non-Indigenous Australians, univariate and multivariate analysis showed that older age was a risk factor for non-adherence (aOR, 0.70 per decade; P = 0.011), while longer duration of diabetes was associated with greater likelihood of adhering (aOR, 1.19 per 5 years; P = 0.018). Among Indigenous participants, adherence was greater for men (aOR, 1.46; P = 0.018) and for those in inner regional areas (aOR, 1.66; P = 0.007) (Box 3).
Discussion
The adjusted prevalence of self-reported diabetes among participants in the NEHS was more than three times higher for Indigenous than for non-Indigenous participants (42.6% v 13.3%). Almost 80% of non-Indigenous participants and half the Indigenous participants with diabetes reported that they had adhered to the NHMRC retinopathy screening guidelines. Longer duration of diabetes was associated with greater adherence and greater age with non-adherence in the non-Indigenous group, while among Indigenous participants those who were men or living in an inner regional locality were more likely to have adhered to the recommendations.
The adherence rate of 77.5% for non-Indigenous Australians matches the 77% reported in the AusDiab study.12 However, AusDiab included participants from a much broader age range (25 years and over) and can therefore be compared with the older NEHS sample only with caution. A more relevant comparison is with the adherence rate of about 50% in the older population of the Melbourne Visual Impairment Project.13 The higher adherence rate we found may indicate improved access to and awareness of diabetic retinopathy screening services among people with diabetes, or improved awareness of the guidelines among health care providers.14 In any case, adherence rates must improve further to compensate for the expected rise in the incidence of diabetes.3 Australia would benefit from a carefully integrated diabetic retinopathy screening system that ensures coverage for all Australians with diabetes, particularly in underserviced remote areas. Combined with improvements in referral pathways for those identified as having vision-threatening retinopathy and increased education of those with diabetes about examination guidelines, an integrated and accessible screening program would increase the uptake of eye examinations. Such programs have been effective in other countries,15 and would improve the management of diabetic retinopathy in Australia.
The proportion of Indigenous adults with diagnosed diabetes who had had an eye examination during the past 12 months has increased since the completion of the National Indigenous Eye Health Survey (NIEHS) in 2008, from about 20% to more than 50%.16,17 This suggests that interventions in Indigenous eye health since the NIEHS may be having a significant impact.18 Despite this improvement, an unacceptably high proportion of Indigenous Australians with diabetes are not having potentially vision-saving examinations. Coinciding with these findings, the Australian government has allocated $33.8 million in Medicare rebates to general practitioners for non-mydriatic fundus photography in diabetic patients.19 Primary health care providers are at the frontline of diabetes care, and integrating regular fundus photography by GPs into their routine management of diabetes should significantly reduce the burden of diabetes-related vision loss. The new Medicare rebate will be of particular benefit to under-resourced Indigenous health services in the most remote regions of Australia. Indigenous Australians in very remote communities are at particularly high risk of diabetic retinopathy, and the lowest adherence rate in the NEHS — 38% in very remote areas — indicates that integrating regular retinal screening into primary care in these communities is essential for improving Indigenous eye health.17
The positive association between regular eye examinations and disease duration has important implications for treating and preventing diabetic retinopathy. The prevalence of diabetic retinopathy increases with duration of disease; 60% of people with type 2 diabetes and almost all with type 1 diabetes develop retinopathy within 20 years of diagnosis.20 Regular screening is therefore particularly important for those who have had diabetes for many years. Lower adherence by people with a shorter duration of diabetes may be noteworthy, as detecting retinopathy early is associated with better treatment outcomes.5 That increasing age was associated with a significantly lower likelihood of adherence highlights a clear need to improve the uptake of diabetes eye care services by older people. As our population is ageing, the prevalence of diabetes-related vision loss is likely to increase if older Australians with diabetes neglect their eye health.21
The primary limitation of our study was the use of self-reported data for ascertaining diabetes; we cannot exclude the possibility of self-reporting bias. In addition, recall bias may have led patients to over- or underestimate the time since their most recent eye examination. Similarly, participants may not have accurately recalled whether their fundus had been investigated during this examination. Nevertheless, self-reports are commonly used for diabetes surveillance,22,23 and earlier studies have reported excellent sensitivities and specificities for self-reported diabetes when compared with medical diagnoses.24,25
In summary, our findings indicate that adherence rates to the NHMRC diabetic eye examination guidelines are significantly higher than previously estimated in Australia. Despite this encouraging finding, it is important that about half of all Indigenous Australians and almost one-quarter of non-Indigenous Australians with diabetes did not have their eyes examined at the recommended frequency. While the recent allocation by the federal government of funding for screening modalities in general practice may further improve adherence rates, implementing an accessible integrated screening service is needed to eliminate diabetic retinopathy as a significant public health problem in Australia.
Box 1 –
Socio-demographic characteristics of participants with self-reported diabetes who adhered or did not adhere to National Health and Medical Research Council guidelines for retinopathy screening (unadjusted for age or sampling)
|
|
Non-Indigenous |
Indigenous |
|||||||||||||
|
Adherers |
Non-adherers |
Adherers |
Non-adherers |
||||||||||||
|
|
|||||||||||||||
|
Number of participants |
335 |
96 |
341 |
304 |
|||||||||||
|
Age (years), mean (SD) |
68.4 (8.7) |
69.6 (9.7) |
58.7 (9.7) |
57.8 (9.8) |
|||||||||||
|
Duration of diabetes (years), median (IQR) |
10.0 (5–18) |
8.0 (3–14) |
11.0 (5–20) |
10.0 (5–19) |
|||||||||||
|
Education (years), mean (SD) |
12.2 (3.9) |
11.7 (3.4) |
10.7 (3.9) |
10.3 (3.2) |
|||||||||||
|
Sex (male) |
181 (54.0%) |
61 (64%) |
131 (38.4%) |
111 (36.5%) |
|||||||||||
|
English spoken at home |
298 (89.0%) |
85 (88%) |
318 (93.3%) |
288 (94.7%) |
|||||||||||
|
Place of birth |
|
|
|
|
|||||||||||
|
Oceania |
231 (69%) |
56 (58%) |
340 (99.7%) |
303 (99.7%) |
|||||||||||
|
Europe |
70 (21%) |
27 (28%) |
1 (0.3%) |
1 (0.3%) |
|||||||||||
|
Other |
34 (10%) |
13 (14%) |
0 |
0 |
|||||||||||
|
|
|||||||||||||||
|
|
|||||||||||||||
Box 2 –
Rates of adherence to the National Health and Medical Research Council guidelines for retinopathy screening,* by Indigenous status and residential location
|
|
Self-reported diabetes |
Adhered to NHMRC guidelines |
Adherence rate |
||||||||||||
|
Crude (95% CI) |
Adjusted† (95% CI) |
||||||||||||||
|
|
|||||||||||||||
|
Indigenous participants |
645 |
341 |
52.9% (48.9–56.8%) |
52.7% (45.9–59.6%) |
|||||||||||
|
Non-Indigenous participants |
431 |
335 |
77.7% (73.5–81.6%) |
77.5% (71.8–83.3%) |
|||||||||||
|
|
|||||||||||||||
|
* Once a year for Aboriginal and Torres Strait Islander people with diabetes, and at least once every 2 years for non-Indigenous Australians with diabetes.9 Adherence rates by geographic remoteness have been published elsewhere.11 † Adjusted for age and sampling, based on multistage random cluster sampling and age weighting. |
|||||||||||||||
Box 3 –
Factors associated with adherence to the National Health and Medical Research Council guidelines for retinopathy screening: univariate and multivariate logistic regression*
|
|
All participants |
Non-Indigenous |
Indigenous |
||||||||||||
|
OR (95% CI) |
P |
OR (95% CI) |
P |
OR (95% CI) |
P |
||||||||||
|
|
|||||||||||||||
|
Univariate analysis |
|
|
|
|
|
|
|||||||||
|
Age (per 10 years) |
1.12 (0.93–1.36) |
0.24 |
0.73 (0.56–0.95) |
0.021 |
1.00 (0.68–1.46) |
0.98 |
|||||||||
|
Duration of diabetes (per 5 years) |
1.06 (0.98–1.15) |
0.14 |
1.16 (1.03–1.32) |
0.018 |
1.02 (0.93–1.11) |
0.70 |
|||||||||
|
Education (per year) |
1.06 (0.99–1.13) |
0.08 |
1.02 (0.95–1.09) |
0.53 |
1.06 (0.94–1.18) |
0.33 |
|||||||||
|
Sex (male) |
1.18 (0.85–1.64) |
0.32 |
0.63 (0.37–1.08) |
0.09 |
1.37 (1.02–1.85) |
0.033 |
|||||||||
|
Indigenous |
0.37 (0.25–0.56) |
< 0.001 |
|
|
|
|
|||||||||
|
English spoken at home |
0.86 (0.52–1.42) |
0.54 |
1.06 (0.65–1.73) |
0.80 |
1.19 (0.43–3.30) |
0.72 |
|||||||||
|
Place of birth |
|
|
|
|
|
|
|||||||||
|
Oceania |
1 |
|
1 |
|
|
|
|||||||||
|
Europe |
1.49 (0.77–2.89) |
0.23 |
0.74 (0.41–1.34) |
0.30 |
|
|
|||||||||
|
Other |
1.03 (0.44–2.45) |
0.94 |
0.51 (0.21–1.26) |
0.14 |
|
|
|||||||||
|
Remoteness |
|
|
|
|
|
|
|||||||||
|
Major city |
1 |
|
1 |
|
1 |
|
|||||||||
|
Inner regional |
1.64 (0.94–2.88) |
0.08 |
1.68 (0.89–3.16) |
0.10 |
1.46 (1.02–2.11) |
0.038 |
|||||||||
|
Outer regional |
1.18 (0.61–2.30) |
0.60 |
1.39 (0.77–2.49) |
0.26 |
0.80 (0.46–1.38) |
0.40 |
|||||||||
|
Remote/very remote |
1.55 (0.87–2.74) |
0.13 |
1.49 (0.73–3.04) |
0.26 |
0.87 (0.54–1.39) |
0.54 |
|||||||||
|
Multivariate analysis |
|
|
|
|
|
|
|||||||||
|
Age (per 10 years) |
0.85 (0.69–1.04) |
0.11 |
0.70 (0.54–0.92) |
0.011 |
1.05 (0.79–1.41) |
0.71 |
|||||||||
|
Duration of diabetes (per 5 years) |
1.11 (1.02–1.20) |
0.012 |
1.19 (1.03–1.37) |
0.018 |
1.03 (0.93–1.13) |
0.59 |
|||||||||
|
Education (per year) |
1.04 (0.98–1.11) |
0.23 |
1.04 (0.96–1.12) |
0.31 |
1.07 (0.96–1.19) |
0.24 |
|||||||||
|
Sex (male) |
0.94 (0.69–1.28) |
0.70 |
0.61 (0.36–1.11) |
0.069 |
1.46 (1.07–1.99) |
0.018 |
|||||||||
|
Indigenous |
0.29 (0.18–0.47) |
< 0.001 |
— |
— |
— |
— |
|||||||||
|
Place of birth |
|
|
|
|
|
|
|||||||||
|
Oceania |
1 |
|
1 |
|
— |
— |
|||||||||
|
Europe |
0.75 (0.44–1.27) |
0.28 |
0.74 (0.44–1.24) |
0.24 |
— |
— |
|||||||||
|
Other |
0.43 (0.13–1.39) |
0.15 |
0.39 (0.09–1.70) |
0.20 |
— |
— |
|||||||||
|
Remoteness |
|
|
|
|
|
|
|||||||||
|
Major city |
1 |
|
1 |
|
1 |
|
|||||||||
|
Inner regional |
1.60 (1.12–2.29) |
0.012 |
1.53 (0.78–3.02) |
0.21 |
1.66 (1.16–2.37) |
0.007 |
|||||||||
|
Outer regional |
1.10 (0.71–1.70) |
0.66 |
1.29 (0.69–2.42) |
0.41 |
0.89 (0.55–1.44) |
0.62 |
|||||||||
|
Remote/very remote |
1.35 (0.83–1.29) |
0.22 |
1.66 (0.86–3.24) |
0.13 |
0.99 (0.56–1.76) |
0.98 |
|||||||||
|
|
|||||||||||||||
|
OR = odds ratio. * Analysis adjusted for sampling weight and non-response rate. |
|||||||||||||||
Long term risk of severe retinopathy in childhood-onset type 1 diabetes: a data linkage study
The known Microvascular complications in people with type 1 diabetes mellitus are directly related to glycaemic control.
The new This is the first study to assess the risk of complications in people with type 1 diabetes according to their glycaemic control trajectory between childhood and adulthood. Severe diabetic retinopathy (SDR) was associated with higher paediatric HbA1c levels, independent of glycaemic control during adulthood. Importantly, SDR was not documented in patients with a stable low glycaemic control trajectory.
The implications Target-based treatment from the time of diagnosis of type 1 diabetes in childhood is required to reduce the risk of SDR during adulthood.
Whether microvascular complications develop in people with type 1 diabetes mellitus is critically dependent on their glycaemic control.1–3 In the large Diabetes Control and Complications Trial (DCCT) and the Epidemiology of Diabetes Complications (EDIC) trial, however, mean glycated haemoglobin A1c (HbA1c) levels could only be estimated from data acquired at trial entry; consequently, the effect of the cumulative glycaemic exposure of the 195 adolescents in these studies during their 1–5 years of diabetes could not be analysed. As a result, the importance and contribution of childhood glycaemic control could not be fully assessed, which may explain some of the differences between adolescent and adult outcomes at follow-up.4 Apart from these two large scale studies, few investigations have followed individuals with childhood-onset type 1 diabetes into adult life.5,6 One longitudinal study (15 participants) found that mean HbA1c levels at diagnosis in childhood were higher for those who developed retinopathy during the 20-year follow-up, and that differences in HbA1c levels between those with and without retinopathy gradually declined with time.7 However, no study has compared the effect of optimal and poor glycaemic control across life on the risk of later complications.
The objectives of our study were to examine the impact of childhood glycaemic control on the future risk of complications in people with type 1 diabetes. Specifically, we aimed to delineate the effect of glycaemic control trajectory on risk, and to determine the relative effects of paediatric and adult metabolic control. We hypothesised that a stable low trajectory would be associated with a lower risk of microvascular complications, and that glycaemic control during childhood would modify the future risk of complications.
Methods
Study design
We undertook a retrospective cohort study of data collected from the time of diagnosis of type 1 diabetes in childhood until the time of our analysis (November 2013). Adults with a diagnosis of type 1 diabetes8 (diagnosed in childhood during 1975–2010) were included if they had attended at least one specialist adult diabetes clinic at the Royal Melbourne Hospital, and their care had been transferred from the paediatric diabetes clinic at the Royal Children’s Hospital (Melbourne) during 1992–2013. Individuals who had been lost to follow-up at the time of care transition from the paediatric diabetes clinic or who had died were therefore excluded. The choice of transition referral centre follows a discussion between the physician and young adult, and is not based on any biological or clinical criteria. Because of its proximity, the Royal Melbourne is the main adult referral centre for patients who transition from the Royal Children’s Hospital, receiving about 40% of its transitioning cohort.
We used a data linkage system, BioGrid Australia, that facilitates linkage of de-identified clinical data from member institutions. All individuals with type 1 diabetes common to both hospitals were identified. Data obtained from clinical department databases at each institution, including standardised clinical data for all routine outpatient clinic visits, were combined with mortality outcome data from the National Death Index (NDI), which has recorded all deaths in Australia since 1980. The process of sequential data linkage was performed with SAS 9.2 (SAS Institute).
Main outcomes and measures
Severe complications
The primary outcome of interest was a database record of diabetes-specific microvascular complications; in this study, only the most severe forms were considered. The date and cause of death were obtained from the NDI. Severe diabetic retinopathy (SDR) included one or more of maculopathy, proliferative retinopathy, and a need for photocoagulation surgery. Chronic kidney disease (CKD) was defined by a glomerular filtration rate of less than 60 mL/min/1.73 m2 (stage 3 CKD or worse),9 calculated from serial creatinine measurements using the Chronic Kidney Disease Epidemiology Collaboration (CKD-EPI) equation.10 Ulceration and amputation were recorded according to the clinical database files.
Glycaemic control
HbA1c levels were summarised as paediatric (mean of all pre-transition paediatric clinic measurements), adult (mean of all post-transition measurements as an adult), and life course values (mean HbA1c level from diagnosis to November 2013). The glycaemic control trajectory was defined across the life course, with 66 mmol/mol set as the upper cut-off value for good glycaemic control. This value was preferred to the standard paediatric target of 58 mmol/mol because it was anticipated that some of the cohort had commenced treatment before publication of the DCCT findings1,2 upon which the current HbA1c target values are based.8,11 The median HbA1c level in children aged 0–18 years with type 1 diabetes in Australia in 2009 was reported to be 66 mmol/mol;12 this was also the median HbA1c level for a cohort of children who had recently transitioned from care at the Royal Children’s Hospital.13
Each individual was assigned to one of four glycaemic control trajectory groups:
-
stable low (mean paediatric and adult HbA1c ≤ 66 mmol/mol);
-
improving (mean paediatric HbA1c > 66 mmol/mol, mean adult HbA1c ≤ 66 mmol/mol);
-
worsening (mean paediatric HbA1c ≤ 66 mmol/mol, mean adult HbA1c > 66 mmol/mol); or
-
stable high (paediatric and adult mean HbA1c > 66 mmol/mol).
Statistical analyses
Differences between the trajectory groups in participant characteristics, HbA1c levels, and complications were examined by one-way ANOVA (continuous variables) or in χ2 tests (categorical variables). The standardised mortality ratio was calculated as the ratio of the number of observed deaths to the number of expected deaths in the general population, based on 2012 Australian Bureau of Statistics data for Victoria. SDR was the only complication we examined in a regression analysis, as the aetiology of the other outcome measures could not be precisely defined. The relative effect of paediatric and adult glycaemic control on the risk of developing SDR was assessed by generalised estimating equation (GEE) analysis, which could allow for unmeasured variables and confounders. Statistical analyses were performed in Stata 13.0 (StataCorp); P < 0.05 was deemed statistically significant.
Ethics approval
The study received ethics approval from all participating institutions, the Royal Children’s Hospital Human Research Ethics Committee (reference, 31206), BioGrid (project reference, 201202/1), and the Australian Institute of Health and Welfare Research Ethics Committee (reference, EC2013-2-30).
Results
Participant characteristics
We identified 503 people (including 253 men) who were diagnosed with type 1 diabetes during 1975–2010 and had transitioned from paediatric to adult diabetes services over a 21-year period (1992–2013) at a mean age of 18.4 years (standard deviation [SD], 0.9 years; Box 1). The mean age at diagnosis was lower for girls (9.6 [SD, 3.9] v 10.3 [SD, 4.1] years; P < 0.05) but higher for women at the time of our analysis (28.8 [SD, 6.7] v 27.2 [SD, 5.7] years; P < 0.05); the mean duration of type 1 diabetes was therefore longer for women (19.3 [SD, 7.8] v 16.9 [SD, 7.1] years; P < 0.01). The mean number of HbA1c measurements per individual was 22.0 (SD, 13.0), 10.0 (SD, 8.1) and 29.6 (SD, 15.9) during the paediatric, adult and life course periods respectively; the corresponding mean HbA1c levels were 68 mmol/mol (SD, 13.1), 70 mmol/mol (SD, 17.5), and 68 mmol/mol (SD, 12.0) (Box 1).
Severe complications
At least one severe complication was documented for 26 participants (5.2%), including 16 with SDR (3.2%; Box 1). No severe complications were recorded in the paediatric dataset. Based on age- and sex-matched data from 2012 Victorian state data, the overall standardised mortality ratio in this cohort was 1.9 (95% CI, 0.7–4.3) (men, 1.3 [95% CI, 0.2–4.1]; women, 2.7 [95% CI, 0.7–7.4]).
Lifetime glycaemic control trajectory and risk of complications
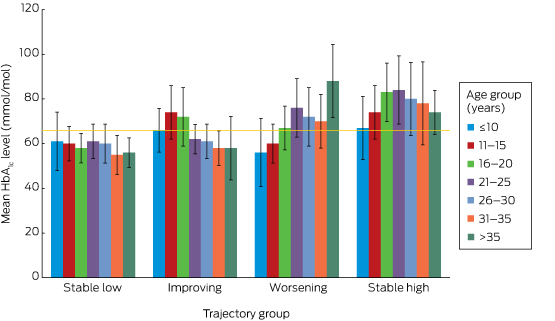
For the stable low group (143 participants, 28%), the mean paediatric, adult and overall HbA1c levels were 57 mmol/mol (SD, 6.6), 57 mmol/mol (SD, 6.6), and 58 mmol/mol (SD, 3.3) respectively (Box 1). Only one person in this group had a documented complication (a 29-year-old man who had had an amputation).
The glycaemic profiles for the stable low, improving (82 participants, 16%), worsening (96 participants, 19%) and stable high trajectories (182 participants, 36%) are shown in Box 2. Given the low frequency of complications, further analyses were restricted to SDR, for which a causative role for hyperglycaemia could be confidently assumed. No-one in the stable low group had developed SDR, but three in the improving (4%), one in the worsening (1%), and 12 in the stable high groups (7%) had developed SDR (P = 0.004; Box 1). The overall mean age of onset of SDR was 28.8 years (SD, 4.4) years (for the improving group, 23.9 years [SD, 3.7]; worsening group, 28.5 years; stable high, 30.3 years [SD, 3.9]; P = 0.6). However, the mean interval between diagnosis with type 1 diabetes and onset of SDR was shorter for the worsening (30.5 years) and stable high groups (28.1 years; SD, 0.8) than for the improving group (31.9 years; SD, 6.2; P = 0.01).
Paediatric HbA1c level and SDR risk in adulthood
GEE analysis that included significant variables from exploratory multivariate logistic regression models (online Appendix) indicated that each 10.9 mmol/mol increase in paediatric HbA1c level was associated with an almost threefold risk of SDR (odds ratio [OR], 2.9; 95% CI, 1.9–4.3; P < 0.01); each 10.9 mmol/mol increase in adult HbA1c level was associated with a twofold risk (OR, 2.1; 95% CI, 1.4–3.1; P < 0.01). Longer duration of type 1 diabetes was also associated with an increased risk of SDR (per additional year: OR, 1.3; 95% CI, 1.2–1.5; P < 0.01).
Discussion
By incorporating all recorded HbA1c data from diagnosis onwards, this study offers a unique insight into a cohort of adults with childhood-onset type 1 diabetes who were not managed in clinical trials. None of those who maintained a mean HbA1c level of 66 mmol/mol or less from the time of diagnosis (the stable low group) developed SDR. The mean paediatric, adult and overall HbA1c levels in this group were each 58 mmol/mol or less, supporting the adoption of this target in paediatric practice.11 Each additional year of diabetes conferred a significant increase in the risk of SDR, and our data indicate that both paediatric and adult mean HbA1c levels are modifiable factors that moderate this risk. This is important for paediatric care providers, as 64.6% of participants remained in the same HbA1c level category (low or high) during the paediatric and adult periods, indicating that glycaemic control generally neither markedly deteriorates nor improves after the transition to adult services. This challenges the widely held belief that glycaemic control in young adults with type 1 diabetes improves during their mid- to late 20s following deterioration during the adolescent years,14 a premise that may not apply to every patient.
The major limitations of this study are its retrospective design and the low numbers of severe complications reported. Detailed clinical information beyond that recorded in the clinical databases was not available; as the data were de-identified, this problem could not be overcome. Assessing the potential relevance of lifetime glycaemic control for the risk of complications, with the exception of retinopathy, is therefore difficult. Further, we lacked information about outcomes for those who were lost to follow-up immediately after the transition from paediatric care, for whom we consequently have no information about glycaemic control trajectory or complication rates. This could account for the discrepancy between the standardised mortality ratio we estimated and that based on a population-based dataset in Western Australia (1.7 for men, 10.1 for women).15 Although glycaemic control for most of the participants had been suboptimal throughout their lives, the SDR rate was low, but consistent with the recent report that 3.7% of young people (14–30 years old) with type 1 diabetes in Norway required laser therapy within 20 years of the onset of diabetes.16
A number of factors contribute to a higher risk of diabetes-related complications, including genetic susceptibility and cardiovascular risk factors (such as smoking, higher body mass index, greater waist:hip ratio, hyperlipidaemia, hypertension). Data on these factors were not available, and the omission of these known confounders from our analyses is a major limitation of this study. The duration of follow-up varied between individuals, and a shorter period of follow-up during adulthood may have led to misclassification of trajectory category. Cohort studies that assess individuals from diagnosis to death could overcome this limitation, but would be possible only for population-based registries or in large, multicentre cohort studies.
As the study period was broad, we also assessed the effect of era of diagnosis on SDR outcome (data not shown). While SDR was more common among those diagnosed prior to the publication of the DCCT findings (1994), the effect was not independent of the collinear higher glycaemic control that commenced before contemporary target-based practice.
Our report describes the risk of diabetes-specific microvascular complications in a cohort of Australian adults who were diagnosed with type 1 diabetes during childhood. It is the first to assess clinical outcomes according to glycaemic control trajectory between childhood and adulthood, and is the largest to use all available metabolic data from the diagnosis of type 1 diabetes onwards, with a longer duration of follow-up than reported elsewhere. In the absence of an Australian population-based registry of individuals with type 1 diabetes, this data linkage study facilitated assessment of the effects of glycaemic control during the paediatric and adult periods. From this novel perspective, we found that, after adjusting for duration of diabetes (a non-modifiable factor), HbA1c level throughout the course of life was independently associated with the risk of retinopathy in adulthood; the predictive effects of paediatric and adult HbA1c levels were equivalent. However, as severe retinopathy commenced during the third decade of life in our cohort and most people had similar glycaemic control levels in childhood and adulthood, the contribution of metabolic memory (the concept that hyperglycaemia appears to have a chronic rather than an acute effect on the development of complications)4 from the paediatric period was integral to this risk.
Box 1 –
Participant characteristics, HbA1c levels, and complication rates for all participants and for each glycaemic control trajectory group
|
|
All participants |
HbA1c trajectory group |
P* |
||||||||||||
|
Stable low |
Improving |
Worsening |
Stable high |
||||||||||||
|
|
|||||||||||||||
|
Number (% of participants) |
503 |
143 (28%) |
82 (16%) |
96 (19%) |
182 (36%) |
|
|||||||||
|
Sex (women) |
250 |
58 (40%) |
46 (56%) |
44 (46%) |
102 (56%) |
0.02 |
|||||||||
|
Age at diagnosis (years), mean (SD) |
9.9 (3.9) |
10.7 (4.1) |
9.1 (3.9) |
10.3 (4.2) |
9.5 (3.9) |
0.80 |
|||||||||
|
Duration of paediatric observation (years), mean (SD) |
8.5 (4.2) |
7.8 (4.1) |
9.2 (4.1) |
8.1 (4.6) |
8.9 (4.1) |
0.02 |
|||||||||
|
Range (years) |
0.6–19.1 |
1.0–19.1 |
3.8–19.1 |
1.1–18.3 |
0.6–18.9 |
|
|||||||||
|
Age at transition (years), mean (SD) |
18.4 (0.9) |
18.5 (0.8) |
18.3 (0.8) |
18.4 (1.1) |
18.4 (1.2) |
0.10 |
|||||||||
|
Duration of adult observation (years), mean (SD) |
8.9 (5.8) |
7.8 (5.3) |
10.0 (6.9) |
9.4 (5.5) |
9.2 (5.8) |
0.04 |
|||||||||
|
Range (years) |
0.3–21.8 |
0.8–20.9 |
0.4–21.8 |
0.3–20.9 |
0.5–21.6 |
|
|||||||||
|
Age at last follow-up (years), mean (SD) |
27.9 (6.3) |
26.4 (5.1) |
30.4 (7.7) |
27.6 (5.5) |
28.4 (6.3) |
< 0.001 |
|||||||||
|
Duration of type 1 diabetes, (years), mean (SD) |
18.1 (7.5) |
15.5 (6.7) |
21.3 (8.6) |
17.5 (7.4) |
18.9 (7.0) |
0.07 |
|||||||||
|
HbA1c measurements, mean number (SD) |
|||||||||||||||
|
Paediatric |
22.0 (13.0) |
21.9 (12.8) |
21.9 (15.5) |
19.9 (12.8) |
22.3 (12.8) |
0.50 |
|||||||||
|
Adult |
10.0 (8.1) |
11.3 (8.9) |
11.1 (9.5) |
9.5 (8.0) |
8.6 (8.1) |
0.40 |
|||||||||
|
Lifetime |
29.6 (15.9) |
33.3 (15.4) |
28.5 (18.0) |
27.9 (14.3) |
28.1 (15.8) |
0.17 |
|||||||||
|
HbA1c level (mmol/mol), mean (SD) |
|||||||||||||||
|
Paediatric |
68 (13.1) |
57 (6.6) |
74 (9.8) |
60 (5.5) |
78 (9.8) |
< 0.001 |
|||||||||
|
Adult |
70 (17.5) |
57 (6.6) |
60 (5.5) |
77 (10.9) |
85 (17.5) |
< 0.001 |
|||||||||
|
Lifetime |
68 (12.0) |
58 (3.3) |
67 (8.7) |
65 (6.6) |
79 (9.8) |
< 0.001 |
|||||||||
|
Severe complications |
26 (5.2%) |
1 (1%) |
6 (7%) |
3 (3%) |
16 (9%) |
0.006 |
|||||||||
|
Severe retinopathy |
16 (3.2%) |
0 |
3 (4%) |
1 (1%) |
12 (7%) |
0.004 |
|||||||||
|
Renal disease |
8 (2%) |
0 |
0 |
4 (5%) |
2 (2%) |
0.07 |
|||||||||
|
Ulceration/amputation |
4 (1%) |
1 (1%) |
1 (1%) |
0 |
4 (2%) |
0.76 |
|||||||||
|
Death |
5 (1%) |
0 |
0 |
1 (1%) |
4 (2%) |
0.18 |
|||||||||
|
|
|||||||||||||||
|
* Differences between trajectory groups tested in χ2 (categorical) and one-way ANOVA analyses (continuous variables). |
|||||||||||||||
A blinding eye injury caused by chasing Pokémon
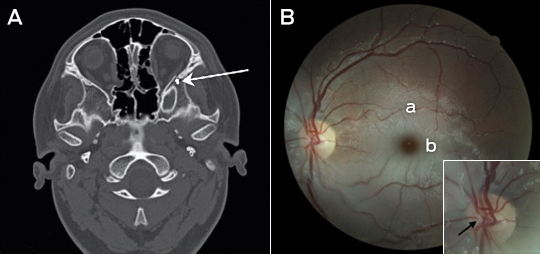
We report a case of serious injury playing Pokémon GO. A 14-year-old boy, distracted by this popular mobile phone game, fell and completely lost vision in his left eye. Only a dense relative afferent pupillary defect was present initially. A computed tomography scan showed a mildly impacted and laterally angulated fracture of the lateral wall of the left orbit just posterior to the zygomatico-sphenoid suture (Figure, A, arrow). The ipsilateral optic nerve and optic canal is normal in appearance, with no bony fragment causing impingement and no globe injury. Two days after the injury, a central retinal artery occlusion was present. A fundus photograph of the patient’s left eye (Figure, B) showed a thrombus within the central retinal artery bifurcation at the disc (Figure, B, arrow), typical retinal pallor (Figure, B, a) and a “cherry-red” spot (Figure, B, b). Occurrence of both traumatic optic neuropathy and vessel occlusions is rare, but may result from indirect nerve injury from orbital trauma.1 In addition, acute stretching of retinal vessels may initiate thrombosis.2 Our case again highlights the dangers of mobile phone distraction.
Neurobionics and the brain–computer interface: current applications and future horizons
Neurobionics is the science of directly integrating electronics with the nervous system to repair or substitute impaired functions. The brain–computer interface (BCI) is the linkage of the brain to computers through scalp, subdural or intracortical electrodes (Box 1). Development of neurobionic technologies requires interdisciplinary collaboration between specialists in medicine, science, engineering and information technology, and large multidisciplinary teams are needed to translate the findings of high performance BCIs from animals to humans.1
Neurobionics evolved out of Brindley and Lewin’s work in the 1960s, in which electrodes were placed over the cerebral cortex of a blind woman.2–4 Wireless stimulation of the electrodes induced phosphenes — spots of light appearing in the visual fields. This was followed in the 1970s by the work of Dobelle and colleagues, who provided electrical input to electrodes placed on the visual cortex of blind individuals via a camera mounted on spectacle frames.2–4 The cochlear implant, also developed in the 1960s and 1970s, is now a commercially successful 22-channel prosthesis for restoring hearing in deaf people with intact auditory nerves.5 To aid those who have lost their auditory nerves, successful development of the direct brainstem cochlear nucleus multi-electrode prosthesis followed.6
The field of neurobionics has advanced rapidly because of the need to provide bionic engineering solutions to the many disabled US veterans from the Iraq and Afghanistan wars who have lost limbs and, in some cases, vision. The United States Defense Advanced Research Projects Agency (DARPA) has focused on funding this research in the past decade.7
Through media reports about courageous individuals who have undergone this pioneering surgery, disabled people and their families are becoming more aware of the promise of neurobionics. In this review, we aim to inform medical professionals of the rapid progress in this field, along with ethical challenges that have arisen. We performed a search on PubMed using the terms “brain computer interface”, “brain machine interface”, “cochlear implants”, “vision prostheses” and “deep brain stimulators”. In addition, we conducted a further search based on reference lists in these initial articles. We tried to limit articles to those published in the past 10 years, as well as those that describe the first instances of brain–machine interfaces.
Electrode design and placement
Neurobionics has been increasing in scope and complexity because of innovative electrode design, miniaturisation of electronic circuitry and manufacture, improvements in wireless technology and increasing computing power. Using computers and advanced signal processing, neuroscientists are learning to decipher the complex patterns of electrical activity in the human brain via these implanted electrodes. Multiple electrodes can be placed on or within different regions of the cerebral cortex, or deep within the subcortical nuclei. These electrodes transmit computer-generated electrical signals to the brain or, conversely, receive, record and interpret electrical signals from this region of the brain.
Microelectrodes that penetrate the cortical tissue offer the highest fidelity signals in terms of spatial and temporal resolution, but they are also the most invasive (Box 2, A).8 These electrodes can be positioned within tens of micrometres of neurons, allowing the recording of both action potential spikes (the output) of individual neurons and the summed synaptic input of neurons in the form of the local field potential.9 Spiking activity has the highest temporal and spatial resolution of all the neural signals, with action potentials occurring in the order of milliseconds. In contrast, the local field potential integrates information over about 100 μm, with a temporal resolution of tens to hundreds of milliseconds.
Electrocorticography (ECoG), using electrodes placed in the subdural space (on the cortical surface), and electroencephalography (EEG), using scalp electrodes, are also being used to detect cortical waveforms for signal processing by advanced computer algorithms (Box 2, C, D). Although these methods are less invasive than using penetrating microelectrodes, they cannot record individual neuron action potentials, instead measuring an averaged voltage waveform over populations of thousands of neurons. In general, the further away the electrodes are from the brain, the safer the implantation procedure is, but with a resulting decrease in the signal-to-noise ratio and the amount of control signals that can be decoded (ie, there is a lot of background noise). Therefore, ECoG recordings, which are closer to the brain, typically have a higher signal spatial and temporal resolution than that achievable by EEG.8 As EEG electrodes are placed on the opposite side of the skull from the brain, the recordings have a low fidelity and a low signal-to-noise ratio. For stimulation, subdural electrodes require higher voltages to activate neurons than intracortical electrodes and are less precise for stimulation and recording. Transcranial magnetic stimulation can be used to stimulate populations of neurons, but this is a crude technique compared with the invasive microelectrode techniques.10
Currently, implanted devices have an electrical plug connection through the skull and scalp, with attached cables. This is clearly not a viable solution for long term implantation. The challenge for engineers has been to develop the next generation of implantable wireless microelectronic devices with a large number of electrodes that have a long duration of functionality. Wireless interfaces are beginning to emerge.3,11–13
Applications for brain–computer interfaces
Motor interfaces
The aim of the motor BCI has been to help paralysed patients and amputees gain motor control using, respectively, a robot and a prosthetic upper limb. Non-human primates with electrodes implanted in the motor cortex were able, with training, to control robotic arms through a closed loop brain–machine interface.14 Hochberg and colleagues were the first to place a 96-electrode array in the primary motor cortex of a tetraplegic patient and connect this to a computer cursor. The patient could then open emails, operate various devices (such as a television) and perform rudimentary movements with a robotic arm.15 For tetraplegic patients with a BCI, improved control of the position of a cursor on a computer screen was obtained by controlling its velocity and through advanced signal processing.16 These signal processing techniques find relationships between changes in the neural signals and the intended movements of the patient.17,18
Reach, grasp and more complex movements have been achieved with a neurally controlled robotic arm in tetraplegic patients.19,20 These tasks are significantly more difficult than simple movements as they require decoding of up to 15 independent signals to allow a person to perform everyday tasks, and up to 27 signals for a full range of movements.21,22 To date, the best BCI devices provide fewer than ten independent signals. The patient requires a period of training with the BCI to achieve optimal control over the robotic arm. More complex motor imagery, including imagined goals and trajectories and types of movement, has been recorded in the human posterior parietal cortex. Decoding this imagery could provide higher levels of control of neural prostheses.23 More recently, a quadriplegic patient was able to move his fingers to grasp, manipulate and release objects in real time, using a BCI connected to cutaneous electrodes on his forearms that activated the underlying muscles.24
The challenge with all these motor cortex electrode interfaces is to convert them to wireless devices. This has recently been achieved in a monkey with a brain–spinal cord interface, enabling restoration of movement in its paralysed leg,25 and in a paralysed patient with amyotrophic lateral sclerosis, enabling control of a computer typing program.11
These examples of BCIs have primarily used penetrating microelectrodes, which, despite offering the highest fidelity signal, suffer from signal loss over months to years due to peri-electrode gliosis.26 This scarring reduces electrical conduction and the resulting signal change can require daily or even hourly recalibration of the algorithms used to extract information.18 This makes BCIs difficult to use while unsupervised and hinders wider clinical application, including use outside a laboratory setting.
A recently developed, less invasive means of electrode interface with the motor cortex is the stent-electrode recording array (“stentrode”) (Box 2, B).27 This is a stent embedded with recording electrodes that is placed into the sagittal venous sinus (situated near the motor cortex) using interventional neuroradiology techniques. This avoids the need for a craniotomy to implant the electrodes, but there are many technical challenges to overcome before human trials of the stentrode can commence.
Lower-limb robotic exoskeleton devices that enable paraplegic patients to stand and walk have generated much excitement and anticipation. BCIs using scalp EEG electrodes are unlikely to provide control of movement beyond activating simple robotic walking algorithms in the exoskeleton, such as “walk forward” or “walk to the right”. Higher degrees of complex movement control of the exoskeleton with a BCI would require intracranial electrode placement.28 Robotic exoskeleton devices are currently cumbersome and expensive.
Sensory interfaces
Fine control of grasping and manipulation of the hand depends on tactile feedback. No commercial solution for providing artificial tactile feedback is available. Although early primate studies have produced artificial perceptions through electrical stimulation of the somatosensory cortex, stimulation can detrimentally interfere with the neural recordings.29 Optogenetics — the ability to make neurons light-sensitive — has been proposed to overcome this.30 Sensorised thimbles have been placed on the fingers of the upper limb myoelectric prosthesis to provide vibratory sensory feedback to a cuff on the arm, to inform the individual when contact with an object is made and then broken. Five amputees have trialled this, with resulting enhancement of their fine control and manipulation of objects, particularly for fragile objects.31 Sensory feedback relayed to the peripheral nerves and ultimately to the sensory cortex may provide more precise prosthetic control.32
Eight people with chronic paraplegia who used immersive virtual reality training over 12 months saw remarkable improvements in sensory and motor function. The training involved an EEG-based BCI that activated an exoskeleton for ambulation and visual–tactile feedback to the skin on the forearms. This is the first demonstration in animals or humans of long term BCI training improving neurological function, which is hypothesised to result from both spinal cord and cortical plasticity.33
The success of the cochlear prosthesis in restoring hearing to totally deaf individuals has also demonstrated how “plastic” the brain is in learning to interpret electrical signals from the sound-processing computer. The recipient learns to discern, identify and synthesise the various sounds.
The development of bionic vision devices has mainly focused on the retina, but electrical connectivity of these electrode arrays depends on the recipient having intact neural elements. Two retinal implants are commercially available.3 Retinitis pigmentosa has been the main indication. Early trials of retinal implants are commencing for patients with age-related macular degeneration. However, there are many blind people who will not be able to have retinal implants because they have lost the retinal neurons or optic pathways. Placing electrodes directly in the visual cortex bypasses all the afferent visual pathways.
It has been demonstrated that electrical stimulation of the human visual cortex produces discrete reproducible phosphenes. Several groups have been developing cortical microelectrode implants to be placed into the primary visual cortex. Since 2009, the Monash Vision Group has been developing a wireless cortical bionic vision device for people with acquired bilateral blindness (Box 3). Photographic images from a digital camera are processed by a pocket computer, which transforms the images into the relevant contours and shapes and into patterns of electrical stimulation that are transmitted wirelessly to the electrodes implanted in the visual cortex (Box 3, B). The aim is for the recipient to be able to navigate, identify objects and possibly read large print. Facial recognition is not offered because the number of electrodes will not deliver sufficient resolution.2 A first-in-human trial is planned for late 2017.2,34
The lateral geniculate nucleus of the thalamus is an alternative site for implantation of bionic vision devices. Further technical development of the design, manufacture and placement of multiple brain microelectrodes in this small deep brain structure is needed before this could be applied in humans.35
Memory restoration and enhancement
The same concepts and technologies used to record and stimulate the brain in motor and sensory prostheses can also be applied to deeper brain structures. For example, the fornix is an important brain structure for memory function. A human safety study of bilateral deep brain stimulation of the fornix has been conducted in 42 patients with mild, probable Alzheimer disease (ADvance trial), and this study will now proceed to a randomised controlled trial.36 This technique involves deep brain stimulation without direct feedback from neural recording.
A more definitive approach to memory augmentation would be to place a multi-electrode prosthesis directly into the hippocampus. Electrical mimicry of encoded patterns of memory about a task transmitted from trained donor rats to untrained recipient rats resulted in enhanced task performance in the recipients.37,38 This technology has been applied to the prefrontal cortex of non-human primates.39 Although human application is futuristic, this research is advancing rapidly. A start-up company was formed in 2016 to develop this prosthetic memory implant into a clinic-ready device for people with Alzheimer disease.40 The challenge in applying these therapies to Alzheimer disease and other forms of dementia will be to intervene before excessive neuronal loss has occurred.
Seizure detection and mitigation
Many patients with severe epilepsy do not achieve adequate control of seizures with medication. Deep brain electrical stimulation, using electrodes placed in the basal ganglia, is a treatment option for patients with medically refractory generalised epilepsy.41 Methods to detect the early onset of epileptic seizures using cortical recording and stimulation (to probe for excitability) are evolving rapidly.42 A hybrid neuroprosthesis, which combines electrical detection of seizures with an implanted anti-epileptic drug delivery system, is also being developed.43,44
Parkinson disease and other movement disorders
Deep brain stimulation in the basal ganglia is an effective treatment for Parkinson disease and other movement disorders.45 This type of BCI includes a four-electrode system implanted in the basal ganglia, on one or both sides, which is connected to a pulse generator implanted in the chest wall. This device can be reprogrammed wirelessly. Novel electrodes with many more electrode contacts and a recording capacity are being developed. This feedback controlled or closed loop stimulation will require a fully implanted BCI, so that the deep brain stimulation is adaptive and will better modulate the level of control of the movement disorder from minute to minute. More selective directional and steerable deep brain stimulation, with the electrical current being delivered in one direction from the active electrodes, rather than circumferentially, is being developed. The aim is to provide more precise stimulation of the target neurons, with less unwanted stimulation of surrounding areas and therefore fewer side effects.46
Technical challenges and future directions
Biocompatibility of materials, electrode design to minimise peri-electrode gliosis and electrode corrosion, and loss of insulation integrity are key engineering challenges in developing BCIs.47 Electrode carriers must be hermetically sealed to prevent ingress of body fluids. Smaller, more compact electronic components and improved wireless interfaces will be required. Electronic interfaces with larger numbers of neurons will necessitate new electrode design, but also more powerful computers and advanced signal processing to allow significant use time without recalibration of algorithms.
Advances in nanoscience and wireless and battery technology will likely have an increasing impact on BCIs. Novel electrode designs using materials such as carbon nanotubes and other nanomaterials, electrodes with anti-inflammatory coatings or mechanically flexible electrodes to minimise micromotion may have greater longevity than standard, rigid, platinum–iridium brain electrodes.48 Electrodes that record from neural networks in three dimensions have been achieved experimentally using injectable mesh electronics with tissue-like mechanical properties.49 Optogenetic techniques activate selected neuronal populations by directing light onto neurons that have been genetically engineered with light-sensitive proteins. There are clearly many hurdles to overcome before this technology is available in humans, but microscale wireless optoelectronic devices are working in mice.50
Populating the brain with nanobots that create a wireless interface may eventually enable direct electronic interface with “the cloud”. Although this is currently science fiction, the early stages of development of this type of technology have been explored in mice, using intravenously administered 10 μg magnetoelectric particles that enter the brain and modify brain activity by coupling intrinsic neural activity with external magnetic fields.51
Also in development is the electrical connection of more than one brain region to a central control hub — using multiple electrodes with both stimulation and recording capabilities — for integration of data and neuromodulation. This may result in more nuanced treatments for psychiatric illness (such as depression, post-traumatic stress disorder and obsessive compulsive disorder), movement disorders, epilepsy and possibly dementia.
Ethical and practical considerations
Implantable BCI devices are in an early phase of development, with most first-in-human studies describing only a single patient. However, the performance of these devices is rapidly improving and, as they become wireless, the next step will be to implant BCIs in larger numbers of patients in multicentre trials.
The prime purpose of neurobionic devices is to help people with disabilities. However, there will be pressure in the future for bionic enhancement of normal cognitive, memory, sensory or motor function using BCIs. Memory augmentation, cognitive enhancement, infrared vision and exoskeletal enhancement of physical performance will all likely be achievable.
The introduction of this technology generates many ethical challenges, including:
-
appreciation of the risk–benefit ratio;
-
provision of adequate and balanced information for the recipient to give informed consent;
-
affordability in relation to the fair and equitable use of the scarce health dollar;
-
inequality of patient access to implants, particularly affecting those in poorer countries;
-
undue influence on physicians and scientists by commercial interests; and
-
the ability to achieve unfair physical or cognitive advantage with the technology, such as enhancing disabled athletes’ performance using exoskeleton devices, military application with the creation of an enhanced “super” soldier, or using a BCI as the ultimate lie detector.52
The introduction of these devices into clinical practice should therefore not proceed unchecked. As the technology transitions from clinical trial to the marketplace, training courses and mentoring will be needed for the surgeons who are implanting these devices. Any new human application of the BCI should be initially tested for safety and efficacy in experimental animal models. After receiving ethics committee approval for human application, the technology should be thoroughly evaluated in well conducted clinical trials with clear protocols and strict inclusion criteria.53
One question requiring consideration is whether sham surgery should be used to try to eliminate a placebo effect from the implantation of a new BCI device. Inclusion of a sham surgery control group in randomised controlled trials of surgical procedures has rarely been undertaken,54 and previous trials involving sham surgery have generated much controversy.55–57 Sham surgery trials undertaken for Parkinson disease have involved placing a stereotactic frame on the patient and drilling of burr holes but not implanting embryonic cells or gene therapy.58–60 We do not believe sham surgery would be applicable for BCI surgery, for several reasons. First, each trial usually involves only one or a few participants; there are not sufficient numbers for a randomised controlled trial. Second, the BCI patients can serve as their own controls because the devices can be inactivated. Finally, although sham controls may be justified if there is likely to be a significant placebo effect from the operation, this is not the case in BCI recipients, who have major neurological deficits such as blindness or paralysis.
Clinical application of a commercial BCI will require regulatory approval for an active implantable medical device, rather than approval as a therapy. It is also important for researchers to ask the potential recipients of this new technology how they feel about it and how it is likely to affect their lives if they volunteer to receive it.61 This can modify the plans of the researchers and the design of the technology. The need for craniotomy, with its attendant risks, may deter some potential users from accepting this technology.
As the current intracortical electrode interfaces may not function for more than a few years because of electrode or device failure, managing unrealistic patient and family expectations is essential. Trial participants will also require ongoing care and monitoring, which should be built into any trial budget. International BCI standards will need to be developed so that there is uniformity in the way this technology is introduced and evaluated.
Conclusions
BCI research and its application in humans is a rapidly advancing field of interdisciplinary research in medicine, neuroscience and engineering. The goal of these devices is to improve the level of function and quality of life for people with paralysis, spinal cord injury, amputation, acquired blindness, deafness, memory deficits and other neurological disorders. The capability to enhance normal motor, sensory or cognitive function is also emerging and will require careful regulation and control. Further technical development of BCIs, clinical trials and regulatory approval will be required before there is widespread introduction of these devices into clinical practice.
Box 1 –
Schematic overview of the major components of brain–computer interfaces
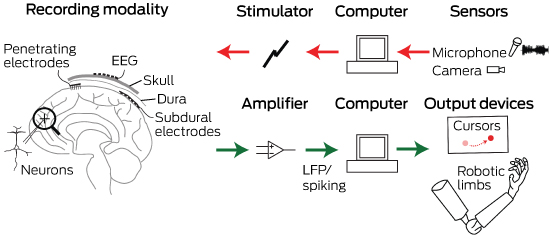
Common to all devices are electrodes that can interface at different scales with the neurons in the brain. For output-type interfaces (green arrows), the brain signals are amplified and control signals from them are decoded via a computer. These decoded signals are then used to control devices that can interact with the world, such as computer cursors or robotic limbs. For input-type interfaces (red arrows), such as vision or auditory prostheses, a sensor captures the relevant input, which a computer translates into stimulation parameters that are sent to the brain via an electrode interface. EEG = electroencephalography. LFP = local field potential.
Box 2 –
Electrodes of different scales that can be used to record neural activity for brain–computer interfaces
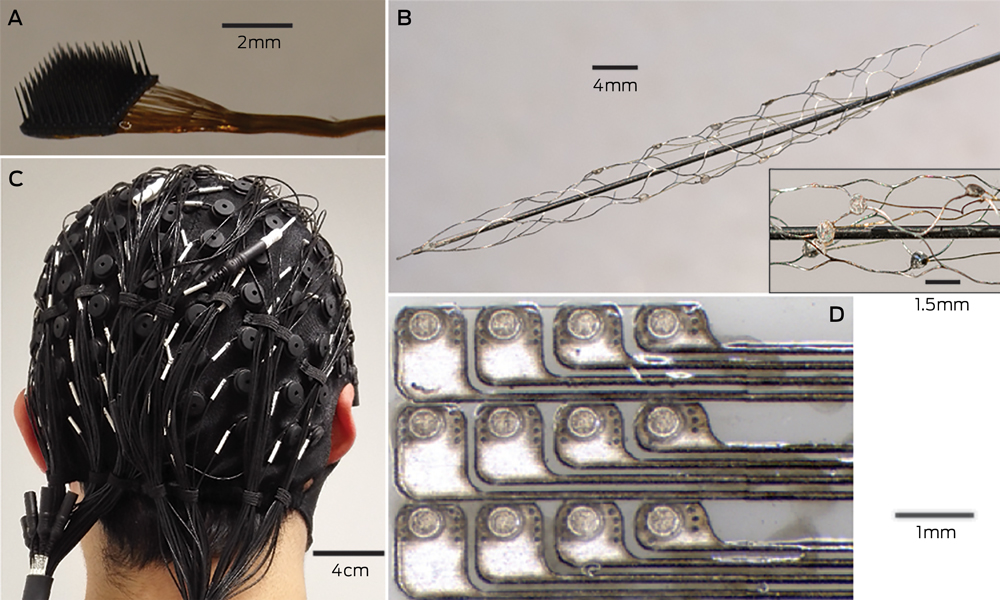
A: The most invasive method of recording neural activity, which produces the best signal quality, requires penetrating microelectrodes, such as this Utah array (Blackrock Microsystems), with 100 electrodes with a spacing of 400 μm. Wires connected to each electrode (bundled to the right of the image) need to be percutaneously connected to the outside world. B: Electrodes placed on an intravascular stent with (inset) a close-up image of a few electrodes (750 μm diameter). C: A 128-channel, non-invasive electroencephalography cap. After the cap is applied to the scalp, conductive gel is injected into each electrode to ensure electrical contact. D: An example of a planar array that can be placed in the subdural space to record electrocorticography signals. The platinum electrodes (350 μm diameter circles) are embedded in silicone.
Box 3 –
An example of a fully implantable brain–computer interface
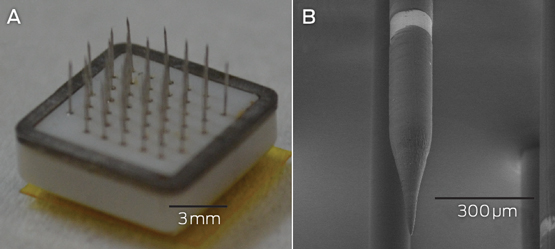
A: The Monash Vision Group cortical vision prosthesis, which consists of an array of penetrating microelectrodes (metallic spikes) connected through a ceramic casing to electronics that are capable of delivering electrical stimulation and receiving wireless power and control signals. B: A close-up of a single electrode with a 150 μm diameter. The bright band is the conductive ring electrode, where electrical charge is delivered. Electrodes are spaced 1 mm apart.
Indexation freeze hits veterans’ health care
A recent survey of some AMA members has highlighted the impact of the Government’s ongoing indexation freeze on access to Department of Veterans’ Affairs (DVA) funded specialist services for veterans.
The DVA Repatriation Medical Fee Schedule (RMFS) has been frozen since 2012.
The AMA conducted the survey following anecdotal feedback from GP and other specialist members that veterans were facing increasing barriers to accessing specialist medical care.
Running between March 3 and 10, the survey was sent to AMA specialist members (excluding general practice) across the country.
It attracted interest from most specialties, although surgery, medicine, anaesthesia, psychiatry and ophthalmology dominated the responses.
More than 98 per cent of the 557 participants said they treat or have treated veterans under DVA funded health care arrangements.
For the small number of members who said they did not, inadequate fees under the RMFS was nominated as the primary reason for refusing to accept DVA cards.
When asked, 79 per cent of respondents said they considered veteran patients generally had a higher level of co-morbidity or, for other reasons, required more time, attention and effort than other private patients.
According to the survey results, the indexation freeze is clearly having an impact on access to care for veterans and this will only get worse over time.
Table 1 highlights that only 71.3 per cent of specialists are currently continuing to treat all veterans under the DVA RMFS, with the remainder adopting a range of approaches including closing their books to new DVA funded patients or treating some as fully private or public patients.
If the indexation freeze continues, the survey confirmed that the access to care for veterans with a DVA card will become even more difficult.
Table 2 shows that less than 45 per cent of specialists will continue to treat all veterans under the DVA RMFS while the remainder will reconsider their participation, either dropping out altogether or limiting the services provided to veterans under the RMFS.
In 2006, a similar AMA survey found that 59 per cent of specialists would continue to treat all veteran patients under the RMFS.
There was significant pressure on DVA funded health care at the time, with many examples of veterans being forced interstate to seek treatment or being put on to public hospital waiting lists.
The Government was forced to respond in late 2006 with a $600m funding package to increase fees paid under the RMFS and, while the AMA welcomed the package at the time, it warned that inadequate fee indexation would quickly erode its value and undermine access to care.
In this latest survey, this figure appears likely to fall to 43.8 per cent – underlining the AMA’s earlier warnings. The continuation of the indexation freeze puts a significant question mark over the future viability of the DVA funding arrangements and the continued access to quality specialist care for veterans.
The AMA continues to lobby strongly for the lifting of the indexation freeze across the Medicare Benefits Schedule and the RMFS, with these survey results provided to both DVA and the Health Minister’s offices. The Government promotes the DVA health care arrangements as providing eligible veterans with access to free high quality health care and, if it is to keep this promise to the veterans’ community, the AMA’s latest survey shows that it clearly needs to address this issue with some urgency.
Chris Johnson
Table 1
|
Which of the following statements best describes your response to the Government’s freeze on fees for specialists providing medical services to veterans under the Repatriation Medical Fee Schedule (RMFS): |
|
|
Answer Options |
Response Percent |
|
I am continuing to treat all veterans under the RMFS |
71.3% |
|
I am continuing to treat existing patients under the RMFS, but refuse to accept any more patients under the RMFS |
9.9% |
|
I am treating some veterans under the RMFS and the remainder either as fully private patients or public patients depending on an assessment of their circumstances |
10.8% |
|
I am providing some services to veterans under the RMFS (e.g. consultations) but not others (e.g. procedures) |
5.6% |
|
I no longer treat any veterans under the RMFS |
2.4% |
Table 2
|
Which of the following statements best describes your likely response if the Government continues its freeze on fees for specialists providing medical services to veterans under the RMFS: |
|
|
Answer Options |
Response Percent |
|
I will continue to treat all veterans under the RMFS |
43.8% |
|
I will continue to treat existing patients under the RMFS, but refuse to accept any more patients under the RMFS |
15.5% |
|
I will treat some veterans under the RMFS and the remainder either as fully private patients or public patients depending on an assessment of their circumstances |
21.1% |
|
I will provide some services to veterans under the RMFS (e.g. consultations) but not others (e.g. procedures) |
8.4% |
|
I will no longer treat any veterans under the RMFS |
11.2% |