The immediate goal of antihypertensive therapy is the prompt achievement of target blood pressure without adverse effects on quality of life. The efficacy, tolerability, and safety of available pharmacological agents makes attainment of these goals possible in most patients. Nevertheless, undertreatment of hypertension results in the continued occurrence of many preventable and potentially negative outcomes for patients worldwide. In the National Health and Nutrition Examination Survey (NHANES) reported in 2008,1 estimates of age-standardised cardiovascular mortality directly attributable to uncontrolled blood pressure in the USA were 260 cases per 100 000 women and 290 cases per 100 000 men.
Preference: Nutrition
644
Move more, spend less time in hospital
A new study has found that older Australians can reduce their time spent in hospital by walking an extra 4,300 steps a day.
The epidemiologists from the University of Newcastle found that an increase in step count from 4,500 to 8,800 a day was associated with 0.36 fewer hospital bed days per person per year.
They noted that the cost of a day in hospital in Australia in 2012-13 was $1,895, so $550 can potentially be saved annually for each person who increases their physical activity by 4,300 steps a day.
“These steps can be accumulated as many brief activities throughout the day, or as steady walking for about three kilometres,” Dr Ben Ewald and colleagues wrote in the Medical Journal of Australia.
The 10-year study of people aged 55-plus found that the overall estimated number of bed-days per year of follow-up decreased by 9 per cent for each 1,000-step increase in daily step count.
Participants wore pedometers for one week during 2005-2007. The researchers then analysed the hospital data of all participants from the time of their recruitment until 31 March 2015.
Complete data was available from 2,110 people, aged 55 or more.
The researchers found that there was more benefit in moving from 3,000 to 5,000 steps daily than there was in moving from 8,000 to 10,000.
“Health interventions and urban design features that encourage walking could have a substantial effect on the need for hospital care, and should be features of health policy,” they said.
In a linked editorial, Alfred Deakin Professor Jo Salmon and Dr Nicky Ridgers from the Institute for Physical Activity and Nutrition at Deakin University suggested encouraging older patients to invest in wearable activity monitors, such as Fitbit, Garmin, and the Apple Watch.
“Further investigation of wearable technology is needed, particularly in different population groups, with the aim of identifying the key factors for enhancing sustained changes in physical activity,” they wrote.
“We need to identify how these devices can be integrated into clinical practice in order to improve health outcomes.
“But for health practitioners with sedentary patients looking for assistance with becoming more active, a wearable activity monitor would be a good first step.”
You can read the study here (https://www.mja.com.au/journal/2017/206/3/daily-step-count-and-need-hospital-care-subsequent-years-community-based-sample?0=ip_login_no_cache%3D35edc06435791ffbc0d09693c6bb1448) and the commentary here (https://www.mja.com.au/journal/2017/206/3/wearable-technology-activity-motivator-or-fad-wears-thin).
Maria Hawthorne
The obesity epidemic and sugar-sweetened beverages: a taxing time
Government action is essential to improve diet
Obesity is a major and costly public health epidemic, and an Australian national health priority that requires urgent action. While obesity is a complex condition with many contributing factors, a relative excessive kilojoule intake is a major driver of weight gain. Sugar-sweetened beverages (SSBs) contribute to this excess energy intake in children and adults, are linked with obesity, diabetes and dental caries, and are an increasing focus of public health attention.
The World Health Organization guidelines recommend reducing the free sugars intake in adults and children to less than 10% of the total energy intake, and to less than 5% for best health outcomes.1 Half of the Australian population, almost 75% of people aged 9–18 years and 35% of people aged 51–70 years exceed the WHO recommendation.2 In 2011–12, Australians consumed an average of 60 g of free sugars per day (equivalent to 14 teaspoons of white sugar), with 52 g (12 teaspoons) coming from added sugars consumed through energy-dense, nutrient-poor discretionary foods and beverages.2 Males aged 14–18 years averaged 92 g (21 teaspoons) of free sugars daily, with 10% consuming 160 g (38 teaspoons), equivalent to 23% of their daily energy intake.2 Over half of free sugars come from SSBs, led by soft drinks and electrolyte and energy drinks.2 Australia is among the highest global markets for SSBs and in 2011–12, 47% of children and 31% of adults consumed them. The average daily SSB intake in male consumers aged 4–30 years was 750 mL (equivalent to two standard cans).3
Proposed regulatory interventions to reduce SSB consumption include increasing taxes, limiting advertising, health warning labelling, and reformulation to reduce sugar content. Among these, an SSB tax has received the most attention and has been implemented in a number of countries, amid strong support and equally strong opposition. So is it time to introduce an SSB tax in Australia?
Health harm
Accumulating evidence supports a substantial risk of weight gain, diabetes and dental caries with increasing consumption of SSBs. In initially non-obese adults, each daily increase of one 355 mL serving of SSB was associated with 0.5 kg greater weight gain every 4 years,4 and women with high SSB consumption gained 5.0 kg more over 8 years compared with women who decreased their SSB intake.4 Health harm of SSBs equates to 8.5 million disability-adjusted life years worldwide through adiposity-related cardiovascular diseases, cancers and diabetes.5 While this evidence is challenged by some, conclusions on SSB health harms are associated with disclosure of conflicts of interest, with authors sponsored by food companies being five times more likely to conclude no association between SSB consumption and obesity risk (in children) compared with those without industry sponsorship.6
Individual not government responsibility
A key philosophical argument centres on the consumption of SSBs as being a matter of individual choice, and regulatory intervention fostering a nanny state. However, if followed logically, such thinking calls into question government intervention to control tobacco and alcohol or promote road safety through seat belts and speed restrictions. Government intervention in these areas is often justified on the basis of limiting personal behaviours that may harm others, but there are many examples of current interventions, particularly in children and adolescents, which are implemented to protect the person, rather than to protect others. Individual rights can be equally violated if government fails to take effective and proportionate measures to remove health threats from the environment in the cause of improving population health.7 Government pays for health services and consequently has a right and duty to address externalities to promote and protect public health. Moreover, government intervention on health risks, including foods, can be justified from an economic perspective when the burden of diseases is mostly paid by society. Finally, how much autonomy do we really have in our food choices? There are numerous examples of these choices being constrained through the industry actions. Over many years, food manufacturers have increased the size of a standard SSB drink by about three-fold, knowing that larger containers alter the norm of an appropriate portion size and increase consumption.8
Opposition to taxing food is also framed in the context that food is not uniformly harmful, unlike other public health threats. In this respect, an SSB tax is best compared with alcohol taxes, since alcohol is also not uniformly harmful, with health harm related to heavy or excessive consumption, while limited consumption may pose little health risk.
Effects of an SSB tax
An SSB tax aims to encourage a healthier diet by reducing SSB consumption and promoting a shift to untaxed healthier substitutes. It may also incentivise industry to reformulate to reduce SSB sugar content. A number of countries have introduced an SSB tax. The United Kingdom intends taxing SSBs from 2018, and the Australian Greens Party committed to an SSB tax in the 2016 federal election.
Taxes are an effective public health strategy for reducing consumption and are commonly used in tobacco and alcohol control. Introduced in January 2014, Mexico’s SSB tax resulted in a 6% decline in purchases of taxed beverages over 2014 compared with pre-tax levels, reaching a 12% reduction in December 2014. This was accompanied by a 4% increase in purchases of untaxed beverages, mainly bottled water.9 The ongoing impact of this tax has been challenged with new data suggesting a small increase in sales of SSBs in 2015, but still lower than the increase in pre-tax sales. This has been reported as “a bright spot for an industry that has feared it could be cast as the next tobacco”.10 Arguments that an SSB tax is an ineffective means to reduce consumption are inconsistent with food industry claims of potential damage and job losses, which instead may point to the industry believing that a tax would substantially impact consumption.
There are concerns that an SSB tax will unfairly disadvantage lower socio-economic groups, who will continue to consume SSBs, but pay more. A recent review found the monetary impact of an SSB tax to be small, with relatively minor differences between higher and lower income households.11 The analysis of the Mexico tax found that while all socio-economic groups purchased fewer taxed beverages, the reductions were higher in low socio-economic households.9
The potential impact of an SSB tax has also been challenged on the basis that consumers will substitute SSBs with cheaper and equally unhealthy options. There is little direct evidence on substitution, and data rely on models based on self-reported consumer purchase information and price elasticity. As exemplified by Zhen and colleagues,12 overall, these studies find a reduction in energy intake and weight, with no evidence of substitution with other sugary beverages, but almost half the reduction in SSB calories may be compensated for by an increase in fat intake.
In favour of a tax are the combined health and fiscal benefits, with revenue hypothecated for promoting healthy lifestyles and obesity prevention and care. Opinion polls suggest greater population acceptability of food taxes when the health benefits are emphasized and the use of the revenue is directed to health-promoting programs.13
A recent Australian study, which modelled the long term effects of an additional 20% SSB tax, reported significant benefits on health and a reduction in health expenditure.14
The way forward
Obesity is a major health problem impacting individuals, families and society. With two in three Australians being overweight or obese, current preventive interventions centred on education to encourage voluntary individual action have failed in our pervasive obesogenic environment. Food products such as SSBs were not primarily developed to cause harm, but when harm is demonstrated, it is often denied or challenged by those with vested interests. The excessive consumption of SSBs — a high energy-dense discretionary food with no nutritional benefit, which can harm health — cannot be justified. Increasing the cost through taxation reduces consumption, no matter the product. An SSB tax alone is unlikely to be sufficient to curb obesity, but needs to be included in a multicomponent strategy.13 This is similar to tobacco control and road safety, where no single measure achieved the desired outcome.
There are considerable challenges to introducing regulatory measures to curb the obesity epidemic. Our complex and multilayered system is often used as an excuse for inaction. Industry opposition is understandable and reminiscent of the opposition to interventions to reduce tobacco consumption. In the face of the powerful industry lobby, governments are reluctant to take a decisive action, opting for ineffective soft options. Voluntary action alone will not solve this problem. There are numerous examples of government health interventions that are accepted by the public, despite strong industry opposition.
Improving the diet of Australians and reducing the intake of discretionary foods, especially those high in added sugars, will require stronger government action and leadership. An SSB tax would send a strong message that government is serious about obesity and the harms of unhealthy diets.
International organizations are increasingly acknowledging taxation as an important tool in tackling unhealthy diets.15 The 2016 report of the WHO Commission on Ending Childhood Obesity recommended implementing an SSB tax.16 It is time for a decisive government intervention, and for Australia to have an informed and comprehensive dialogue on a range of regulatory intervention to deal with the obesity epidemic. An SSB tax should be high on the list of priorities.
[Comment] New WHO antenatal care model—quality worth paying for?
The 2016 WHO guidelines on antenatal care1 were published earlier this month and are widely welcomed because they are not only academically robust, but also relevant to end-users and patients. The guidelines cover antenatal care for normal pregnancies and have adopted a woman-centred, holistic approach to care. They cover nutritional interventions, maternal and fetal assessment, preventive measures, interventions for common physiological pregnancy symptoms, and health systems interventions to improve the use and quality of antenatal care.
[Articles] Dissonant health transition in the states of Mexico, 1990–2013: a systematic analysis for the Global Burden of Disease Study 2013
Mexico achieved sizeable reductions in burden due to several causes, such as diarrhoeal diseases, and risks factors, such as undernutrition and poor sanitation, which were mainly associated with maternal and child health interventions. Yet rising adult mortality rates from chronic kidney disease, diabetes, cirrhosis, and, since 2000, interpersonal violence drove deteriorating health outcomes, particularly in men. Although state inequalities from communicable diseases narrowed over time, non-communicable diseases and injury burdens varied markedly at local levels.
[Correspondence] Confronting inequality in newborn survival in South Sudan
It has been 5 years since South Sudan, the world’s youngest nation, achieved independence. However, ongoing violence and economic instability have muted this celebration. The country is experiencing health service delivery challenges due to attacks against aid organisations, deteriorating access to health facilities, broken supply chains for medical supplies and drugs, and health-worker shortages. Emergency responses for measles vaccination, cholera, and malnutrition struggle to reach children; and as noted in The Lancet, mental health support is minimal despite the heavy burden of trauma.
[Correspondence] Additive burdens of malnutrition, poverty, and substance abuse
In Hélène Delisle and Malek Batal’s correspondence (June 18, p 2504),1 the authors eloquently noted the dual burdens of undernutrition and overnutrition among socioeconomically disadvantaged populations. However, one important and rapidly increasing group merits further comment. More than 2·5 million Americans abuse heroin or prescription opioids,2 leaving the USA in the midst of an opioid abuse epidemic. The adverse consequences of illicit opioid use (eg, overdose, infectious disease, premature death) are widely discussed.
[Editorial] Protecting health in Yemen
The health and humanitarian situation in Yemen is desperate. As Abdulrahman A Al-Khateeb highlights in a letter in today’s Lancet, 2·8 million Yemenis have been forced to leave their homes because of the ongoing conflict. More than 80% of the population is in need of humanitarian assistance, 50% are unable to meet their food needs, and 70% have limited access to clean water and sanitation. The war is taking a considerable toll on children, including increases in child trafficking, recruitment of child soldiers, child marriage, and severe acute malnutrition.
Sarcopenia: a potential cause and consequence of type 2 diabetes in Australia’s ageing population?
Obesity epidemics have developed concurrently with population ageing worldwide. More than 40% of adults who were aged 25–29 years in 2000 will be obese by the time they reach the age of 60–64 years.1 The increasing prevalence of type 2 diabetes has mirrored obesity epidemics. There are about one million people living with type 2 diabetes in Australia, and more than 90% of these individuals are aged 40 years or older.2 Worldwide, the highest age-specific prevalence of any diabetes (19%) is observed in those aged 60–79 years, and this age group will also have the greatest proportional increase in patients with any diabetes by 2035.3
A characteristic of ageing that has been under-investigated as a potential contributor to the risk of type 2 diabetes, and functional deficits common to this condition, is sarcopenia. We performed a non-systematic search of the MEDLINE and Embase databases using search terms including (but not limited to) “sarcopenia”, “muscle mass”, “physical performance”, “diabetes” and “insulin resistance”, with additional review of our personal reference libraries, to identify recent scientific literature investigating the effects of sarcopenia on the risk of type 2 diabetes, the progression of sarcopenia in older adults with existing type 2 diabetes, and potential therapies beneficial for both conditions.
Defining and diagnosing sarcopenia
The term sarcopenia, from the Greek for “poverty of flesh”, was first proposed in 1989 as a descriptor for age-related muscle wasting by Irwin Rosenberg, who commented that “no decline with age is more dramatic or potentially more functionally significant than the decline in lean body mass”.4 Although this decline in muscle mass with age has consequences for health, subsequent research has found that loss of muscle strength during ageing outpaces loss of muscle mass by up to five times,5 and that low muscle strength is more consistently associated with functional decline than low muscle mass.6 Accordingly, experts now describe sarcopenia as a multidimensional condition requiring assessment of muscle mass, muscle strength and physical performance.
The development of clinically relevant operational definitions for sarcopenia and the recent establishment of an International Classification of Diseases, 10th revision, clinical modification (ICD-10-CM) code for the condition7 have provided the first real impetus for clinicians to diagnose sarcopenia in a systematic fashion.8 Box 1 summarises three current operational definitions and their appropriate measurement techniques and thresholds. Although the lack of consensus on a single operational definition of sarcopenia is a barrier to its clinical assessment, the condition can be diagnosed using relatively inexpensive equipment requiring minimal time and expertise. For example, the European Working Group on Sarcopenia in Older People (EWGSOP) defines sarcopenia as the presence of low appendicular lean mass (generally assessed by dual-energy x-ray absorptiometry, but can also be assessed by portable bioelectrical impedance analysis equipment) in addition to low hand grip strength (measured by hydraulic hand grip dynamometer) or gait speed9 over a short (4 m) walkway. The International Working Group on Sarcopenia10 and the Foundation for the National Institutes of Health (FNIH) Biomarkers Consortium Sarcopenia Project11 state that sarcopenia can be assessed using the same equipment, but with different thresholds.
There is justification for sarcopenia case finding in health care. Although sarcopenia prevalence estimates are influenced by the operational definition applied, as many as 30% of community-dwelling older adults may have the condition, depending on demographic characteristics including age and ethnicity.12 Sarcopenia is consistently a predictor of poor quality of life, difficulties with activities of daily living, mobility disability, falls, fractures, institutionalisation and mortality, independent of other comorbidities.8,9 The costs of sarcopenia to health services in Australia are likely to be substantial, given that annual health-related costs for older Dutch adults were about three times higher for individuals with sarcopenia than for those without the condition.13
Sarcopenia in the pathogenesis of type 2 diabetes
The metabolic outcomes of sarcopenia have received less attention than the functional consequences in the research literature, but they are no less relevant clinically. There are several pathways by which age-related changes in skeletal muscle may contribute to insulin resistance (Box 2). Skeletal muscle is the largest insulin-sensitive tissue in the body and accounts for 80% of glucose uptake under euglycaemic hyperinsulinaemic conditions. Skeletal muscle insulin resistance is a key process in the development of type 2 diabetes, which may be observed decades before β-cell failure and hyperglycaemia develop.14 It is likely that significantly lower skeletal muscle mass results in reduced capacity for glucose disposal in older adults with sarcopenia.
In addition to a loss of mass during ageing, muscle undergoes numerous composition changes that are often described as declines in muscle quality. These declines in quality partly explain the faster rate of loss of muscle strength compared with loss of mass, and may also increase the risk of insulin resistance. Ageing skeletal muscle has reduced oxidative capacity, resulting in increased production of reactive oxygen species, which contributes to oxidative mitochondrial DNA mutagenesis and pro-inflammatory processes.15 Both mitochondrial dysfunction and chronic low-grade inflammation are associated with insulin resistance.15 Also, during ageing, there is an increase in infiltration of skeletal muscle by ectopic fat, including intramyocellular lipids (IMCL) and adipocytes located between muscle groups (intermuscular) and between muscle fascicles (intramuscular). Both IMCL and intramuscular and intermuscular adipose tissue (IMAT) have been implicated in insulin resistance.16 Paradoxically, high levels of IMCL are reported in endurance athletes, suggesting that high levels are beneficial for some individuals. IMAT-derived adipocytes may deleteriously affect muscle metabolism and insulin sensitivity through increased local secretion of pro-inflammatory adipokines, and intermuscular fat may also impair insulin action through reducing blood flow to muscle.16
Using peripheral quantitative computed tomography imaging of calf muscles, we have observed that overweight and obese women aged 50–89 years with type 2 diabetes have a 70% larger IMAT cross-sectional area and 4% lower muscle density (indicating higher levels of intramuscular adipose tissue) than women without type 2 diabetes matched by age and body mass index (both P ≤ 0.05, our unpublished data) (Box 3). In the Look AHEAD trial of middle-aged to older adults in the United States, participants with type 2 diabetes had 0.5 kg more IMAT than did controls without diabetes.17 IMAT, but not subcutaneous adipose tissue, is positively correlated with insulin resistance in type 2 diabetes, despite constituting a much smaller proportion of total body fat.18
Leg muscle mass, strength and functional performance are significantly lower in older patients with type 2 diabetes compared with healthy controls,19 but few prospective studies have investigated the risk of incident type 2 diabetes in older adults with sarcopenia. Among obese participants in the English Longitudinal Study of Ageing, there was a more than threefold increased risk of self-reported incident type 2 diabetes over 6 years for those whose baseline hand grip strength was in the sarcopenic range according to the FNIH definition.20 In the Osteoporotic Fractures in Men study, older men in the highest quartile for insulin resistance (among those without type 2 diabetes), defined by the homoeostasis model assessment of insulin resistance, had a twofold increased likelihood of a 5% decline in total lean body mass over almost 5 years.21 An 11-year follow-up of the Health, Aging and Body Composition (Health ABC) Study found a 40–60% decrease in the risk of incident type 2 diabetes among normal-weight women with greater abdominal and thigh muscle area; but greater muscle mass predicted an increased risk in overweight and obese women.22 It is possible that larger IMAT depots in the muscles of obese women explain this controversial finding.
Factors including inflammation, comorbidities and low levels of physical activity also predispose patients with type 2 diabetes to an increased risk of sarcopenia. In the Health ABC Study, thigh muscle size declined twice as fast over 6 years in older women with type 2 diabetes compared with women without diabetes,23 and strength declined by one-third more over 3 years in older patients with type 2 diabetes compared with those without diabetes.24 Patients in the US over the age of 60 years with type 2 diabetes were found to have poorer balance and increased likelihood of falls in the previous 12 months compared with patients without diabetes.25 In a prospective analysis of the Study of Osteoporotic Fractures, older women with insulin-treated type 2 diabetes at baseline had an almost threefold increased risk of falling more than once a year over an average of 7 years, compared with patients without diabetes.26 Conditions common to type 2 diabetes, such as hypoglycaemia, poor vision and peripheral neuropathy, undoubtedly contribute to the increased falls risk in older adults with diabetes, but poor physical function is also clearly important. In a secondary analysis of the North Carolina Established Populations for Epidemiologic Studies of the Elderly and Women’s Health Initiative trials, a one-third higher risk of incident fracture was observed for older women with type 2 diabetes, but this association was mediated by poor physical function.27 Thus, poor muscle function may partly explain why older patients with type 2 diabetes have more fractures than those without diabetes, despite generally having higher bone mineral density.28 Furthermore, the increased mortality risk for normal-weight compared with overweight patients with type 2 diabetes appears to be mediated by their smaller relative muscle size.29
Concurrent therapies for type 2 diabetes and sarcopenia
There is little evidence that common pharmacological therapies for type 2 diabetes are beneficial in preventing or reversing sarcopenia in older adults. On the contrary, metformin, the first-line pharmacological therapy for diabetes, is an AMP-activated protein kinase agonist and may cause autophagic muscle cell death, while insulin stimulates muscle protein synthesis in young but not older adults, suggesting it provides no protection from age-related muscle wasting.30
Lifestyle modification, particularly weight loss, is a key therapeutic component for type 2 diabetes, with modest weight loss (5–10% of bodyweight) contributing to improved glucose control.31 However, weight loss can include declines in muscle mass and may result in undesirable metabolic and functional consequences, particularly in patients with type 2 diabetes and sarcopenia. For this reason, exercise that promotes gains in muscle mass and function should be a component of lifestyle modification for older adults with type 2 diabetes. A 6-month randomised controlled trial of high-intensity progressive resistance training plus moderate weight loss versus moderate weight loss alone in 36 overweight older adults showed threefold greater decreases in glycated haemoglobin levels in the resistance training group.32 Furthermore, this group had significantly higher lean body mass and muscle strength at follow-up compared with the weight loss-alone group, despite similar reductions in fat mass. Similarly, in postmenopausal women with obesity, glucose infusion rates increased significantly after 16 weeks of aerobic plus resistance (involving weight machines) exercise, but not aerobic exercise alone.33
Clearly, resistance training requiring access to large equipment such as weight machines is not feasible in most clinical settings. Nevertheless, exercise programs requiring minimal equipment may improve physical performance in older adults with type 2 diabetes. In the US Lifestyle Interventions and Independence for Elders (LIFE) study, more than 1600 participants aged 70–89 years with poor physical performance were randomly assigned to a structured physical activity or a health education intervention. The exercise group, who completed moderate walking, ankle weights, balance and flexibility exercises, had about 30% reduced risk for 2.5-year mobility disability compared with those receiving health education, and similar benefits were reported for those with and without type 2 diabetes.34 A meta-analysis of resistance band training, which uses inexpensive elastic bands to progressively increase resistance, suggests that this type of training may result in significant improvements in leg strength but not in glycated haemoglobin levels.35 Thus, lower-intensity resistance training programs are likely to be effective in preventing functional decline in older patients with type 2 diabetes, but further research is required to determine whether they can also provide improvements in metabolic health.
An area of recent research focus that is important to the prescription of lifestyle modification programs for older patients with type 2 diabetes is resistance to the beneficial effects of exercise. As many as 15–20% of individuals with type 2 diabetes obtain no improvements in glucose homoeostasis, insulin sensitivity or muscle mitochondrial density after supervised exercise interventions, despite adequate adherence.36 Furthermore, in a study investigating the effects of 5 months of aerobic or resistance training on physical function in overweight and obese women aged 65–79 years, 13%, 30% and 30% showed no improvement in aerobic capacity, knee extension strength and physical performance, respectively.37 It has been hypothesised that poor exercise responsiveness within skeletal muscle occurs as a result of attenuated expression of key fuel metabolism genes, including peroxisome proliferator-activated receptor γ coactivator-1α, peroxisome proliferator-activated receptor β/δ and pyruvate dehydrogenase kinase. Studies investigating regulators of the transcription of these genes may therefore have success in enhancing adaptations to exercise.36
Inflammation, low 25-hydroxyvitamin D (25(OH)D) status and poor muscle quality are all common in people with type 2 diabetes and may contribute to poor exercise responsiveness. Almost 20% of sedentary adults with elevated plasma C-reactive protein (CRP) concentrations have no improvement in fasting insulin levels after an endurance training program.38 We have found that older adults with high baseline levels of both 25(OH)D (≥ 50 nmol/L) and physical activity (≥ 10 000 steps/day) gained 2 kg less body fat over 5 years compared with those who had low 25(OH)D levels but high levels of physical activity, suggesting that adequate 25(OH)D levels enhance the benefits of physical activity for body composition in older adults.39 In support of this, the greatest improvements in physical performance in frail Japanese older adults after 3 months of exercise were observed in those with higher baseline 25(OH)D levels (> 67.5 nmol/L).40 Older women with adequate vitamin D status also demonstrated greater fat oxidation during exercise.41
We have previously proposed that low vitamin D status promotes adipogenesis, leading to increased IMAT deposition.42 Given older adults with high baseline IMAT levels have blunted improvements in muscle function after exercise,43 it is possible that increased IMAT and associated skeletal muscle inflammation is a mechanism through which low vitamin D status contributes to poor exercise responsiveness. Vitamin D supplementation has, to date, shown few benefits for metabolic health and physical function, although studies have been limited by inadequate sample sizes, doses and durations, and by inclusion of vitamin D-replete participants.44 This therapy is only likely to be effective in those who achieve replete 25(OH)D levels from initial low levels. A 12-month weight loss intervention combined with 2000 IU/day of vitamin D showed no effect on body composition compared with placebo.45 However, participants whose 25(OH)D levels reached ≥ 75 nmol/L lost 3 kg more bodyweight and 2% more body fat than did those whose 25(OH)D levels were < 75 nmol/L.
Although Australian guidelines currently recommend dietary protein intakes of 1 g/kg/day for adults aged over 70 years, intakes of 1.2 to 1.6 g/kg/day may be most effective for enhancing exercise-induced muscle gains, and there is no evidence of renal disorders with these intakes.46 Managing weight loss in older patients with type 2 diabetes while increasing the proportion of energy from protein may be best accomplished by reducing carbohydrate intake.47 High protein intakes may also support weight loss by increasing satiety. A 4-month cluster randomised controlled trial of 100 female nursing home residents found that progressive resistance training combined with 1.3 g/kg/day of red meat resulted in greater gains in muscle mass and strength and decreases in fat mass, relative to resistance training alone.48 Muscle protein synthesis in response to protein supplementation in older adults may also be enhanced by adequate vitamin D status. Daily supplementation of 2 g β-hydroxy β-methylbutyrate (a metabolite of leucine), 5 g arginine and 1.5 g lysine for 12 months in older adults resulted in significant improvement in knee extension strength only for those whose baseline 25(OH)D levels were ≥ 75 nmol/L.49 Similarly, in older adults with sarcopenia, exercise plus daily whey protein (22 g), essential amino acids (11 g, including 4 g leucine) and vitamin D (100 IU) resulted in almost 2 kg greater gain in lean mass compared with exercise alone, as well as significant gains in hand grip strength and declines in CRP levels.50 Nevertheless, further research is required to confirm the effects of dietary supplementation in patients with type 2 diabetes and sarcopenia.
Conclusions
The prevalence and socio-economic burden of sarcopenia will increase in Australia in coming years, but sarcopenia presently receives little attention in clinical settings, likely due in large part to a lack of clarity about its definition and assessment. Expert groups have attempted to reduce this confusion by providing clinical guidelines and, while further work is required to achieve a consensus operational definition of sarcopenia, diagnosis can now be easily integrated into clinical practice. The establishment of the ICD-10-CM code will enable improved reporting of the condition.
Through integrating sarcopenia case finding into clinical practice, this previously under-appreciated risk factor for type 2 diabetes in older adults can be systematically monitored, and lifestyle modification for primary and secondary prevention much better targeted. The evidence presented here shows that older adults with sarcopenia are at risk of developing type 2 diabetes, and those with prevalent type 2 diabetes show an accelerated loss of muscle mass and function that may increase the risk of further metabolic and functional declines. Interventions that reverse or halt progression of sarcopenia in patients with type 2 diabetes are likely to have important health benefits, given that the evidence suggests poor muscle mass and function substantially mediate associations of type 2 diabetes with incident fractures and mortality.
Including progressive resistance training in lifestyle modification programs should be considered for older patients with sarcopenia, type 2 diabetes or both. Clinicians need to be cognisant that individual responses to exercise vary considerably in patients with type 2 diabetes, and beneficial metabolic and functional outcomes are more likely to be obtained when adherence and responsiveness to the therapy are closely monitored, as with pharmacotherapy. Exercise programs should also be regularly adapted to support ongoing improvements in muscle mass and function. Ensuring adequate vitamin D status and maintenance of dietary protein intakes during energy restriction may optimise the effects of exercise interventions targeting type 2 diabetes and sarcopenia in older adults, thereby delaying onset of morbidity and loss of independence related to both conditions.
Box 1 –
Suggested measurement techniques and thresholds for components of sarcopenia according to current consensus definitions
|
Component |
Thresholds |
Method and equipment |
|||||||||||||
|
|
|||||||||||||||
|
European Working Group on Sarcopenia in Older People9 |
|||||||||||||||
|
Low muscle mass |
Appendicular lean mass adjusted for height (m2):Men: < 7.26 kg/m2Women: < 5.50 kg/m2 |
Whole-body DXA and stadiometer |
|||||||||||||
|
Skeletal muscle mass adjusted for height (m2):Men: < 8.87 kg/m2Women: < 6.42 kg/m2 |
BIA and stadiometer |
||||||||||||||
|
Low muscle strength |
Hand grip strength:Men: < 30 kgWomen: < 20 kg |
Hydraulic hand grip dynamometer |
|||||||||||||
|
Poor physical performance |
Gait speed: ≤ 0.8 m/s |
4 m walkway and stop watch |
|||||||||||||
|
International Working Group on Sarcopenia10 |
|||||||||||||||
|
Low muscle mass |
Appendicular lean mass adjusted for height (m2):Men: ≤ 7.23 kg/m2Women: ≤ 5.67 kg/m2 |
Whole-body DXA and stadiometer |
|||||||||||||
|
Poor physical performance |
Gait speed: < 1.00 m/s |
4 m walkway and stop watch |
|||||||||||||
|
Foundation for the National Institutes of Health Biomarkers Consortium Sarcopenia Project11 |
|||||||||||||||
|
Low muscle mass |
Appendicular lean mass adjusted for BMI (kg/m2):Men: < 0.789Women: < 0.512 |
Whole-body DXA, stadiometer and weight scales |
|||||||||||||
|
Low muscle strength |
Hand grip strength:Men: < 26 kgWomen: < 16 kg |
Hydraulic hand grip dynamometer |
|||||||||||||
|
|
|||||||||||||||
|
BIA = bioelectrical impedance analysis. BMI = body mass index. DXA = dual-energy x-ray absorptiometry. |
|||||||||||||||
Box 2 –
Potential pathways by which sarcopenia contributes to insulin resistance in ageing*
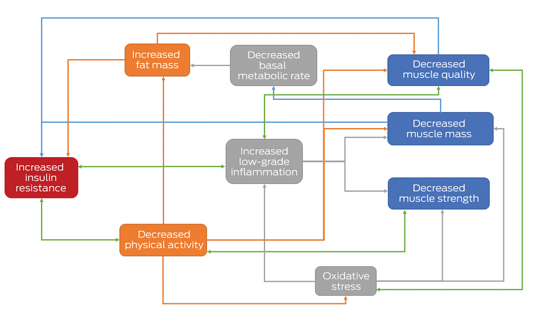
* Components of sarcopenia are shown in the blue boxes. Green arrows indicate possible bidirectional relationships, illustrating mechanisms by which sarcopenia may be accelerated in people with type 2 diabetes.
Box 3 –
Transverse peripheral quantitative computed tomography images of the mid-calf highlighting IMAT in age- and BMI-matched obese older women (A) without and (B) with type 2 diabetes*

BMI = body mass index. IMAT = intramuscular and intermuscular adipose tissue. * IMAT is indicated by the green pixels located in the black muscle compartment. Both women had a BMI of 35 kg/m2 and were aged 75 years, but the woman with type 2 diabetes (B) had greater subcutaneous fat, a smaller muscle cross-sectional area (649 v 752 cm) and twice as much IMAT (28.5 v 14 cm) as the woman without type 2 diabetes (A). The woman with type 2 diabetes also had poor muscle function, meeting the European Working Group on Sarcopenia in Older People definition of sarcopenia (gait speed ≤ 0.8 m/s and hand grip strength < 20 kg).
Gluten content of imported gluten-free foods: national and international implications
Coeliac disease (CD) is the only common disease for which strict dietary compliance is the sole treatment. Sensitivity to gluten varies between patients with CD, so that restricting levels in food to under one part per million (ppm) would protect the maximum number of patients.1 In a daily diet of 500 g food, 1 ppm is equivalent to 0.5 mg, the amount in 1/5000 of a slice of wheat flour bread containing 2.5 g gluten.
International food codes require that foods labelled “gluten-free” (GF) contain less than 20 ppm gluten; in Australia and New Zealand, however, a “no detectable gluten” standard applies.2–4 Current laboratory techniques have a reporting limit of 1 ppm, and a detection limit of 0.5 ppm gluten in food. We assessed the compliance of imported GF-labelled foods with the local food standard, as well as the international capacity of industry to comply with Australian standards, given commercially available analytical reporting and detection limits.
A total of 169 GF-labelled food items manufactured overseas were purchased from four retailers in Perth, Western Australia. The countries of origin were in Europe (nine countries), Asia (nine), and North (two) and South America (five); the food categories included crackers, bread and biscuits (41 items), cereals, flour and grains (37), condiments and sauces (30), spices (21), pasta (16), drinks and soups (15), and confectionary and snacks (nine).
We used a sandwich enzyme-linked immunosorbent assay (ELISA) gliadin detection kit (ESGLISS-48, ELISA Systems). Testing complied with strict food chemistry testing protocols: five variable concentration calibration standards and blank solution tests were used, calibration standards performance was confirmed every 15 samples, internal control materials were employed, and duplicate random samples (1 in 10) from each ELISA plate were tested. All positive results were confirmed on a stored original food sample.
Gluten was detected in 24 of 169 products (14%), of which 20 had unquantifiable but detectable levels (< 1 ppm) and four had quantifiable levels (three, 1.0 ppm; one, 1.1 ppm). Gluten was detected in products supplied from each of the four continents and from each food category (except pasta and drinks/soups).
Our findings, in conjunction with those of 2008 and 2010 surveys of foods mostly produced in Australia,5 have three important implications. Firstly, people with CD can confidently consume GF-labelled products purchased in Australia. Secondly, a marked tightening of international GF standards is readily achievable by industry; the gluten levels in the foods we analysed were all below 1.5 ppm, less than one-tenth of the standard set by the Codex Alimentarius of < 20 ppm.2 Thirdly, we recommend that authorities revise the current Australian GF standard of “no detectable gluten”4 to “≤ 1 ppm”, as it is not practical or reasonable for industry to comply with the stricter standard. In our survey, 14% of products were non-compliant with the current Australian standard, but none contained more than 1.1 ppm gluten.