The breastfeeding Series papers by Cesar Victora and colleagues1 and Nigel Rollins and colleagues2 are a notable contribution to the maternal and child nutrition field. Both papers comment that the World Health Assembly’s target aiming to increase the rate of exclusive breastfeeding globally in the first 6 months up to 50% by 2025 is achievable, if not unambitious.3 However, the flaws of the target indicator itself were not addressed.
Preference: Nutrition
644
[Viewpoint] Moving ahead: what will a renewed Countdown to 2030 for Women and Children look like?
The Countdown to 2015 initiative (Countdown) represents a remarkable consortium of academicians, UN agencies, and development partners, which over the past decade, has focused its attention on tracking and analysing coverage of key interventions for reproductive, maternal, newborn, and child health (RMNCH) across 75 high burden countries that account for more than 95% of global maternal and child deaths. Initially started to ensure follow-up on the landmark Lancet Child Survival series,1,2 with innovative consolidation and presentation of coverage data on key interventions by country and regions,3 Countdown rapidly evolved with an expansion of its mandate to include reproductive and maternal health indicators across the continuum of care4 and more recently, analysis of nutrition trends and health policies.
[Comment] Gut microbiome and necrotising enterocolitis: time for intervention?
Despite improvements in neonatal intensive care, the birthweight-specific incidence of necrotising enterocolitis has not changed over the past three decades. However, the total burden of disease is increasing because of increased survival of very low birthweight infants. Mortality remains high and complications include post-surgical short bowel syndrome and its outcomes (prolonged dependence on total parenteral nutrition, recurrent infections, poor growth, and liver failure), long hospital stays, and long-term neurodevelopmental impairments.
The world is turning to flab
Rich countries are facing an epidemic of severe obesity and around one in five worldwide will be obese by the middle of next decade unless there is a major slowdown in the rate at which people are putting on weight, according to a major international study involving data from 19 million adults across 186 countries.
Already, more than 2 per cent of men and 5 per cent of women are severely obese, and researchers have warned that the prevalence is set to increase and current treatments like statins and anti-hypertensive drugs will not be able to fully address the resulting health hazards, leaving bariatric surgery as the last line of defence.
In a result which underlines the extent of the obesity challenge, research by the NCD Risk Factor Collaboration* has found that that between 1975 and 2014, the prevalence of obesity among men more than trebled from 3.2 per cent to 10.8 per cent, while among women it surged from 6.4 to 14.9 per cent.
The study’s authors warned that on current trends, 18 per cent of men and 21 per cent of women will be obese by 2025, meaning there was “virtually zero” chance of reaching the global target of halting the prevalence of obesity at its 2010 level.
Instead, in the next nine years severe obesity will supplant underweight as a bigger public health problem, especially for women.
“The world has transitioned from an era when underweight prevalence was more than double that of obesity, to one in which more people are obese than underweight,” the study, published in The Lancet, said.
But although the world is getting fatter, it is also getting healthier, confounding concerns about the detrimental health effects of being overweight.
Writing in the same edition of The Lancet , British epidemiologist Professor George Davey Smith said that the increased in global body mass index (BMI) identified in the study had coincided with a remorseless rise in average life expectancy from 59 to 71 years.
Professor Davey Smith said this was a paradox, given the “common sense view that large increases in obesity should translate into adverse trends in health”.
Generally, a BMI greater than 25 kilograms per square metre is considered to be overweight, while that above 30 is obese and above 35, severely obese.
As the BMI increases above the “healthy” range, it is associated with a number of health consequences including increased blood pressure, higher blood cholesterol and diabetes.
The fact that increased BMI has not so far been associated with decrease longevity has led Professor Davey Smith to speculate that in wealthier countries access to cholesterol lowering drugs and other medications have dampened the adverse health effects, sustaining improvements in life expectancy despite increasing weight.
But he warned this effect would only be limited – many people would not be able to afford such treatments, and pharmacological interventions can only alleviate some of the health problems associated with being obese, meaning many health effects are likely to emerge in greater number later on as the incidence of obesity increases.
One of the most important aspects of the NCD Risk Factor Collaboration report is the insight it provides into differences in the nature and prevalence of weight problems between countries and regions.
For instance, it shows that the biggest increase in men’s BMI has occurred in high-income English-speaking countries, while for women the largest gain has been in central Latin America.
At the extreme, the greatest prevalence of overweight and obesity was in American Samoa, where the age standardised mean BMI for was 32.2, and for women, 34.8. Other areas where the mean BMI for both men and women exceeded 30 included Polynesia, Micronesia, the Caribbean, and several countries in the Middle East and north Africa, including Kuwait and Egypt.
The researchers found that male and female BMIs were correlated across countries, though women on average had a higher BMI than men in 141 countries.
But, in a sign that the rate of weight gain in a country may slow after a certain point, the researchers found that from 2000 BMI increased more slowly than the preceding 25 years in Oceania and most high income countries.
Alternatively, it sped up in countries where it had been lower. After 2000, the rate of BMI increase steepened in central and eastern Europe, east and southeast Asia, and most countries in Latin America and Caribbean.
The results suggest that public health campaigns and other polices aimed at curbing weight gain and encouraging healthier diets and more physical exercise are so far having little effect, spurring policymakers to consider different measures.
Though not canvassed in the study, one idea gaining support intnationally is for governments to impose a tax on sugary foods.
The United Kingdom will levy a tax on sugary drinks from next year, similar to one already in place in Mexico, and the World Health Organisdaiton has backed the policy as a way to curb the rapid increase in cases of diabetes in the world.
While overweight and obesity has become a major public health problem, particularly in wealthier countries, inadequate nourishment remains a health scourge in much of the world.
The NCD Risk Factor Collaboration report shows that millions continue to suffer serious health problems from being underweight, and warned that “the global focus on the obesity epidemic has largely overshadowed the persistence of underweight in some countries”.
As in other respects, global inequality in terms of weight have increased in the past 40 years, and while much of the world is getting fatter, in many areas under-nutrition remains prevalent.
The study found that more than 20 per cent of men in India, Bangladesh, Timor Leste, Afghanistan, Eritrea, and Ethiopia are underweight, as are a quarter or more of women in Bangladesh and India.
* The study drew on 1698 population-based data sources involving body mass index measurements taken from 9.9 million men and 9.3 million women in 186 countries between 1975 and 2014.
Adrian Rollins
Cord blood vitamin D and the risk of acute lower respiratory infection in Indigenous infants in the Northern Territory
One fifth of Indigenous infants born in the Northern Territory are hospitalised with an acute lower respiratory infection (ALRI) during their first year of life.1 Several international studies have reported an inverse relationship between cord blood vitamin D levels and infant respiratory infections.2–4 As exposure to sunshine is the most important influence on vitamin D status, there has been little consideration of the relationship between vitamin D status and disease in the tropical north of Australia.
Vitamin D is produced in the skin after exposure to sunlight. Subsequent hydroxylation in the liver yields the dominant circulating vitamin D metabolite, 25(OH)D3. The discovery that vitamin D receptors are widely distributed throughout human tissues and that several cell types, including those of the immune system, can synthesise the active vitamin D metabolite (1,25(OH)2D) from 25(OH)D3 has prompted renewed interest in the role of vitamin D. Vitamin D is required for innate (antimicrobial peptide production) and adaptive (favours response by Th2 effector T cells) immune responses.5 These may be particularly important in the respiratory tract of the developing infant, and perhaps relevant to the relationship between cord blood vitamin D levels and the risk of respiratory infection.2–4
Circulating 25(OH)D3 and the less common 25(OH)D2 are together referred to as 25(OH)D. In the United States, vitamin D deficiency is defined as a serum 25(OH)D level under 50 nmol/L, and vitamin D insufficiency as levels of 50–75 nmol/L.6 In Australia, 25(OH)D levels of 50 nmol or more are considered sufficient, although higher levels are regarded as optimal.7
Neonates and breastfed infants rely almost exclusively on maternal vitamin D.8,9 According to national population surveys, the prevalence of low 25(OH)D levels (< 50 nmol/L) in women during pregnancy varies from 10% among women in south-east Queensland10 to more than 80% in dark-skinned and/or veiled women in Melbourne, Victoria.11 In Far North Queensland, a small study of pregnant women at mid-gestation (93 non-Indigenous and 23 Indigenous women) found that only eight (7%) had 25(OH)D values under 75 nmol/L.12 While little is known about the vitamin D status of pregnant Indigenous women and children, dark skin is a risk factor for low vitamin D levels,7 and our recently published data indicate that about 40% of hospitalised Indigenous infants in the NT (median age, 7 months) had 25(OH)D3 levels below 75 nmol/L.13
The aims of our study were to describe the natural history of vitamin D status from the third trimester of pregnancy to infancy (age 7 months), and to determine whether low vitamin D levels at birth (cord blood 25(OH)D3) were associated with an increased risk of ALRI hospitalisation during the first year of life.
Methods
Participants and study design
From our randomised controlled trial of maternal pneumococcal vaccination (PneuMum; ClinicalTrials.gov NCT00714064), we established a cohort of 109 Indigenous mother–infant pairs from the Top End of the Northern Territory, in regions serviced exclusively by Royal Darwin Hospital. Participants were recruited from 2006 to 2011, and followed over several visits from the third trimester of pregnancy until the infant was 7 months old. Within this cohort, blood was available from 33 mothers during the third trimester of pregnancy (< 36 weeks), from 106 mothers at birth, from 84 cord specimens (< 72 hours after birth), and from 37 infants at age 7 months. Vitamin D levels were measured in each of these blood samples to assess temporal trends in vitamin D status during the birth period, and to establish the exposure of interest (cord blood vitamin D status) before ascertaining the primary outcome, ALRI hospitalisation before 12 months of age.
Vitamin D measurements
Serum 25(OH)D3 and 25(OH)D2 levels were measured using isotope dilution–liquid chromatography–tandem mass spectrometry (ID-LC-MS/MS), as described previously.13,14 Low, medium and high commercial controls (UTAK Laboratories) were used to monitor assay precision. Sample identity was concealed during testing. As 25(OH)D2 levels were undetectable or negligible in all specimens, we defined 25(OH)D3 levels below 75 nmol/L as vitamin D insufficiency,6 and below 50 nmol/L as vitamin D deficiency.7
ALRI hospitalisations
Infant ALRI hospitalisations during the first 12 months of life were identified by International Classification of Diseases, 10th revision, Australian modification (ICD-10-AM) codes recorded during admission to Royal Darwin Hospital (J09–J22, A37–A37.9).15 Hospital and study data were linked via the Hospital Registration Number, common to each dataset and unique to each infant. Diagnoses made during the birth admission (ICD-10-AM, Z37.0–Z39.2) and related admissions within 7 days of birth were excluded from the analysis.
Analysis
Vitamin D levels are reported for all available blood samples at each time point. Participant characteristics were assessed according to cord blood vitamin D status categories (< 50 nmol/L, 50–74 nmol/L, ≥ 75 nmol/L) to assess potential confounders of the exposure. The Fisher exact test (proportional data) and Kruskal–Wallis test (continuous data) were used to assess differences between groups. The primary analysis was a comparison of cord blood 25(OH)D3 levels in infants who were subsequently hospitalised with an ALRI with those of infants who were not. Student t tests were used to compare the normally distributed vitamin D data; P < 0.05 (two-tailed) was defined as statistically significant. With 84 cord blood samples and assuming that 20% of infants would be hospitalised with an ALRI1 and that mean cord blood 25(OH)D3 levels for healthy infants ranged between 50 and 75 nmol/L (standard deviation, 25 nmol/L), our analysis had 80% power to detect a difference in 25(OH)D3 levels (between those of infants who were hospitalised for ALRI and of those who were not) of 20 nmol/L.
Ethics approval
The study was approved by the Human Research Ethics Committee of the NT Department of Health and by the Menzies School of Health Research (HREC 05/52, HREC-2012-1882). Written consent was obtained for access to each child’s medical records and the analysis of their blood samples.
Results
Participant characteristics
In general, participant characteristics were similar across the cord blood 25(OH)D3 categories, except that remote dwelling was associated with lower cord blood 25(OH)D3 levels (Box 1). The median maternal age at recruitment was 24 years, and almost half (43%) reported smoking during pregnancy. Uptake of the influenza vaccine during pregnancy was low (14%). Most infants (91%) had received three doses of the pneumococcal conjugate vaccine (PCV; 7-valent or 10-valent plus Haemophilus influenzae protein D) by 12 months of age.
Vitamin D levels
As assessed in maternal venous blood, the prevalence of vitamin D insufficiency was 21% (7 of 33) during the third trimester (median gestation time, 32 weeks; range, 28–36 weeks) and 45% (48 of 106) at birth (median gestation time, 39 weeks; range, 34–41 weeks) (Box 2). In cord blood (median gestation time, 39 weeks; range, 36–41 weeks), the prevalence of vitamin D insufficiency was 80% (67 of 84); 44% (37 of 84) had 25(OH)D3 levels below 50 nmol/L, and 10% (8 of 84) below 25 nmol/L. The prevalence of vitamin D insufficiency among infants at the 7 month visit (median age, 7.1 months; range, 6.6–8.1 months) was 22% (8 of 37).
Considering all samples (unmatched), the relative difference in mean 25(OH)D3 levels between maternal venous blood during the third trimester and at birth was 23% (104 nmol/L v 80 nmol/L) and between maternal venous and cord blood levels at birth 33% (80 nmol/L v 54 nmol/L) (Box 2; Box 3A). Overall, there was a 48% relative difference in 25(OH)D3 levels between mothers’ levels during the third trimester and those of cord blood. This trend in relative difference was similar in matched samples (data not shown). At birth, the 25(OH)D3 concentrations of the 81 matched maternal venous and cord blood samples exhibited a linear correlation (r = 0.84; P < 0.001; Box 3B).
Vitamin D levels in urban and remote participants
The mean 25(OH)D3 concentration was lower in remote than in urban participants during pregnancy, at birth, and at infant age 7 months (Box 4). The relative difference in 25(OH)D3 concentration between maternal blood in the third trimester and cord blood in remote participants was 57% (87 nmol/L v 37 nmol/L), compared with 46% in urban participants (108 nmol/L v 58 nmol/L). The cord blood 25(OH)D3 concentrations of all 14 remote infants were below 75 nmol/L; 86% (12 of 14) were under 50 nmol/L and 14% (2 of 14) were under 25 nmol/L.
Vitamin D and ALRI hospitalisation
Of the 84 infants for whom cord blood samples were available, seven (8%) were hospitalised with an ALRI during their first 12 months of life; the median age at initial admission was 5.3 months (range, 1.9–7.5 months). In our primary analysis (Box 5), the mean cord blood 25(OH)D3 concentration in these seven infants was 37 nmol/L (95% CI, 25–48 nmol/L), compared with 56 nmol/L (95% CI, 51–61 nmol/L) for the 77 infants not hospitalised for an ALRI (P = 0.025). Mean 25(OH)D3 levels in maternal venous blood at birth were similarly lower in the mothers of infants subsequently hospitalised with an ALRI than in the mothers of those not hospitalised for an ALRI (Box 5).
ALRI among urban and remote participants
The proportion of remotely dwelling infants who were hospitalised with an ALRI (4 of 14, 29%) was higher than for urban infants (3 of 70, 4%; P = 0.013). The low number of ALRI hospitalisations was insufficient for a model including remote dwelling as a confounding factor.
Discussion
This is the first study to longitudinally assess vitamin D levels in pregnant Indigenous mothers and their infants. We found that the mean 25(OH)D3 level in cord blood was about half (48%) that of maternal blood during the third trimester of pregnancy (about 7 weeks earlier), a difference due equally to a decline in maternal levels late in pregnancy and to a gradient across the placenta. We also found that the 25(OH)D3 concentration was less than 75 nmol/L in 80% of cord blood samples, and that the mean cord blood 25(OH)D3 concentration was lower in infants who were subsequently hospitalised with an ALRI than in those who were not (37 nmol/L v 56 nmol/L; P = 0.025). This comparison of cord blood vitamin D levels according to ALRI hospitalisation outcome should be interpreted with caution, however, given the small number of ALRI hospitalisations (seven) and an inability to adequately investigate potential confounders, such as remote dwelling. This characteristic was associated with both lower cord blood vitamin D levels and a higher proportion of ALRI hospitalisations, and may have independently caused both low vitamin D levels and increased risk of ALRI hospitalisation. Further, this study did not measure specific factors known to influence vitamin D status, such as skin pigmentation, time spent outdoors, and diet. Despite the limitations of this study, our findings warrant further investigation.
Physiological changes in vitamin D metabolism occur during pregnancy to support the increased calcium demands of the fetus, but the specific mechanisms are not fully understood. Levels of vitamin D-binding protein and the active vitamin D metabolite, 1,25(OH)2D, increase steadily during pregnancy, while concentrations of 25(OH)D3 generally remain stable.16,17 In our study, maternal 25(OH)D3 concentrations fell both late in pregnancy (by 23%) and across the placenta (by 33%). The observed difference in 25(OH)D3 concentrations between venous (maternal) and cord blood at birth is consistent with other studies;18 however, few have specifically characterised 25(OH)D3 levels late in pregnancy. In 2003, a small study of 20 Hungarian women found no difference in mean maternal 25(OH)D3 levels between 22–24 weeks’ gestation and birth,19 while a study of 14 healthy French women found a 20% decline in mean 25(OH)D3 levels between 36 weeks’ gestation (46.8 nmol/L) and birth (37.4 nmol/L).20 As there is little seasonal variation in 25(OH)D3 levels in the tropical NT,13 the drop in late pregnancy may reflect natural progression, perhaps related to maternal–fetal immune tolerance or neonatal immune development,21 increased calcium demands of the growing fetus,22 or the emergence of risk factors, such as increased body mass index or more time spent indoors.7
The cord blood vitamin D data in our study suggest that 80% of infants were born with vitamin D insufficiency (< 75 nmol/L), 44% with mild deficiency (< 50 nmol/L), and 10% with moderate deficiency (< 25 nmol/L). The significance of these definitions for the neonate, however, is unclear, and more work is needed to define vitamin D reference ranges in cord blood. Vitamin D status was generally normal by infant age 7 months, the next sampling point.
Concordant with the trends in our data, a recent trial of maternal-plus-infant vitamin D supplementation for the prevention of deficiency among New Zealand infants8 showed that mean 25(OH)D levels in the placebo group were higher in mothers at 36 weeks’ gestation (50 nmol/L) than in cord blood (33 nmol/L), and that infant levels steadily increased through ages 2 (50 nmol/L), 4 (75 nmol/L) and 6 months (78 nmol/L). As the authors did not report maternal 25(OH)D levels at birth, it was not possible to determine whether the drop between 36 weeks’ gestation and cord blood was the result of a maternal decline or of the placental differential. Compliant daily maternal (from 27 weeks’ gestation to birth) and infant supplementation (from birth to age 6 months) at low (1000 and 400 IU/day respectively) and high doses (2000 and 800 IU/day respectively) increased mean cord blood 25(OH)D3 levels to 60 nmol/L and 65 nmol/L respectively (v 33 nmol/L in placebo-treated participants); mean infant 25(OH)D3 levels of 75 nmol/L or more were maintained at each of the 2, 4 and 6 months sampling points.
Among the participants who contributed a cord blood sample to our study, there were fewer infant ALRI hospitalisations in the first 12 months of life (8%) than predicted by historical NT data (22%).1 As ALRI hospitalisation rates are highest among remote and Central Australian infants,1 this difference was probably caused by the over-representation of Top End and urban infants in our cohort (Top End, 100%; urban, 83%) compared with the NT-wide historical data (Top End, 71%, urban, 39%). Nevertheless, cord blood 25(OH)D3 concentrations were lower in infants who were subsequently hospitalised with an ALRI than in those who were not. We could not reliably adjust our analysis to account for remote dwelling as a confounder because of the low number of ALRI hospitalisations, but our unadjusted findings are consistent with those of several other studies. In the Netherlands, cord blood 25(OH)D concentration was lower in infants who developed a respiratory syncytial virus-associated ALRI during their first 12 months than in controls (65 nmol/L v 84 nmol/L; P = 0.009);3 in New Zealand, lower cord blood 25(OH)D concentration was associated with an increased risk of any respiratory infection by 3 months of age (odds ratios, 1.00 for ≥ 75 nmol/L; 1.39 for 25–74 nmol/L; 2.16 for < 25 nmol/L).2 In a Korean study, 90% of 525 cord blood samples tested had 25(OH)D levels below 75 nmol/L, and reduced cord blood 25(OH)D concentration was strongly associated with increased risk of acute nasopharyngitis during the first 6 months of life.4 In their recent randomised controlled trial of vitamin D supplementation, Grant and colleagues23 audited health care visits by children (to age 18 months) as a secondary outcome; infants in the high dose group (87%; 66 of 76) but not the low dose supplementation group (95%; 76 of 80) had significantly fewer health care presentations for acute respiratory infections than infants in the placebo group (99%; 79 of 80).
Although not all studies support an inverse association between vitamin D levels and ALRI risk, a supplementation strategy beginning in the third trimester of pregnancy may be useful in preventing both vitamin D insufficiency and subsequent acute respiratory infections in Indigenous neonates in the NT. Acute respiratory infections are endemic in remote Indigenous communities because of factors such as overcrowding and exposure to tobacco smoke.24 However, it is less obvious why remote participants in our study had lower 25(OH)D3 levels during pregnancy and at birth, or why the relative difference in mean concentrations in maternal blood at 30–36 weeks’ gestation and in cord blood was greater than in their urban counterparts (remote, –57% v urban, –48%). Similar vitamin D levels in urban and remote infants at age 7 months suggest that the negative influence of remoteness on vitamin D levels was confined to the mothers. As the climate and time spent outdoors are likely to be similar for urban and remote participants, risk factors other than exposure to sunlight require further investigation. Interestingly, vitamin D has also been found to be a negative acute phase reactant that is depleted after an inflammatory insult.25 Lower vitamin D levels seen among remote participants may therefore be the result, rather than a cause, of their high burden of infection.
Conclusions
While only one in five Indigenous mothers had 25(OH)D3 levels below 75 nmol/L midway through the third trimester of their pregnancy, four in five cord bloods tested had lower levels as the result of declining 25(OH)D3 levels late in pregnancy and differences in levels across the placenta. The significance of low cord blood 25(OH)D3 concentrations is unclear, but the seven infants hospitalised with an ALRI during their first 12 months of life had significantly lower levels than those not hospitalised with an ALRI. Our findings, in conjunction with emerging international data, support the need for further longitudinal studies and for randomised controlled trials of vitamin D supplementation for the prevention of infant ALRI.
Box 1 –
Participant characteristics, by cord blood 25(OH)D3 status
|
|
Total |
Cord blood 25(OH)D3 levels (nmol/L) |
P |
||||||||||||
|
< 50 |
50–74 |
≥ 75 |
|||||||||||||
|
|
|||||||||||||||
|
Number |
84 |
37 |
30 |
17 |
|
||||||||||
|
Maternal characteristics |
|
|
|
|
|
||||||||||
|
Median maternal age, years (range) |
24 (17–37) |
25 (17–37) |
23 (17–33) |
26 (17–33) |
0.197 |
||||||||||
|
Household occupancy, people (range) |
4 (1–11) |
5 (2–11) |
4 (1–11) |
4 (3–10) |
0.117 |
||||||||||
|
Remote community residence |
14 (17%) |
12 (32%) |
2 (7%) |
0 |
0.003 |
||||||||||
|
Smoker |
36 (43%) |
19 (51%) |
8 (27%) |
9 (53%) |
0.086 |
||||||||||
|
Influenza vaccine during pregnancy |
12 (14%) |
6 (16%) |
5 (17%) |
1 (6%) |
0.613 |
||||||||||
|
Infant characteristics: at birth |
|
|
|
|
|
||||||||||
|
Boys |
47 (56%) |
20 (54%) |
17 (57%) |
10 (59%) |
0.960 |
||||||||||
|
Low birth weight (< 2500 g) |
2 (2%) |
1 (3%) |
0 |
1 (6%) |
0.491 |
||||||||||
|
Premature (< 37 weeks) |
1 (1%) |
1 (3%) |
0 |
0 |
1.000 |
||||||||||
|
Special or intensive care admission |
9 (11%) |
4 (11%) |
4 (13%) |
4 (6%) |
0.901 |
||||||||||
|
Infant characteristics: after the birth |
|
|
|
|
|
||||||||||
|
Exclusively breastfed |
|
|
|
|
|
||||||||||
|
1 month after the birth |
48 (47%) |
18 (49%) |
18 (60%) |
12 (71%) |
0.290 |
||||||||||
|
2 months after the birth |
34 (40%) |
14 (38%) |
12 (40%) |
8 (47%) |
0.807 |
||||||||||
|
7 months after the birth |
31 (37%) |
16 (43%) |
9 (30%) |
6 (35%) |
0.536 |
||||||||||
|
Mother smoking* |
|
|
|
|
|
||||||||||
|
1 month after the birth |
35 (46%) |
19 (61%) |
7 (25%) |
9 (53%) |
0.016 |
||||||||||
|
2 months after the birth |
31 (45%) |
15 (56%) |
9 (32%) |
7 (50%) |
0.196 |
||||||||||
|
7 months after the birth |
38 (55%) |
17 (57%) |
13 (50%) |
8 (62%) |
0.856 |
||||||||||
|
Vaccination |
|
|
|
|
|
||||||||||
|
2 doses of PCV by 7 months |
57 (68%) |
25 (68%) |
22 (73%) |
10 (59%) |
0.595 |
||||||||||
|
3 doses of PCV by 12 months |
68 (91%) |
31 (89%) |
24 (96%) |
13 (87%) |
0.591 |
||||||||||
|
23vPPV during pregnancy |
24 (29%) |
8 (22%) |
9 (30%) |
7 (41%) |
0.322 |
||||||||||
|
23vPPV at birth |
29 (35%) |
11 (30%) |
14 (47%) |
4 (24%) |
0.221 |
||||||||||
|
|
|||||||||||||||
|
23vPPV = 23-valent pneumococcal polysaccharide vaccine; PCV = pneumococcal conjugate vaccine (the 7-valent pneumococcal conjugate vaccine [7vPCV] or the 10-valent pneumococcal Haemophilus influenzae protein D conjugate vaccine [10vPHID-CV]). All figures are numbers of individuals and column percentages unless otherwise indicated. Data were compared across categories using the Fisher exact test for proportional data and the Kruskal–Wallis test for continuous data. * Smoking data were unavailable for eight mothers at 1 month and for 15 mothers at 2 and 7 months post partum. |
|||||||||||||||
Box 2 –
Serum vitamin D (25(OH)D3) levels measured during pregnancy, at birth, and in the infant at age 7 months
|
Visit |
Blood sample |
n |
Median age (range) |
25(OH)D3 levels (nmol/L) |
|||||||||||
|
Mean (95% CI) |
Relative difference* |
< 50 |
50–74 |
≥ 75 |
|||||||||||
|
|
|||||||||||||||
|
Pregnancy |
Maternal |
33 |
32 weeks† (28–36 weeks) |
104 (93–115) |
Base |
1 (3%) |
6 (18%) |
26 (79%) |
|||||||
|
Birth |
Maternal |
106 |
39 weeks† (34–41 weeks) |
80 (74–86) |
−23% |
18 (17%) |
30 (28%) |
58 (55%) |
|||||||
|
Birth |
Cord |
84 |
39 weeks† (36–41 weeks) |
54 (50–59) |
−48% |
37 (44%) |
30 (36%) |
17 (20%) |
|||||||
|
7 months |
Infant |
37 |
7.1 months‡ (6.6–8.1 months) |
93 (86–101) |
−10% |
1 (3%) |
7 (19%) |
29 (78%) |
|||||||
|
|
|||||||||||||||
|
* Compared with maternal vitamin D blood concentration during pregnancy. † Gestational age. ‡ Infant age. |
|||||||||||||||
Box 3 –
(A) Maternal and infant vitamin D levels.* (B) Correlation between 84 matched maternal venous and cord blood vitamin D measurements at birth
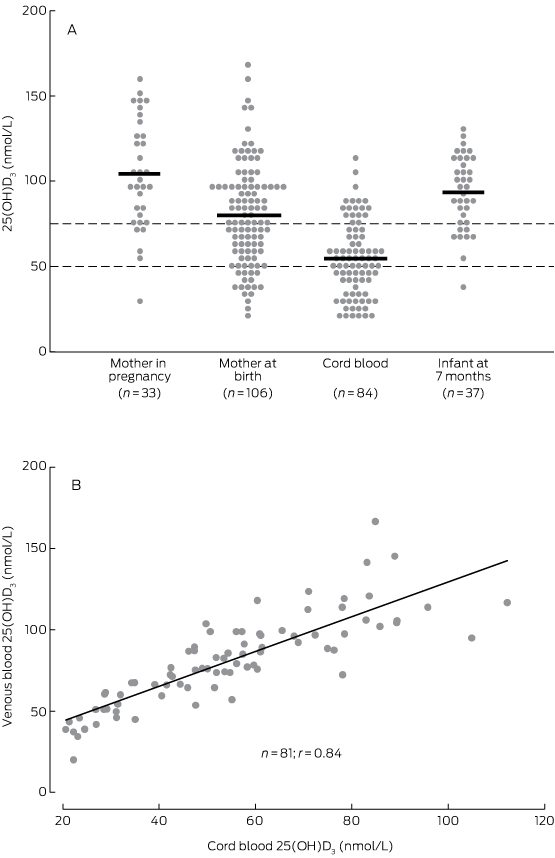
* Dashed lines indicate reference 25(OH)D3 values for vitamin D deficiency (< 50 nmol/L) and insufficiency (< 75 nmol/L).
Box 4 –
Vitamin D levels (nmol/L) for urban and remote dwelling participants
|
Visit |
Blood sample |
Urban |
Remote |
||||||||||||
|
n |
Median age (range) |
Mean 25(OH)D3 levels (95% CI) |
Relative difference* (%) |
n |
Median age (range) |
Mean 25(OH)D3 levels (95% CI) |
Relative difference* (%) |
||||||||
|
|
|||||||||||||||
|
Pregnancy |
Maternal |
26 |
33 weeks† (30–36) |
108 (95–122) |
Base |
7 |
32 weeks† (28–35) |
87 (68–107) |
Base |
||||||
|
Birth |
Maternal |
85 |
39 weeks† (35–41) |
86 (79–92) |
−23% |
21 |
39 weeks† (34–41) |
57 (49–66) |
−34% |
||||||
|
Birth |
Cord |
70 |
39 weeks† (36–41) |
58 (53–63) |
−46% |
14 |
39 weeks† (37–41) |
37 (30–43) |
−57% |
||||||
|
7 months |
Infant |
33 |
7.1 months‡ (6.8–8.1) |
94 (86–101) |
−13% |
4 |
7.1 months‡ (6.6–8.1) |
90 (56–124) |
+3% |
||||||
|
|
|||||||||||||||
|
* Compared with maternal vitamin D blood concentration during pregnancy. † Gestational age. ‡ Infant age. |
|||||||||||||||
Box 5 –
Mean vitamin D levels during pregnancy, at birth, and in the infant at age 7 months, according to infant hospitalisation with an acute lower respiratory infection (ALRI) during the first 12 months of life
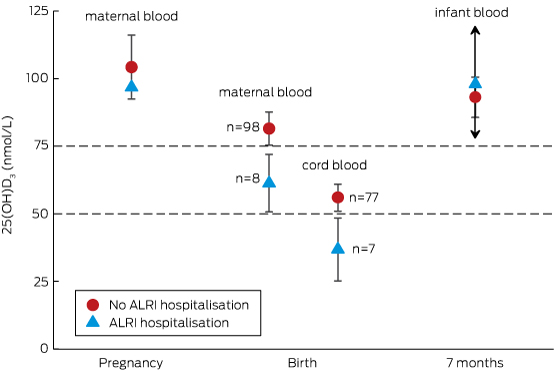
Only one maternal vitamin D measurement during the third trimester of pregnancy was associated with an infant ALRI hospitalisation, so that there is no confidence interval for the open triangle. Only two infants with vitamin D measurements at 7 months were hospitalised with an ALRI, so that the upper and lower confidence boundaries around the open triangle are very wide (exceeding the graph scale), as indicated by the arrows.
A warning against heart disease complacency in 2016
Although death from heart disease in Australia continues to decrease, we cannot rest on our laurels. The greatest barrier to reducing the social and economic toll of heart disease has been complacency. As a nation, we have dropped the ball. It’s time to think again.
Heart disease continues to result in more Australian deaths than any other single cause, and remains the leading cause of death for Aboriginal and Torres Strait Islander peoples. It continues to place a heavy burden on our already stretched health system, demanding the highest expenditure for any individual disease group at $7.7 billion in 2008–09 (http://www.aihw.gov.au/australias-health/2014/health-system).
Most Australians are either sedentary or engage in low levels of physical activity. Obesity among adults has almost tripled in the last two decades (http://www.aihw.gov.au/WorkArea/DownloadAsset.aspx?id=6442459497). Our ageing community, and the success in treating previously fatal heart conditions, means more people are living with heart diseases.
The devastating impact of inaction will see the number of adults with obesity double to 41% by 2031–32, and cardiovascular disease and type 2 diabetes are estimated to cost the government $58 billion if recent trends continue (http://heartfoundation.org.au/about-us/what-we-do/heart-disease-in-australia/australian-heart-disease-statistics).
The Heart Foundation has driven great change, but we can only do so much alone. The government has ignored the facts for too long and heart disease remains a national priority in name only. We now need a nationally funded action plan to improve prevention, treatment and research. Investment will pay big dividends and has the potential to save countless lives, improve national productivity and ease the pressure on hospitals.
Our strategy will continue to target inequalities, develop a heart attack survivor initiative, and tackle the causes of heart disease through funding innovative research. However, we need to see strong government, industry and community leadership resulting in lasting change that can help all Australians lead long, healthy lives.
[World Report] Severe drought in Zimbabwe triggers food crisis
Zimbabwe’s worst drought in three decades has caused food shortages in large swathes of the country. Worries are building about increasing child malnutrition rates. Andrew Green reports.
[Comment] Spotlight on infant formula: coordinated global action needed
Breastfeeding has often been described as cost free.1 It is not free. Breastfeeding requires investment to overcome the sociopolitical barriers that exist in many countries2,3 through the effective approaches and practices described in the second paper of the Lancet Breastfeeding Series.4 As shown in the first Series paper, infants, children, and mothers who do not breastfeed experience an increased risk of mortality and morbidity.5 Breastfeeding is nutritionally, immunologically, neurologically, endocrinologically, economically and ecologically superior to breastmilk substitutes (BMS), and does not require quality control of manufacture, transport, storage, and feeding mechanisms.
[Comment] Offline: Stillbirths—the last great myth
Stillbirths are dismissed, stigmatised, and ignored by governments, media, and even health systems. Last week, a coalition of international researchers launched a new campaign to persuade political leaders to take stillbirths a great deal more seriously. The whole subject of stillbirths is bedevilled with myths. Stillbirths are not an important global health challenge? There are 2·6 million stillbirths annually, 1·3 million of which (horrifically) occur during labour. Stillbirths are inevitable? No, most causes of stillbirths (eg, infection, malnutrition) are entirely preventable.
Severe ulcerative herpes zoster
A 78-year-old man presented to a regional emergency department with a severe progressive rash, on a background history of chronic lymphocytic leukaemia, dementia and malnourishment.
The rash was multidermatomal, with patchy areas of ulceration, crusting, excoriation and necrosis (Figure, A and B). Active bleeding, seborrhoeic discharge and occasional vesicles were also noted, extending to the left pelvis. Subsequently, the patient developed concurrent Pseudomonas aeruginosa cellulitis and bacteraemia.
Punch biopsies were non-specific with dermal necrosis, excoriation and possible lichenoid reactivity. However, swabs revealed varicella-zoster virus. The patient was successfully treated with intravenous piperacillin–tazobactam, intravenous acyclovir, normal saline (0.9% sodium chloride) washes, and 50% liquid paraffin with 50% white soft paraffin cream (Figure, C and D). Multifactorial immunodeficiency was deemed to be the aetiology.