×

Layperson’s guide to pandemics

PANDEMICS, by Nobel Laureate Professor Peter Doherty, is based on the premise of equipping the public to be alert, not alarmed.

The book, using a question-and-answer format, begins by giving the reader a crash course in the immune system and how the human body responds to invaders. It then provides a historical overview of pandemics and how respiratory infections, like influenza, are the greatest pandemic threat. Doherty then outlines the role of animals, such as birds and bats, as well as the influence of climate change, antibiotic resistance and air travel on how diseases are spread. He discusses the strengths and limitations of the responses to pandemics, and how we might protect ourselves against them in the future.

Although the book is aimed at a lay audience, the level of information provided borders, at times, on the overwhelming. Yet, at the point when readers might begin to despair and give up, Doherty acknowledges the problem and provides a precis that helps to reorient the reader to the key point being made. That said, it is likely to be only the very interested and dedicated who will continue to persevere in some sections. However, this does not detract from the overall usefulness of the book.

The final chapter, which deals with personal responsibility, should be compulsory reading for anyone who ever travels. It hammers home the message of the role that everyone plays in managing the spread of disease, and it describes the steps that individuals can take to minimise risk as well as to manage an outbreak should one occur. This chapter and the conclusions, which are dot points of the most salient items raised in the book, are probably the most relevant ideas and messages for the reader to take away.

Despite the subject, the book is remarkably reassuring. Using examples, such as the new strains of the H7N9 avian influenza virus discovered in China, Doherty illustrates how the global health community has rallied and worked cooperatively to prepare for the worst-case scenario. Parts of the text are highly suitable for allaying the fears of the “worried well”. The book itself would be a useful resource for those wanting a solid overview of infectious diseases and their global management.

Drug-resistant tuberculosis: collaborative regional leadership required

The drug-resistant tuberculosis crisis provides urgency and focus for coordinated action to improve regional health and development

Success in stabilising the global tuberculosis (TB) epidemic is threatened by the emergence and spread of drug-resistant (DR) strains. The DR-TB challenge is similar in scale and impact to HIV infection in the 1980s; however, the international response has been slow and insufficient. Those worst affected by TB or DR-TB are from disadvantaged communities in low-income countries with little visibility or political influence. The Asia−Pacific region carries the bulk of the global TB burden (58%), including the majority of all estimated multidrug-resistant (MDR) cases (54%) (resistance to isoniazid and rifampicin).1,2 The regional DR-TB challenge is daunting and needs to be tackled before it overwhelms health systems, as happened in some former Soviet Union countries. Visionary political leadership is urgently needed to champion a comprehensive regional strategy that draws on novel and creative solutions,1 similar to the Asia Pacific Leaders Malaria Alliance created to contain the emergence of drug-resistant malaria.3

Four years ago, the World Health Assembly declared DR-TB a “global public health threat” and ministers from 22 high burden countries signed a “call to action”.4 This global resolution aimed to achieve universal access to diagnosis and treatment of DR-TB by 2015; but the response will fall well short. The number of people living with MDR-TB has risen from an estimated 440 000 in 2008 to 680 000 in 2012, and less than 20% receive appropriate treatment.2 These estimates are limited by insufficient laboratory capacity for drug-susceptibility testing and inaccurate reporting. The existing tools to diagnose, treat and prevent DR-TB are inadequate and much more costly than for drug-susceptible TB. Widespread rollout of the GeneXpert (Cepheid) test should improve the situation, but its impact will be limited in the absence of quality-assured laboratory infrastructure, shorter and more effective drug regimens and the scale-up of treatment programs for DR-TB. Modelling studies show that if TB control strategies only focus on drug-susceptible disease, DR-TB will become the predominant strain.5 This is supported by new evidence showing that DR-TB has the potential for true epidemic spread in high burden settings.6

The vast majority of countries in the Asia–Pacific region have limited capacity to mitigate the imminent threat of DR-TB. The Global Fund to Fight AIDS, Tuberculosis and Malaria, an international public–private partnership for financing, provides most of the global funding for TB and DR-TB control activities, but there remains a gap of US$2.3 billion per year until 2015 for a full response to the epidemic.2 Investment and coordinated action from growing national economies and business enterprises within the Asia–Pacific region are urgently required to avert this regional threat. While “ownership” of the DR-TB response should be in the hands of the countries most affected, Australia is presented with an opportunity to show regional leadership and collaboration, serving a pivotal coordinating function. Although ultimately health systems should be strengthened to provide universal coverage, the threat of DR-TB provides a clear focus to initiate action and develop regional solutions to complex, interrelated health and development issues.

It is estimated that if the global TB funding gap for the period 2013–2016 is not financed, an additional 1 million lives will be lost.7 Besides the human cost, TB (and DR-TB in particular) places an extraordinary economic burden on communities and traps people in poverty. TB does not respect international borders, and while numbers of DR-TB cases are low in Australia, a steady increase has already been seen.8 Investment in DR-TB treatment programs is required which, despite the high individual treatment cost (400 times higher than for drug-susceptible TB), are cost-effective overall.9 TB control is intimately linked to health system development and socioeconomic factors.10 Failure to specifically address DR-TB will result in major long-term human and economic costs, and ultimately may pose a major threat to regional development.

Defining a course of action requires careful consideration and discussion with the many stakeholders, but the global challenge posed by DR-TB presents an urgent need for bold regional leadership to:

1) Engender political commitment at the highest level among key regional players;

2) Explore a range of regional financing options, including joint funding from national governments, external organisations, donors and private industry;

3) Ensure quality-assured drug supply and control mechanisms;

4) Prioritise the urgent scale-up and implementation of DR-TB programs with strong oversight and laboratory support to contain the epidemic. Innovative and context-specific models of care should be integrated with existing health care structures; and

5) Identify mechanisms for increased regional investment in research (basic science, epidemiology, operational research). The development of new tools to fight TB is urgently needed. This is an area where Australia can make a major contribution.

There is a compelling case for Australia to facilitate a coordinated response to the DR-TB threat by mobilising regional political commitment and resources. Such an investment serves the most vulnerable populations, while promoting stability and sustainable development in our region.

Staphylococcus aureus bloodstream infection in Australian hospitals: findings from a Victorian surveillance system

Health care-associated (HA) infections are an important measure of quality of care in health care facilities. Staphylococcus aureus bloodstream (SAB) infections contribute to morbidity, mortality, and health care expenditure, and are frequently regarded as preventable.1

Standardised surveillance strategies for SAB infections have been effectively implemented internationally.2,3 In 2008, the Australian Health Ministers’ Conference endorsed that all Australian hospitals should establish HA infection surveillance, including reporting of SAB infections through relevant jurisdictions to a national data repository.

The Victorian Healthcare Associated Infection Surveillance System (VICNISS) SAB infection surveillance module was developed to enable collection of relevant laboratory and clinical data by health care workers trained in infectious diseases or infection prevention for community and HA-SAB infection events in the state of Victoria, including methicillin-sensitive and methicillin-resistant isolates.

The Victorian Department of Health mandated participation by Victorian public hospitals at the commencement of the program. VICNISS provided education to participating hospitals and developed a guide to facilitate standardised case review. Private health care facilities participated on a voluntary basis.

In Victoria, reporting of SAB infection events commenced in October 2009. In January 2010, the VICNISS implemented a standardised module that uses definitions developed by the Australian Commission on Safety and Quality in Health Care (ACSQHC) for monitoring in Victorian acute care public hospitals. This report outlines module components and a review of surveillance data captured during the first 3 years.

Methods

Uniform data were captured for all SAB infection events, including patient demographics, infection details and organism susceptibility.

Each infection was classified as either HA or community-associated using ACSQHC definitions. SAB infection was defined as HA if:

  • the patient’s first S. aureus-positive blood culture was collected > 48 hours after admission to hospital or < 48 hours after discharge, or
  • the patient’s first S. aureus-positive blood culture was collected ≤ 48 hours after admission to hospital and key clinical criteria were also met:
    • SAB infection was a complication of the presence of an indwelling medical device;
    • SAB infection occurred within 30 days of a surgical procedure where the SAB infection was related to the surgical site;
    • SAB infection was diagnosed within 48 hours of a related invasive instrumentation or incision; or
    • SAB infection was associated with neutropenia contributed to by cytotoxic therapy.

SAB infection was defined as community-associated if the patient’s first S. aureus-positive blood culture was collected ≤ 48 hours after admission to hospital and none of the key clinical criteria listed above were met.

The first SAB isolate per patient was counted as one episode. Subsequent positive blood cultures were only recorded as additional episodes if ≥ 14 days had passed without a positive blood culture Data for total occupied bed-days (OBDs) were obtained from the Victorian Admitted Episodes Dataset and HA-SAB infection rates were reported as number of epiodes per 10 000 OBDs.

Data collection and validation

Participating hospitals submitted data using a web-based tool. Webform design precluded lodgement of incomplete or inconsistent data. VICNISS staff were available if participating hospitals required assistance with applying standard definitions.

Statistical analysis

For this study, data collected during the first 36 months of the program (1 January 2010 – 31 December 2012) were analysed to determine relative proportions of HA and community-associated events and the proportion of SAB infection events attributed to methicillin-resistant S. aureus (MRSA). To test the hypothesis that a change in aggregate HA-SAB infection and MRSA bloodstream infection rates was not observed over time, both linear and non-linear quadratic trends in quarterly rates were evaluated using generalised estimating equations for Poisson regression with OBDs as the exposure. As no pre-observation data were available, we were unable to calculate a meaningful rate at time zero and thus suppressed the model intercept terms. The quasi-likelihood information criterion4 and modelled values for deviance and dispersion were used as metrics to assess comparative goodness of fit for linear and quadratic models. Cubic fits were calculated as a sensitivity analysis regarding the validity of presuming an underlying non-linear quadratic relationship. Statistical tests were performed using Stata, version 12 (StataCorp). Quarterly data for the study period were compared with the national threshold target of no more than 2.0/10 000 OBDs for HA-SAB infection rates in Australian hospitals in 2011.

Results

SAB infection data were submitted by 119 public health care facilities spanning 90/90 health care services (100%), and four private health care facilities. During the period studied, a total of 3205 SAB infection events were captured (2072 male patients, 1132 female patients, sex unknown for one event). The median age of patients with SAB infection was 64 years (range, 0–104 years).

Of all reported infection events, 1335 (41.7%) were HA, 1803 (56.3%) were community-associated, and 67 (2.1%) were unknown or unable to be classified. Of the HA-SAB infection events, 350 (26.2%) occurred ≤ 48 hours after hospital admission and 985 (73.8%) occurred > 48 hours after admission. MRSA was responsible for 295 HA-SAB infection events (22.1%) and 175 community-associated infection events (9.7%).

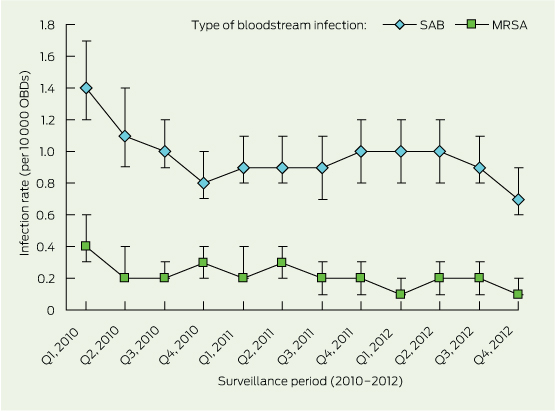
Quarterly data for HA-SA and HA-MRSA bloodstream infection events are summarised in Box 1. The median aggregate quarterly infection rates for HA-SA and HA-MRSA, respectively, were 0.95/10 000 OBDs (range, 0.7–1.4/10 000 OBDs) and 0.2/10 000 OBDs (range, 0.1–0.4/10 000 OBDs). Linear and quadratic regression models were fitted. The quadratic models both showed a significant decreasing trend over time (P < 0.001) with better goodness of fit. The quadratic models showed a decrease of 6.2 HA-SAB infection events per cumulative quarterly OBDs with a 0.5 unit change in slope (the quadratic coefficient), and a decrease of 7.8 HA-MRSA bloodstream infection events per cumulative quarterly OBDs with a 0.6 unit change in slope. The overall cumulative aggregate infection rates were 1.0/10 000 OBDs (95% CI, 0.9–1.0/10 000 OBDs) for HA-SA and 0.2/10 000 OBDs (95% CI, 0.19–0.24/10 000 OBDs) for HA-MRSA.

Quarterly HA-SAB infection rates in excess of 2/10 000 OBDs were reported in 54 instances, corresponding to a median of four (range, 2–8) instances each quarter. During the first quarter, eight health care services exceeded the benchmark, while four services breached the threshold target during the final reporting quarter.

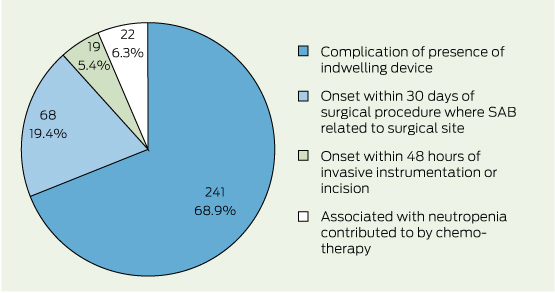
Of the 350 HA-SAB infections that were identified ≤ 48 hours after hospital admission, most (68.9%) were reported as a complication of the presence of an indwelling medical device; 19.4% occurred within 30 days of a surgical procedure and were related to the surgical site. Smaller numbers of infections were reported in association with invasive instrumentation or in the setting of neutropenia contributed to by cytotoxic therapy. Associated key clinical criteria are summarised in Box 2.

Discussion

Our findings reflect successful implementation of continuous statewide SAB infection surveillance using nationally agreed criteria. Further, a significant reduction in Victorian SAB infection rates was shown during the first 3 years. This may be indicative of concurrent infection prevention strategies (eg, improved practices for intravenous catheter insertion and care,5 reduced surgical site infections,6 an operative hand-hygiene program7), together with the fact that falling rates of infection are frequently observed after the commencement of formal surveillance programs.8

Notably, 26% of HA-SAB infection events occurred within 48 hours of hospital admission. These early events were frequently (69%) associated with an indwelling medical device (eg, intravenous catheter, haemodialysis vascular access) present at the time of hospital admission (Box 2). Patients at risk of these events include those with intravenous devices managed by hospital-in-the-home programs, those on haemodialysis, haematology and oncology outpatients with central venous access devices and outpatients receiving parenteral nutrition. Given the burden of illness, surveillance strategies for HA infections must continue to capture early (≤ 48 hours after hospital admission), as well as late, events.

MRSA infection has previously been reported to comprise 11%–40% of HA-SAB infection events in Australia,1,9 but studies have been limited by the potential for selective sampling. Our statewide data indicated that 22% of HA-SAB infection events were due to MRSA, which is comparable to recent data from European and Canadian reports.10

For SAB infection surveillance, the denominator for a health care service comprises OBDs for acute medical care, acute surgical care, intensive care, hospital-in-the-home, rehabilitation and psychiatric care, in addition to OBDs for rehabilitation or psychiatry centres associated with the nominated acute care hospital. SAB infection events are infrequently seen within psychiatry and rehabilitation facilities. To focus on acute care centres would be an optimal use of infection prevention resources, and a denominator excluding low-risk patients would provide more meaningful data for interhospital comparison.

After the commencement of SAB infection surveillance in Victoria, public reporting was facilitated nationally by the Australian Institute of Health and Welfare via the MyHospitals website.11 Based on the National Healthcare Agreement,12 a threshold target rate for SAB infection (no more than 2.0/10 000 patient days) in acute care public hospitals was applied in 2012.13 Retrospective application of this target to our data spanning a 36-month period showed that eight health care services were above this target at the onset of the surveillance period, with four identified during the last quarter studied. If hospital-level data are to be compared with a national benchmark, it is vital that jurisdictions implement uniform methods for surveillance14 and validation.15 Our experience shows that, to ensure uniformity of surveillance methods and for education and discussion of complex events, health care facilities require direct and frequent liaison with a coordinating centre. Consideration of lower threshold targets may be necessary if sustainable improvement, such as that seen in Victoria, is achieved.15

1 Quarterly health care-associated Staphylococcus aureus bloodstream (SAB) infection rates* per 10 000 occupied bed-days (OBDs), Victorian health care facilities, Jan 2010 – Dec 2012


MRSA = methicillin-reistant S. aureus. *Error bars indicate 95% Cls. 119 public health care facilities spanning 90/90 health care services (100%), and four private health care facilities.

2 Key clinical criteria associated with health care-associated Staphylococcus aureus bloodstream (SAB) infection occurring ≤ 48 hours after hospital admission (n = 350), Victorian health care facilities,* Jan 2010 – Dec 2012


*119 public health care facilities spanning 90/90 health care services (100%), and four private health care facilities.

Airport arrivals screening during pandemic (H1N1) 2009 influenza in New South Wales, Australia

During the DELAY and CONTAIN phases of pandemic (H1N1) 2009 influenza, New South Wales Health conducted, at the request of the Australian Government, screening of passengers at Sydney Airport. The aim was to delay entry and minimise spread of the pandemic in Australia.1,2 In this study, we examined the effectiveness of this intervention, in order to inform its future use at the state and national level.

On 27 April 2009, two clinics were established at Sydney Airport, staffed by nurses from the local area health service, with public health support from the NSW Ministry of Health. On-board announcements were made before landing, and all incoming international passengers were asked to declare any symptoms or possible contact with a person with influenza A(H1N1)pdm09 by completing a health declaration card. Additionally, thermal imaging scanners with a set point of 38°C ± 2°C were used to detect febrile passengers.3,4

Public health staff triaged and assessed passengers who self-reported symptoms or were detected by thermal scanners according to the case definition current at the time (Box 1). Passengers who met the case definition answered a questionnaire, underwent a brief clinical assessment and had nose and throat swabs taken, which were sent to a pathology laboratory for testing. All demographic, exposure and health assessment data collected at the airport clinics were entered in real time into NetEpi, a national web-based public health data collection system.3,4 NetEpi was also used to collect data for all patients and contacts presenting anywhere with an influenza-like illness, and to assign case status when known.3

As airport clinics were being operationalised, media warnings were issued to the general public asking people with symptoms to call their local doctor and, if required, to go to an emergency department for assessment.3

Methods

Data from airport clinics and on all cases of influenza A(H1N1)pdm09 collected between 28 April 2009 and 18 June 2009 and stored in NetEpi had previously been imported into Microsoft Excel. The number screened was estimated on a pro rata basis as the total number of international passengers arriving at Sydney Airport between 28 April 2009 and 18 June 2009, using monthly data from the Bureau of Infrastructure, Transport and Regional Economics.5

The case detection rate of airport screening was calculated as the number of confirmed cases of influenza A(H1N1)pdm09 detected at the airport per 10 000 passengers screened. Sensitivity was calculated as the number of confirmed cases detected at the airport as a proportion of the total number of overseas-acquired cases in the period. Positive predictive value was calculated as the proportion of symptomatic or febrile passengers who tested positive for A(H1N1)pdm09, and specificity as a proportion of the total number of passengers minus the number of those with known overseas-acquired influenza A(H1N1)pdm09 who were identified as not being symptomatic or febrile. Negative predictive value could not reliably be calculated; as it is possible some passengers not identified as symptomatic or febrile at screening later developed influenza, but did not seek clinical care or testing and so never became confirmed cases. The number of cases detected at the airport was calculated as a proportion of all cases identified between 28 April and 18 June 2009, and compared with the proportion of cases over the same period who were detected at emergency departments and in general practice.

Analysis was performed using Excel (Microsoft) and Stata version 10 (StataCorp).

Ethics approval was not sought as the study used data collected under the Public Health Act 1991 (NSW).

Results

Results of the analysis are presented in Box 2. There were an estimated 625 147 passenger arrivals at Sydney Airport during the period, of whom 5845 or 0.93% were identified as being symptomatic or febrile. Of these 5845, three subsequently were confirmed as having influenza A(H1N1)pdm09, resulting in a detection rate of 0.05 per 10 000 (95% CI, 0.02–1.14 per 10 000). There were 45 people with overseas-acquired influenza A(H1N1)pdm09 in NSW who would have probably passed through the airport during this time, giving airport screening a sensitivity of 6.67% (95% CI, 1.40%–18.27%). Positive predictive value was 0.05% (95% CI, 0.02%–0.15%), and specificity was 99.10% (95% CI, 99.00%–100.00%).

Of the 1296 passengers identified as requiring further assessment, the large majority (1144 passengers or 88.27%) were detected through health declaration cards. Only 11 of these 1296 passengers (0.85%) were detected by the thermal scanners. For the remaining passengers (35 passengers or 2.70%), the identification method was either unknown or through other mechanisms, such as referral to the airport clinic by the Australian Quarantine and Inspection Service officers.

Across NSW, there was a total of 557 patients with confirmed cases who had samples collected and sent for laboratory testing between 28 April and 18 June 2009. Samples were obtained from patients seen at the airport clinic, emergency departments, general practices and other settings. Of these, 290 (52.1%) were detected at emergency departments and 135 (24.2%) at general practices, compared with three (0.5%) at the airport.

Discussion

Our analysis shows that airport screening in NSW during pandemic (H1N1) 2009 influenza had low sensitivity, detecting far fewer cases during the DELAY and CONTAIN phases compared with emergency departments or general practitioners. The case detection rate of 0.05 per 10 000 passengers screened reflects figures in reviews of airport screening in other Australian jurisdictions and other countries.610 The small number of passengers detected by thermal scanners is also consistent with published estimates of the sensitivity of non-contact infrared thermal image scanners, and the high proportion of influenza infections that are likely to be asymptomatic.11,12

Limitations of the study include possible underestimation of the number of overseas-acquired cases, as milder cases of illness may not have been notified. Also, case definitions used during the DELAY and CONTAIN phases largely sought to detect imported cases and may have underestimated the number of cases acquired in the community. Both factors are likely to further reduce rather than increase the sensitivity of airport screening.

Border screening, including the identification of ill passengers and the use of thermal scanners, was identified in pre-2009 planning as one of a number of control measures that might delay entry of a pandemic into Australia.2 This planning and initial assessment of the likely severity of the pandemic after the emergence of influenza A(H1N1)pdm09 in Mexico led to commencement of airport screening in May 2009. Research also showed that the public were supportive of screening and perceived measures such as thermal scanners to be useful in detecting ill passengers.2

The cost of staffing airport clinics in NSW has been estimated at about $50 000 per case detected (NSW Ministry of Health, unpublished data, 2012). Measures such as in-flight announcements and providing health information at airports may be still be useful mechanisms for raising awareness among incoming passengers during future pandemics. However, given the costs associated with staffing airport clinics, careful consideration should be given to deploying resources to airports for largely ineffective screening measures, compared with other activities such as contact tracing in the community.

1 Definitions for suspected cases of influenza A(H1N1)pdm09, DELAY and CONTAIN phases3

Phase

Case definition

DELAY (24 April 2009 to 21 May 2009)

A person with acute febrile respiratory illness, with onset within 7 days of close contact with a person who is a confirmed or an influenza A-positive suspect case of pandemic (H1N1) 2009 influenza virus infection; or onset since 15 April 2009 and within 7 days of travel to Mexico, the United States or Canada.

CONTAIN (22 May 2009 to 16 June 2009)

As above but expanded to include contacts of a confirmed case with more minor symptoms. Japan and Panama were added to the list of affected regions on 23 May, and Chile, Argentina and greater metropolitan Melbourne were added on 15 June.

2 Screening for influenza A(H1N1pdm09) at Sydney Airport, 28 April 2009 to 18 June 2009

Get back to work

A quote from literature is a time-honoured trope used in editorials to exemplify a chosen theme. Literature, however, is often negative about the idea of returning to work, which many doctors are now doing. Indeed, work itself is usually considered a black hole of mundanity. In the real world, any new year’s resolutions to do things better this time may already be starting to dissipate under the influence of such negativity. However, work, though at times uninspiring, does somehow get things done.

Unfortunately, despite our best efforts, any resolution
to stop the introduction into Australia of microorganisms resistant to multiple antimicrobial agents has probably been in vain. The case of a man repatriated from Greece with complications from perforated diverticulitis has brought home to clinicians that Australia has not averted the threat of multidrug-resistant (MDR) organisms. In their case report (doi: 10.5694/mja13.10592), Chua and colleagues describe the stormy and protracted course of “last line of defence” antimicrobials, complex operations and costly isolation and cross-infection prevention protocols. They identified 10 patients admitted to Austin Health between December 2011 and February 2013 with MDR organisms and a history of recent overseas travel. The larger implications of such cases for Australian health care are becoming clearer.

In hospitals across Australia, many wards and emergency departments will have welcomed new additions to their medical teams as this year’s interns started their first clinical term. All doctors well remember their first foray into paid clinical work, for reasons good and bad, and everyone can think of how their own apprenticeship could have been better supported and more focused on learning and practice. We all recognise that interns need ongoing structured education, protected from their clinical duties. In 2008, the Garling inquiry recommended interns spend 20% of their rostered time in a formal clinical training program (http://www.lawlink. nsw.gov.au/Lawlink/Corporate/ll_corporate.nsf/vwFiles/E_Overview.pdf/$file/E_Overview.pdf). Oates and colleagues (doi: 10.5694/mja13.10213) have estimated how much their education costs the New South Wales health system and found the total was close to $15 000 per intern. They also found that, in NSW, only 6% of an intern’s time is allocated to these educational activities, well short of the 20% recommended nearly 6 years ago. Interns are better supported educationally than previously, but there is still a considerable way to go in improving our investment in this area of health care.

Getting the right mix of people in medical school admissions is an area of ongoing interest. The University
of Queensland dropped the requirement for applicant interviews from 2009. Wilkinson and colleagues (doi: 10.5694/mja13.10103) show that the proportion of male students admitted grew substantially thereafter, up to almost three-quarters of domestic graduate-entry students in 2012. Male candidates’ better performance in the section of the Graduate Medical School Admissions Test (GAMSAT) on biological and physical sciences reasoning is thought to play a role. There are several ways to interpret these findings, but medical school interviews appear to have
a function in ensuring gender equity. This is also a discussion that has to go beyond the medical school.

Outside of hospitals and medical schools, the fight
for better community health continues. Elliott and colleagues (doi: 10.5694/mja13.11240) assess the “progress” made by the federal government’s Food and Health Dialogue over the past 4 years to improve the nutritional profile of foods and enhance consumer education about healthy diet choices. Depressingly, none of the agreed goals have been achieved. The authors argue for the Dialogue to have stronger transparency and accountability in its initiatives and targets, and to manage commercial vested interests whose involvement is essential, but whose goals are different to public health objectives. Improving the food environment needs sustained commitment but, in Australia, interest and focus is in danger of fizzling out. Let us hope that everyone involved can keep a lid on the influences that may stymie progress and get back to the work needed to renew this resolution to make Australians healthier.

A pilot study of an influenza vaccination or mask mandate in an Australian tertiary health service

To the Editor: Health care workers (HCWs) play an important role in influenza prevention. They are at risk of exposure and subsequent illness which can lead to transmission to close contacts and patients.1 Conversely, high HCW influenza vaccination rates can reduce nosocomial influenza, decrease sickness absenteeism and are cost-effective.2,3 Despite this and the increasingly visible voluntary vaccination programs, the rates of influenza vaccination among HCWs in Australia vary between 16.3% and 58.7%.4 The Victorian Department of Health has recently stated that HCW vaccination must be > 75% in 2014.

Monash Health is a tertiary referral service in Melbourne, Australia, with 2200 beds and 13 389 HCWs. The service provides for 1.3 million residents. The Department of Nephrology (DN) provides dialysis and transplant services and employs 208 HCWs. Annual HCW influenza vaccination is undertaken through the Infection Control and Epidemiology Unit, with vaccinations recorded in a secure database. The program is free and incorporates mobile rounds, extended hours and promotion via newsletters and announcements.

To increase influenza vaccination rates in the DN, we undertook a pilot study to understand the feasibility and acceptance of a program requiring HCWs to receive vaccination or wear a mask during influenza season. The study was approved by the Monash Health Ethics Committee as a quality study.

In December 2012, the DN was informed that to increase influenza vaccination rates, unvaccinated HCWs would be asked to wear a surgical mask during patient care throughout the influenza season. Staff were given the opportunity to ask questions about the program and raise any concerns. In February 2013, a follow-up letter confirmed that the program would be enforced, and vaccination commenced in April 2013 (when the vaccine became available).

Overall, 193/208 HCWs (92.8%) in the DN received the vaccine in 2013. This compared with 6873/13 181 (52.1%) for the remainder of Monash Health in 2013 (P < 0.001) and a vaccine uptake of 47% in the DN in 2012 (P < 0.001).

We found that a program that enforced vaccination or the wearing
of a mask had a major impact on vaccination rates. This is the first Australian report of such an initiative. The reasoning behind the use of face masks is twofold. First, it is an incentive, since not being vaccinated equates to a few months of mask-wearing. Second, mask-wearing can be seen as a means of decreasing transmission of influenza in the hospital setting.

The right of an individual to choose vaccination is longstanding and
one that is used by antivaccine campaigners. Poland argued that mandated HCW influenza vaccination is ethically, morally, legally and financially well founded,5 and many health associations support HCW influenza vaccination mandates in the United States. Of note, HCWs in the DN are mandated to have hepatitis B vaccination to protect themselves and patients, and this
is not controversial.

Limitations of our pilot study include the small number of HCWs involved and the fact that unit leadership was strong within the DN, such that our results may not be generalisable. Nevertheless, the program contributed to a vaccination rate far exceeding our expectations. Further studies on the use of influenza vaccination mandates for HCWs in the Australian health care setting are required.

Impact of pneumococcal polysaccharide vaccine in people aged 65 years or older

Invasive pneumococcal disease (IPD) is a major cause of morbidity in very young children and older adults.1 The 23-valent polysaccharide pneumococcal vaccine (23vPPV) has been available in Australia since 1986, and use of it has increased progressively since then. It was recommended and subsidised under the Pharmaceutical Benefits Scheme for Australians aged ≥ 65 years in 1997, provided free of charge for this group in Victoria from 1998, and included in the nationally funded National Immunisation Program from 2005.2 The vaccine’s effectiveness against IPD in immunocompetent older people has been estimated as about 70%,3 but it is generally regarded as not effective in preventing carriage of pneumococcal serotypes against which it is targeted.1,3

Australia is the only country to have introduced nationally funded programs for the 7-valent pneumococcal conjugate vaccine (7vPCV) for infants and the 23vPPV for older people in the same year (2005).4 Unlike the 23vPPV, the 7vPCV has been shown to prevent carriage of vaccine serotypes,1 resulting in herd immunity impacts. Reductions in IPD due to 7vPCV serotypes, in vaccinated and unvaccinated age groups, have been observed in many countries. Increases in non-7vPCV serotypes (referred to as serotype replacement) have also been observed in vaccinated and unvaccinated age groups, with the net impact on total IPD incidence varying from country to country.5

In Victoria, a 36% decrease in IPD incidence occurred in people over 65 years of age following the introduction of funded 23vPPV in that state in 1998;6 this was before widespread use of the 7vPCV in children. 7vPCV coverage among infants rose rapidly to 90% in Australia in the first year of the nationally funded program.7 As all 7vPCV serotypes are also present in 23vPPV, any herd immunity effect from 7vPCV would complicate interpretation of the impact of 23vPPV in older people. Studies from two regions on IPD incidence in Australian adults in the post-7vPCV era have provided conflicting evidence on the changes in total IPD incidence in older people.8,9

In July 2011, the 13-valent pneumococcal conjugate vaccine (13vPCV) was introduced for all Australian infants, replacing the 7vPCV and (in the Northern Territory) the 10-valent pneumococcal conjugate vaccine.10 Unlike the 7vPCV, the 13vPCV has been licensed for use in adults aged ≥ 50 years in the United States and Australia, but has not yet been included in the National Immunisation Program.

To inform policy decisions relating to the use of the 13vPCV and the 23vPPV in Australian adults, we aimed to answer three questions:

  1. Can herd immunity effects in older Australians be observed from 7vPCV use in infants?

  2. Can a direct effect of 23vPPV on IPD incidence in older people be shown in the post-7vPCV era?

  3. Irrespective of ecological trends, has the 23vPPV been effective in preventing IPD in older Australians?

Methods

Notifications of IPD were obtained from the National Notifiable Diseases Surveillance System (NNDSS), which notionally captures all laboratory-confirmed cases of IPD. To distinguish the impact of the 7vPCV and the 23vPPV, notifications were aggregated by serotype category: serotypes contained in both vaccines (7vPCV serotype), those contained in the 23vPPV but not in the 7vPCV (23vPPV–non-7vPCV serotype) and those not contained in either vaccine (non-23vPPV serotype). Notifications for people in Victoria and people recorded as Indigenous were excluded, as funded programs for these populations commenced earlier than the national program (in 1998 and 1999, respectively). The proportion of notifications for which specimens were serotyped increased from 70% in 2002–2003 to 87% in 2006. To ensure that time trends in serotype categories were not distorted by this change, the serotype distribution among untyped cases was inferred from the serotype distribution among typed cases, by jurisdiction and by year.

This study was exempt from the requirement for ethics approval as it was conducted as a quality assurance exercise pertaining to the National Immunisation Program, under the auspices of the Australian Technical Advisory Group on Immunisation. De-identified data were provided for this purpose by the Communicable Diseases Network Australia.

Trends in IPD and vaccination coverage

Population rates of IPD by serotype category in people aged ≥ 65 years by year from 1 January 2002 to 31 December 2011 were plotted with 95% confidence intervals, which were calculated using the Poisson distribution of notification numbers. The estimated residential populations, minus Indigenous population estimates from the 2006 Australian census, were used as denominators for calculations of rates in the non-Indigenous population.11

Vaccination coverage estimates for people aged ≥ 65 years, by jurisdiction, were available from adult vaccination surveys conducted by the Australian Institute of Health and Welfare in 2004, 2006 and 2009.1214 These were based on respondents’ report in telephone interviews regarding receipt of pneumococcal or pneumonia vaccine within the previous 5 years, without reference to written vaccination records.

IPD rate changes in vaccinated and unvaccinated age groups

Changes in rates from the pre-7vPCV era (2002–2004) to the recent post-7vPCV era (2010–2011) periods by serotype category were measured using incidence rate ratios (IRRs) with 95% confidence intervals. IRRs for the vaccinated age group (≥ 65 years) were compared with those for the unvaccinated age group (50–64 years), in which 23vPPV coverage was low (< 5%).7

Vaccine effectiveness estimates

Estimates of vaccine effectiveness (VE) in the ≥ 65-year age group were calculated using the screening method, a form of case–cohort study. It compares the likelihood of prior vaccination in 23vPPV serotype IPD cases with that for the total population. It uses the formula VE=1[CV÷(1CV)]×[(1PV)÷PV], where CV is the proportion of cases that occurred in vaccinated people, and PV is the proportion of the population that had been vaccinated.15

The proportion of the population vaccinated was obtained from the adult vaccination surveys conducted in 2004, 2006 and 2009.1214 Separate estimates for the 65–74-year and ≥ 75-year age groups by jurisdiction were available from the 2004 and 2006 surveys.

The proportion of 23vPPV-type IPD cases that were recorded as being in “fully vaccinated” people (ie, those vaccinated within 5 years, according to national recommendations at the time) who were aged ≥ 65 years was derived from the NNDSS for each year that population coverage data were available (2004, 2006 and 2009). For these VE calculations, cases recorded on the NNDSS as having occurred in people in Victoria or Indigenous people were not excluded, as their different dates of 23vPPV funding do not influence VE estimates. In addition, cases that occurred in Indigenous people were included in population coverage data, so the method required their inclusion in the study population.

A logistic regression model was fitted using the GENMOD procedure in SAS 9.1 (SAS Institute) as described previously.16 Data were stratified by year, age group and, for 2004 and 2006, by jurisdiction. A sensitivity analysis of the VE estimates was conducted, recalculating VE using a deviance of ± 10% of the total population in coverage estimates. Statistical analysis was carried out in SAS 9.1.3. Statistical significance was established by non-overlapping 95% confidence intervals, of rates and rate ratios.

Results

From 2002 to 2011, there were 3978 IPD notifications for Australians aged ≥ 65 years who were not in Victoria and were not Indigenous.

Trends in IPD rates and vaccination coverage

Annual IPD notification rates in people aged ≥ 65 years by serotype category are shown in Box 1. There was a substantial and statistically significant decrease in 7vPCV serotype IPD during the post-7vPCV era (2005–2011), as well as significant increases in 23vPPV–non-7vPCV and non-23vPPV serotypes, based on non-overlapping confidence intervals of annual rates.

The serotype most associated with replacement following 7vPCV introduction internationally — 19A — increased from 3% of isolates in 2002–2004 to 22% in 2010–2011.

The range of self-reported vaccination coverage (percentage vaccinated in the previous 5 years) estimates for those aged ≥ 65 years are also shown in Box 1, for all jurisdictions except Victoria. Coverage ranged from 41% to 53% in individual jurisdictions in 2004, increased to 51%–64% in 2006 and decreased to 48%–56% in 2009.

IPD rates in vaccinated and unvaccinated age groups

Pre-7vPCV (2002–2004) to post-7vPCV (2010–2011) changes in IPD rates in the ≥ 65-year age group and the 50–64-year age group are shown in Box 2. In both age groups there were substantial, statistically significant decreases for 7vPCV serotypes and increases for 23vPPV-non-7vPCV and non-23vPPV serotypes, based on IRRs not overlapping 1.0. The magnitude of these changes did not differ significantly between the two age groups. For all serotypes, the IRR point estimate was lower in the ≥ 65-year age group, but confidence intervals for the two age groups overlapped.

Vaccine effectiveness estimates

Numbers of IPD cases and VE estimates for 23vPPV against 23vPPV-type IPD are shown in Box 3. All VE estimates were statistically significantly above zero. The point estimate for 2009 was lower than for 2004, but was compatible with it, as confidence intervals overlapped. A sensitivity analysis to evaluate the impact of varying population coverage estimates for 23vPPV yielded an upper VE estimate of 75.8% (95% CI, 72.1%–79.9%) if true population coverage was 10% higher than estimated in the adult vaccination survey and a lower VE estimate of 40.5% (95% CI, 31.1%–49.9%) if true population coverage was 10% lower than estimated.

Discussion

Changes in IPD rates over time by serotype category presented here provide evidence of a substantial herd immunity impact in older people due to 7vPCV use in infants. However, an impact on IPD rates directly resulting from 23vPPV use in older people, by comparing changes in vaccinated and unvaccinated age groups, was not clearly shown. The VE estimate for 23vPPV against 23vPPV-type IPD was 61.1%. An overall decrease of 35% was observed in total IPD rates in ≥ 65-year-olds 6–7 years after the commencement of the nationally funded programs for 7vPCV and 23vPPV (25.2 notifications/100 000 population/year in 2002–2004 v 16.4 in 2010–2011).

Herd immunity impacts in adults from use of the 7vPCV in children have been shown in many countries. Herd immunity impacts on total IPD rates are heavily dependent on the pre-vaccination serotype distribution in adults and the length of time since 7vPCV introduction, as serotype replacement increases over time.5 Australian non-Indigenous people had one of the highest proportions of 7vPCV-type IPD out of total IPD in the world, similar to that in the US, and these are the only two countries with net decreases in IPD reported for older people following 7vPCV introduction.17

Trends in IPD rates by year in Australia in our study did not show clear evidence of a reduction of disease incidence due to use of 23vPPV in people aged ≥ 65 years. However interpretation of this finding is complicated by two factors: an overall modest level of 23vPPV coverage and a relatively small increase in coverage after national funding began in 2005; and the apparent indirect effects of introducing the 7vPCV for infants at the same time. The comparison of rates in vaccinated and unvaccinated age groups, both subject to herd immunity impacts from infant vaccination, allows the possibility of some impact from the 23vPPV. The absence of impacts on population IPD rates following publicly funded 23vPPV for ≥ 65-year-olds has also been reported in the US18 and United Kingdom.19 Gradual increases in coverage also occurred in those settings, and formal VE assessments in adults have consistently shown significant VE.2022

All observational methods used to estimate VE are subject to bias. For our application of the screening method, different methods were used to ascertain the vaccination status of the general population (telephone survey) and the vaccination status of 23vPPV-type IPD cases (general practitioner and/or patient interview). However, our sensitivity analysis showed that the VE estimate remained statistically significant even if the true population coverage was 10% lower than the adult vaccination survey estimates. A study of 23vPPV vaccination status in older people in Victoria found that patient recall underestimated vaccination status by 6% compared with medical records.23

During the period of our study, a single revaccination was recommended for people first vaccinated at ≥ 65 years of age. As of December 2011, this is no longer recommended.10 The latest national estimate of the proportion of people aged ≥ 65 years who have ever received 23vPPV is a modest 59%.13 Given the evidence of the vaccine’s effectiveness, higher coverage would be expected to increase the impact of the vaccine in reducing IPD incidence.

Data are yet to emerge on the herd immunity impact from 13vPCV use in Australian children. However, if similar effects are seen from the additional six serotypes as from the 7vPCV, there would be a further reduction in IPD in older people and, therefore, less potential benefit from the 23vPPV.

The appeal of a conjugate vaccine used in older people includes potential, although unproven, benefits such as a superior response to booster doses and impacts on carriage and non-invasive pneumonia. Herd immunity impacts of 7vPCV on non-invasive pneumonia in older people have been reported as being non-existent, very small or extensive.2426 A randomised controlled trial assessing the impact of 13vPCV use in older people on pneumonia is currently underway.27 However, this trial is not being conducted alongside concurrent use of 13vPCV in infants. The incremental benefits of 13vPCV use in older people in addition to an infant program would be more difficult to evaluate.

In conclusion, our data show moderate effectiveness of the 23vPPV against IPD in older Australians, consistent with that shown in comparable populations elsewhere. In combination with herd immunity impacts from 7vPCV in children, this resulted in a 35% decrease in IPD in those aged ≥ 65 years. Further benefits could be expected if an increase in 23vPPV coverage in older people could be achieved.

1 IPD notification rates by serotype category for ≥ 65-year-old Australians and pneumococcal vaccination coverage, 2002–2011*

IPD = invasive pneumococcal disease. 7vPCV = serotypes contained in the 7-valent pneumococcal conjugate vaccine and 23-valent polysaccharide pneumococcal vaccine. 23vPPV–non-7vPCV = serotypes contained in the 23-valent polysaccharide pneumococcal vaccine but not the 7-valent pneumococcal conjugate vaccine. Non-23vPPV = serotypes not contained in either vaccine. * IPD notification rates do not include people in Victoria or Indigenous people; serotype categories are adjusted for untyped cases; error bars for IPD notification rates are 95% confidence intervals; and error bars for vaccination coverage are ranges of self-reported vaccination coverage for individual jurisdictions excluding Victoria.

2 Invasive pneumococcal disease notifications and notification rates for unvaccinated (50–64 years) and vaccinated (≥ 65 years) age groups of older Australians by serotype group, 2002–2004 versus 2010–2011*

Number of notifications


Notifications per 100 000 population per year


Age and serotype group

2002–2004

2010–2011

2002–2004

2010–2011

Incidence rate ratio (95% CI)


50–64-year-olds

7vPCV

490

45

6.59

0.76

0.12 (0.08–0.15)

23vPPV–non-7vPCV

180

311

2.42

5.34

2.21 (1.83–2.67)

Non-23vPPV

53

95

0.71

1.64

2.31 (1.62–3.27)

All

723

451

9.71

7.74

0.80 (0.71–0.90)

≥ 65-year-olds

7vPCV

954

80

17.00

1.84

0.11 (0.09–0.14)

23vPPV–non-7vPCV

317

401

5.65

9.27

1.64 (1.41–1.91)

Non-23vPPV

144

230

2.56

5.30

2.07 (1.67–2.57)

All

1415

711

25.21

16.41

0.65 (0.59–0.71)


7vPCV = serotypes contained in the 7-valent pneumococcal conjugate vaccine and 23-valent polysaccharide pneumococcal vaccine. 23vPPV–non-7vPCV = serotypes contained in the 23-valent polysaccharide pneumococcal vaccine but not the 7-valent pneumococcal conjugate vaccine. Non-23vPPV = serotypes not contained in either vaccine. * Data on people in Victoria and Indigenous people are excluded. Adjusted for untyped cases. 2010–2011 : 2002–2004.

3 Numbers of IPD cases and VE estimates for 23vPPV against 23vPPV-type IPD in Australians aged ≥ 65 years*

Year

Cases in people vaccinated with 23vPPV/total cases (%)

Proportion of population vaccinated with 23vPPV

VE estimate (95% CI)


2004

106/339 (31.3%)

51.1%

63.3% (53.1%–71.9%)

2006

132/320 (41.3%)

62.2%

65.6% (56.1%–73.9%)

2009

90/241 (37.3%)

56.0%

50.4% (35.1%–62.9%)

Total

328/900 (36.4%)

na

61.1% (55.1%–66.9%)


IPD = invasive pneumococcal disease. VE = vaccine effectiveness. 23vPPV = 23-valent pneumococcal polysaccharide vaccine. na = not applicable. * Data include people in Victoria and Indigenous people. Values are summary proportions of Australians who received the vaccine within the previous 5 years. VE estimates were calculated using data stratified by jurisdiction, year and age group.

The growing burden of multidrug-resistant infections among returned Australian travellers

Clinical record

A previously well 66-year-old man was repatriated from Athens, Greece, to the Austin Hospital for ongoing management after a protracted hospital admission for an ischiorectal abscess secondary to perforated diverticulitis. This was complicated by faeculent peritonitis, multiple intra-abdominal abscesses and necrotising fasciitis of the abdominal wall. These complex problems required multiple laparotomies to drain and debride the abscesses, management of an open abdomen with vacuum-assisted closure dressings, and the formation of a loop sigmoidostomy. He also developed a grade IV sacral pressure ulcer with underlying sacral osteomyelitis. Organisms isolated from the intra-abdominal collections included carbapenem-resistant Pseudomonas aeruginosa and a carbapenemase-producing Klebsiella pneumoniae (blaKPC). Due to the complexity of the patient’s illness, he had spent 93 days in hospital in Greece, predominantly in intensive care, with three interhospital transfers within Greece before repatriation to Australia. Antibiotics administered in Greece included tigecycline, colistin, fosfomycin, vancomycin, clindamycin and anidulafungin.

As the patient had multiple resistant organisms, detailed infection control plans were made before his arrival at the Austin Hospital. This included placement in a single room with a dedicated ensuite bathroom, daily bleach cleaning of the room,1 no use of shared equipment, enforcement of strict contact precautions including gowns and gloves, and hand hygiene. Patient movement was severely restricted and only two visitors were allowed at any one time.

Unfortunately, the patient developed a new intra-abdominal collection, bowel obstruction and abdominal sepsis. This required surgical intervention, including extensive division of adhesions, resection of the sigmoid and part of the descending colon, retroperitoneal enteric fistula repair and retroperitoneal abscess drainage. An end colostomy and loop ileostomy were formed. This procedure resulted in faecal continence and therefore control of the perianal source of multidrug-resistant organisms. Culture of the intra-abdominal abscess grew mixed enteric flora including Enterococcus faecium, Escherichia coli, Citrobacter spp, Candida glabrata and K. pneumoniae. The latter organism was resistant to multiple drugs, including meropenem, due to the production of K. pneumoniae carbapenemase-2 (blaKPC-2) (Patient 1, Box). The same organism was found in his faeces.

A blaKPC-2-producing K. pneumoniae was also isolated from a sacral ulcer swab, but the susceptibility profile was slightly different. This isolate was also resistant to all aminoglycosides, including gentamicin and amikacin, and demonstrated an increased minimum inhibitory concentration to colistin (Box). The patient’s antibiotic treatment included meropenem, tigecycline, colistin and caspofungin for 6 weeks, and his sacral ulcer was treated with a vacuum-assisted closure dressing. He stayed at the Austin Hospital for 101 days before being discharged home.

Six months later, the patient re-presented to the Austin Hospital with urosepsis. The causative organism, isolated in both urine and blood, was E. coli (Box). Strikingly, the organism was found to be a blaKPC-2-producing strain, suggesting interspecies transfer of this mobile genetic element between K. pneumoniae and E. coli. Unlike the K. pneumoniae, this isolate was susceptible to ciprofloxacin, and the patient was successfully treated with this antibiotic. During this second admission, the same infection control measures were enforced.

At follow-up 6 months later, the patient remained well. There was no documented inhospital transmission of blaKPC-2, suggesting the infection control measures employed were successful.

Multidrug-resistant (MDR) gram-negative bacteria have emerged as a global health threat. The index case of a repatriated patient with complex MDR Klebsiella pneumoniae infection prompted a retrospective review of similar admissions to our institution between December 2011 and February 2013. Austin Health is an 800-bed hospital over three campuses with 98 125 admissions yearly. It is the statewide referral centre for liver transplantation and the spinal cord service.

The case definition for this review was: a patient who had travelled overseas in the 6 months before admission to Austin Health, had a length of stay at Austin Health of ≥ 2 weeks, and had infection or colonisation with MDR gram-negative organisms.2 Although all patients who are transferred from another hospital to Austin Health are systematically screened for the presence of MDR organisms, the case finding in this retrospective review was largely opportunistic. This case review was approved by the Austin Health Office for Research as an audit activity project.

Screening rectal swabs or faecal samples were plated onto chromID ESBL media (bioMérieux). Clinical specimens were processed routinely. Organism identification and susceptibility testing were performed using agar dilution or the VITEK 2 automated system (bioMérieux). Minimum inhibitory concentrations to tigecycline and colistin were determined using Etest (bioMérieux). Gram-negative isolates were classified as MDR, extensively drug-resistant (XDR) or pandrug-resistant, according to international guidelines.2 Where testing against a particular agent was not done, the result was recorded as susceptible for that agent to avoid overestimating the burden of resistance. Genotypic detection of resistance was performed at Pathology West laboratories using multiplex polymerase chain reactions (PCRs).3

We identified 10 patients during the study period (Box). For all patients except Patient 6, who developed bacteraemia after admission, MDR gram-negative organisms were detected on admission. Eight patients had either been repatriated directly to Australia or discharged from hospitals overseas. There was no predominant country of travel, with a wide geographical spread over multiple continents. The most common clinical problems, occurring in five patients, were accidents resulting in spinal cord injuries or multiple fractures. A broad range of antibiotics was used to treat the infections, with colistin being the most common. Colistin is an old drug that has been “rediscovered” with the advent of MDR gram-negative infections.4 It is associated with significant nephrotoxicity, which was seen in four of six patients. Nine patients survived; one died from overwhelming sepsis related to MDR Pseudomonas aeruginosa sacral osteomyelitis.

Each patient with a carbapenem-resistant organism was managed in a single room with strict contact precautions. When a patient was transported for procedures, all surfaces in contact with the patient were cleaned with 1 : 1000 ppm of chlorine-based disinfectant. For most patients, this occurred before the microbiological test results were available, as patients who had been recently hospitalised overseas were “red-flagged” by the bed manager and infection control team. There were no identified outbreaks resulting from any of these patients.

In these 10 patients, 19 MDR organisms were isolated. Gram-negative organisms (n = 17) were far more common than gram-positive organisms. Most of the gram-negative isolates were classified as MDR, but three isolates (P. aeruginosa and Acinetobacter baumannii complex) were XDR (Box). Of concern, 12 isolates were meropenem-resistant. Most drug-resistant gram-negative organisms were judged clinically to be causing infection and requiring treatment, with only four deemed as colonisers. In addition to the burden of disease in each patient, the cost to the health care system was significant. The total duration of hospitalisation for each patient ranged between 29 and 120 days (mean, 66.4 days). Although difficult to quantify, additional costs incurred from enforcement of strict contact precautions included those related to personal protective equipment, cleaning and prolongation of length of stay due to limits placed on rehabilitation.

Infections with MDR gram-negative bacteria are now well described worldwide.4 The rapidity of their spread, coupled with a lack of new antimicrobial agents, is alarming.5 Of greatest concern is the rise of carbapenemase-producing organisms, as carbapenems are the last line of commonly available gram-negative antibiotics.4 Infections associated with these organisms have high mortality (51%–59%) and have been associated with numerous health care-associated outbreaks.46

In Australia, we are fortunate that such organisms are not yet endemic, but many of these organisms and their resistance mechanisms have been reported locally.5,7 With increasing international travel, these resistant bacteria are no longer limited by geographical boundaries. In 2012, there were a record 8.2 million short-term resident departures from Australia.8 Among the top 10 destination countries were our neighbours including Indonesia, Thailand and China. Recent data from China show hospital rates of carbapenem resistance exceeding 50% in Acinetobacter and 25%–30% in P. aeruginosa.9

A recent Australian study examining the risk of resistant E. coli after international travel showed that colonisation increased from 7.8% to 49%.10 The locations most frequently associated with acquisition of resistant E. coli were the Indian subcontinent, China, the Middle East and Africa. In contrast, most cases in our study were clinical infections rather than colonisation, indicating that the threat of MDR gram-negative bacteria is no longer just a theoretical problem. To document the problem and direct resources to this growing threat at a national level, strong consideration should be given to making these infections notifiable.5,11

Although this case review was limited by the lack of denominator data, there appears to be a high risk of infection or colonisation with MDR organisms in patients who are repatriated from countries with high rates of resistance. It is imperative that hospitals that accept such patients have management protocols in place to prevent spread of MDR organisms locally.11

Lessons from practice

  • Hospitals should follow recommendations for preventing institutional spread of multidrug-resistant (MDR) gram-negative organisms.11,12

  • Patients at high risk of colonisation or infection with MDR gram-negative bacteria should be identified; hospitalisation overseas is a key risk factor.

  • All high-risk patients should be isolated, pending results of screening cultures. Strict infection control measures should be implemented, including contact precautions, hand hygiene, patient placement in single rooms, intensive cleaning of the environment, restriction of patient movement and minimising visitor contact.

  • Screening protocols for colonisation in high-risk patients should be followed. Appropriate patient specimens include rectal or perianal swabs or faeces.

Patients with prolonged hospital admission to Austin Health with multidrug-resistant gram-negative organism infection or colonisation and recent overseas travel, December 2011 to February 2013

Phenotypic drug susceptibility


Patient and country

Clinical
condition

Isolate

Site

AUG

TAZ

Co-T

CTX/
CAZ

CEF

CIP

GEN

AMI

MER

TGC MIC (mg/L)

CST MIC (mg/L)

Phenotype*

Genotype

Treatment

Days in
hospital,
outcome


1 Greece

Intra-abdominal infection

Klebsiella pneumoniae

Intra-abdominal abscess, faeces

R

R

R

R/R

R

R

S

S

R

16

0.38

MDR

KPC-2

Surgery, CST, TGC, MER, caspofungin,

101, survived

Sacral osteomyelitis

K. pneumoniae

Sacrum

R

R

R

R/R

R

R

R

R

R

1

4

MDR

KPC-2

Vacuum-assisted closure dressing

Urosepsis

Escherichia coli

Urine, blood

R

R

S

R/R

S

S

S

S

R

0.25

nd

MDR

KPC-2

CIP

5, survived

2 Croatia

MVA

Acinetobacter baumannii complex

Urine, rectum and groin

R

R

S

R/R

R

R

R

R

R

4

0.38

MDR

OXA-24-like

Co-T, CST

120, survived

3 Colombia

MVA

Pseudomonas aeruginosa

Leg

R

R

R

R/R

R

R

R

R

R

nd

2

MDR

VIM

None (colonisation only)

79, survived

4 Philippines

Liver transplantation

E. coli

Faeces

R

R

R

R/R

R

R

R

S

S

nd

nd

MDR

CTX-M-1-like

None (colonisation only)

56, survived

5 India

Laminectomy

A. baumannii complex

L4–5 disc fluid

R

R

R

R/R

R

R

R

R

R

1.5

0.125

XDR

OXA-23-like

TGC, CST

29, survived

6 Pakistan

Acute myeloid leukaemia

Comamonas spp

Blood

R

R

S

S/S

S

S

R

R

R

nd

0.75

MDR

nd

CIP, CST

42, survived

7 Macedonia

MVA, sacral osteomyelitis

P. aeruginosa

Sacral tissue

R

R

R

R/R

R

R

R

R

R

> 256

1.5

XDR

No carbapenemase genes detected

MER, CST, clindamycin

90+, survived

E. coli

Urine

R

R

R

R/R

R

R

R

S

S

nd

nd

MDR

CMY-2-like,
CTX-M-1-like

MER

K. pneumoniae

Faeces

R

R

S

R/R

R

R

S

R

R

nd

nd

MDR

SHV-5/12, KPC (not subtyped)

None (colonisation only)

Enterococcus faecium

Faeces

nd

nd

nd

nd

nd

nd

nd

nd

nd

nd

nd

vanA

None (colonisation only)

8 Pakistan

Endometriosis with adnexal abscesses

E. coli

Urine

R

S

R

R/R

R

R

R

S

S

nd

nd

MDR

CTX-M-1-like

Ertapenem and penicillin for pelvic collections, asymptomatic bacteriuria

48, survived

E. faecium

Rectum

nd

nd

nd

nd

nd

nd

nd

nd

nd

nd

nd

vanB

None (colonisation only)

9 Afghanistan

MVA

P. aeruginosa

Sputum

R

S

R

R/S

R

R

S

S

R

nd

nd

MDR

No carbapenemase genes detected

CAZ

46+, survived

E. coli

Blood

R

S

R

R/R

R

R

R

S

S

nd

nd

MDR

CTX-M-1-like

MER

10 Mauritius

Trauma, sacral osteomyelitis

P. aeruginosa

Sacral tissue, urine

R

I

R

R/R

R

R

R

R

R

nd

2

XDR

No carbapenemase genes detected

TAZ, CST

48, death from overwhelming sepsis

E. coli

Sacrum

R

R

R

R/R

R

R

R

S

S

3

0.125

MDR

No carbapenemase genes detected

TAZ, CST

K. pneumoniae

Urine

R

R

R

R/R

R

R

R

R

R

4

0.125

MDR

CTX-M-1-like

Asymptomatic bacteriuria


AMI = amikacin. AUG = amoxycillin–clavulanic acid. CAZ = ceftazidime. CEF = cefepime. CIP = ciprofloxacin. Co-T = co-trimoxazole (trimethoprim–sulfamethoxazole). CST = colistin. CTX = ceftriaxone.
GEN = gentamicin. KPC = K. pneumoniae carbapenemase. MDR = multidrug-resistant. MER = meropenem. MIC = minimum inhibitory concentration. MVA = motor vehicle accident. nd = not done. R = resistant.
S = susceptible. TAZ = piperacillin–tazobactam. TGC = tigecycline. XDR = extensively drug-resistant. * Phenotypic resistance classification according to published guidelines.2 For this isolate, P. aeruginosa definitions for susceptibility classification were used. Not yet discharged at time of writing.

Pointers for pandemic planning

As the World Health Organization regularly reminds us, neither the timing nor the severity of the next influenza pandemic can be predicted. So, when avian influenza A(H5N1) virus emerged and fatal human cases were detected in a number of countries from 2003 onwards, pandemic planning took centrestage. At that time, those tasked with writing and implementing pandemic plans had no easy reference or experience to draw upon as the most recent pandemic had occurred 35 years earlier, in 1968, when technologies such as antiviral drugs, split and subunit vaccine preparations and computer-aided disease surveillance systems for outbreak detection did not exist. This made the first edition of Van-Tam and Sellwood’s book Pandemic influenza, published in April 2009, a useful resource. The book brought together leading experts to summarise the epidemiology, virology and clinical aspects of influenza as well as public health surveillance, emergency response and risk aspects of pandemic preparedness.

This second edition of the book was published in February 2013 and has built in the experience and lessons learnt from the 2009 influenza A(H1N1pdm09) pandemic. It consists of 20 chapters and nine country case studies. The editors are eminently qualified to oversee such a project: Van-Tam is Professor of Health Protection at the University of Nottingham in the United Kingdom, and Sellwood is Pandemic and Seasonal Influenza Resilience Manager at the National Health Service in London. Once again, they have selected some of the world’s most respected and influential practitioners in the field to present summaries of current pandemic influenza knowledge, preparedness and response plans. Each chapter presents an authoritative and balanced overview.

Without doubt, this book fills a gap as no other publication addresses the plethora of issues faced by pandemic planners. The book will greatly benefit those advising decisionmakers on the rationale for various recommendations including on topical issues such as the utility of the anti-influenza drug oseltamivir, which has been recently questioned. The book’s layout and limited use of colour does detract from its shelf appeal but the content is not compromised. The book will serve public health practitioners and students in Australia and other developed countries well on both technical and operational issues.

Vitamin D and tuberculosis

There is little evidence to suggest that vitamin D has any therapeutic effect in treating tuberculosis

Before antimycobacterial medicines were introduced (around 1950), the best support for patients with tuberculosis (TB) appeared to be sunshine. For TB patients who needed bed rest, sun-facing balconies in sanatoria were considered to be more therapeutic than the usual dark hospital wards. In 1904, William Osler noted that rabbits inoculated with tubercle bacilli succumbed rapidly if kept in the dark, but not in the open air. He advised patients treated at home to have as many hours as possible in the sunshine. Cod liver oil was also used — a large controlled trial at the Brompton Hospital, London in 1848 showed clear benefit of cod liver oil in treating pulmonary consumption.1

However, sunlight is our major source of vitamin D and cod liver oil is rich in vitamin D3 (5 g oil provides 10 μg, the recommended daily intake for most adults). So can vitamin D help prevent or treat TB?

In the past 15 years, there has been a surge of research interest in whether vitamin D can be a protective influence in a range of diseases — notably, type 1 diabetes, multiple sclerosis, colorectal cancer, psoriasis and TB.2

The vitamin D receptor has been found in many different types of cells, including T and B lymphocytes, monocytes and macrophages, and respiratory epithelial cells. Most of these cells also express the enzyme that can make the active 1,25-dihydroxyvitamin D internally. In cell culture, macrophages exposed to vitamin D produce antimicrobial activity against intracellular Mycobacterium tuberculosis by induction of the peptide cathelicidin LL-37.3

In this issue of the Journal, MacLachlan and Cowie suggest that the seasonal incidence of TB in Australia (highest in October to December) is partly determined by differences in ultraviolet radiation exposure and subsequent vitamin D synthesis.4 In south-eastern Australia, serum 25-hydroxyvitamin D (25-OHD) levels are at their lowest in September.5 In Cape Town, at the same latitude as Sydney (33°S), TB notifications peak at the same time of the year, about 2 months after the lowest annual measured levels of 25-OHD. In the northern hemisphere, TB notifications peak in the United Kingdom at the opposite time of the year (March to May) and also in late spring (in reverse to the incidence times for other respiratory diseases). MacLachlan and Cowie report that TB notifications in Australia show a stronger seasonal pattern in the southern states.4 In contrast, in the United States, Willis and colleagues, although noting a seasonal pattern in new cases of TB, did not find an association between latitude and new TB cases (ie, TB notifications were not higher in the northern states compared with the southern states).6

A case–control study found that isoniazid and rifampicin reduced serum 25-OHD levels in patients with TB.7 To exclude this possible drug effect, Nnoaham and Clarke reviewed studies in which culture-positive TB patients had not yet started antimycobacterial treatment and found that in six of seven studies, patients had significantly lower 25-OHD levels.8 Talat and colleagues noted that in a cohort of household contacts of TB patients, those with low 25-OHD levels had a greatly increased risk of progression to active TB; however, this was only a small prospective study.9

Randomised controlled trials of vitamin D need to be carried out alongside antibacterial medications and the possibility of coexistent HIV infection. A trial in Guinea-Bissau did not show benefit;10 however, the trial may have used vitamin D doses that were too low to be effective. In a large UK trial,11 time to reach negative sputum culture averaged 36 days with vitamin D and 43.5 days with antimycobacterial agents alone (not significant). When analysed by genotypes of vitamin D receptor, adding vitamin D significantly hastened sputum culture conversion in patients with the TT genotype (only 10% of all patients). Based on the same trial, with additional data, among the 76% of the original patients who fulfilled criteria for per-protocol analysis, vitamin D was found to accelerate sputum smear conversion in all vitamin D receptor genotypes and, from differences in haematology and cytokines, appeared to enhance the anti-TB therapy.12

To summarise, available evidence suggests that low vitamin D levels increase the risk of reactivation of TB. However, there is relatively little evidence to support a clinically meaningful therapeutic effect alongside present anti-TB chemotherapy.