×

Pertussis control: where to now?

Improving protection against pertussis requires sorting the facts from the artefacts

Pertussis is a disease of significant morbidity and, in infants, mortality. Regrettably, even though there is greater than 20-fold reduction in pertussis burden with immunisation,1 it persists globally as a significant public health problem. For more than two decades, Australia has had the highest reported rates of pertussis in the world.2 In the 1990s, this was driven by the introduction of mandatory reporting by laboratories of positive test results for vaccine-preventable diseases to the National Notifiable Diseases Surveillance System and extensive use of serological tests for diagnosis, primarily in adults.3 Unlike many other countries, all positive test results in Australia are included in national data. Also, testing for pertussis by polymerase chain reaction (PCR) has qualified for reimbursement since 2008, after which a sevenfold increase in testing of children in general practice was documented.4 Pertussis epidemics occurred sequentially across Australia from 2008 to 2012 and, unlike previous epidemics, the highest notification rates were for children under 10 years of age. This raises the question of whether Australia’s “pertussis problem” is related to vaccines with poor effectiveness or is an artefact of testing.

Observational methods are used to measure vaccine effectiveness (VE) (also known as “field efficacy”). The screening method enables estimation of VE if the vaccination status of patients with a case of the disease and population vaccine coverage are known — the more effective the vaccine, the lower the likelihood of patients with a case of the disease having been vaccinated compared with the source population.5 The screening method performs best when about 50% of the population is vaccinated. When vaccine coverage is over 90%, estimates of VE change substantially with small changes in population coverage estimates. In this issue of the Journal, Sheridan and colleagues use the screening method to estimate VE for acellular pertussis vaccine in Queensland children during an epidemic in 2009 and 2010.6 They found that VE for three doses in children aged from 1 to < 4 years was over 80%. However, similar to studies in the United States,7,8 VE fell significantly and progressively in children over 5 years of age, whether they had received four or five doses. It was previously reported that among Queensland children born in 1998, those who had received one or more doses of whole-cell pertussis vaccine were significantly better protected than those who had received only acellular vaccine, especially after 6 years of age.9 A national study, which included Queensland data from 2009, took a different approach — cases were individually matched by birth date to children on the Australian Childhood Immunisation Register and were limited to children younger than 4 years.10 Similar VE estimates were obtained for the first 2 years of life, but, in contrast to findings from the Queensland study, there was a significant and progressive fall in VE between ages 2 years and 4 years (the latter being the age at which children were eligible for the fourth dose).

Importantly, Sheridan et al were also able to evaluate testing patterns by age, showing that the overall number of PCR tests increased in the second year of the Queensland epidemic.6 Also, in children aged over 5 years, although PCR tests were less commonly performed, the results were more commonly positive.6 This is probably due to older children with cough being less likely to present to general practice and less likely to be tested, suggesting that notification rates of pertussis would have been even higher if more testing had been done. Disease severity is also an important consideration: assessing the disease burden from pertussis cases in older children is valuable, and VE is expected to be lower for less severe illness.5 Apart from the requirement for hospitalisation, against which VE was high for children younger than 1 year3 and 1–4 years,10 few data on severity are available. In a recent New South Wales study using linked hospitalisation and pertussis notification data, it was found that only 2% of children over 5 years who had pertussis were hospitalised, but 8% had been taken to an emergency department.11

What conclusions can we draw from these studies? First, the current acellular vaccines are highly effective in preventing severe pertussis, especially in the first 2 years of life, but effectiveness progressively wanes from 2 years after the last dose. Such rapid waning was not expected when the decision to forego the 18-month booster in favour of a booster for adolescents was made in 2003. This decision was based on favourable results from modelling this change using the only available data at the time12 — data which suggested that three doses provided protection up to 7 years of age,13 which contrasts with more recent findings. Australian data showing low levels of population antibody to pertussis toxin preceding the recent epidemic support the idea that the schedule change had a negative impact.14 Second, high levels of laboratory testing inflated Australian case numbers disproportionately to other countries, through identifying more ambulatory cases in children and adults. Third, pertussis vaccine coverage has increased dramatically in Australia since the epidemic in the late 1990s, with better acceptance by parents and doctors of the acellular vaccines compared with more reactogenic whole-cell vaccines. Notably, the national epidemic from 2008 to 2012 was associated with fewer deaths than the late 1990s epidemic, despite much higher numbers of cases.

Where does the future lie for pertussis vaccines in terms of improving disease control, especially death and severe morbidity? A vaccine that effectively reduces transmission and disease is an important objective for herd immunity. In this regard, there is promise from research on live attenuated vaccines,15 and the potential for acellular vaccines with improved adjuvants and less reactogenic whole-cell vaccines, but all are some years away. Immunising mothers during the last 8 weeks of pregnancy with adult-formulated acellular pertussis vaccine could prevent early infant mortality and morbidity. Reinstalling the 18-month booster in the National Immunisation Program could improve control in early childhood, if cost-effectiveness criteria can be met. For all vaccines on the National Immunisation Program, ongoing monitoring of VE is crucial and greater use of Australia’s high-quality data systems can support this, as recommended in the National Immunisation Strategy.16

Staphylococcus aureus bacteraemia associated with peripherally inserted central catheters: the role of chlorhexidine gluconate-impregnated sponge dressings

To the Editor: Staphylococcus aureus bacteraemia (SAB) is an important health care-associated infection that is often related to indwelling vascular catheters.1 Peripherally inserted central catheters (PICCs) are increasing in popularity for providing long-term central access, enabling earlier hospital discharge and reducing inpatient costs.2 Despite increased use of PICCs, little has been published on the risks of PICC-associated SAB (PA-SAB). We sought to characterise the frequency of PA-SABs at our institution and analyse the effect of using a chlorhexi-dine gluconate-impregnated sponge (CHGIS) dressing on the PA-SAB rate.

All SAB episodes at Monash Health
are investigated by the Department of Infection Prevention and Epidemiology.
A PA-SAB was defined as a health care-associated SAB in a patient with a PICC
in situ (or removed within 7 days before the positive blood culture) with no other source of SAB identified and written documentation or clinical findings suggesting a PICC source.3 The data for this study included all PA-SAB episodes during 2007–2012.

All PICCs at our institution are inserted by a radiologist from the diagnostic imaging service under sterile conditions. In January 2011, routine use of a CHGIS (Biopatch, Ethicon) as a dressing around the insertion site was introduced for
all PICCs. Aside from the use of an additional sterile drape during PICC insertion from mid 2008, there were no other changes to protocols for inserting, dressing or accessing PICC lines during the study period.

We calculated the PA-SAB rate using
as the denominator the total number of PICCs inserted by the diagnostic imaging service for the 4 years before and 2 years after CHGIS use began. The χ2 test was used to calculate statistical significance.

Across the 6-year study period, 42 PA-SAB episodes were identified. Of these,
35 occurred during the first 4 years of the study, in which a total of 2625 PICCs were inserted, giving a rate of 1.3 PA-SAB episodes per 100 PICCs. After routine use of CHGISs began, there was a significant reduction in the infection rate to 0.3 PA-SAB episodes per 100 PICCs (7 PA-SAB episodes/2522 PICCs inserted; P < 0.001) (Box).

The median time from PICC insertion to SAB was 16.5 days (range, 1–150 days). Eight patients experienced serious infective complications from PA-SAB, including septic shock and infective endocarditis.

A limitation of our study was its observational and retrospective nature. We are unable to completely exclude other causative factors aside from CHGIS dressing use that could have contributed to a reduction in the PA-SAB rate during the final 2 years of the study period.

Our study provides supportive evidence that CHGIS dressing use
may be effective at reducing SAB in the presence of a PICC. The introduction of routine CHGIS use in January 2011 was followed by a significant reduction in the rate of PA-SABs in the subsequent
2 years. Such a drop is consistent with the results of previous trials assessing the efficacy of CHGIS dressings for preventing central line-associated bloodstream infections in the intensive care setting.4

Biannual numbers of peripherally inserted central catheter (PICC)-associated Staphylococcus aureus bacteraemia (PA-SABs) episodes and PICCs inserted,
2007–2012

CHGIS = chlorhexidine gluconate-impregnated sponge. Arrow indicates time of introduction of
routine use of a CHGIS with PICC insertion.

Acellular pertussis vaccine effectiveness for children during the 2009–2010 pertussis epidemic in Queensland

In Queensland, 2009 and 2010 were epidemic years for pertussis. New patterns of disease emerged, with particularly high rates of pertussis notification for those aged 6 – < 12 years despite high primary course and booster vaccine coverage for more than a decade. A similar disease pattern was observed in California.1 Evidence from Qld,2 California36 and Oregon7 indicates that changing from whole-cell to acellular pertussis vaccine in the late 1990s8,9 contributed to recent pertussis epidemiology. In Qld and Northern California, the highest notification rates during 2010 occurred in the first birth cohorts to receive acellular pertussis vaccine. North American studies describe rapid waning of protection following a five-dose course of acellular pertussis vaccine.4,5,10 Data from Qld2 and Oregon7 showed a primary course of whole-cell vaccine, or at least the first dose of the primary course being whole-cell vaccine, provided significantly greater protection against pertussis than priming with acellular pertussis vaccine alone. These findings are supported by earlier work from Canada, which suggests that the median time until disease following the most recent vaccine dose may be shorter in children who receive acellular pertussis vaccine compared with children who receive whole-cell pertussis vaccine.11

Pertussis vaccination is available to children as part of the publicly funded National Immunisation Program.8 Due to adverse events associated with the whole-cell pertussis vaccine,12 acellular pertussis vaccine was introduced into the National Immunisation Program in 1997. The acellular vaccine (principally the three-component type) completely replaced the whole-cell vaccine by 1999 (Appendix 1).8

We sought to assess the effectiveness of acellular pertussis vaccine during 2009 and 2010 in Qld. Recognising the potential influence that changes in testing patterns may have on pertussis notification rates and vaccine effectiveness (VE) estimates,13 we also investigated pertussis notification rates between 2008 and 2010 and laboratory testing patterns during 2009 and 2010 for Qld children.

Methods

Notification and testing patterns

We obtained confirmed pertussis notification data from the Qld notifiable diseases database and calculated annual age-specific notification rates for children aged 1 – < 12 years between 2008 and 2010. According to the national guidelines, pertussis case confirmation requires one of the following: definitive laboratory evidence; suggestive laboratory evidence and clinical evidence; or clinical evidence and epidemiological evidence.14

Definitive laboratory evidence consists of Bordetella pertussis isolation by culture or detection via a nucleic acid amplification test, such as a polymerase chain reaction (PCR) assay. Suggestive laboratory evidence is most commonly met by identifying a single high serum IgA titre to pertussis antigens or evidence of seroconversion. Clinical evidence for confirmed cases requires a coughing illness lasting ≥ 2 weeks or one of the following: coughing paroxysms, inspiratory whoop or post-tussive vomiting. Epidemiological evidence consists of contact between two people at a time when one of them is likely to be infectious and the other becomes symptomatic 6–20 days later, with at least one case in the chain of epidemiologically linked cases having been being confirmed with suggestive or definitive laboratory evidence.

Two major Qld pathology providers — Pathology Queensland, the publicly funded laboratory service, and Sullivan Nicolaides Pathology, a private company — provided data on pertussis serological tests and PCR assays undertaken at their laboratories in 2009 and 2010 for Qld residents. These providers were responsible for about 40% of pertussis notifications in Qld during the study period. We did not include culture results to determine pertussis testing patterns because culture was performed infrequently and mostly on specimens also tested by PCR. We describe the numbers of serological and PCR tests, and the results of these tests, by age and year of test for children aged 1 – < 12 years.

Pertussis vaccine schedule and vaccine effectiveness

We calculated estimates of acellular pertussis VE against pertussis notification and hospitalisation in 2009 and 2010. To restrict the analysis to children who exclusively received acellular pertussis vaccine, only those residing in Qld and born in 1999 or later were included. We excluded second notifications or hospitalisations that occurred in the same individual during the same calendar year. We retrieved data on hospitalisations with a pertussis code in any diagnostic field from all Qld public and private hospitals.15 Due to small admission numbers, VE against hospitalisation was only calculated for children aged 1 – < 4 years as a single age group.

Changes in the acellular pertussis vaccine type and schedule delivered to Qld children during the study period included removing the 18-month booster dose in 2003 and introducing an adolescent booster dose in 2004 (Appendix 1). Children were considered fully vaccinated if they had received the recommended number of pertussis-containing vaccines for their age according to the schedule at the time. This meant that children in the 2006–2008, 2002–2004 and 1999–2001 birth cohorts were considered fully vaccinated if they had received three doses (primary course only), four doses (primary course plus 4-year booster) and five doses (primary course plus 18-month and 4-year boosters), respectively.

VE was calculated using the screening method, which involves comparing the proportion vaccinated among people who had a case of disease (PCV) with the proportion of the study population that is vaccinated (PPV).16 We obtained the vaccination status of patients who had a case of pertussis from Queensland Health’s Vaccination Information and Vaccination Administration System. As this register does not include children who have not received any vaccines, we obtained aggregated population coverage data for Qld for each birth cohort from the national, population-based Australian Childhood Immunisation Register (ACIR). Vaccinations recorded < 2 weeks before illness onset were excluded from calculations. The “third-dose assumption” was used in all VE calculations — children are assumed to have received the first two doses of a three-dose course if their third dose is recorded. The validity of this assumption has been demonstrated for the ACIR.17 Partially vaccinated children were excluded from PCV and PPV calculations. VE was not calculated for children aged < 1 or 4 – < 5 years as their vaccination status changed during the period of analysis due to receipt of the primary course or 4-year booster.

VE estimates and 95% confidence intervals were obtained by fitting logistic regression models with the outcome variable as the vaccination status of the patient with pertussis and offset for the logit of PPV.16 We fitted constant-only models for each stratum of birth cohort and notification year. When estimating the association between birth cohort and VE, we included birth cohort as a main effect. Sensitivity analyses on diagnostic method (notified cases confirmed by PCR or culture versus all notified cases) and hospital coding (hospitalisations with a pertussis code listed as the principal diagnosis versus hospitalisations with a pertussis code in any diagnostic field) were performed. Stata version 12 (StataCorp) was used for the analysis.

Ethics approval

The Human Research Ethics Committee of Children’s Health Services, Queensland Health, approved this study.

Results

Epidemiology

Pertussis notification rates increased substantially in 2009 and 2010 from pre-epidemic 2008 levels. The highest rates were in 2010, for children aged 7 – < 11 years (Box 1).

Testing patterns

The numbers of pertussis tests performed and relative contribution of PCR tests for children aged 1 – < 12 years increased between 2009 and 2010 (Box 2). The proportions of PCR tests with a positive result were highest in the older children and increased in children aged 6 – < 12 years between 2009 and 2010 (Box 2). The proportions of serological tests with a positive result were lower, but followed a similar pattern to that for the PCR tests (Box 2).

Vaccine effectiveness

In total, 1961 pertussis notifications and 29 pertussis hospitalisations were included in the VE calculations (Appendix 2).

Notifications

In 2009, point estimates of three-dose primary course VE against pertussis notification were 87.0% and 89.4% for the 2007 and 2006 birth cohorts, respectively, similar to that for preventing hospitalisation (87.1%) (Box 3; Appendix 3). Point estimates of VE for children aged 5 – < 11 years — who should have received the primary-course, 4-year booster and largely also the 18-month booster — ranged from 71.2% in the 2000 birth cohort to 87.7% in the 2003 birth cohort.

In 2010, point estimates of three-dose primary course VE against pertussis notification remained high (83.5% and 85.4% for the 2008 and 2007 birth cohorts, respectively) (Box 3; Appendix 3). Point estimates of VE were lower for children aged 5 – < 12 years in 2010 compared with those for children aged 5 – < 11 years in 2009. Among these older cohorts, 2010 VE point estimates ranged between 55.3% and 70.3%, with the exception of the 2002 cohort, which had a VE estimate of 34.7%. VE against pertussis notification waned with increasing age in 2009 (P = 0.006) and 2010 (P < 0.001).

Restricting the analysis to notified cases that were cases confirmed by PCR or culture, all 2009 VE point estimates and a majority of 2010 VE estimates changed by six or fewer percentage points, and no overall consistent pattern emerged (Box 3). However, VE point estimates for several birth cohorts were substantially lower in 2010 for cases confirmed by PCR or culture. The trend of waning VE with age remained significant among cases confirmed by PCR or culture (P = 0.001 for 2009; P < 0.001 for 2010).

Hospitalisations

For children aged 1 – < 4 years, the VE estimates for the three-dose primary course against hospitalisation were 87.1% and 85.6% in 2009 and 2010, respectively (Box 3). Restricting the analysis to hospitalisations with a pertussis code in the principal diagnoses field yielded similar results.

Discussion

The primary course of acellular pertussis vaccine was highly effective in protecting children aged 1 – < 4 years against pertussis notification and hospitalisation in Qld during the epidemic years of 2009 and 2010. Our VE estimates are similar to findings for predominantly whole-cell pertussis vaccine in the late 1990s in New South Wales, where VE was 85% for children aged 2 – < 5 years.18

However, our findings indicate that protection waned with increasing age following receipt of the 4-year booster and are consistent with the waning protection observed in the United States.4,5,10 The decline in point estimates for VE against notification in 2009, from 88% in children aged 5 – < 7 years to 71% and 80% among children aged 8 – < 10 and 9 – < 11 years, respectively, is similar to 2010 findings from California, where VE progressively declined from 95% for children 1 – < 2 years after their fifth pertussis vaccine dose to 71% for children ≥ 5 years after their fifth pertussis vaccine dose (recommended to be given at age 4–6 years).5 Overall, higher VE estimates were found for the whole-cell pertussis vaccine in NSW between 1996 and 1998 — 87% for children aged 5 – < 9 years and 78% for children aged 9 – < 14 years.18 This is consistent with evidence showing that the whole-cell vaccine used previously in Australia provided greater duration of protection against pertussis than the acellular vaccine.2 Despite the waning protection provided by acellular pertussis vaccine, we should ensure that high coverage with current vaccines is maintained until low-reactogenic vaccines providing sustained high-level protection against pertussis are developed.

As the screening method is very sensitive to small changes in coverage estimates, the accuracy of PPV estimates is important. Our study benefited from obtaining PPV values from the ACIR, which registers about 99% of Australian children by 12 months of age.19 Previous validation of ACIR data indicates that the most likely inaccuracy is that PPV will be underestimated,20 which, in isolation, may result in underestimating VE. A limitation affecting our study is that in the context of very high vaccination coverage, modest changes in PCV can lead to marked changes in VE estimates. Due to regional variation in immunisation coverage (estimated to be largely < 2%), our lack of geographical stratification may have biased statewide VE estimates in either direction. In addition, the small numbers of hospitalisations provide low precision for VE estimates against severe disease. The value of this method is in providing a broad overview of VE and changes in VE over time.21

In our study, VE point estimates were lower for 2010 compared with 2009, particularly among the older age groups. We are unable to explain the isolated low VE point estimate of 35% in 2010 among children born in 2002. While there is evidence of increasing circulation of vaccine-mismatched strains,22 we believe vaccine-driven selection pressure is unlikely to account for such rapid and uneven changes in VE estimates between 2009 and 2010, as this would require circulating pertussis strains to vary with childhood age group and change very rapidly over time.

Changes in diagnostic testing behaviour, owing to expanded availability and increased awareness of PCR testing,13 may have contributed to decreased VE estimates in 2010 compared with 2009. While we cannot be certain of the generalisability of the laboratory data that we used, they are probably broadly representative of pertussis testing in Qld because they accounted for about 40% of statewide pertussis notifications. Based on our data, use of the more sensitive, less invasive PCR assays for pertussis testing has increased rapidly in Qld. Before the widespread availability of PCR assays, clinicians may have been less likely to seek laboratory confirmation involving venepuncture, particularly for milder illness in children. Publicity about pertussis during the epidemic may have increased pertussis testing requests by clinicians; a recent study showed an almost 40% increase in testing between April 2009 to March 2010 and April 2010 to March 2011.23

Increases in awareness, testing and detection of milder disease, and the possibility that the vaccine may be less effective against milder disease, may have resulted in decreases in VE estimates.24 It may be hypothesised that through differential health care use, older children may be less likely to have milder disease diagnosed, leading to relatively high and stable VE estimates. However, point VE estimates among older children were substantially lower in 2010 compared with 2009. Increased testing is likely to have contributed substantially to high notification rates during the epidemic. However, the high and increasing proportion of pertussis tests with a positive result between 2009 and 2010 in older children suggests that the disease burden was truly greatest and increasing in 2010 among children aged 6 – < 12 years, consistent with notification patterns and waning protection following a four- or five-dose acellular vaccine course. A likely consequence of increased pertussis incidence among older children is increased transmission, which will have the greatest impact on infants.

In the era of predominant PCR use and heightened awareness, pertussis notification rates even during non-epidemic periods are likely to be substantially higher, and VE estimates for preventing notification may be consistently lower than recorded previously. This change in testing behaviour, leading to identification of milder disease, may require a recalibration of what are considered baseline notification rates and will need to be considered when interpreting future VE estimates.

1 Age-specific pertussis notification rates, Queensland, 2008–2010

2 Numbers of pertussis serological and polymerase chain reaction (PCR) tests by Queensland Health and Sullivan Nicolaides Pathology laboratories, and proportions with a positive result, for children aged 1 – < 12 years in 2009 and 2010, Queensland

3 Vaccine coverage and vaccine effectiveness (VE) against pertussis notification and hospitalisation using the “third-dose assumption” for children aged 1 – < 12 years in 2009 and 2010, Queensland, by birth cohort*

Notifications

Birth cohort

Age,
years

Course used to assess VE

PCV
for all cases

PCV for PCR-positive and culture-positive cases

PPV

VE (95% CI)
for all cases

VE (95% CI)
for PCR-positive
and culture-positive cases


2009 notifications

2007

1 – < 3

3 doses

74.6% (50/67)

71.4% (40/56)

95.8%

87.0% (77.5% to 92.5%)

89.0% (80.3% to 93.8%)

2006

2 – < 4

3 doses

71.8% (56/78)

66.7% (42/63)

96.0%

89.4% (82.6% to 93.5%)

91.7% (85.9% to 95.1%)

2003

5 – < 7

4 doses

73.6% (64/87)

73.9% (51/69)

95.8%

87.7% (80.1% to 92.3%)

87.4% (78.5% to 92.7%)

2002§

6 – < 8

4 doses

81.6% (71/87)

80.6% (50/62)

94.8%

75.5% (57.8% to 85.7%)

77.0% (56.7% to 87.8%)

2001

7 – < 9

5 doses

77.4% (82/106)

75.7% (56/74)

94.5%

80.3% (68.9% to 87.5%)

82.0% (69.4% to 89.4%)

2000

8 – < 10

5 doses

83.9% (78/93)

86.0% (49/57)

94.7%

71.2% (49.9% to 83.4%)

66.0% (28.3% to 83.9%)

1999

9 – < 11

5 doses

77.8% (63/81)

79.5% (35/44)

94.7%

80.3% (66.7% to 88.3%)

78.1% (54.5% to 89.5%)

2010 notifications

2008

1 – < 3

3 doses

80.2% (93/116)

84.2% (80/95)

96.1%

83.5% (73.9% to 89.5%)

78.2% (62.1% to 87.4%)

2007

2 – < 4

3 doses

78.0% (92/118)

76.6% (72/94)

96.0%

85.4% (77.5% to 90.6%)

86.5% (78.3% to 91.6%)

2004

5 – < 7

4 doses

86.2% (131/152)

88.1% (104/118)

95.5%

70.3% (53.0% to 81.3%)

64.7% (38.3% to 79.8%)

2003

6 – < 8

4 doses

86.1% (149/173)

86.2% (119/138)

95.0%

67.3% (49.6% to 78.7%)

67.0% (46.4% to 79.7%)

2002§

7 – < 9

4 doses

91.7% (189/206)

94.9% (148/156)

94.5%

34.7% ( 7.2% to 60.3%)

8.6% ( 121.2% to 46.7%)

2001

8 – < 10

5 doses

88.6% (164/185)

90.8% (119/131)

94.6%

55.3% (29.6% to 71.6%)

43.3% ( 2.7% to 68.7%)

2000

9 – < 11

5 doses

88.7% (205/231)

90.4% (142/157)

94.7%

56.2% (34.2% to 70.9%)

47.5% (10.6% to 69.1%)

1999

10 – < 12

5 doses

88.4% (160/181)

86.8% (118/136)

94.7%

57.1% (32.4% to 72.8%)

63.1% (39.4% to 77.5%)

Hospitalisations


Birth cohort

Age,
years

Course used to assess VE

PCV
for all cases

PCV for principal diagnosis cases

PPV

VE (95% CI)
for all cases

VE (95% CI)
for principal diagnosis cases


2009 hospitalisations

2006–2007

1 – < 4

3 doses

75.0% (15/20)

66.7% (10/15)

95.9%

87.1% (65.6% to 95.3%)

91.4% (74.9% to 97.1%)

2010 hospitalisations

2007–2008

1 – < 4

3 doses

77.8% (7/9)

77.8% (7/9)

96.1%

85.6% (30.9% to 97.0%)

85.6% (30.9% to 97.0%)


PCR = polymerase chain reaction. PCV = proportion vaccinated among people who had a case of pertussis. PPV = proportion of study population that is vaccinated.

* VE not calculated for children < 1 year of age in 2009 and 2010, and for the birth cohorts of 2004–2005 in 2009 and 2005–2006 in 2010, as the vaccination status of these cohorts was changing during the period of analysis due to receipt of either their primary course or 4-year booster.

Data are percentage (number fully vaccinated/total). Fully vaccinated is defined as: receipt of third dose for 2006–2008 birth cohorts; receipt of third dose and 4-year booster for 2002 and 2003 birth cohorts; and receipt of third dose, 18-month booster and 4-year booster for 1999–2001 birth cohorts. Total is defined as: number of fully vaccinated children who had a case of pertussis plus number of unvaccinated children who had a case of pertussis.

PPV values were obtained from the Australian Childhood Immunisation Register; they were calculated by dividing numbers of fully vaccinated children in each birth cohort by total number of fully vaccinated and unvaccinated children in each birth cohort.

§ About one-quarter of this cohort was eligible for the 18-month booster.

Principal diagnosis cases are those in which a pertussis code was listed in the principal diagnosis field.

Multidrug-resistant tuberculosis in Western Australia, 1998–2012

Multidrug-resistant tuberculosis (MDR-TB), defined by resistance to both isoniazid and rifampicin, has significant implications for individual patient management and TB control efforts. The current global situation is further complicated by the emergence of extensively drug-resistant TB (XDR-TB), defined by additional resistance to a fluoroquinolone and at least one second-line injectable drug (amikacin, kanamycin or capreomycin).1 Drug resistance may develop in the context of TB treatment, but the majority of MDR-TB cases are contracted as primary infections.2 As with drug-susceptible TB, household transmission is common, frequently affecting young children.3,4 Treatment is resource-intensive and requires longer courses of less effective, more toxic and more expensive drugs compared with drug-susceptible TB.5

Global efforts to combat the threat of MDR-TB have been hampered by a paucity of data. Although progress has been made towards obtaining accurate estimates of MDR-TB in key high-burden countries, less than 4% of bacteriologically proven incident TB cases worldwide underwent formal drug susceptibility testing (DST) in 2011.1 Overall, 3.7% of new TB cases are estimated to be MDR-TB, with proportions by country varying from 0 to 32.3%. The estimated treatment success of MDR-TB globally is 48%.1 Even in wealthy countries, MDR-TB is associated with increased risk of adverse outcomes, including death.68

A total of 196 laboratory-confirmed MDR-TB cases were reported in Australia from 1998 to 2010.9 In Victoria, increasing numbers of MDR-TB cases were reported over the 10-year period to 2007.10 Most patients were born overseas, but local transmission has also been reported.11 High rates of MDR-TB (about 25% of tested isolates) have been observed in patients from Papua New Guinea who were treated in Queensland health clinics in the Torres Strait.12 XDR-TB remains rare, with only two reports in Australia.9,13

Early experience of MDR-TB in Western Australia was published in 1991.14 Here, we describe epidemiological, clinical, treatment and outcome data for all MDR-TB cases notified in WA over 15 years to 2012, and compare MDR-TB cases against a matched cohort of patients with drug-susceptible TB.

Methods

All patients with a laboratory-confirmed diagnosis of MDR-TB in WA from 1 January 1998 to 31 December 2012 were identified from the state Mycobacterium Reference Laboratory in Perth. Automated DST was carried out using the BACTEC 460TB mycobacterial detection system (Becton Dickinson) before 2007 and the BACTEC MGIT 960 system (Becton Dickinson) since then. Isoniazid susceptibility was tested at 0.1 μg/mL and 0.4 μg/mL in each case. Paediatric patients with probable MDR-TB, diagnosed according to international research definitions on the basis of probable TB plus a history of household or daily contact with someone with confirmed MDR-TB,15 were also included.

For each MDR-TB case, three matched controls with drug-susceptible TB (on the basis of DST or demonstrated response to standard therapy) were selected from the same period. Randomly chosen controls were matched for site of TB disease, HIV status, age and sex.

De-identified patient data were collected from medical and laboratory records for all cases and controls. Data included demographic characteristics, risk factors, clinical and laboratory diagnostic information, treatment details, health care resource use and outcomes.

Statistical analysis was performed with GraphPad Prism 6.0 statistical software (GraphPad). Categorical data were compared using McNemar’s test, and continuous variables using the Mann–Whitney test. A two-tailed P value < 0.05 was considered significant.

Ethics approval for the study was granted by the WA Department of Health Human Research Ethics Committee.

Results

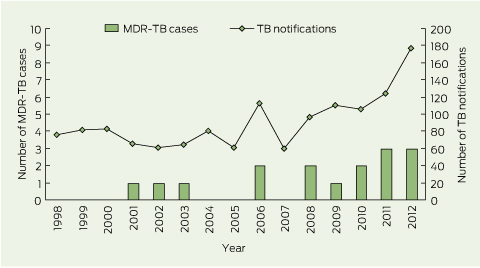
During the study period, 16 cases of MDR-TB were notified (zero to three cases per year), accounting for 1.2% of all TB cases (n = 1352) notified in WA (Box 1). Fifteen cases were laboratory-confirmed MDR-TB. One case was defined as probable MDR-TB on the basis of a clinical syndrome consistent with TB (clinical features, neuroimaging and cerebrospinal fluid examination suggestive of tuberculous meningitis) and a previous isolate of laboratory-confirmed MDR-TB from the same patient.

Patients with MDR-TB were predominantly female (12/16), with a median age of 26 years (range, 8–58 years). Most patients (15/16) were born outside Australia (East Asia and Pacific, 8; sub-Saharan Africa, 4; South Asia, 2; Middle East and North Africa, 1). Refugees with humanitarian visas and asylum seekers in Australian detention centres each accounted for two MDR-TB cases.

Rates of TB risk factors were similar between cases and controls, although patients with MDR-TB were more likely to have been previously treated for TB with a regimen containing rifampicin and isoniazid (Box 2). However, most patients with MDR-TB had never been exposed to antituberculous therapy.

Pulmonary disease was most common (11/16), with positive sputum smear microscopy results noted in about half of pulmonary cases (Box 3). Extrapulmonary manifestations included tuberculous meningitis, genitourinary TB, lymphadenitis and pleural TB. Of the patients who received effective therapy, those with MDR-TB were more likely to experience delays of 1 week or more from specimen collection to commencement of treatment (11/13 [85%] v 14/48 [29%]; P < 0.001).

Of the 15 laboratory-confirmed cases, 13 demonstrated high-level resistance to isoniazid at 0.4 μg/mL. Resistance to ethambutol and pyrazinamide was common. No XDR-TB cases were identified, although resistance to second-line agents including ciprofloxacin or ofloxacin and amikacin was occasionally seen (Box 3).

Hospitalisation was more common for patients with MDR-TB than controls and, for those who completed therapy, their mean duration of treatment was more than twice as long (Box 4). Targeted second-line antituberculous drugs, individualised on the basis of DST, were used in 13 MDR-TB cases. All regimens included moxifloxacin and an injectable agent for at least part of the treatment course; moxifloxacin was ceased in one case shown to be quinolone-resistant.

Adverse effects were more commonly reported in patients with MDR-TB and necessitated modification of therapy in five patients (Box 4). Symptoms reported in patients with MDR-TB but not in those treated for drug-susceptible TB included vestibular toxicity and hearing impairment secondary to injectable aminoglycosides, and neuropsychiatric problems that were attributed to MDR-TB drugs in seven patients (Box 4).

One paediatric patient with laboratory-confirmed pulmonary MDR-TB was treated with isoniazid, rifampicin and pyrazinamide for 12 months, with apparent initial success but subsequent relapse (culture-negative meningitis) 2 years later, which was successfully treated with second-line agents for 24 months. No other treatment failures or deaths occurred in either group, although treatment was ongoing in four MDR-TB patients and three controls at the end of the study period. Three MDR-TB patients and seven controls were transferred out before completion of therapy (Box 4).

Screening for TB infection was carried out for 727 contacts of patients with MDR-TB (median, 6; range, 0–625) and 371 contacts of controls (median, 3; range, 0–222). No secondary cases of active MDR-TB disease were identified.

Discussion

MDR-TB remains uncommon in WA, though the challenges associated with managing it are increasingly recognised. We found that, despite an association with previous TB treatment, most cases occurred through primary transmission. Most patients with MDR-TB diagnosed in WA were born in one of the 27 high MDR-TB burden countries.1

Delayed diagnosis, which has an impact on timely provision of effective therapy and increases the risk of local transmission of MDR-TB strains, is a significant concern.13 Traditional methods for TB culture and DST take several weeks to produce results, contributing to delays. Nucleic acid amplification tests (NAATs), such as the World Health Organization-endorsed Xpert MTB/RIF assay (Cepheid), can rapidly detect TB and the rpoB gene mutation that confers rifampicin resistance.16 We have not reported information about the use of NAATs in this study, as they were only introduced into routine methods in 2011. Caution is warranted in the interpretation of rapid tests for rifampicin resistance due to low positive predictive value when the pretest probability of rifampicin resistance is low.16 Nonetheless, in patients at higher risk of MDR-TB (those with previous TB treatment, a household MDR-TB contact or residence in a high MDR-TB burden country), the use of a rapid NAAT to detect rifampicin resistance may hasten diagnosis. If conducted routinely in a low-prevalence setting, NAAT results should be interpreted cautiously and should be in addition to formal DST.

As is appropriate in a setting with ready access to DST, patients with MDR-TB in WA were managed with individualised drug regimens. Later-generation fluoroquinolones, such as moxifloxacin, are the most potent bactericidal drugs available for the treatment of MDR-TB. Their use has been associated with increased chance of treatment success.17 Moxifloxacin was administered to all 13 MDR-TB patients treated with second-line drugs in this study. Studies have demonstrated improved outcomes with regimens including at least 18 months of active therapy, and the WHO recommends a minimum treatment duration of 20 months for MDR-TB.1820 Research continues into the possibility of effective shorter-course regimens as brief as 9 months.21 All nine patients in this study who completed an MDR-TB targeted regimen received at least 18 months of active therapy. Pending further research, this conservative approach should be the preferred option in clinical settings where MDR-TB is treated.1,18

Adverse drug reactions more commonly complicate the treatment of MDR-TB than drug-susceptible TB. Close clinical and laboratory follow-up is obligatory for all patients with MDR-TB, and directly observed therapy should be considered where possible. Drugs that are often poorly tolerated, such as prothionamide, cycloserine and para-aminosalicylic acid (PAS), may be initiated gradually.8 Patients receiving aminoglycoside therapy should undergo regular screening for ototoxicity. Cessation of problematic drugs may be unavoidable, as was the case for one patient in WA who experienced severe psychiatric symptoms with unmasking of post-traumatic stress disorder after commencing cycloserine. Unfortunately, alternative options for treatment may be limited.

The complexity and length of MDR-TB treatment necessitates significant health care resource use, placing increased demands on outpatient and inpatient services. Specialist TB services play an important role in the effective management of TB and are crucial for accurate diagnosis and adequate management of protracted MDR-TB treatment regimens and their associated toxicities.

Given the clinical and public health implications of MDR-TB, prevention should be a priority. Prevention of acquired resistance is achieved by ensuring early diagnosis and effective treatment of all TB cases. Prevention of MDR-TB transmission requires early diagnosis, effective treatment and appropriate infection control measures. About a third of patients with MDR-TB in this series were infectious at the time of diagnosis on the basis of positive sputum smear microscopy results. Contact tracing after a new diagnosis of MDR-TB is recognised as an important measure in identifying further cases. This has significant workforce implications. Guidance on management of MDR-TB contacts found to have latent TB infection is currently limited.3,4,11

Our study has several limitations. Comparison of clinical and diagnostic information was affected by inconsistency in diagnostic approach and the use of matched controls. The ability of the study to detect a difference in outcomes was affected by the small numbers analysed. A quarter of patients with MDR-TB were still receiving treatment at the time of data collection. Of the remaining patients, 75% successfully completed treatment, compared with 84% of patients with drug-susceptible TB. In both groups, patients who did not achieve treatment success were transferred out before completion of therapy. While some patients transferred of their own volition, several patients with drug-susceptible TB and one with MDR-TB were deported on the basis of rejected asylum claims. In contrast, consensus recommendations urge that:

All patients with TB who present to health care services within Australia’s borders should have free and equal access to TB care from diagnosis to completion of treatment, irrespective of their legal status or other demographic characteristics …22

In conclusion, MDR-TB is uncommon in WA and is usually associated with treatment success, despite delays to effective therapy and frequent therapeutic changes due to adverse effects. Early diagnosis of MDR-TB is important for both individual patient care and to reduce the risk of transmission. Long treatment courses are associated with increased health service use. Further research into optimal treatment regimens is required. Specialist TB services are heavily relied on for prevention and management of MDR-TB and should be strengthened to effectively control TB and limit the emergence of MDR-TB in Australia and the surrounding region.

1 Multidrug-resistant tuberculosis (MDR-TB) cases and total TB notifications in Western Australia, 1998–2012

2 Risk factors in patients with multidrug-resistant tuberculosis (MDR-TB) and matched controls with drug-susceptible TB in Western Australia, 1998–2012

Risk factor

MDR-TB (n = 16)

Susceptible TB (n = 48)

P


Born in a high-prevalence country*

15 (94%)

39 (81%)

0.11

Resident > 3 months in a high-prevalence country*

16 (100%)

41 (85%)

0.02

Born in a high MDR-TB burden country

10 (63%)

21 (44%)

0.07

Previous TB diagnosis treated with first-line TB drugs

4 (25%)

1 (2%)

0.006

Previous treatment with isoniazid monotherapy

0

2 (4%)

0.48

Household TB contact

6 (38%)

17 (35%)

1.0

Household MDR-TB contact

1 (6%)

0

0.25

HIV

1 (6%)

Matched


* Country with TB prevalence > 50 per 100 000 population. One of 27 high MDR-TB burden countries that account for 85% of estimated MDR-TB cases globally.1

3 Diagnostic details for patients with multidrug-resistant tuberculosis (MDR-TB) and matched controls with drug-susceptible TB in Western Australia, 1998–2012

Diagnostic detail

MDR-TB (n = 16)

Susceptible TB (n = 48)

P


Pulmonary TB

11 (69%)

Matched

Extrapulmonary TB

5 (31%)

Matched

Central nervous system

1 (6%)

Genitourinary

1 (6%)

Lymph node

2 (13%)

Pleural

1 (6%)

Sputum smear microscopy positive for acid-fast bacilli

5 (31%)

18 (38%)

TB culture positive

15 (94%)

37 (77%)

Drug resistance

Isoniazid

15/15 (100%)

2/37 (5%)

Rifampicin

15/15 (100%)

0

Ethambutol

7/15 (47%)

0

Pyrazinamide

5/15 (33%)

1/37 (3%)

Streptomycin

10/15 (67%)

4/37 (11%)

Amikacin

1/15 (7%)

Not tested

Capreomycin

1/15 (7%)

Not tested

Ciprofloxacin or ofloxacin

2/15 (13%)

Not tested

Ethionamide

3/15 (20%)

Not tested

How case was identified

Contact tracing

1 (6%)

1 (2%)

Routine screening

5 (31%)

19 (40%)

Symptomatic presentation

10 (63%)

28 (58%)

Time to TB notification from arrival in Australia < 1 year

6/15 (40%)

18/45 (40%)

Delay from specimen collection to effective TB treatment < 1 week

2 (13%)

34 (71%)

0.01

Never received effective TB treatment

3 (19%)

0

0.008

Median days of delay for those with ≥ 1-week delay to effective treatment (range)

48 (17–149)

21 (7–84)

0.002

4 Treatment details and outcomes for patients with multidrug-resistant tuberculosis (MDR-TB) and matched controls with drug-susceptible TB in Western Australia, 1998–2012

Treatment detail/outcome

MDR-TB
(n = 16)

Susceptible TB
(n = 48)

P


Hospitalised during treatment

16 (100%)

17 (35%)

< 0.001

Mean total days in hospital (range)

26 (1–99)

13 (2–41)

Directly observed therapy

14 (88%)

6 (13%)

< 0.001

Intravenous access required for treatment

11 (69%)

0

< 0.001

Drugs used in definitive treatment regimen

Isoniazid

1 (6%)

48 (100%)

Rifampicin

1 (6%)

48 (100%)

Ethambutol

7 (44%)

43 (90%)

Pyrazinamide

10 (63%)

48 (100%)

Moxifloxacin

12 (75%)

2 (4%)

Prothionamide

10 (63%)

1 (2%)

Cycloserine

10 (63%)

0

Amikacin

9 (56%)

0

Capreomycin

2 (13%)

0

Streptomycin

2 (13%)

0

Para-aminosalicylic acid (PAS)

2 (13%)

0

Linezolid

2 (13%)

0

Clofazamine

1 (6%)

0

Adverse effects reported

13 (81%)

16 (33%)

< 0.001

Arthralgia

0

1 (2%)

1.0

Haematological abnormalities

2 (13%)

1 (2%)

0.13

Hearing impairment

4 (25%)

0

0.002

Hypothyroidism

1 (6%)

0

0.25

Injection site complications

3 (19%)

0

0.008

Liver dysfunction

3 (19%)

2 (4%)

0.13

Nausea/vomiting

11 (69%)

5 (10%)

< 0.001

Psychiatric problems

7 (44%)

0

< 0.001

Palpitations

1 (6%)

0

0.25

Paraesthesia

0

1 (2%)

1.0

Rash/itch

2 (13%)

10 (21%)

0.42

Renal dysfunction

1 (6%)

0

0.25

Tinnitus/vertigo

7 (44%)

0

< 0.001

Visual disturbance

1 (6%)

3 (6%)

0.68

Adverse effects requiring therapeutic change

5 (31%)

6 (13%)

0.02

Completion of therapy

Ongoing therapy

4 (25%)

3 (6%)

Transferred out before completion

3 (19%)

7 (15%)

0.72

Completed therapy

9 (56%)

38 (79%)

    Mean total days of treatment (range)

597 (365–724)

229 (174–554)

Treatment outcome

Success*

9/12 (75%)

38/45 (84%)

0.72

Success in accessible cases

9/9 (100%)

38/38 (100%)

Failed

0

0

Died

0

0


* Denominator excludes patients whose therapy was ongoing. Denominator excludes patients whose therapy was ongoing and those who were transferred out before completion of therapy.

Infectious diseases — sometimes out of sight, never out of mind

Created 4 years before the first issue of the MJA, de Trye-Maison’s lithograph (front cover) captures the sense of fear and desperation that infectious disease provoked then and still does today — consider society’s response to HIV/AIDS or the recrudescence of polio in war-torn Syria. As the Australasian Society for Infectious Diseases will soon hold its annual conference, this issue of the Journal includes articles on this theme.

While its remoteness may have spared Australia from northern hemisphere outbreaks of Clostridium difficile infection (CDI), it was inevitable that serious strains would reach our shores. But, as Johnson and Stuart note, our surveillance has paid dividends. Slimings and colleagues report that CDI, once considered mostly hospital-acquired, is becoming more common in the community, a finding similar to overseas trends.

Surveillance and vigilance are essential, although not always successful. Worth and colleagues show that continuous surveillance for Staphylococcus aureus bloodstream infection in Victorian hospitals has been effective, whereas Gunaratnam and colleagues found that screening for pandemic (H1N1) 2009 influenza at Sydney International Airport was not effective in detecting cases.

The association between risky behaviour, such as sharing needles, and bloodborne infections is well established. Reekie and colleagues report encouragingly on new prison entrants participating in the National Prison Entrants’ Bloodborne Virus Survey. Although half the participants reported injecting drug use, there was a very low prevalence of HIV, which may be due to harm minimisation programs such as access to clean needles and methadone. The most prevalent bloodborne virus was hepatitis C, but a third of those testing positive for this were unaware of their infection status.

Weakened human defences open the gate for unpleasant organisms such as Listeria monocytogenes, named after the pioneer of sterile surgery, Joseph Lister.
L. monocytogenes meningitis accounts for 5%–10% of bacterial meningitis and has high mortality, perhaps due to concomitant encephalitis. Its appetite is not confined to those with poor immunity; Otome and colleagues report a case in an immunocompetent person.

We welcome reports of improvements in Indigenous health. Crowe and colleagues, working predominantly in Indigenous communities in the Northern Territory, found a decrease over 11 years in microbiologically confirmed cases of infection with Trichuris trichiura, a soil-transmitted helminth associated with poor living conditions. Deworming campaigns may have led to a reduction in the helminth egg burden. This change, when linked with better living conditions, improved sanitation and less poverty, offers hope.

In Australia, Mycobacterium ulcerans, the causative organism associated with indolent skin ulcers that complicate cuts and scratches among people living in wet conditions, was first seen in Bairnsdale, Victoria. Now, with an expanded evidence base, O’Brien and colleagues update the guidelines for its management, the main change being antibiotics as first-line therapy and a shorter duration of antibiotic treatment.

After initial infection with varicella zoster virus, T cell immunity is boosted by subsequent exposure to chicken pox. However, this natural boost has been lost since 2005, as vaccination has markedly diminished the number of childhood cases. Cunningham and colleagues discuss mechanisms and present recent evidence about the effectiveness of vaccines in preventing shingles in older age groups.

As molecular science progresses, we learn more about the intricate adaptations underpinning antimicrobial resistance. In the Asia–Pacific region, an epidemic of drug-resistant tuberculosis threatens, warn Majumdar and colleagues. They advocate for an international collaboration to bring this problem under control.

Craig Venter, known for his involvement with sequencing the human genome, wrote about molecular biological approaches to preparing for the next influenza pandemic in his recent book, Life at the speed of light. The interplay of biological and informational sciences and computing is opening doors hitherto closed. But the more we learn, and to some extent the more control we gain over infections, the greater our respect for them grows.

Vitamin D and tuberculosis

To the Editor: Any role that vitamin D deficiency plays in increasing the risk of tuberculosis1,2 should not detract from the fact
that infection with the causative organism is the necessary risk factor for disease, and decreasing the risk of infection initially will prevent disease even while factors that increase the risk of progression
to active disease3 are present.

A letter in the Journal in
20132 suggested that vitamin D supplementation may decrease
the incidence of tuberculosis. This was based on the distribution of tuberculosis notifications and vitamin D levels in Australia, and an earlier analysis by the authors of
the effect of latitude on seasonality of tuberculosis in Australia.4

The cross-sectional studies on which the letter was based used grouped national data without adjusting for confounding from other factors associated with the variability of rates of tuberculosis infection across Australia. These include variability in relative proportions of migrants and Indigenous and non-Indigenous Australians and the differing age-related incidence of tuberculosis in these groups; the role of migrant screening programs in different jurisdictions and how this impacts on the stage of disease at diagnosis; and the timing of screening in relation to annual intakes of overseas students. These factors
can variably confound associations with seasons, latitude and age.

There is no denying the need for a holistic approach that incorporates recognising and treating conditions that increase the risk of latent tuberculosis becoming active, and
it is certainly important to tackle vitamin D deficiency in its own
right. However, the major focus
for decreasing the burden of tuberculosis remains the need to be aware of those populations with a disproportionately greater risk of primary tuberculosis infection and
to ensure early diagnosis and management of the disease to prevent transmission initially.

Treatment and prevention of Mycobacterium ulcerans infection (Buruli ulcer) in Australia: guideline update

Buruli ulcer (BU) is a neglected tropical disease that is increasingly common in Australia and has become an important public health issue in rural sub-Saharan Africa in the past 30 years.1 BU is a slowly progressive destructive infection of skin and of adipose and soft tissue caused by Mycobacterium ulcerans, an environmental pathogen that produces a potent toxin.2 It is because of progressive destruction of subcutaneous tissue that the characteristic ulcer becomes widely undermined. BU only occurs in specific endemic areas, particularly coastal Victoria, where the disease is known locally as Bairnsdale ulcer.3 The second major Australian focus is a small region between Mossman and just beyond the Daintree River, north of Cairns, Queensland (Daintree ulcer).4,5 Occasional cases also occur on the Capricorn coast of southern Queensland6 and in the Northern Territory.7 Typically, 0–5 cases per year occur in the Daintree region but, in 2011–2012, there was a major outbreak, with at least 75 cases identified. In Victoria, 157 cases occurred in 2011–2012. Guidelines reflecting contemporary clinical practice in the management of BU in Australia were published in 2007.8 This update provides guidance on the new role of antibiotics as first-line therapy; the shortened duration of antibiotic treatment and the use of all-oral antibiotic regimens; the continued importance, timing and role of surgery; the recognition and management of paradoxical reactions during antibiotic treatment; and updates on the prevention of disease (Box).

Consensus process

An update of the 2007 consensus guidelines was undertaken by selected infectious diseases physicians, plastic surgeons and general practitioners known to have experience with BU. An initial draft document based on new evidence from recent research, randomised trials, case series and increasing clinical experience was prepared by D O’B and P J. This draft document was then circulated to all authors for further consultation and review. The document was then peer reviewed and endorsed by the Australasian Society for Infectious Diseases. The level of evidence throughout this document is level 4/5 (observational case series/expert opinion), except where specific references are cited.

Key points of previous consensus guidelines

Before 2004, the treatment of BU was based on wide surgical excision and repair, as antibiotics were believed to be ineffective. However, there were examples where relapses responded to antibiotic treatment and the risk of relapse after surgery was reduced when antibiotics were combined with surgery.9 Formal experiments using mouse footpad models provided a scientific basis to support this practice, initially emphasising the efficacy of rifampicin combined with streptomycin or amikacin and subsequently demonstrating the efficacy of orally active agents such as moxifloxacin or clarithromycin.1012 The efficacy of rifampicin combined with streptomycin in humans was first established by a small case series of patients with early lesions in Ghana that validated the evidence from the animal models.13

In the first Australian guidelines,8 we recommended surgical excision and primary closure for BU lesions. The growing confidence in antibiotics also led us to recommend adjuvant rifampicin-based antibiotic regimens for all patients who needed grafts or in whom histological examination of resection specimens showed disease at the excision margin. We emphasised that surgical intervention could be more conservative than in the past and that deep structures involved, such as tendons or nerves, should be preserved. For severe disease, we recommended intravenous amikacin in conjunction with rifampicin, in line with the World Health Organization recommendation to use streptomycin with rifampicin. However, amikacin is now rarely used in Australia, due to individual cases of toxicity and excellent outcomes with all-oral regimens.9,1416

In the 2007 guidelines, we also highlighted the speed and accuracy of rapid diagnosis of BU using IS2404 polymerase chain reaction (PCR) testing17 directly from ulcer swabs, and we recommended that this be the initial diagnostic test of choice.8 However, for non-ulcerative or pre-ulcerative lesions (oedematous, plaques or nodules),3 swabs are not appropriate specimens, as they may produce false-negative results with this test, and fine-needle aspiration18 or punch, incisional or excisional biopsy is required to obtain tissue fluid or fresh tissue. Delays in diagnosis are associated with increased morbidity from BU. Once suspected, it is important to confirm the diagnosis within a reasonable time. In this regard, PCR testing is far superior to culture, which may take up to 12 weeks.

New information on the management of BU

Antibiotics

Prospective studies in humans have now shown clearly that treatment with antibiotics alone, without surgery, will lead to healing of BU lesions without recurrence.16,1921 Regimens tested in randomised controlled trials include rifampicin for 8 weeks combined with intramuscular streptomycin for 8 weeks or for 4 weeks followed by clarithromycin for a further 4 weeks.19 A recent observational study of 30 patients in Benin reported equivalent success with an entirely oral therapy of rifampicin plus clarithromycin daily. Fifty per cent of the patients in this study did not require surgery.22 Treatment with oral rifampicin-containing antibiotic regimens alone14,16 or combined with surgery15 has also been used successfully in Australia. Based on this experience, both in Africa and Victoria, Australia, the majority of cases are now managed without surgery.

A combination of two antibiotics is recommended to potentially increase treatment effectiveness and reduce the risk of antibiotic resistance. Current WHO guidelines recommend combining an injectable agent (eg, streptomycin) with oral rifampicin.23 However, published local and overseas observational data confirms that oral rifampicin-based drug combinations are effective and well tolerated1416,22 when combined with a second oral agent such as clarithromycin, moxifloxacin or ciprofloxacin. The use of all-oral regimens avoids aminoglycoside toxicity9 and improves patient acceptance.

We recommend rifampicin-containing combination oral antibiotic therapy for 8 weeks as first-line treatment for most patients with BU. Recommended doses are rifampicin 10 mg/kg per day up to 600 mg daily, plus any of clarithromycin 7.5 mg/kg twice daily (up to 500 mg per dose), moxifloxacin 400 mg once daily (not recommended for children) or ciprofloxacin 500 mg twice daily (not recommended for children).

According to WHO guidelines,23 based on available published evidence, clarithromycin is the preferred oral companion drug to rifampicin. Treatment-outcome data for the use of moxifloxacin is lacking, but available data show high levels of effectiveness in vitro and in mouse models.11,12 The use of ciprofloxacin is based on published in vitro evidence of its activity against M. ulcerans,24,25 and on clinical experience with its use in combination with rifampicin by clinicians from Barwon Health in Victoria.15,16,26 However, its use has not been studied in controlled clinical trials and it is not currently one of the oral drugs recommended by the WHO.23

If rifampicin is contraindicated or not tolerated, we recommend clarithromycin combined with a fluoroquinolone antibiotic, based on data showing effectiveness in mouse models.11 In pregnancy, the combination of rifampicin and clarithromycin is recommended.23

As discussed in the 2007 consensus guidelines,8 the use of antibiotics for the treatment of M. ulcerans is off-label. The usual precautions should be taken whenever new drugs are prescribed, and the full product information should always be consulted. Fluoroquinolones are not generally recommended in prepubertal children, as studies in animal models have demonstrated arthropathy.27 However, there is limited evidence from human studies that short courses of ciprofloxacin may be safe in children.28 Patients should be warned about the small risk of drug-related hepatitis associated with combinations that include rifampicin, and liver function should be monitored periodically. There is a small risk of tendinitis associated with quinolone use, and an alternative agent should be found if tendon stiffness develops during treatment. Because clarithromycin and fluoroquinolones can prolong the cardiac QT interval, this should be monitored by electrocardiograms at baseline and after 2 weeks of treatment, especially if these antibiotics are combined.

Lesions can be associated with significant necrosis, and healing of BU lesions is slow and known to continue for up to 12 months after completion of the recommended 8-week antibiotic regimen if skin defects are large, particularly when the diagnosis of BU has been delayed.19 Patients need to be educated that ulcers are often not healed when antibiotic therapy is ceased. Prolonged wound healing may also lead to significant expense and inconvenience from regular dressings and medical reviews, which can be disabling and may lead to time off work or school, resulting in both patient and health care provider dissatisfaction.

Surgery

While routine extensive curative surgery with wide margins is not required to sterilise infection and is now infrequently recommended, there is still a significant role for surgery in the management of BU.29

Indications for surgery include:

  • Debridement of necrotic tissue consistent with established surgical principles aimed at improving the rate of wound healing and preventing deformity or scarring in lesions with significant skin or soft-tissue necrosis. The extent of such surgery should be as conservative as practicable and, at times, may need to be repeated to remove newly recognised areas of necrosis or liquefied subcutaneous fat.

  • When antibiotics are not tolerated, contraindicated or declined, curative excisional surgery can be attempted without antibiotics, or with a shorter duration of antibiotics in cases of intolerance. The excision should be performed with wide margins through uninvolved tissue. However, there is a risk of disease relapse, either locally or distantly, which is greater if histological margins of the excised specimen include visible bacteria or active inflammation, the patient is immunosuppressed, or the lesion had been present for ≥ 75 days before diagnosis.30

  • In some cases of advanced disease, surgery is required to repair large defects or to hasten the closure of a wound in order to lessen the expense and inconvenience of prolonged dressings, allow a faster return to normal daily activities, and increase patient and health care provider satisfaction with treatment. We recommend that antibiotics be given for at least 4 weeks, and generally for 8 weeks, before definitive repair to arrest disease progression and reduce inflammation. In our experience, this practice reduces the extent of the excision and often allows direct closure, although if an extensive residual skin defect remains, grafting or the use of vascularised tissue flaps may be necessary. The risk of bacteriological relapse is negligible in patients who have completed 8 weeks of antibiotics.15

  • Patients with small early lesions may elect to be managed with wide curative excision and direct closure, to avoid prolonged daily antibiotic treatment and to achieve more rapid wound closure.

  • Delayed scar revision may be useful to reduce deformity and morbidity from BU disease.

Paradoxical reactions

About one in five patients treated with antibiotics develop worsening of the appearance of their BU lesion due to the development of a paradoxical reaction, also known as an immune reconstitution inflammatory reaction.31,32 Clinically, this presents as a deterioration in the clinical appearance of the lesion after initial improvement, with increasing induration, pain, wound discharge and occasionally new ulceration. New lesions may also appear during or after the completion of antibiotic treatment, either locally or on a distant body site.32,33 This syndrome is often thought by clinicians to be caused by antibiotic failure and may trigger unnecessary surgical intervention or change in the antibiotic regimen. Histopathology of tissue excised from these reactions reveals an intense immune reaction, often with multinucleated giant cells, with few or sparse acid-fast bacilli visible.34 The mycobacteria in the lesions appear to be non-viable and thus mycobacterial cultures are usually negative, but PCR and acid-fast bacilli staining will remain positive in the majority of cases (59% and 88% of cases, respectively).32 The pathogenesis of paradoxical reactions is thought to be explained by the reversal of intense local immunosuppression mediated by mycolactone, a potent necrotising and immunosuppressive toxin produced by viable M. ulcerans cells that is responsible for most of the clinical manifestations of BU.2 This leads to the development of an intense immunological reaction presumably against persisting dead or viable mycobacteria. Risk factors associated with paradoxical reactions in Australian patients include oedematous BU lesions, patient’s age ≥ 60 years and the use of amikacin in the initial antibiotic regimen.32

Initial management of clinically suspected paradoxical reactions is to exclude antibiotic failure, usually due to poor adherence which should be corrected if suboptimal. Antibiotic failure can be distinguished by histopathological examination of a tissue biopsy specimen, which will show features typical of untreated BU compared with the intense local inflammation in the case of a paradoxical reaction.34 However, true antibiotic failure during treatment in adherent patients is very rare in our experience. If a paradoxical reaction is considered likely, the antibiotic regimen should be continued at the same dose and duration as for mild to moderate reactions.32 For severe and destructive paradoxical reactions, we recommend oral prednisolone 0.5–1.0 mg/kg daily tapered over 4–8 weeks, and in these cases antibiotics may be extended to 12 weeks’ total duration.35,36 Fluctuant lesions may require aspiration or drainage, and some severe reactions may need to be managed with limited surgical debridement.32

Heat therapy

There are several unpublished anecdotal reports of success with heat therapy which was employed before the effectiveness of antibiotics was recognised. The scientific basis for the use of heat is optimal in vitro growth of M. ulcerans at 28–32ºC and no growth at higher temperatures. Various devices have been used including servo-controlled electric heating coils and hot-air delivery systems similar to those used to reheat patients after prolonged anaesthesia. A German group working in Cameroon has reported success using heat alone in selected cases that was delivered by low-cost and less cumbersome sodium acetate trihydrate heat blocks.37 A larger prospective cohort study to validate this observation is currently underway. Adjuvant heat therapy could be considered in extensive lesions where antibiotics are not tolerated or contraindicated, and curative surgery by excision and primary closure is unlikely to produce an optimal outcome for the patient or is not possible. Data on the necessary timing and duration of heat therapy is being obtained from an observational study in Cameroon, but 4–6 hours per day for 4–8 weeks is currently recommended by Australian clinicians.

Transmission and prevention

Despite considerable efforts in Australia and elsewhere, the environmental reservoir and mode of transmission of M. ulcerans remain obscure, making it difficult to recommend prevention strategies. However, the geographically restricted epidemiology of M. ulcerans transmission is highly characteristic of BU. Risk is negligible outside endemic areas. There is no evidence that direct person-to-person transmission is an important source of new cases. In Victoria, but not elsewhere so far, there is evidence that mosquitoes and possibly other biting insects may transmit the infection.3840 There is also new evidence that BU in Victoria may be a zoonosis transmitted from possums to humans by mosquitoes.41 Case–control studies performed in Victoria and Africa, respectively, have shown reduced risk in patients who reported regular use of insect repellent39 or bed nets for sleeping.42,43 Contact with contaminated soil may also play a role. Hence, during outbreaks in Australia, use of protective clothing, avoidance of biting insects, use of insect repellents, cleaning of skin or wounds after soil exposure, and mosquito control are logical preventive strategies that should be considered by individuals and public health authorities.

Key points and recommendations for the diagnosis, treatment and prevention of Mycobacterium ulcerans infection (Buruli ulcer) in Australia

Diagnosis

  • Diagnosis should be confirmed via nucleic acid detection by polymerase chain reaction.

  • For non-ulcerative lesions (oedematous, plaques or nodules), swab specimens may produce false-negative results, and fine-needle aspirate or biopsy is required to obtain tissue fluid or fresh tissue for diagnosis.

Use of antibiotics

  • Recommended for most lesions unless contraindicated, not tolerated or declined by the patient.

  • The recommended antibiotic therapy is oral rifampicin combined with either clarithromycin or a fluoroquinolone (moxifloxacin or ciprofloxacin) as a second oral agent.

  • Antibiotics should be administered for 8 weeks, unless the lesion involves deeper structures (eg, bone or joint) or is associated with prednisolone therapy for a severe paradoxical reaction, when it may be prolonged up to 12 weeks.

  • Antibiotics should be administered for a minimum of 4 weeks before surgery aimed at definitive wound closure.

  • Paradoxical reactions occur in up to 20% of patients and do not represent failure of antibiotic treatment.

  • Severe paradoxical reactions may cause significant tissue necrosis, which may be managed with oral corticosteroids (prednisolone 0.5–1.0 mg/kg daily, tapered over 4–8 weeks).

Role of surgery

  • As microbiological and clinical cure is achieved with antibiotic treatment, surgery is not required for cure in addition to antibiotics.

  • Surgery alone is an acceptable and effective alternative if:

    • antibiotics are declined, contraindicated or not tolerated; or

    • patient preference is for wide excision and direct closure of small lesions without antibiotics.

Note that there is a risk of relapse when surgery is performed without adjuvant antibiotics. The likelihood of relapse varies with patient characteristics, the lesion site and whether the margins of excision are clear.

  • In lesions with significant skin or soft-tissue necrosis, conservative surgical debridement is indicated in combination with antibiotics to remove necrotic tissue and prepare the area for skin grafting or flap closure.

  • Surgery may be required to repair large defects or to hasten the closure of a wound.

Prevention

  • During outbreaks, people living in endemic areas are likely to reduce their risk of exposure by wearing protective clothing, avoiding biting insects, washing areas of skin or wounds exposed to soil and using insect repellents.

  • In endemic areas in south-eastern Victoria, where there is evidence supporting mosquito transmission, local authorities should consider enhanced mosquito-control strategies.

Increasing incidence of Clostridium difficile infection, Australia, 2011–2012

Global rates of hospital-associated Clostridium difficile infection (HA-CDI) have increased dramatically over the past 10 years. The emergence of fluoroquinolone-resistant C. difficile polymerase chain reaction (PCR) ribotype (RT) 027 in North America in 2003 and in Europe in 2005 has been associated with increased morbidity and mortality.1,2 The appearance of RT027 in Australia was delayed, with the first reported case occurring in Western Australia in 2009 in a patient who apparently acquired the infection overseas.3 The first case of locally acquired infection did not occur until 2010 in Melbourne, Victoria.4 The reasons for this delay are unclear but could be due to Australia’s geography, which may impede the introduction of new strains into the country, and slow their spread due to the distances between major cities.5 Also, Australia’s conservative policies on fluoroquinolone use in humans and animals6 may have offered some protection.

Rates of community-associated CDI (CA-CDI) are also increasing worldwide.7,8 Patients with CA-CDI tend to be younger, less likely to have been exposed to antibiotics (although antibiotic exposure is still a major risk factor) and have fewer comorbidities than patients with HA-CDI.7

A recommendation from the Australian Commission on Safety and Quality in Health Care (ACSQHC) for hospital surveillance programs in all Australian states and territories to monitor C. difficile was approved by Australian health ministers in November 2008. In 2009, a surveillance definition was endorsed, and by 2011, all states and territories had acted on this recommendation. By late 2011, some states reported a substantial increase in the incidence of CDI,9,10 and reports from Tasmania9 and Victoria11 indicated that about 30%–40% of cases were CA-CDI. There has been no collation or analysis of surveillance data at a national level. Our aim was to collate results for the first 2 years of surveillance in all Australian states and territories, and to evaluate temporal trends for these data.

Methods

Each jurisdiction provided surveillance data, using the national definition of CDI and method for calculation of rates, from 1 January 2011 to 31 December 2012.12 Ethics approval was not required for the study because we collated and analysed aggregate-level data (not individual records).

Outcome measures

The primary outcome was hospital-identified CDI (HI-CDI), defined as CDI diagnosed in a patient attending any area of an acute public hospital (ie, patients admitted to inpatient wards or units, including psychiatry, rehabilitation and aged care, and those attending emergency and outpatient departments). This reflects the burden of CDI on a hospital and includes both HA-CDI and CA-CDI, as well as infections of indeterminate or unknown origin.

A CDI case was defined as a patient having diarrhoea (an unformed stool taking the shape of the container), and the stool sample yielded a positive result in a laboratory assay for C. difficile toxin A and/or B, or a toxin-producing strain of C. difficile was detected in the stool sample by culture or PCR. Cases were only included once in an 8-week period, and patients < 2 years old at the date of collection were excluded.

As some jurisdictions undertook enhanced surveillance, HA-CDI and CA-CDI were included as secondary outcomes, with each CDI case classified according to the place of probable exposure, as follows:13

  • HA-CDI: diagnosis of CDI made > 48 h after admission to a hospital, or < 48 h after admission to a hospital but < 4 weeks after the last discharge from a hospital.

  • CA-CDI: symptom onset in the community or < 48 h after admission to a hospital provided that symptom onset occurred > 12 weeks after last discharge from a hospital.

  • Indeterminate/unknown: patient with CDI who does not fit any of the above criteria for exposure setting (eg, onset 4–12 weeks after last discharge from hospital) or exposure cannot be determined because of lack of data.

Study sample

Data on HI-CDI were provided from 450 public hospitals in New South Wales, Queensland, South Australia, Tasmania, Victoria, Western Australia and the Australian Capital Territory, covering 92% of all patient-days in Australian acute public hospitals.14 No data were received from the Northern Territory. All participating jurisdictions used the national definition of HI-CDI, but there were variations in the denominator used to calculate rates. Qld, SA and Tas used patient-days (number of days of patients’ hospitalisation during a specified period), while the remainder used occupied bed-days (total daily numbers of occupied beds during a specified period). The yearly variance between these two measures is estimated to be < 1%, and we use the term patient-days (PD) in this study.15 In addition, all contributors except WA excluded patients < 2 years old from denominator data.

As not all hospitals in each jurisdiction undertook enhanced surveillance of CDI cases, we analysed three study samples: (i) data from all participating jurisdictions were used to analyse overall HI-CDI rates; (ii) data from the ACT, SA, Tas, Vic and WA allowed classification into HA-CDI and non-HA-CDI (ie, CA-CDI, indeterminate and unknown cases); (iii) data from Tas, Vic and WA allowed classification into HA-CDI and CA-CDI. WA obtained enhanced surveillance data from metropolitan public hospitals (accounting for 92% of all CDI cases in WA), but not rural public hospitals.

There were some differences in the definition of HA-CDI used. Tas, Vic and WA classified HA-CDI according to the national definition, whereas the ACT and SA defined it as cases where specimen collection occurred > 48 h after admission.

Statistical analysis

We used Stata version 12.1 (StataCorp) for statistical analysis. The incidence of CDI per 10 000 PD was calculated as: CDI cases/number of PD × 10 000; 95% confidence intervals were calculated for Poisson distributed counts. Overall and quarterly incidence rates were calculated for HI-CDI, with stratification according to source of exposure (HA-CDI, non-HA-CDI and CA-CDI). Poisson regression models were used to estimate percentage changes in incidence rates and 95% CIs; temporal trends and seasonal effects were tested using a Poisson regression model including a piecewise linear spline with four change points identified from the temporal pattern of HI-CDI across all jurisdictions. Overdispersion was assessed by examining the deviance statistic of the Poisson model and also the log likelihood test of a negative binomial model compared with a Poisson model. Serial autocorrelation was assessed by inspection of the model residuals over time. There was no evidence of overdispersion or autocorrelation, and Poisson models were selected.

Results

All hospital-identified CDI

A total of 12 683 HI-CDI cases were identified during the study period, giving an aggregate incidence of 3.65/10 000 PD (95% CI, 3.58–3.71). The incidence varied from 2.10/10 000 PD in Qld to 6.60/10 000 PD in the ACT (Box 1).

The annual incidence rose by 24%, from 3.25/10 000 PD during 2011 to 4.03/10 000 PD during 2012, with a peak of 4.49/10 000 PD in October–December 2011 (Box 2). The incidence plateaued in January–March 2012 and then declined to 3.76/10 000 PD by July–September, after which the rate rose again to 4.09/10 000 PD in October–December 2012. The pattern for each state was broadly similar.

The two subgroups of jurisdictions with enhanced surveillance data had marginally higher HI-CDI rates than the aggregate rate from all contributing hospitals: 4.26/10 000 PD for the ACT, SA, Tas, Vic and WA; and 4.00/10 000 PD for Tas, Vic and WA.

Hospital-associated CDI

Based on enhanced surveillance data from the ACT, SA, Tas, Vic and WA, 67% of HI-CDI (4446/6632) was identified as HA-CDI. The aggregate incidence of HA-CDI during the study period was 2.95/10 000 PD (95% CI, 2.86–3.04), about double the rate of non-HA-CDI (1.45/10 000 PD; 95% CI, 1.39–1.51) (Box 1).

The annual incidences of HA-CDI and non-HA-CDI rose by 18% and 30%, respectively, between 2011 and 2012, with both rates peaking in January–March 2012 (Box 3).

Community-associated CDI

Based on enhanced surveillance data from Tas, Vic and WA, 26% of HI-CDI cases (1320/5109) were confirmed as CA-CDI (with 70% HA-CDI and 4% unknown). CA-CDI comprised 88% (1320/1501) of all non-HA-CDI cases.

The aggregate incidence of CA-CDI during the study period was 1.08/10 000 PD (95% CI, 1.02–1.13) (Box 1), rising by 24% between 2011 and 2012 (Box 3). Rates of CA-CDI doubled during 2011, declined slightly in mid 2012 and rose again by late 2012.

Piecewise Poisson regression analysis

Box 4 plots the observed and predicted incidence for all HI-CDI (A), HA-CDI (B) and CA-CDI (C), with the corresponding percentage changes in incidence rates shown in Box 5. The data show that the incidence increased throughout 2011, particularly in the second half of the year, then declined in early 2012 before rising again in late 2012. The trends were similar for HA-CDI and CA-CDI, except that HA-CDI increased steadily throughout 2011, whereas the increase in CA-CDI occurred towards the end of the year. The late-year spring peak was repeated in 2012, albeit at a smaller magnitude than in 2011 for CA-CDI cases.

Discussion

A standardised approach to the case definitions used for surveillance of HI-CDI was implemented by most Australian states and territories during 2010. Although we found differences in incidence rates between Australian jurisdictions, our analyses confirm that rates of HI-CDI increased Australia-wide during 2011 and remained high during 2012.

The incidence of CDI has increased in many industrialised countries in the past two decades.5 Since 2003, the escalation in rates of CDI in North America correlated with the emergence of a new C. difficile strain (RT027) that had higher than usual production of toxins A and B, possessed a third toxin (binary toxin) and was fluoroquinolone-resistant. Rates of CA-CDI are also increasing worldwide, estimated to comprise more than a third of all CDI cases in North America7 and Europe.8

Our findings are consistent with the overseas data, in that CA-CDI cases comprised 26% of all HI-CDI cases in Australia, and rates have substantially increased since 2011. Expansion of surveillance activities to incorporate C. difficile strain typing would give greater insight into the epidemiology of CDI in Australia, particularly in light of recent data from the United Kingdom showing that there is less inhospital transmission of CDI than previously thought.16

There are several potential explanations for the regional and temporal patterns we observed. Ascertainment bias due to increased case finding (eg, through greater awareness, improved surveillance and increased laboratory testing) cannot be ruled out, as the ACSQHC recommendations for hospital surveillance programs were implemented by the beginning of 2011, and the patterns may reflect differing adoption strategies across regions and over time. Changes in laboratory methods may also be a factor. Although many laboratories in Australia have now moved away from using insensitive enzyme immunoassays, this has occurred at different times, and methods still differ between areas.17 For example, WA used PCR for the entire study period; Qld, Tas and Vic used direct cytotoxin or toxigenic culture; and SA switched to PCR during 2012. Recent data from the United States demonstrate at least a 30% increase in the incidence of CDI attributable to adoption of more sensitive nucleic acid amplification tests.18 Implementation of more sensitive tests in Australia may have contributed to the observed overall increasing temporal trend, but it is less likely to explain the observed peaks at the end of each year (southern hemisphere spring–summer). Seasonality in HI-CDI has previously been described in Canada19 and Germany,20 and such peaks could be due to seasonal changes in risk factors for CDI, such as antibiotic prescription for respiratory tract infections during winter.19 Further investigation of the observed trends is necessary, and a longer period of data collection is required to substantiate a true seasonal effect in Australia.

The major strength of our study is the use of a standardised definition of HI-CDI across Australia, which, along with the establishment of surveillance systems for HI-CDI in each state and territory according to ACSQHC guidelines, enabled a study of national CDI rates. National CDI surveillance is predicated on a laboratory-based system and includes validation processes. Nevertheless, several limitations exist.

First, although a standardised definition of HI-CDI was used by all surveillance programs included in the analysis, and good coverage of hospital admissions was achieved for CDI surveillance (92% of all patient-days in Australian acute public hospitals), not all participating hospitals undertook enhanced surveillance for different CDI classifications, restricting the analyses that could be performed. Rates of CA-CDI were based on subgroup analyses of data from three states and may not be representative of Australia as a whole. However, the overall HI-CDI rate and the proportion of HA-CDI from this subgroup were similar to those from the fuller dataset and there is therefore no reason to suspect that CA-CDI rates are not nationally representative. There was also some variation in the definition of HA-CDI, although surveillance programs across Australia are increasingly adopting the recommended definition.

A second important limitation lies with the differences in the types of hospitals included. However, this limitation is reduced by restricting the analyses to public hospitals and using number of patient-days to calculate rates. Nevertheless, as the rates reported here do not take into account the different casemix of hospitals in each state or territory, comparison of rates between states and territories should be interpreted with caution. The study analysed aggregate rather than individual-level data, therefore important confounders (eg, comorbidity) that are not reported to the surveillance programs could also not be taken into account. Further, there was variation in the denominator data, with some jurisdictions using patient-days and others using occupied bed-days. However, the yearly variance between these was estimated to be less than 1%, although the monthly variance can be greater, particularly in small hospitals.15 In addition, all contributors except WA excluded patients aged < 2 years from the denominator. However, the 0–4-years age group accounts for less than 4% of hospital separations of all types in Australia, and inclusion of < 2-year-olds in the denominator is unlikely to substantially affect the results or alter the conclusions of this study.14

Despite these limitations, this is the first analysis of national CDI surveillance data and presents the best currently available snapshot of the burden of disease in Australia. The findings demonstrate a significant rise in both HA-CDI and CA-CDI cases identified through hospital surveillance in Australia since 2011. Further analysis of trends over time will aid understanding of the possible seasonality of CDI in Australia. In addition to enhancing coverage by existing surveillance strategies, studies are required to better characterise the epidemiology of CDI in Australia and to identify sources of CDI in the community.

1 Incidence of hospital-identified Clostridium difficile infection (HI-CDI) in Australia, January 2011 – December 2012, by state
or territory

Rate per 10 000 patient-days (95% CI)*


State or territory

Number of HI-CDI cases

Number of patient-days

All HI-CDI

Hospital-
associated CDI

Non-hospital-
associated CDI

Community-
associated CDI


Australian Capital Territory

307

465 270

6.60 (5.88–7.38)

5.24 (4.61–5.95)

1.35 (1.04–1.73)

na

New South Wales

4 674

13 261 612

3.52 (3.42–3.63)

na

na

na

Queensland

1 250

5 939 178

2.10 (1.99–2.22)

na

na

na

South Australia

1 216

2 344 137

5.19 (4.90–5.49)

2.53 (2.33–2.75)

2.65 (2.45–2.87)

na

Tasmania

357

601 534

5.93 (5.34–6.58)

3.36 (2.91–3.85)

2.58 (2.19–3.02)

1.53 (1.23–1.88)

Victoria

3 411

9 009 788

3.79 (3.66–3.92)

2.83 (2.72–2.94)

0.95 (0.89–1.02)

0.93 (0.86–0.99)

Western Australia

1 468

3 164 804

4.64 (4.40–4.88)

3.21 (3.00–3.44)

1.83 (1.67–2.00)

1.48 (1.34–1.63)

All states/territories

12 683

34 786 323

3.65 (3.58–3.71)

na

na

na

ACT, SA, Tas, Vic, WA

6759

15 585 533

4.26 (4.15–4.36)

2.95 (2.86–3.04)

1.45 (1.39–1.51)

na

Tas, Vic, WA

5236

12 776 126

4.00 (3.89–4.11)

2.94 (2.85–3.04)

1.22 (1.16–1.29)

1.08 (1.02–1.13)


na = not applicable. * As WA obtained enhanced surveillance data from metropolitan public hospitals only, rates for hospital-associated CDI,
non-hospital-associated CDI and community-associated CDI are based on data for 6632 HI-CDI cases and 15 080 652 patient-days in the ACT, SA, Tas,
Vic and WA; and for 5109 HI-CDI cases and 12 271 245 patient-days in Tas, Vic and WA.

2 Incidence of hospital-identified Clostridium difficile infection in Australia over time, by state or territory

Tas = Tasmania. ACT = Australian Capital Territory. SA = South Australia. Vic = Victoria. WA = Western Australia. NSW = New South Wales.
Qld = Queensland.

3 Incidence of hospital-identified Clostridium difficile infection (HI-CDI) in Australia, 2011–2012, by quarter

Rate per 10 000 patient-days (95% CI)


Year and quarter

Hospital-
associated CDI*

Non-hospital-
associated CDI*

Community-
associated CDI


2011

January–March

1.89 (1.69–2.10)

1.03 (0.89–1.19)

0.74 (0.61–0.90)

April–June

2.35 (2.14–2.58)

0.94 (0.81–1.09)

0.68 (0.56–0.82)

July–September

2.88 (2.64–3.13)

1.27 (1.11–1.44)

0.96 (0.81–1.12)

October–December

3.65 (3.38–3.94)

1.78 (1.60–1.99)

1.43 (1.25–1.64)

Total

2.70 (2.58–2.82)

1.26 (1.18–1.34)

0.96 (0.88–1.04)

2012

January–March

3.69 (3.41–3.98)

1.83 (1.64–2.03)

1.28 (1.11–1.48)

April–June

3.15 (2.90–3.41)

1.47 (1.30–1.66)

1.10 (0.94–1.28)

July–September

2.68 (2.45–2.92)

1.58 (1.40–1.76)

1.13 (0.97–1.30)

October–December

3.30 (3.05–3.57)

1.69 (1.51–1.89)

1.27 (1.10–1.46)

Total

3.19 (3.07–3.33)

1.64 (1.55–1.73)

1.19 (1.11–1.28)


* Aggregate rates calculated from Australian Capital Territory, South Australia, Tasmania, Victoria and Western Australia. Aggregate rates calculated from Tas, Vic and WA.

4 Predicted incidence of hospital-identified Clostridium difficile infection (HI-CDI) in Australia, 2011–2012*

PD = patient-days. * Bold lines represent predicted incidence per 10 000 PD; dotted lines represent lower and upper 95% confidence limits; vertical grey lines represent the linear splines giving rise to five time periods; data points represent the observed incidence. Rates calculated from Australian Capital Territory, South Australia, Tasmania, Victoria and Western Australia. Rates calculated from Tas, Vic and WA.

5 Mean percentage changes (95% CI) in incidence rates of hospital-identified Clostridium difficile infection (HI-CDI) in Australia per quarter, for specific time periods*

Period

All HI-CDI

Hospital-associated
CDI

Community-associated
CDI


Jan–Mar 2011 to Apr–Jun 2011

12% (3%, 22%)

27% (9%, 47%)

10% ( 30%, 16%)

Apr–Jun 2011 to Oct–Dec 2011

29% (25%, 34%)

25% (17%, 33%)

46% (30%, 63%)

Oct–Dec 2011 to Jan–Mar 2012

2% ( 7%, 4%)

4% ( 14%, 7%)

12% ( 27%, 5%)

Jan–Mar 2012 to Jul–Sep 2012

8% ( 11%, 5%)

16% ( 21%, 10%)

6% ( 16%, 4%)

Jul–Sep 2012 to Oct–Dec 2012

11% (4%, 19%)

23% (9%, 39%)

17% (4%, 41%)


* Time periods represent four important change points in the temporal trend of CDI identified by Poisson regression models with linear splines. The percentage changes in incidence therefore represent the average change per quarter specific to each of the five time periods. Rates calculated from Australian Capital Territory, South Australia, Tasmania, Victoria and Western Australia. Rates calculated from Tas, Vic and WA.

Decreasing prevalence of Trichuris trichiura (whipworm) in the Northern Territory from 2002 to 2012

Trichuris trichiura (whipworm) is a soil-transmitted helminth (STH) endemic to areas with a tropical climate. Infection occurs after the soil-residing egg of T. trichiura is ingested.1 Eggs are expelled in the faeces of infected hosts and continue this cycle after a period of maturation in the soil.1 An estimated 600–800 million people are infected with T. trichiura worldwide and this infection is estimated to cause the loss of 1.6–6.4 million disability-adjusted life-years.1,2 T. trichiura is the most prevalent helminth in many countries surveyed.35 Heavy infections (> 10 000 eggs per gram of faeces) are associated with anaemia, malnutrition, the trichuris dysentery syndrome and rectal prolapse.68

The Northern Territory has a population of about 232 000 in a geographic area of 1 200 000 km2.9 Thirty per cent of the population is Indigenous and 80% of Indigenous residents live in remote locations.9 T. trichiura is one of three STHs that are endemic in the NT; the other two are Ancylostoma duodenale (hookworm) and Strongyloides stercoralis. A 1997 prevalence study found T. trichiura to be the commonest STH, with 25% of adults in a remote Indigenous community infected;10 no data on T. trichiura in the NT have been reported since. T. trichiura infection is difficult to treat and even more difficult to target within a deworming program. The Central Australian Rural Practitioners Association (CARPA) treatment manual currently recommends albendazole (400 mg) on 3 consecutive days for treatment of proven T. trichiura infection.11 This regimen has been correlated with a 50% cure rate.12 Since 2005, CARPA has recommended a single dose of albendazole (400 mg) for all children aged 6 months to 16 years as part of a community children’s deworming program. Empirical deworming is recommended before and after the wet season, or coinciding with child health assessments or school-age screening.11 Pregnant women are not targeted within this program. However, when pregnancy does occur within the target group, deworming with pyrantel is recommended.11

Under these deworming protocols, it has been reported that the prevalence of hookworm in the NT declined dramatically in the past 11 years and may be heading toward eradication.13 Our aim in this study was to describe the population at risk, disease associations and temporal trends of T. trichiura infections over the same 11 years.

Methods

In September 2013, we conducted a retrospective observational analysis of consecutive, microbiologically confirmed cases of T. trichiura infection in the NT between 1 January 2002 and 31 December 2012. Ethics approval for the study was obtained from the Human Research Ethics Committee of the NT Department of Health and Menzies School of Health Research (HREC-2013-1978).

Cases were identified from the NT Government pathology information system, Labtrak, which covers all NT Government health care facilities including five hospitals, two correctional centres and over 50 remote clinics. Previous STH studies13 have shown that the public NT laboratories identified 94% of all documented STHs, compared with 6% by other pathology service providers. Cases were diagnosed by examination of faeces specimens for T. trichiura eggs, other STHs and parasites by wet mount microscopy and a concentration method.14 Egg counts were not performed.

Infections were linked to NT Government electronic databases by means of medical record numbers to obtain data on age, sex, Indigenous status, place of residence, haemoglobin level and eosinophil count. Anaemia was defined as a haemoglobin level of ≤ 110 g/L and eosinophilia as an eosinophil count of ≥ 0.5 × 109/L.

Statistical analysis

Data were entered into a Microsoft Excel 2007 database (Microsoft Corporation) and analysed with Stata statistical software (version 13; Statacorp). Results are presented as medians and interquartile ranges (IQRs) for non-normally distributed parameters. The estimated prevalence rates in the NT for each year were expressed as cases per 100 000 Indigenous population per year with 95% confidence intervals. Indigenous population by age and percentage Indigenous population in the NT were obtained from Australian Bureau of Statistics data.15 Bivariate analyses were performed using the χ2 or Fisher exact test if expected frequencies were less than 5. For non-parametric data, the Mann–Whitney U test was used, with P values of < 0.05 considered significant.

Results

There were 417 episodes of T. trichiura infection diagnosed in 400 patients from a total 63 668 faecal samples tested between 1 January 2002 and 31 December 2012. About 85% of these were from hospital inpatients admitted to Royal Darwin Hospital, usually for reasons other than T. trichiura infection. Thirteen patients were screened as part of a prisoner health check, 11 patients were living in the community and the remainder were inpatients of an NT Government health care facility (Royal Darwin Hospital, Alice Springs Hospital, Katherine District Hospital, Tennant Creek Hospital or Gove District Hospital) at the time of T. trichiura detection. The preponderance of inpatient samples comes about because community clinics are likely to send samples to private rather than government laboratories, and transport of samples from remote communities can be problematic.

Patients were considered to have had a repeat episode of infection if T. trichiura was detected at least 6 months after the first diagnosed episode (median duration between infections, 23.7 months; range, 7.8–100.9 months). Thirteen patients (3%) had two infections and two patients (0.5%) had three infections. Forty-three episodes of repeat T. trichiura infections that were detected in 33 patients within 6 months of the initially detected infection were deemed to be the same episode of infection and were excluded.

The demographic and laboratory parameters of patients with T. trichiura infection are shown in Box 1. Most infections were in children aged under 17 years (239; 59.8%), with 175 (43.8%) in children younger than 5 years. The median age of those infected was 8 years (IQR, 3–36 years). The vast majority of infections were in Indigenous patients (381 [95.3%] compared with 10 [2.5%] in non-Indigenous patients). Ethnicity was unknown for nine patients. Boys were more likely to be infected than girls (P < 0.001) and women were more likely to be infected than men (P < 0.001).

Haemoglobin levels and eosinophil counts were available for 356 and 345 of the 400 patients, respectively; 143 (40.2%) patients had anaemia and 178 (51.6%) had eosinophilia. After excluding episodes of T. trichiura infection where patients had co-infection with another STH, 115 patients (39.2%) had anaemia and 139 (34.8%) had eosinophilia. There were 112 children (46.9%) and 48 adults (29.8%) who had co-infection with at least one other faecal parasite (P = 0.001).

The period prevalence of T. trichiura infection (Box 2; and Appendix 1 (PDF)) decreased from 123.1 (95% CI, 94.8–151.3) cases per 100 000 Indigenous population in 2002 to 35.8 (95% CI, 21.8–49.9) cases per 100 000 Indigenous population in 2011. This downward trend was documented for both children and adults (Box 2). Most cases occurred in patients who had lived in one of three remote Top End NT locations, Victoria Daly, East Arnhem Land and West Arnhem Land (Appendix 2 (PDF)). The number of faecal microscopy samples tested each year was relatively constant, with a median of 5764 samples (range, 5276–6527 samples) per year. We were unable to obtain accurate data on numbers of doses of albendazole dispensed for the community children’s deworming program over our study period.

Discussion

Our study shows that T. trichiura in the NT predominantly affects Indigenous patients from remote Top End communities. Children had the highest prevalence of infection across all the years in our study period. Among children, boys had a statistically significant higher proportion of infections. Conversely, women had a statistically significant higher proportion of infections. It is likely that adult women have higher rates of infection because they care for and live in closer proximity to infected children who contaminate the nearby environment. The difference we observed between the prevalence in boys and girls may reflect greater soil exposure among boys.

We found a strong association between T. trichiura infection, anaemia and eosinophilia, and this association persisted when coinfection with other STHs was excluded. The precise contribution that T. trichiura makes towards anaemia is difficult to ascertain, as infection occurs in populations with a high level of intestinal parasite co-infection, socioeconomic disadvantage and nutritional deficiencies.6

Our data show a consistent reduction in microbiologically diagnosed T. trichiura infections in the NT over the 11 years from 2002 to 2012. Despite this reduction, a significant percentage of infections (59.8%) continued to be diagnosed within the community children’s deworming program target population of children less than 17 years of age. This finding is most likely explained by the reduced efficacy of single-dose albendazole in T. trichiura infection compared with other STHs12,16 and to the rapid reinfection rates seen with T. trichiura.4 Similar disparities in reduction of infection with hookworm and T. trichiura in response to mass deworming campaigns have been observed elsewhere.17 Despite these poor cure rates, egg reduction rates of over 80%12 do occur with single-dose albendazole and this may be sufficient to protect our population against the morbidity seen in high-intensity infections. Interventions to improve sanitation are very effective in reducing the prevalence of T. trichiura infections,18 and level of maternal education, access to latrines, household wealth indexes and remoteness are important risk factors for infection.19

Our retrospective study has several limitations. Systematic sampling from the community was not undertaken, so the true prevalence rates are undoubtedly much higher than the laboratory-diagnosed rates found in our study population. Notably, all but 24 patients were inpatients of a NT Government health facility, reflecting a selection bias towards patients with acute illness and comorbid conditions. Furthermore, without a control group, the association of T. trichiura infection with anaemia cannot be further analysed. T. trichiura egg counts were not performed, so anaemia and eosinophilia correlates with the intensity of infection could not be determined.

We have shown a reducing T. trichiura infection rate in the NT over the 11 year period of our study. A large number of infections continue to be diagnosed in the community children’s deworming program target population. With the move towards eradication of hookworm in the NT, our data raise the question of whether the deworming program should be adapted to improve efficacy against T. trichiura (400 mg albendazole daily for 3 days). More importantly our study supports increasing the focus on health education, healthy living practices and essential housing infrastructure. These factors are deficient in remote Indigenous Australian communities20 and greatly impact on the prevalence of all STH infections.3,18,19

1 Demographic and laboratory parameters of 400 patients* with Trichuris trichiura infection,
Northern Territory, January 2002 to December 2012

Age group


Parameter

All

< 17 years

≥ 17 years

P


Number

400 (100%)

239 (59.8%)

161 (40.3%)

< 0.001

Sex

< 0.001

Male

205 (51.3%)

141 (59.0%)

64 (39.8%)

Female

195 (48.8%)

98 (41.0%)

97 (60.2%)

Indigenous status

< 0.001

Indigenous

381 (95.3%)

236 (98.7%)

145 (90.1%)

Non-Indigenous

10 (2.5%)

3 (1.3%)

7 (4.3%)

Unknown

9 (2.3%)

0 (0)

9 (5.6%)

Median haemoglobin level
(g/L [IQR]))

114 (104–125)

114 (105–123)

113 (95–130)

Anaemia

143 (40.2%)

78 (32.6%)

65 (40.4%)

0.14

Median eosinophil count
(× 109/L [IQR])

0.5 (0.1–1.0)

0.5 (0.1–1.2)

0.5 (0.1–0.9)

Eosinophilia§

178 (51.6%)

104 (43.5%)

74 (46.0%)

0.87

Polyparasitism

160 (40.0%)

112 (46.9%)

48 (29.8%)

0.001

Episodes with no STH coinfection

Number

333 (83.3%)

205 (85.8%)

128 (79.5%)

0.10

Median haemoglobin level
(g/L [IQR])

114 (104–125)

114 (105–124)

114 (98–132)

Anaemia**

115 (39.2%)

66 (36.9%)

49 (43.0%)

0.30

Median eosinophil count
(× 109/L [IQR])

0.4 (0.1–0.9)

0.4 (0.1–1.0)

0.5 (0.1–0.8)

Eosinophilia

139 (48.9%)

82 (47.7%)

57 (50.9%)

0.60


IQR = interquartile range. STH = soil-transmitted helminth.
* Data from the 17 episodes of repeat infection were excluded from the analysis. Aboriginal or Torres Strait Islander; Indigenous status was not available for nine patients aged ≥ 17 years. Anaemia defined as a haemoglobin level ≤ 110 g/L; data available for 356 patients (211 aged < 17 years, 145 aged ≥ 17 years). § Eosinophilia defined as an eosinophil count ≥ 0.5 × 109/L; data available for 345 patients (203 aged < 17 years, 142 aged ≥ 17 years). Defined as detection of at least one other intestinal parasite (Ancylostoma duodenale, Strongyloides stercoralis, Cryptosporidium spp, Giardia lamblia, Hymenolepis nana, Isospora spp, Blastocystis hominis in high numbers). ** Data available for 293 patients (179 aged < 17 years, 114 aged ≥ 17 years). Data available for 284 patients (172 aged < 17 years; 112 aged ≥ 17 years).

2 Prevalence of Trichuris trichiura infections in the Northern Territory in 2002–2012 by age and region