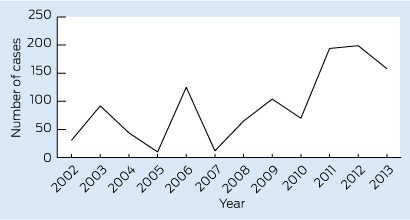
×

Inappropriate pathology ordering and pathology stewardship

An effective system of stewardship is needed to optimise the use of pathology tests

Many hospital clinical pathology laboratories presently experience annual increases in workload of 5%–10%.1 Such increases in demand are often not accompanied by concomitant increases in laboratory resources. This environment presents a significant challenge to laboratories that have no control over test-ordering patterns. Compounding this situation is the fact that many pathology tests are inappropriate or unnecessary, as they have no impact on patient care. The extent of inappropriate pathology test ordering in Australia is unknown, but a United Kingdom report on National Health Service pathology services estimated that 25% of all requests were unnecessary or inappropriate.2 Such tests are ordered for a variety of reasons, often in the belief that more testing equates to better patient care. Unfortunately, this is not always the case, and in some circumstances the opposite may be true.

Ozbug3 is a well established closed and moderated email list largely but not solely restricted to members of the Australasian Society for Infectious Diseases, predominantly comprising Australian and New Zealand infectious diseases physicians but also including registrars, medical microbiologists and infection prevention practitioners. There are about 800 subscribers, who discuss a broad range of topics. I asked the following question on Ozbug: “What microbiology laboratory investigation would you consider to be the one, although requested, results in least patient benefit? or What do you consider to be the most useless of microbiology tests?” The unexpectedly large number of responses (140) to this question and the ensuing rich discussion are the stimuli for this article.

My aim here is to discuss and attempt to understand inappropriate or unnecessary pathology testing, to define the drivers for and impact of such testing, and to suggest interventions to improve the use of pathology services. I will focus on hospital pathology services and provide specific examples from my discipline of microbiology.

Inappropriate pathology test ordering

Tests that are ordered but the results of which are never viewed by the clinician are of no use to the management of the specific patient. Duplicate tests or tests performed before initial testing results are available are unnecessary. Similarly useless tests include those that, no matter what the result, will not impact on patient care. Some serological diagnoses require collection of initial and convalescent sera. In many such circumstances, only a single sample is obtained and this is of no use. Many of the serological tests undertaken for the investigation of fatigue have a low likelihood of a useful result and may give the patient false hope of a result that will lead to a definitive diagnosis and effective therapeutic intervention. A serology test should only be performed when the clinical illness and epidemiology support that diagnosis. Otherwise a false-positive result may complicate patient management. These last two points are exemplified by Lyme disease serology, which is often performed in a setting of vague, non-specific symptoms in a patient who has never visited a known endemic region or country.

For bacterial culture, a dry swab in a specimen jar is unlikely to be useful. A midstream urine specimen that has a normal urinalysis result is most unlikely to identify a pathogen. A recent trend is to swab environmental services or inanimate objects for resistant organisms. This often occurs in the absence of epidemiological evidence to support such a link, and such swabbing should be resisted.

Generally, microbiology tests for clearance, such as repeat throat and nose swabs for respiratory viruses and repeat stool tests for Clostridium difficile, are unnecessary or not recommended.

Other common individual tests suggested by Ozbug correspondents as inappropriate or unnecessary are included in Box 1. Ozbug correspondents acknowledge that for many of the tests mentioned, it is not the test itself that is under scrutiny but the use of that test, and also that these tests may be useful in specific circumstances or jurisdictions. Laboratories also have the responsibility to offer tests that have been validated for the purpose for which they are offered.

Factors contributing to inappropriate pathology ordering

The prime reason for ordering pathology testing is to optimise patient diagnosis and management. Most practitioners agree on the importance of prudent use of pathology services. However, there may be other less apparent drivers for suboptimal pathology test ordering. Such testing may be tied to the patient’s or the family’s expectations rather than to an actual need for such testing. The physician’s anxiety or fear of missing a diagnosis may generate the feeling that something needs to be done, leading to overinvestigation without a clear rationale for that testing. Junior doctors may order according to peer perception or because they are concerned that their consultant may criticise them if the test has not been requested. In some circumstances when a doctor is time pressured, ordering pathology tests may be an easier course than the timely consideration of management options.

Other less than ideal reasons to order pathology tests include: “wouldn’t it be nice to know”, “I cannot find (or have not looked for) the previous result”, “I may want to publish the case in the future” and “I do not believe the result from the first laboratory and I want to send it to a second laboratory”. Some individual factors contributing to suboptimal testing, suggested by Ozbug correspondents, are summarised in Box 2.

Pathology laboratories may also contribute to the number of inappropriate tests. New technology with new testing menus may be introduced before there is evidence that such developments have a favourable impact on patient outcomes.4

Risks of inappropriate pathology ordering

Some tests are not only unnecessary but may be misleading or even harmful. The receipt and subsequent processing of saliva when sputum is ordered may identify transient oral colonising bacteria such as Streptococcus pneumoniae or methicillin-resistant Staphylococcus aureus. This may do a patient harm if the organism is then assumed to be the aetiological cause of the pneumonia, targeted treatment is given and the real cause of pneumonia is overlooked.

When inappropriate or unnecessary tests are ordered, there is a risk of a false-positive result, leading to further unnecessary testing, other investigations and even unnecessary treatments with attendant adverse effects. Ober has described this cascade effect, highlighting that a “normal range” typically includes 95% of all normal subjects, with up to 5% of normal subjects given an abnormal result.5 With modern multichannel analysers, more often used in other pathology disciplines, the chance of a false-positive result is further increased.

Inappropriate pathology testing consumes laboratory resources, both budgetary and labour. This may, especially in more manual disciplines such as microbiology, lead to delays in processing and increase the turnaround time for specimens from the patients in greatest need.

Strategies to improve pathology test ordering

There has been much discussion among the Ozbug group concerning possible strategies to improve microbiology test ordering. Individual strategies suggested by Ozbug correspondents are shown in Box 3. There are a limited number of studies documenting the impact of a strategy targeting a specific test with a decrease in the ordering of that test during the period of observation.6 However, such interventions generally do not tackle the breadth of pathology testing, and the long-term sustainability of such interventions is questionable.

Overall, the Ozbug discussions emphasise the need for an ongoing system of stewardship to ensure the optimal use of pathology resources. To be effective, a system needs to be developed together with all the major stakeholders, have a strong and iterative educational component, be evidence-based, include a system of regular audit with feedback, and especially target those tests that are high cost, resource expensive and frequently used inappropriately. Orders from clinicians should be considered requests for testing as well as for specialist pathologist input. Within my own discipline, the clinical microbiologist should take an active lead in decisions about testing menus and indications, specimen acceptability and acceptance, testing quality, and test interpretation.

Just as antimicrobial stewardship has now become a national standard for hospital accreditation, a system of pathology stewardship would optimise the use of pathology resources. This is not a new concept. In 1922, Peabody wrote:

Good medicine does not consist in the indiscriminate application of laboratory examinations to a patient, but rather in having so clear a comprehension of the probabilities and possibilities of a case as to know what tests may be expected to give information of value.7

1 Ozbug correspondents’ examples of inappropriate microbiology test ordering*

  • Most extra tests performed on cerebrospinal fluid when no abnormalities were found on microscopy
  • Routine cultures of vascular catheters
  • Vancomycin-resistant enterococci and methicillin-resistant Staphylococcus aureus surveillance cultures in unquarantined patients
  • Parasites in stools in hospitalised patients
  • Surveillance blood cultures in asymptomatic patients
  • Streptococcal, herpes, typhoid fever (eg, Widal test) and Lyme disease serology
  • Legionella and pneumococcal urinary antigens in patients with normal chest x-ray results
  • Repeated bacterial surveillance cultures of endoscopy equipment

* Note: In some specific circumstances these tests may be appropriate.

2 Ozbug correspondents’ reports of potential factors contributing to inappropriate test ordering

  • Suboptimal teaching of undergraduates and graduates
  • Pressure of work for both clinicians and pathologists
  • Lack of pathologist input for test menu development and specimen suitability information
  • Clinicians’ poor understanding of test reliability and validity
  • Clinicians’ lack of knowledge and concern about pathology costs
  • Ease of ordering tests electronically or using prestamped request slips
  • Income generation of some pathology testing
  • Acceptance of public pathology as a learning environment that encourages more pathology
  • Fear of litigation

3 Strategies suggested by Ozbug correspondents to improve microbiology test ordering

  • Enhanced education of medical students and graduates
  • Pathology ordering audit and feedback
  • Increased collaboration and engagement with clinicians
  • Development of rejection rules such as minimum retest intervals
  • Display of costs of pathology tests with pathology results
  • Standardisation of investigations for specific clinical syndromes
  • Development and promulgation of golden rules regarding pathology testing
  • Pathology rotations for junior medical staff
  • Prevention of duplicate testing

Comparing non-sterile to sterile gloves for minor surgery: a prospective randomised controlled non-inferiority trial

Minor surgery is an important aspect of general practice. This is particularly the case in Australia, where the incidence of skin cancer is reported to be the highest in the world,1 and where general practitioners perform most surgical excisions for skin cancer.2

When the use of gloves for surgery was first implemented by William Stewart Halsted in 1890, it was in an attempt to protect his surgical scrub nurse from dermatitis as a result of contact with mercuric chloride — which was used for sterilisation processes — rather than to prevent infection.3 Nowadays, several guidelines exist in Australia and internationally, which recommend that GPs use sterile gloves for small procedures such as minor surgery in general practice.46 However, these guidelines are based on expert opinion rather than on medical evidence.

Before our study, about half of the participating GPs used non-sterile clean boxed gloves when conducting minor skin excisions in general practice, while the other half used sterile gloves. A comprehensive Medline search found few studies relating to the use of sterile versus non-sterile gloves (Appendix). Randomised trials looking at lacerations in an emergency department,7 wisdom tooth extraction in an outpatient setting8 and Mohs micrographic surgery9 all showed no significant difference between infection rates. However, these studies looked for superiority of the sterile gloves rather than non-inferiority of the non-sterile gloves, resulting in negative trials, and the latter two studies were statistically underpowered. An observational study in a private dermatology setting showed no difference in infection rate for minor procedures; however, sterile gloves were shown to result in a significantly lower infection rate than non-sterile gloves for a subgroup of more complicated reconstructive procedures, which comprised flaps and skin grafts.10 Another observational study of Mohs surgery showed no statistical difference in infection rates.11 The only study conducted in a general practice setting was an audit of 126 patients where non-sterile gloves had been used for minor surgery, which showed an infection rate of 2.4%.12

Prior studies of wound infection after minor surgery involving GPs in Mackay, Queensland, showed overall incidences of wound infection of 8.6% and 8.9%.1316 This incidence was higher than expected based on published results of a similar Australian general practice cohort (1.9%),17 a skin cancer clinic cohort (1.5%)18 and a European dermatology clinic cohort (2%).19 A suggested acceptable rate of infection after clean minor surgery is less than 5%.20 The reason for our high infection rate is unclear, but may be related to the hot, humid environment, or to patient behaviour in our rural setting. A low risk of infection after clean surgery means that studies of more than 1000 procedures (sometimes many more) are required, under normal circumstances, to detect a clinically relevant difference in infection from an intervention with statistical confidence.21 Because of the high incidence of infection in our patient cohort, and the high minor surgery workload,22 we decided to use this capacity to investigate the effect of gloves on infection rates. Our trial sought to establish whether non-sterile clean boxed gloves were non-inferior to sterile gloves with regard to surgical site infection after minor skin excisions.

Methods

Study design

We carried out a randomised controlled single-centre trial with patients presenting for minor skin excisions. The study was approved by the James Cook University Human Research Ethics Committee (approval number H4572). The trial was registered in the Australian New Zealand Clinical Trials Registry ACTRN12612000698875.

Setting and participants

The study was conducted in a single private general practice in Mackay, Queensland between 30 June 2012 and 28 March 2013. Six doctors recruited between one and 100 patients. The GPs and practice were purposively selected as they had previously successfully participated in wound management projects.12,15 Consecutive patients presenting for minor skin excisions were invited to take part in the trial. Practice nurses were responsible for recruiting patients and collecting data. Demographic information was collected from all patients, as well as clinical information about diabetes or any other important pre-existing medical conditions. A body site map was used to define excision site. At the end of the study, practice nurses were asked to re-examine computer records in order to fill in any missing data. Two of us (C H and S S) visited participating GPs and practice nurses to provide training and ensure that recording was standardised.

Eligibility criteria

All patients presenting to a participating GP for “minor skin excision” from any body site were eligible to participate in the study. Two-layer procedures were recorded and included. Patients who were already taking oral antibiotics or immunosuppressive drugs were excluded from the study. Other exclusion criteria were skin flaps, excision of a sebaceous cyst and history of allergy to latex.

Surgical wound management protocol

We conducted a workshop for participating GPs to develop guidelines that would ensure that excisions were managed in a standardised manner. The following excision protocol was agreed on:

  • skin preparation with chlorhexidine solution;
  • usual sterile technique (standard precautions);
  • World Health Organization Hand Hygiene Technique with Soap and Water;23
  • local anaesthesia — subcutaneous injection of excision with 1% lignocaine;
  • excision closure with nylon sutures using simple interrupted sutures;
  • dressing application — application of non-woven polyester fabric with acrylic adhesive and non-woven absorptive pads;
  • no application of antibiotics, either topical or oral. No topical antiseptics such as betadine or alcohol. No antiseptic washes or medicated soaps;
  • patient wound advice — provision of written and verbal advice about wound care and time of return for suture removal; and
  • removal of sutures according to body site: head and neck, 7–10 days; torso, 12–14 days; upper limb, 14 days; lower limbs, 12–16 days.

Recruitment, randomisation and blinding

All patients provided written informed consent before enrolling in the study. After agreeing to participate, patients were randomly allocated to the intervention or control groups using computer-generated random numbers. Allocation information was placed in opaque sealed envelopes. The practice nurse enrolled patients and assigned participants to their groups. Patients were not blinded to their group allocation. The assessing practice nurses and doctors were blinded to the allocation of intervention and control groups. All participating patients received written instructions on postoperative wound care. Both groups were asked to take their dressing off after 24 hours and avoid using antiseptics.

Clinical outcomes

Incidence of wound infection was our primary outcome measure, and incidence of other adverse effects was our secondary outcome measure. Wounds were assessed for infection by the practice nurse or the GP on the agreed day of removal of sutures or sooner if the patient re-presented with a perceived infection. Our definition of wound infection was adapted from standardised surveillance criteria for defining superficial surgical site infections developed by the United States Centers for Disease Control and Prevention’s National Nosocomial Infection Surveillance System (Box 1).24 All participating doctors and nurses were briefed regarding the definition of infection and were also given written information. Practice nurses were asked to swab any discharging infections to investigate any pattern of antimicrobial resistance.

Sample size

Sample size was calculated on the basis of our previous study, which showed an infection rate of 8.6%.14 Based on a projected infection rate of 8%, we decided that an absolute increase in incidence of infection of 7% would be clinically significant. Thus differences in infection rates between non-sterile and sterile gloves of up to 7% were considered clinically unimportant, and based on our anticipated infection rate of 8% for sterile gloves, an infection rate of up to 15% for non-sterile gloves was considered non-inferior. This margin was decided by the investigating GPs, based on what they felt would be relevant to their clinical practice, and this margin was prespecified. To detect this non-inferiority margin of 7% with a power in excess of 80%, and a two-sided 95% confidence interval, a total of 186 patients were required in the intervention group and 186 patients in the control group. Based on our previous results in a similar setting, the design effect of investigating GPs, who were the primary sampling unit and were considered to form “clusters”, was estimated to be 1.21, and the required sample size was adjusted to at least 225 patients per group.16

Statistical analysis

All analyses were based on the intention-to-treat principle. Per-protocol analyses were conducted to cross-validate the intention-to-treat results.25,26 Depending on the distribution, numerical data were described as mean, SD; or median, interquartile range (IQR). Percentages were presented with 95% confidence intervals. A two-sided 95% CI for the difference in infection rate was used to assess non-inferiority. In addition, a per-protocol analysis was conducted, which excluded patients with protocol violations. Further, a sensitivity analysis was performed, including patients lost to follow-up: once as treatment successes (no wound infection) and once as treatment failures (with wound infection). Results were adjusted for their cluster effects. P less than 0.05 were considered statistically significant. Data were analysed using IBM SPSS version 21, Stata version 12.1 (StataCorp) and Power Analysis and Sample Size Software (NCSS).

Results

Practice and study characteristics

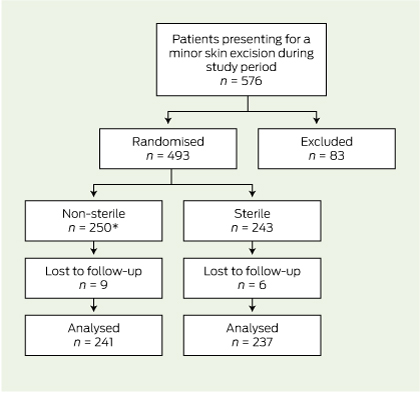
Of the 576 patients who attended for skin excisions during the collection period, 83 were excluded (Box 2).

Of the remaining 493 patients, 250 were randomly assigned to the intervention group (non-sterile gloves) and 243 to the normal treatment control group (sterile gloves). Fifteen patients were eventually lost to follow-up because they had their sutures removed elsewhere (13 patients) or they were not assessed for infection at the time of removal of sutures (two patients). There was one protocol violation where a patient in the intervention group was given an antibiotic for another infection in the follow-up period. This patient did not have a wound infection and was analysed in the intervention group on an intention-to-treat basis. Follow-up was completed in 478 (97.0%) of randomised patients (Box 3).

Comparisons at baseline

There were no large differences at baseline between the intervention and control groups (Box 4).

Incidence of infection

Infection occurred in 43 of the 478 excisions (9.0%). The incidence of infection in the non-sterile gloves group (8.7%; 95% CI, 4.9%–12.6%) was significantly non-inferior compared with the incidence in the control group (9.3%; 95% CI, 7.4%–11.1%). The two-sided 95% CI for the difference in infection rate (− 0.6%) was − 4.0% to 2.9%, and did not reach the predetermined margin of 7%, which was required for non-inferiority.

A further sensitivity analysis was performed on the 15 patients lost to follow-up. If all of these patients were assumed to have an infection, or if all patients were assumed not to have an infection, the results were still significantly non-inferior (Box 5). There were no adverse events.

Discussion

The results of our study suggest that the use of non-sterile clean boxed gloves was not inferior to that of sterile gloves in relation to the incidence of infection. This was both clinically and statistically significant, as the difference in the incidence of infection did not reach our predetermined margin of 7%, considered significant for non-inferiority. The upper limit of our 95% CI was 2.9%, which was well below our predetermined non-inferiority margin of 7.0%.

Comparison with other studies

Our study produced a similar outcome to existing studies.79 This was an adequately powered, positive randomised controlled trial that tested for non-inferiority of the non-sterile gloves rather than for a significant difference in infection rates. We believe this was the first study of its type to be conducted in a general practice setting.

Limitations of study

Our study did have some limitations. Various characteristics influence infections, and although information on as many variables as possible was recorded, it proved difficult to ensure that baseline data were comparable. For example, there were inadequate data recorded on suture size and patient occupation, and consequently, these factors could not be compared. In addition, the prevalence of diabetes and other medically important conditions was probably underrecorded, and power to analyse these subgroups was limited. Surgical training and technique of the GPs involved is a potential confounder that would be difficult to quantify and was not recorded; however, the procedures performed by individual GPs were equally balanced in the baseline data. Our predetermined margin of 7% for non-inferiority may be considered high, and some clinicians may consider a smaller margin to be clinically meaningful. Although our actual difference in infection was − 0.6%, a larger sample size would be required for the study to be adequately powered to detect smaller differences in infection rate.

Although the diagnosis of infection followed guidelines, it is still subjective and there may be inter- and intraobserver variation.27 The definition we used is the most widely implemented standard definition of wound infection.24,27 We have no evidence to support intra- and interpractice reproducibility of measurement and recording procedures.27

Our sterile gloves were powdered, while our non-sterile gloves were non-powdered. However, we have no reason to believe that powder would affect infection rates.

Generalisability

There are some limits to generalising these findings. The population of Mackay is slightly older and has a lower median household income than the general Australian population.28 Mackay is a provincial town in tropical north Queensland. The climate is hot and humid, with the mean daily maximum temperature ranging between 24.2°C and 30°C during the summer months, and a relative humidity of 75% to 79%.29 We have already discussed that our incidence of wound infection is high compared with similar cohorts of patients in temperate climates; however, we have no reason to believe that the effect of sterile gloves would be less non-inferior, that is, any worse, in similar cohorts of patients with lower incidence of surgical site infection.

We did not include skin flaps in our trial, and previous evidence has shown sterile gloves to be superior for more reconstructive dermatological procedures;10 therefore, we do not recommend extrapolating our findings to more complicated procedures such as skin flaps. However, the findings could be extrapolated to less complicated procedures in primary care, such as contraceptive implant insertion and minor procedures involving class 2 wounds such as suturing of lacerations.

Choice of gloves

There are other considerations that might affect doctors’ choice of gloves. Sterile gloves come in several different sizes, while non-sterile gloves are generally only available in small, medium and large. Latex and powder allergy, as well as preference for and availability of powdered or non-powdered gloves, may also affect choice. A recent study showed high bacterial counts on boxed gloves left open for longer than 3 days,30 although the clinical significance of these bacterial counts is unclear. Another study showed no bacterial growth on clean examination gloves after opening a new box.31

Cost saving

There is some cost benefit in the use of non-sterile versus sterile gloves, with about $1 saved per pair of gloves used. We calculated that a single pair of non-sterile gloves costs $0.153 compared with $1.203 for sterile gloves, saving $1.050 per pair of gloves used for each procedure. The cost saving benefit of using non-sterile gloves — without increasing infection rates — may be of particular relevance to developing countries with limited health care resources.

1 Definition of surgical site infection (SSI)

  • infection must be within 30 days of excision;
  • the infection involves ONLY skin or subcutaneous tissue of the incision, AND at least one of the following:
    • purulent discharge;
    • pain or tenderness;
    • localised swelling;
    • redness or heat at site;
    • diagnosis of SSI by general practitioner; and
  • stitch abscess must not be counted as an infection.

2 Reasons for exclusion from study

Reasons for exclusion from study

Patients (n = 83)


Patient declined to participate

38

Patient was taking oral antibiotics

23

Excision of sebaceous cyst

15

Shave biopsy conducted

3

Patient did not plan to return for removal of sutures

2

No sutures required

1

Flap required

1

3 Flowchart of enrolment, randomisation and follow-up of patients


* There was one protocol violation where a patient in the intervention group was given an antibiotic for another infection in the follow-up period. This patient did not have a wound infection and was analysed on an intention-to-treat basis.

4 Baseline comparison of intervention group (non-sterile gloves) and control group (sterile gloves)

Patient characteristics

Intervention group (non-sterile gloves) (n = 241)

Control group (sterile gloves) (n = 237)


Mean age (SD), years

64.9 (15.8)

65.7 (15.3)

Male

58.9%

60.30%

Smoking status


Never smoked

57.7%

52.7%

Ex-smoker

30.7%

35.9%

Current smoker

11.6%

11.4%

Diabetes mellitus

10.0%

12.7%

Other medical conditions*

38.1%

35.9%

Medications


Warfarin

4.1%

5.1%

Clopidogrel or aspirin

28.6%

27.0%

Steroids, oral or inhaled

6.3%

8.1%

Lesion characteristics


Body site


Neck and face

35.3%

31.2%

Upper extremities

26.9%

30.4%

Trunk

19.1%

19.8%

Lower limb above knee

4.6%

1.6%

Lower limb below knee

14.5%

16.9%

Histology


Naevus or seborrhoeic keratosis

15.3%

13.0%

Skin cancer and precursor

66.4%

70.5%

Other

18.3%

16.5%

Skin integrity


Normal

75.9%

74.7%

Ulcerated

19.1%

19.0%

Procedure characteristics


Mean length of excision (SD), mm

20.0 (14.0–27.0)

20.0 (13.5–27.0)

Median number of days until removal of sutures (IQR)

8 (7–10)

9 (7–10)

Two-level procedure

0

0.8%


IQR = interquartile range. * Medical conditions recorded were: chronic obstructive pulmonary disease (n = 18; 3.8%), hypertension (n = 119; 24.9%), ischaemic heart disease (n = 38; 7.9%), peripheral vascular disease (0) and current cancer (n = 7; 1.5%). † Skin cancers were: melanoma, squamous cell carcinoma and basal cell carcinoma. Precursors were: solar keratosis and intra-epithelial carcinoma. ‡ “Other” included: re-excisions of melanoma and basal cell carcinoma, sebaceous cyst, epidermal cyst, wart and dermatitis.

5 Comparisons as intention-to-treat and per-protocol and sensitivity analyses*

Analysis

Intervention group

Control group

Difference
(95% CI)


Intention-to-treat

21/241 (8.7%)

22/237 (9.3%)

− 0.6%
(− 4.0% to 2.9%)

Per-protocol

21/240 (8.8%)

22/237 (9.3%)

− 0.5%
(− 4.0% to 2.9%)

Sensitivity analysis: lost to follow-up; assumed without infection

21/250 (8.4%)

22/243 (9.1%)

− 0.7%
(− 4.0% to 2.7%)

Sensitivity analysis: lost to follow-up; assumed with infection

30/250 (12.0%)

28/243 (11.5%)

0.5%
(− 3.7% to 4.6%)


* Differences between control and intervention groups are presented with two-sided 95% confidence intervals. Results were adjusted for the clustering effects of treating doctors.

Missing malaria? Potential obstacles to diagnosis and hypnozoite eradication

Poor specimen collection and limited availability of primaquine may be putting patients at risk

Recently, one of us experienced an episode of probable malaria on returning from fieldwork in the Solomon Islands. Although a clinical diagnosis of malaria was made, and the illness responded to empirical therapy with artemether–lumefantrine (Riamet, Novartis), a laboratory diagnosis was not achieved.

Suspected malaria in travellers who have returned to Australia from overseas will present without notice and, owing to the often severe nature of this illness, will require immediate attention. This may occur in localities where personal consultation with an infectious diseases physician is not possible. Primaquine for the eradication of malarial hypnozoites from the liver may not be readily available. In this article, we aim to provide brief expert guidance on the diagnosis of malaria, the use of primaquine for eradication therapy and the implications of the limited availability of this treatment in Australia.

Patients presenting with fever should be questioned about their travel history. Clinicians should be mindful that malarial relapse (Plasmodium vivax and P. ovale) or recrudescence (P. malariae) may occur months, or even years, after primary infection. Further, relapse may be the first symptomatic presentation.1 Therefore, any patient with pyrexia and a history of travel to an endemic area in the past 3 years might be considered as potentially having malaria.2

Initial investigation

Clinical suspicion should be raised in patients who demonstrate specific symptoms associated with the disease, such as relapsing fever, rigors or chills. Note that immune-naive people may not always present with the typical cyclical fevers of malaria.2,3 Unless a separate, simultaneous, pathological process is present (such as concurrent dengue fever, other infections or a non-infectious cause), the presence of localised symptoms, a rash, or the onset of symptoms within the prepatent period (7 days) after initial travel to an endemic area may assist in excluding a diagnosis of malaria.3

Laboratory investigation of patients who potentially have malaria requires blood collected in EDTA anticoagulant tubes immediately on presentation. Both thick and thin film microscopy should be requested. As morphological changes in parasites will develop within hours, blood should be delivered to the laboratory within an hour of collection. Immunodiffusion-based rapid diagnostic antigen tests should also be performed if available, but these tests do not supplant microscopy.4 Currently, there is no consensus regarding the correct timing and number of specimens required to exclude a diagnosis of malaria. It appears that a single collection is often sufficient for diagnosis.3 However, further specimen collections taken shortly after the onset of febrile paroxysms may be necessary for the detection of P. falciparum malaria, as this species is sequestered in the deeper microvasculature at other times during its life cycle.2,3

Returned travellers who have used malaria prophylaxis may occasionally still acquire malaria, even when they strictly adhere to the dosage regimen.1 In such cases, the parasitaemia is often very low, requiring multiple blood collections for diagnosis, but individuals with little or no prior exposure will still be significantly unwell. Very rarely, malaria may be acquired during short stays in endemic areas; for example, during airport stopovers.5

The role of PCR

Polymerase chain reaction (PCR) testing represents a more recent and highly efficacious method for the detection and speciation of malaria in febrile patients. Nevertheless, specimen collection during an afebrile period may lead to a false-negative PCR test result. Due to its expense and limited availability, PCR testing is currently restricted to confirmation and speciation, or cases where a malaria diagnosis is strongly suspected but microscopy and antigen testing are negative.

Primaquine

Infection with relapsing species of malaria (P. vivax and P. ovale) requires eradication of hypnozoites from the patient’s liver using primaquine. P. ovale malaria requires half the dose of primaquine used in cases of P. vivax. Some strains of P. vivax acquired in the South Pacific and South-East Asia may need higher doses of primaquine for eradication.6 Tests for glucose-6-phosphate dehydrogenase deficiency should be performed on all patients before primaquine therapy, in order to avoid potentially life-threatening oxidative events in enzyme-deficient individuals. Currently, primaquine is erratically available in hospital pharmacies and may not be stocked at all in smaller, regional facilities. Also, it cannot be accessed under the Pharmaceutical Benefits Scheme, despite being indicated in Australian therapeutic guidelines.6 These factors limit its availability to hospitals and community pharmacies. For example, when malaria presents and is treated in general practice, the limited availability of primaquine could result in this important therapy not being administered, especially in regional, rural and isolated areas.

In summary, given increasing rates of travel to endemic areas by Australians, clinicians may be faced with a case of malaria at any time. Hence, it is important that they have the correct specimen-collection and treatment protocols at hand. Primaquine should be available through the Pharmaceutical Benefits Scheme to patients treated in a community setting.

Australian bat lyssavirus: implications for public health

Australian bat lyssavirus (ABLV) is genotype 7 of the 12 known lyssaviruses and is closely phylogenetically related to rabies (genotype 1).1 Although indigenous cases of rabies have never been identified in Australia, low-level ABLV endemicity has been found in Australian bats. Two variants have been identified: pteropid-ABLV, which has been found in all four Australian flying fox species (Megachiroptera), and YBST-ABLV, which has been identified in yellow-bellied sheathtail bats, a species of microbats (Microchiroptera).2 Both variants have been implicated in fatal human infection, albeit rarely.35 The third confirmed human case of ABLV infection, and the first in a child, was recently reported.5 Here, we outline the public health considerations of this emerging infection.

Clinical aspects

All three reported cases of human ABLV infection had clinical courses consistent with what is known of encephalitic (furious) rabies. Encephalitic rabies presents between several weeks and many years after exposure. It is usually characterised by progressive cerebral and autonomic dysfunction, preceded by a short, non-specific prodrome. Hydrophobic and aerophobic spasms are pathognomonic. The patient may initially be calm and cooperative, with interrupting and escalating episodes of confusion, agitation and hyperactivity. Deterioration, coma and death are inevitable.1,6

Diagnosis of lyssavirus infection is difficult and frequently delayed. Neuroimaging and cerebrospinal fluid (CSF) analysis may initially yield normal results, and serum and CSF lyssavirus antibody test results are frequently negative.1,6 ABLV can be identified using rabies reverse-transcription polymerase chain reaction assays, for which nuchal skin biopsy samples provide the greatest sensitivity, compared with saliva and CSF assays. Repeat testing is associated with improved sensitivity and is often necessary.2,7 Experimental treatment regimens, notably the Milwaukee Protocol, may be considered, but none have proven consistently effective and palliation is appropriate management in most cases.810

Public health management of human exposure to bats

Prevalence of ABLV is low (< 1%) in the healthy, wild bat population but is between 5% and 10% in sick, injured or orphaned bats.11,12 Since 1996, ABLV has been diagnosed in bats in New South Wales, the Northern Territory, Queensland, South Australia, Victoria and Western Australia.13 Transmission to humans occurs through direct inoculation of saliva from an infected primary host, typically through a bite or scratch. Wounds caused by bats may seem innocuous, but any potential abrasion or penetration of skin or mucous membranes should be taken seriously. Contact of mucous membranes or broken skin with the saliva or neural tissues of a bat in Australia constitutes potential exposure to ABLV. There is no evidence that transmission occurs through contact with bat urine, faeces or blood. In the United States, bat-variant rabies has been diagnosed in people without a clear history of bat-inflicted injury, reinforcing the need for a cautious approach in the setting of potential exposures.14 All potential exposures to ABLV should be notified immediately to local public health authorities.15

The essential components of managing potential ABLV exposure include local wound treatment and initiation of post-exposure prophylaxis (PEP). Thorough wound cleansing reduces the risk of rabies transmission in animal models and is likely to be beneficial in preventing ABLV infection. Wounds should be irrigated with soap and water for at least 5 minutes, followed by application of a virucidal antiseptic solution such as povidone–iodine or alcohol. Unlike dog bites, bat bites or scratches result in small wounds that rarely require suturing. In the event that it is indicated, suturing of the wound should be delayed until after administration of human rabies immunoglobulin (HRIG).15

PEP, using a combination of multiple doses of rabies vaccine and HRIG, is safe and effective in preventing rabies in exposed individuals.16 Rabies vaccine is also protective against ABLV and has been effectively used for pre-exposure vaccination and for PEP.15 PEP should be commenced as soon as a potential exposure is identified. If the implicated animal can be tested and has negative test results for lyssavirus, the PEP regimen may be discontinued.15,17 Previously unvaccinated individuals should receive intramuscular rabies vaccine on Days 0, 3, 7 and 14. HRIG should be administered subcutaneously at the site of any wound as much as possible (up to the entire required dose), with the remainder of the dose (often up to half the required dose) given intramuscularly. Individuals who have previously been adequately vaccinated against rabies do not require HRIG and should be given a modified course of two doses of rabies vaccine.15

Given the potential for prolonged incubation periods, PEP should be offered to any person who has any history (no matter how distant) of a bite, scratch or mucous membrane or broken skin contact with the saliva or neural tissue of a potentially infected animal, including any bat in Australia or overseas.15

Ensuring the public (Box 1) and clinicians (Box 2) are aware of the importance of even minor exposures to bats remains an ongoing concern, given the effectiveness of PEP in preventing ABLV and the lack of therapeutic options after onset of active disease. A recent survey conducted in Queensland found relatively high levels of community awareness that bats pose some risks to human health.18 However, understanding of the full significance of exposure to bats is variable and appears heavily influenced by media reporting. Notification of potential exposures in Queensland peaked after the public reporting of previous ABLV cases, but subsequently returned to baseline.19 The bat encounter that preceded the most recent case of ABLV infection was not brought to medical attention at the time.5 In a 3-month period after public reporting of the case, 169 reports of potential ABLV exposure were reported to Queensland public health units, compared with an average of 13 per month in the preceding 2 calendar years (unpublished data, Communicable Diseases Unit, Queensland Health). This increase reflects greater public and clinician awareness of the risk of potential exposure following publicity of the case.

Public health management of exposure to people with lyssavirus infection

Human-to-human transmission of rabies and other lyssaviruses is considered theoretically possible, but has not been proven to occur.20 The only two reported cases of rabies thought to have resulted from direct human salivary contact were not substantiated by laboratory investigations.21 Rabies transmission via transplantation of infected organs has been well documented. Acquisition in the laboratory has also been reported, through direct inhalation of concentrated virus. Aerosolisation of virus contained in human tissue or secretions has not been proven to occur.20 Guidelines published by the Communicable Diseases Network Australia (CDNA) and the US Centers for Disease Control and Prevention recommend PEP for contacts who have had exposure to the saliva or neural tissue of an infected person across mucous membranes or broken skin.15,20

The routine delivery of health care to a patient with lyssavirus infection should not ordinarily pose any risk of transmission. Standard precautions provide adequate infection control, with emphasis on the use of eye protection, gowns, gloves and masks during procedures where contact with patient secretions is likely (eg, suctioning and intubation).20

After the most recent diagnosis of ABLV infection, which occurred at our institution in 2013, infection control and public health unit staff coordinated the identification and assessment of all potential contacts in the hospital and community. PEP was offered on the basis of percutaneous or permucosal exposure to the infected patient’s saliva or neural tissue (CSF). Of 170 health care workers screened by infection control staff, 61 (35.9%) were referred for medical review by the infectious diseases team because of potential or uncertain exposure, or anxiety. Fifteen (8.8%) commenced PEP: eight met the CDNA criteria15 and the other seven specifically requested PEP in the setting of an ill defined exposure. Clinically significant exposures included contamination of broken skin and mucosal surfaces with respiratory secretions during airway management procedures,7,8 emphasising the importance of compliance with the standard precautions that could have prevented this exposure. One penetrating injury was sustained during initial assessment. The seven staff members who requested PEP had been involved in airway management procedures but could not recollect a specific incident of exposure to saliva or CSF.

Five household members were also considered to have had clinically significant exposure, resulting in a total of 20 people who were administered PEP. Two who had been previously vaccinated against rabies received a course of two doses of rabies vaccine only; another two declined HRIG and received vaccine only; and 16 completed a full course of PEP with rabies vaccine and HRIG. One PEP recipient experienced minor adverse effects after vaccination, but was able to complete the course. No secondary cases of ABLV have been identified.

PEP is used more liberally in other parts of the world, with reports of large numbers of health care workers receiving prophylaxis on the basis of “possible” as well as “proven” contact.22,23 The approach taken in the US and Australia results in less administration of PEP, but in our opinion is scientifically valid and appropriately cautious. Although potential contacts without a defined exposure are not routinely given PEP, no cases of lyssavirus transmission to a health care worker in the context of direct patient care have been reported.

Other potential hosts

Bats are the primary host for ABLV. Spread to other mammalian species through exposure to infected bats is possible but has rarely been reported. Experimental inoculation of domestic cats and dogs with ABLV resulted in seroconversion and mild behavioural changes, but no evidence of clinical disease or ongoing viral replication.24 There have been no documented cases of proven ABLV infection in dogs. In 2013, two horses in south-east Queensland with clinical disease were found to have ABLV infection — the first confirmed cases of ABLV in animals other than bats or humans.25 The risk of secondary transmission of ABLV to humans from animals other than bats is likely to be very low. In Australia, in addition to being recommended for those with exposure to bats (as above), PEP should also be considered in the setting of potential exposure to any other animal with proven ABLV infection.

Conclusion

Human infection with ABLV is rare but devastating. Health care workers and the Australian public should be well informed of the risk of transmission from microbats and flying foxes in Australia, and educated about the importance and reliability of PEP in preventing disease. The risk posed to contacts of people with ABLV infection is unknown but probably very low in most circumstances. In spite of this, the expectation that ABLV will continue to be universally fatal in humans warrants a cautious approach, including the administration of PEP when clinically significant contact with infected material occurs. The number of health care workers given PEP after the recent diagnosis of ABLV in a patient illustrates the importance of strict compliance with standard precautions in the care of hospital inpatients.

At the time of the most recent case and during the resultant contact tracing, licensed rabies vaccine and HRIG were available in sufficient supply. Subsequently, greater local demand due to increased awareness of ABLV has combined with worldwide shortages of both vaccine and HRIG to pose significant challenges for the timely delivery of PEP when it is indicated. Notwithstanding this, CDNA guidelines for managing potential lyssavirus exposures15 remain appropriate in the Australian setting.

1 Bats and humans — key messages for the public

  • All Australian bats (flying foxes and microbats) should be considered to be carrying Australian bat lyssavirus unless proven otherwise.
  • Bats should only be handled by trained and vaccinated wildlife handlers.
  • Any bat-related injury (bite, scratch or mucosal exposure to bat saliva or neural tissue) should be reported immediately to a doctor — no matter how small the injury or how long ago it occurred.
  • All wounds should be irrigated with water and soap for at least 5 minutes, as soon as possible after the injury occurs.

2 Bats and humans — key messages for the clinician

  • Any bat-related injury (bite, scratch or mucosal exposure to bat saliva or neural tissue), including those inflicted by a microbat (insectivorous bat), should be notified immediately to your local public health unit — no matter how small the injury or how long ago it occurred.
  • All wounds should be irrigated with water and soap for at least 5 minutes, as soon as possible after the injury occurs, followed by application of povidone–iodine or alcohol.
  • If a clinically significant potential exposure is identified, in liaison with your local public health unit, post-exposure prophylaxis, using human rabies immunoglobulin and rabies vaccine as indicated, should be commenced.
  • Standard infection control precautions, including the use of eye protection, gowns, gloves and masks during aerosol-generating procedures, should be employed when managing patients with Australian bat lyssavirus infection.

An outbreak of enterovirus 71 in metropolitan Sydney: enhanced surveillance and lessons learnt

Enterovirus infections, although commonly asymptomatic, may also be associated with a wide range of clinical diseases including hand, foot and mouth disease (HFMD), herpangina, aseptic meningitis and acute flaccid paralysis.1 Transmission of enteroviruses can occur directly by the faecal–oral route, from contaminated environmental sources, or by respiratory droplet transmission.1

Human enterovirus 71 (EV71) is a major cause of HFMD worldwide and, in the past 15 years, has caused large outbreaks in South-East Asia associated with severe neurological disease and deaths.2 Patients with severe and fatal cases of EV71 infection have usually been diagnosed with meningitis, encephalomyelitis or brainstem encephalitis associated with systemic features such as cardiopulmonary compromise and myocarditis.3,4 Large outbreaks of EV71 infection have been reported in Victoria (1986), Perth (1999) and Sydney (2000–2001), and all outbreaks included cases of patients with severe neurological disease.57 Enterovirus infections (apart from poliomyelitis) are not notifiable in New South Wales.

In early March 2013, paediatricians practising in the northern beaches area of Sydney alerted their public health unit (PHU) to an increase in the number of young children presenting with severe neurological manifestations of enterovirus infection. The Sydney Children’s Hospital in the Sydney suburb of Randwick confirmed EV71 infection in two of these cases and suspected infection in others. The PHU interviewed parents of 16 children with suspected cases, but identified no point sources of infection. The PHU issued alerts to clinicians and the local community, and the Sydney Children’s Hospitals Network circulated advice to clinical staff on diagnosing and managing patients with suspected neurological complications of enterovirus infection.

Also in March 2013, New South Wales Health issued a statewide media release and alerts to general practitioners, emergency departments (EDs), paediatricians and neurologists, and established an enhanced surveillance system focusing on children with severe enterovirus infection. The aims of this surveillance were to describe the extent of the outbreak and the clinical features of cases to aid in their identification and management. Here, we report on the findings of this surveillance.

Methods

The enhanced enterovirus surveillance system had two arms. The first used the existing NSW Public Health Real-time Emergency Department Surveillance System (PHREDSS) to monitor ED presentations and admissions from 14 April to 2 June 2013 of children aged less than 10 years with a provisional diagnosis of HFMD or “meningitis or encephalitis”. The resulting data were compared with historical data retrospectively available from PHREDSS, which collects information on all visits to 59 NSW EDs, and includes about 84% of ED activity in the state.8

The second arm was enhanced surveillance established at the Sydney Children’s Hospitals Network (Sydney Children’s Hospital at Randwick and The Children’s Hospital at Westmead). Cases were defined as children aged under 10 years admitted from 1 January to 2 June 2013 with suspected or confirmed enterovirus infections and with neurological diagnoses (meningitis, encephalitis, meningoencephalitis, acute flaccid paralysis or transverse myelitis).

Cases of suspected EV71 infection for the period 1 January to 13 April 2013 were identified retrospectively through review of daily hospital admission lists. Only demographic and laboratory testing data were collected for these patients.

From 14 April to 2 June 2013, hospital admission lists were reviewed daily by designated clinical staff. Clinical features, treatment and final diagnosis were gathered for all suspected cases of EV71 infection. Respiratory, stool and/or cerebrospinal fluid samples were tested for enterovirus with standard nucleic acid test kits. A subset of samples that tested positive were referred to either of the two state enterovirus reference laboratories for EV71 typing. Both suspected and confirmed cases were included in the analysis. Presence of the virus in samples from non-sterile sites might indicate coincidental carriage, but in samples from sterile sites, the viral load is often low.911

Results

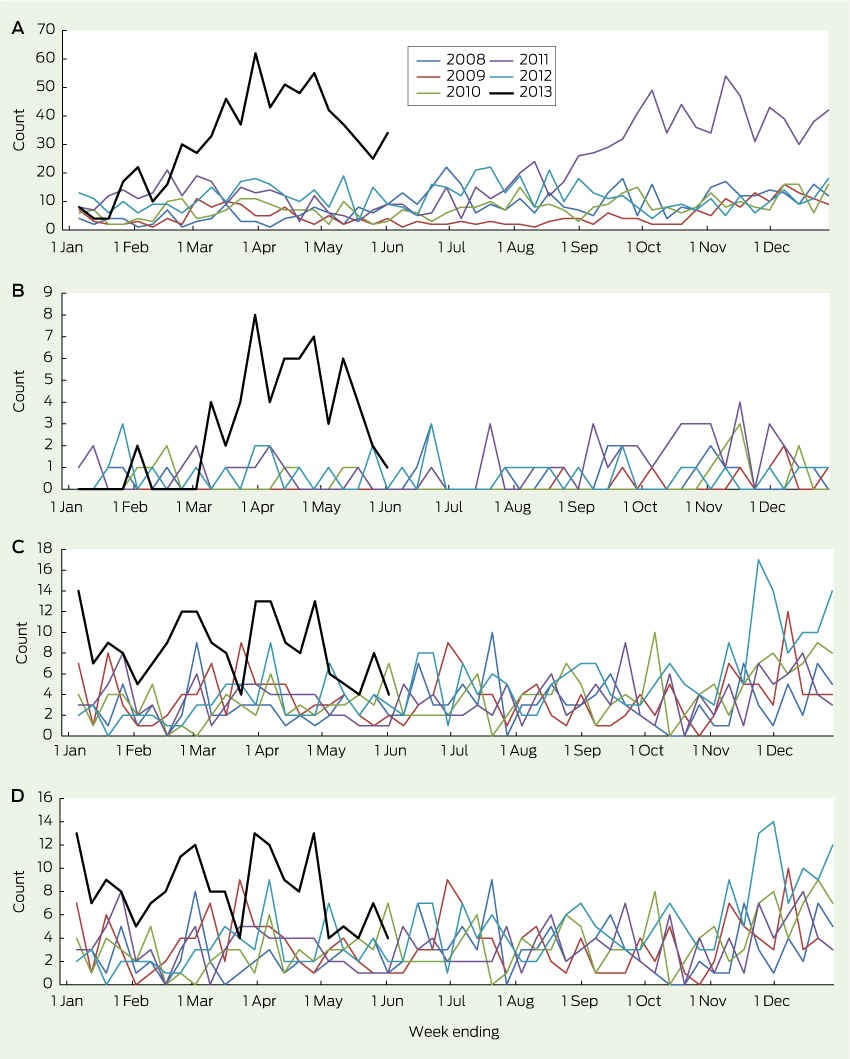
Presentations to EDs for HFMD in children aged under 10 years began to rise in February 2013, peaked in late March, then remained above the usual range through to June (Box 1, A). This was temporally associated with a sharp rise in the number of children with HFMD who required hospital admission (Box 1, B). Presentations to EDs for HFMD also rose in the final quarter of 2011, but without an increase in resulting admissions, indicating that the outbreak of 2013 may have been associated with more severe illness.

The number of ED presentations of children with “meningitis and encephalitis” began to increase in mid November 2012 and remained above the usual range until June 2013 (Box 1, C). Most of these children were admitted, consistent with historical trends (Box 1, D).

Between 1 January and 2 June 2013, 119 cases of suspected EV71 infection were identified in the Sydney Children’s Hospitals Network. Suspected cases were evenly distributed between the two hospitals (53% at Sydney Children’s Hospital at Randwick and 47% at The Children’s Hospital at Westmead). The median age of infected children was 19 months (range, 1 month to 10 years) and 47% were female.

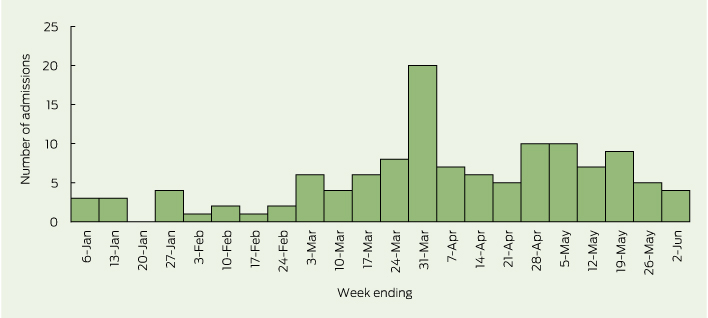
The weekly number of suspected cases rose sharply at the beginning of March 2013, and peaked at 20 cases in the final week of that month (Box 2). A second, smaller rise was noted in late April and May 2013.

Although cases of suspected EV71 infection were widely spread within the Sydney metropolitan area, Sydney’s northern beaches, central parts of Western Sydney and the eastern suburbs experienced more intense activity. Most suspected cases in the March 2013 peak came from the coastal areas of Sydney, particularly the northern beaches and eastern suburbs. During April and May, the number of suspected cases coming from the eastern suburbs remained stable, while the numbers from western Sydney increased and from Sydney’s northern beaches declined sharply.

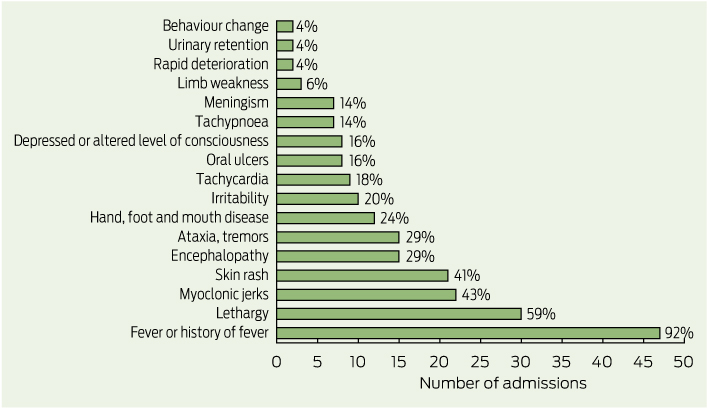
Case forms were completed for all 50 children with suspected EV71 infection who presented between 14 April and 2 June 2013. The most common presenting clinical features were fever (47 children), lethargy (30 children), myoclonic jerks (22 children) and skin rash (21 children) (Box 3). Only 12 children (24%) presented with signs or symptoms of HFMD. The average length of hospital stay was 4.2 days. Five of the 50 children were admitted to an intensive care unit (ICU) and three of these required intubation. The average length of stay in the ICU was 2.4 days. Two children with suspected EV71 infection were treated with intravenous immunoglobulin and six received corticosteroids. The most common diagnoses at discharge were meningitis (15 children), encephalomyelitis (10 children), myoclonus (seven children) and viral meningitis (six children).

Of the 50 children with suspected EV71 infections and completed case forms, 45 tested positive for enterovirus. Infections were typed for 37 of these, and 18 cases were confirmed to be EV71. Other enteroviruses identified included coxsackieviruses (11 children) and echoviruses (four children). Two children had both EV71 and a coxsackievirus, and two had both coxsackieviruses and echoviruses.

Discussion

EV71 emerged as an important cause of severe neurological disease in young Sydney children during the first half of 2013. Activity peaked in March 2013. The focus of the outbreak moved from Sydney’s northern beaches area to its eastern and western suburbs over several weeks. Myoclonic jerks were a relatively common feature of severe infection.

A number of countries in Asia have implemented HFMD surveillance programs in the past 15 years.2,12 HFMD and enterovirus infection are not notifiable diseases in NSW, as most infections are asymptomatic or mild, and many patients are unlikely to see a doctor. This means that notification does not provide a mechanism for developing meaningful patient-based interventions to interrupt transmission. Population-based disease-control measures focus instead on personal hygiene and sanitation. The effect of social-distancing measures, including the closure of childcare facilities,13 has been questioned given the limited evidence for its efficacy, the unquantified but likely substantial socioeconomic costs, and the risk of prolonging the epidemic.1

Two previous studies have suggested that EV71 epidemic activity has followed the introduction of circulating genotypes from Asia into Australia.14,15 EV71 was detected in samples from five patients with acute flaccid paralysis and other patients with suspected enterovirus infections in early 2013, and phylogenetic analysis showed homology with the EV71 C4a subgenogroup circulating in Asia, which was associated with severe neurological complications.16

Our report has important limitations. First, the use of syndromic ED surveillance has uncertain sensitivity and specificity for enterovirus infections. The positive predictive value of syndromic diagnoses would, however, be expected to rise during recognised outbreaks. Second, enhanced surveillance focused on two sentinel children’s hospitals. Other infected patients are likely to have presented to other hospitals in and outside Sydney. Third, before enhanced surveillance, further typing of samples testing positive for enterovirus was not routine practice, so many samples collected between 1 January and 14 April were not typed. Fourth, our description of suspected cases included some patients who were not confirmed to have EV71 infection, so may not truly represent the severe outcomes of the infection.

The continued escalation of EV71 epidemics in Asia, and evidence of the introduction of the EV71 strain into Australia from Asia suggest that enterovirus may continue to be a public health problem here. The results of a Phase III clinical trial of a vaccine were recently published,17 but vaccines have limitations.18 Other vaccines are being developed, and perhaps EV71 will become vaccine-preventable. The use of routinely collected ED data appears to be a useful and efficient method for monitoring enterovirus infections, including the more severe outcomes associated with EV71 epidemics.8

1 Total weekly counts of emergency department presentations (A) and admissions (B) for hand, foot and mouth disease, and emergency department presentations (C) and admissions (D) for “meningitis or encephalitis” for children aged less than 10 years at 59 New South Wales hospitals — 2013 up to 2 June (black line) compared with each of the 5 previous years

2 Weekly number of children aged less than 10 years admitted to the Sydney Children’s Hospitals Network between 1 January and 2 June 2013 with clinical features of meningitis, encephalitis, meningoencephalitis, acute flaccid paralysis or transverse myelitis and suspected or confirmed enterovirus infection

3 Reported presenting clinical features for suspected or confirmed cases of enterovirus 71 infection in children aged less than 10 years admitted to the Sydney Children’s Hospitals Network, 14 April to 2 June, 2013

Australia-wide point prevalence survey of the use and appropriateness of antimicrobial prescribing for children in hospital

The threat of antimicrobial resistance and its impact on health care settings globally are well recognised, and a multifaceted and coordinated response is required.13 Antimicrobial use is the main driver of the development of resistance and, as such, advocacy for rational use of existing antimicrobial drugs — antimicrobial stewardship (AMS) — is vital for preventing the development of resistance.4,5 Very few new antimicrobials are in the drug discovery pipeline so ensuring that the right drug is prescribed in the right dose, via the right route and for the right duration is critical.6 In contrast, AMS interventions are readily available and have shown promise in delivering improvement in measures of process and outcome.7,8

Design and implementation of effective and efficient AMS interventions are reliant on data regarding current antimicrobial prescribing patterns. There is a paucity of such data for hospitalised children.911 We aimed to address this evidence gap by using a point prevalence survey (PPS) to describe antimicrobial use in hospitalised Australian children, analyse the appropriateness of this antimicrobial use and identify potential opportunities for quality improvement.

Methods

In conjunction with the Antibiotic Resistance and Prescribing in European Children (ARPEC) study,11 eight Australian paediatric hospitals across five states participated in a single-day hospital-wide PPS of antimicrobial prescribing in late spring and early summer 2012: the Royal Children’s Hospital Melbourne (Victoria, 14 November 2012), Monash Children’s Hospital (Victoria, 22 November 2012), Sydney Children’s Hospital (New South Wales, 18 October 2012), Children’s Hospital at Westmead (New South Wales, 6 December 2012), Mater Children’s Hospital (Queensland, 15 November 2012), Royal Children’s Hospital (Queensland, 15 November 2012), Women’s and Children’s Hospital (South Australia, 14 November 2012) and Princess Margaret Hospital for Children (Western Australia, 16 November 2012). Children and adolescents who were inpatients at 8 am on the day of the survey were included.

De-identified data were collected and entered on standardised data collection forms, which were submitted to the ARPEC web-based data-entry system. Institution and department was recorded for all patients. For those receiving antimicrobials (including antivirals), data on the following were also collected: age; sex; weight; comorbid conditions; antimicrobial drugs that were given (including dose, dosing interval, route of administration and duration of use); whether the indication for antimicrobial treatment was a community- or hospital-acquired infection (with the latter defined as symptoms starting > 48 hours after admission), or prophylaxis; and whether the antimicrobial treatment was empirical or targeted.

Appropriateness of antimicrobial prescribing was also assessed. At six hospitals, this was determined by two senior infectious diseases physicians and/or AMS pharmacists; at the other two hospitals, one clinician performed this role. Appropriateness was assessed on the basis of the clinical scenario, including microbiological findings, institutional antimicrobial resistance patterns, and institutional treatment guidelines, where available. Standardised terminology was applied to describe appropriateness (Box 1).

Where required, ethics approval was received from respective institutional human research ethics committees.

Results

Point prevalence survey

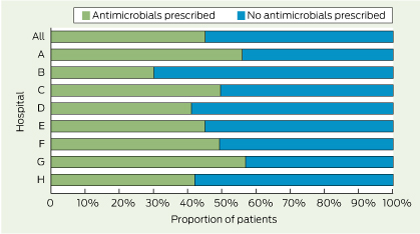
At the eight participating hospitals, the numbers of beds ranged from 120 to 300 and bed occupancy ranged from 62% to 98%. Of 1373 patients included in the study, 631 (46%) were prescribed at least one antimicrobial agent (Box 2), or 583 (42%) if topical agents (eg, orally administered, non-absorbed drugs such as oral nystatin) are not considered. Of the 631 patients receiving antimicrobials, 143 (23%) were < 3 months old and 198 (31%) were < 1 year old. The most common underlying conditions among those prescribed at least one antimicrobial were haematological and oncological conditions (17% [106 patients]), non-cardiac surgical diseases (13% [85]) and chronic neurological conditions including cerebral palsy (8% [51]).

The hospital units with the highest rates of antimicrobial prescribing were haematology and oncology wards and paediatric intensive care units (PICUs) (in which, overall, 76% [95/125] and 55% [44/80] of patients, respectively, were receiving ≥ 1 antimicrobial). Neonatal units had the most variation in rates of antimicrobial prescribing (range, 32% [21/65] to 96% [23/24]) (Appendix 1).

There were 1174 antimicrobial prescriptions: 550 (47%) for community-acquired infections, 175 (15%) for hospital-acquired infections, 437 (37%) for prophylaxis (for surgery or a medical condition), and 12 (1%) for indications that were not recorded. Empirical treatment accounted for 72% of prescriptions for community-acquired infections (395/550), but only 58% of prescriptions for hospital-acquired infections (102/175).

Of the 550 prescriptions for community-acquired infections, the commonest indications were lower respiratory tract infection (22% [122 prescriptions]), surgical infection (13% [71]) and sepsis (10% [57]). Of the 175 prescriptions for hospital-acquired infections, the commonest indications were sepsis (18% [32]), surgical infection (13% [22]), lower respiratory tract infection (12% [21]) and febrile neutropenia (12% [21]).

The number of antimicrobial prescriptions for all indications accounting for 50% of use when ranked by frequency of prescribing (DU50% [drug utilisation 50%]) was eight (Box 3). The number of antimicrobial prescriptions accounting for 90% of use (DU90%) was 27.

Of the 1174 prescriptions for antimicrobials, 915 (78%) were for antibacterials, of which most (72% [661 prescriptions]) were for treatment, as opposed to prophylaxis. There were 207 prescriptions for antifungals (18%) and 52 prescriptions for antivirals (4%), both used predominantly for prophylaxis (Appendix 2).

Of the 915 prescriptions for antibacterials, the three most commonly prescribed classes of antibacterials for all indications were: narrow-spectrum penicillins (penicillins V and G, aminopenicillins and antistaphylococcal penicillins; 18% [164 prescriptions]), β-lactam–β-lactamase inhibitor combinations (15% [136]) and aminoglycosides (14% [128]) (Box 4, Appendix 3, Appendix 4). Considering the 661 antibacterial prescriptions that were for treatment, the most commonly prescribed antibacterials were gentamicin (12% [77]), piperacillin–tazobactam (8% [54]), cefotaxime (8% [51]) and flucloxacillin (7% [48]). Only three of the antibacterial prescriptions were for topical agents.

Appropriateness of prescribing

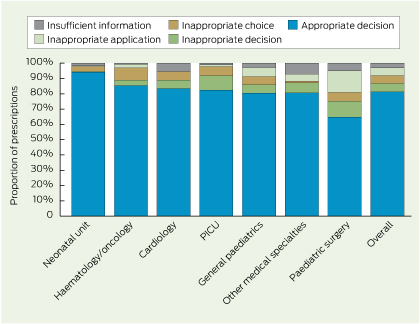
Of the 631 patients receiving antimicrobials, 177 (28%) were receiving at least one prescription that was deemed to be inappropriate. Of the 1174 prescriptions, 957 (82%) were deemed appropriate. At individual hospitals, the proportion of prescriptions that were appropriate ranged from 66% (74/112) to 95% (165/174). Similar variation was observed between specialties (range, 65% [122/187] to 94% [204/217]) (Box 5). Of the 217 prescriptions deemed inappropriate, for more than one reason in some cases, 65 (30%) involved an inappropriate decision to use antimicrobials, 60 (28%) involved an inappropriate choice of antimicrobials, 73 (34%) involved an inappropriate application, and 32 (15%) lacked sufficient information to assess appropriateness.

The highest rate of prescriptions deemed inappropriate was in surgical patients. Of 131 surgical patients (21% of patients who received antimicrobials), 53 (40%) received at least one prescription deemed inappropriate, and this corresponded with 65 of 187 antimicrobial prescriptions for surgical patients (35%). Of these 65 prescriptions, 21 involved an inappropriate decision, usually to continue perioperative prophylaxis for longer than 24 hours, and 11 involved an inappropriate choice (Box 5).

Antimicrobial prescriptions that were deemed to diverge unnecessarily from antimicrobial guidelines or considered “too broad” included four of 18 prescriptions for carbapenem, seven of 48 for glycopeptides, seven of 93 for third-generation cephalosporins, two of 27 for fluoroquinolones and eight of 136 for β-lactam–β-lactamase inhibitor combinations.

Discussion

This is the first truly representative nationwide PPS in which every stand-alone children’s hospital participated. Very few multicentre surveys have been undertaken in children9,11,12 and this is the second to incorporate an analysis of appropriateness of antimicrobial prescribing.12

The results confirm that antimicrobials are frequently prescribed to children in Australian paediatric hospitals. The overall rate of 46% is comparable to the average rate of 44% for hospitalised children in non-European countries and markedly higher than the average rate of 35% for hospitalised children in European countries.11 Our finding that about one-third of patients receiving antimicrobials were < 1 year old is similar to findings from other studies,9,11 and is related to the higher incidence of bacterial infection in this age group.

Consistent with other surveys of patients, the highest rates of antimicrobial use were in patients with haematological and oncological conditions (76%) and patients in PICUs (55%). Previous surveys in PICUs in the United States, Turkey and Italy have found that 51%–76% of patients were receiving antimicrobials.10,1214 An ARPEC PPS showed similar rates for antibiotic use in PICUs (56%) and lower rates in haematology and oncology wards (61%).11 AMS intervention studies have focused on these settings and other clinical areas in which antimicrobial use is high.

The most common infections for which antimicrobials were prescribed in our study were similar to those reported in a similar survey in which data on diagnoses were collected.12 The relatively low rates of respiratory infection in our study are likely to reflect the time of year in which the data were collected — late spring and early summer, rather than winter. The limited detail beyond site of infection recorded in most surveys of adult inpatients limits attempts at meaningful comparisons.1517

As evidenced by the DU90%, the range of antimicrobials used was wide. Gentamicin was the most commonly prescribed individual antibacterial agent, reflecting the use of aminoglycosides as first-line therapy in children. This contrasts with the trend in adult medicine, highlighting the importance of paediatric-specific studies. Third- and fourth-generation cephalosporin use, which has been recognised as a driver of resistance, was variable between hospitals, with the differences most likely related to differences in local empirical guidelines (Appendix 3). Low rates of vancomycin, clindamycin and linezolid use reflect the low rates of drug resistance among gram-positive organisms isolated from children at Australian paediatric hospitals.18

While a PPS is not adequately powered to determine statistical differences in prescribing patterns between hospitals, the variation between hospitals that we observed likely reflects differences in paediatric tertiary care in Australia, with intensive care, haematology, oncology, and specialty medical and surgical services asymmetrically distributed within cities and between states.4 Specialised services such as extracorporeal support, complex surgery for congenital cardiac conditions and haematopoietic stem-cell transplantation are further concentrated in very few hospitals nationwide. Other factors that are likely to have contributed to the variation include the paucity of evidence regarding antimicrobial prescribing for many childhood infections and different local patterns of antimicrobial resistance. The high proportion of empirical prescriptions may reflect difficulty in obtaining high-quality microbiological samples before prescribing antimicrobials in children and the low priority placed on ideal specimen collection in some contexts. These factors emphasise the need for specific paediatric guidelines for empirical antimicrobial treatment and for standards to guide timely collection of appropriate microbiological specimens.

In this study, as in everyday practice, appropriateness was determined by local clinicians (infectious diseases physicians and/or pharmacists) familiar with individual patient clinical and microbiological findings, local antimicrobial resistance patterns, institution-specific guidelines for empirical therapy and principles of AMS. Of the eight hospitals that participated, seven had guidelines for empirical treatment of common community-acquired infections of childhood against which appropriateness was judged.4 Overall, a high proportion (82%) of prescriptions were deemed appropriate. While 28% of patients received at least one inappropriately prescribed drug, this compared favourably with 47% of patients in the Turkish survey.12

While some of the variation in appropriateness between hospitals in our study (66%–95%) may represent differences in quality of prescribing, this is unlikely to be a major factor in tertiary children’s hospitals throughout the same country. A single-day PPS is not designed to investigate alternative explanations such as differences in AMS resources (eg, different robustness of restricted drug approval systems) and differences in opinions of assessors. Although reporting was standardised in our study, even the clinicians who were experienced in AMS are likely to have differed in how they assessed appropriateness. In a PICU study, the proportion of antimicrobial prescriptions deemed appropriate varied depending on the assessor’s specialty: intensivists judged 82% appropriate; infectious diseases physicians, 69%; and pharmacists, 45%.10 This may have been because of differences of opinion, or systematic bias in overestimating or underestimating appropriateness depending on differing agendas. In our study, no clear difference was found in the overall assessments between physicians and pharmacists (data not shown).

A PPS is not useful for assessing appropriateness of antimicrobial prescribing against a gold standard (which does not exist for paediatric infections) or for subgroup analyses (for which the format is inadequately powered). Rather, it is useful for identifying under-recognised areas of prescribing that do not meet AMS expectations. Therefore, of more use than differences between hospitals is the analysis between specialties across all hospitals, as this transcends potential individual bias. It is encouraging that haematology and oncology wards and PICUs, which had the highest rates of antimicrobial prescribing, had among the highest rates of appropriateness (83% and 82% of prescriptions, respectively [Box 5]) — a finding mirrored in the Turkish survey.12 However, these specialties frequently have the most patients with complex conditions who are receiving the broadest spectrum antimicrobials, so inappropriate prescribing in these specialties is likely to have the greatest effect on resistance for individual patients, the unit and the hospital.19 Therefore ongoing quality improvement endeavours are vital.

Even greater capacity for improvement may lie in areas with lower rates of prescribing but higher patient throughput. With 40% of surgical patients receiving at least one antimicrobial prescription deemed inappropriate, one area for targeting would be the use of perioperative prophylaxis, for which there are consensus guidelines.20 In the Turkish survey, the highest rates of inappropriate prescribing were also in surgical patients, with 80% of patients receiving at least one inappropriately prescribed drug.12 AMS interventions in high-intensity environments often require proportionally intense involvement by AMS practitioners. In less complex areas, such as perioperative prophylaxis, AMS principles may be more easily systematised, with consequent better use of resources. Examples include institutional perioperative prophylaxis protocols with automatic stop orders at 24 hours and a requirement for evidence to support continuation of antimicrobial therapy for longer. The prospect is for AMS principles to be incorporated at a system level in all aspects of antimicrobial prescribing: decision making (to prescribe or not to prescribe antimicrobials), choice of regimen (supported by evidence-based, locally relevant guidelines) and application (particularly duration of use and switching from intravenous to oral administration).21

The strengths of this survey lie in its comprehensive nature, with the inclusion of every children’s hospital in Australia and every patient receiving antimicrobials. In the absence of electronic prescribing, a PPS is the only way to obtain such a comprehensive picture of antimicrobial use in children. Survey methods that are commonly used for adult patient populations do not take body weight into account, so are inappropriate for use in paediatric patient populations. Survey methods based on numbers of days of therapy are dependent on laborious medical record audits and are therefore usually only viable in settings that use electronic prescribing. A PPS offers relatively high-fidelity, cross-sectional quantitative insight into patterns of antimicrobial use.22 While labour intensive on the day, it is straightforward and does not require electronic systems, and is therefore appealing in resource-poor settings. Our survey method was designed by the ARPEC team and piloted across multiple centres for validation purposes.11 It provides uniformity of data collection We increased the usefulness of our survey by adding an analysis of appropriateness.

A PPS has several limitations. The cross-sectional nature does not capture duration of antimicrobial therapy or prescribing at hospital discharge. Data that were not collected but would be useful for future surveys include specific infections that were identified and whether suitable microbiological specimens were collected. Also, there is no validated method for assessing appropriateness, and application of the tool by different individuals is likely to result is slight variation. Finally, although patient notes and charts were referred to on the day, subtleties in discussion relating to decision making may have been missed.

Our study shows the viability and value of multicentre PPSs and appropriateness surveys for acquiring cross-sectional data regarding quantity and quality of antimicrobial prescribing for hospitalised children. It provides a baseline for ongoing audits by AMS teams, conducted in individual hospitals and as multisite collaborations. As hospitals adopt integrated electronic medical record and prescribing systems, there is a new opportunity to incorporate AMS principles into day-to-day hospital work via decision-support algorithms, and subsequently move to a system of continuous prospective monitoring of prescribing patterns.21

1 Criteria for categorising appropriateness of antimicrobial prescribing*

Appropriate decision

  • Correct choice of antimicrobial and correct application
  • Correct choice of antimicrobial and incorrect application

Inappropriate decision

  • No infection, no prophylaxis needed and no antimicrobial needed
  • No infection, antimicrobial used as prophylaxis and no antimicrobial needed

Inappropriate choice

  • Antimicrobial needed but different from the one used — unnecessary diversion from antimicrobial guidelines or considered “too broad”
  • Antimicrobial needed but different from the one used — not sufficient for indication or considered “too narrow”

Incorrect application

  • Incorrect dose
  • Incorrect dosing interval
  • Incorrect route of administration
  • Incorrect duration of use (too long)

Insufficient information

  • No infection, insufficient information on whether antimicrobial was needed
  • Insufficient information about infection
  • Infection present, antimicrobial needed, insufficient information on whether choice and application were correct

* More than one criterion per prescription may apply.

2 Proportions of patients at Australian paediatric hospitals who were and were not prescribed antimicrobials

3 Antimicrobial prescriptions* accounting for 50% of use when ranked by frequency of prescribing, for patients at Australian paediatric hospitals


No. (%) of all antimicrobial prescriptions (n = 1174)

No. (%) used for treatment

No. used for targeted treatment

No. (%) used for prophylaxis


Nystatin

122 (10%)

0

Not applicable

122 (100%)

Gentamicin

102 (9%)

77 (75%)

9

25 (25%)

Trimethoprim–sulfamethoxazole

87 (7%)

20 (23%)

7

67 (77%)

Amoxycillin or ampicillin

61 (5%)

40 (66%)

3

21 (34%)

Cefotaxime

61 (5%)

51 (84%)

13

10 (16%)

Piperacillin–tazobactam

59 (5%)

54 (92%)

9

5 (8%)

Cephazolin

57 (5%)

13 (23%)

2

44 (77%)

Flucloxacillin

51 (4%)

48 (94%)

21

3 (6%)


* For all indications.

4 Systemic antibacterial prescriptions for all indications, for patients at Australian paediatric hospitals


Hospital


All

A

B

C

D

E

F

G

H


Numbers of patients receiving ≥ 1 systemic antibacterial

558

98

65

41

62

47

126

54

65

Numbers of prescriptions for systemic antibacterials


Total

912

142

106

72

100

77

222

88

105

β-lactam–β-lactamase inhibitor combinations

136

24

13

3

21

13

31

14

17

Aminoglycosides

128

16

19

12

15

9

29

8

20

Penicillins (penicillins V and G, aminopenicillins)

113

15

16

18

11

8

22

6

17

Cephalosporins — 3rd or 4th generation

93

12

13

11

10

11

13

12

11

Trimethoprim–sulfamethoxazole

87

21

0

7

4

11

27

9

8

Cephalosporins — 1st or 2nd generation

76

20

7

1

9

6

20

8

5

Antistaphylococcal penicillins

51

4

11

1

3

5

15

8

4

Glycopeptides

48

7

5

6

4

1

15

2

8

Macrolides

41

5

4

3

4

6

11

5

3

Metronidazole

37

7

5

4

0

0

15

4

2

Fluoroquinolones

29

5

2

0

3

3

11

3

2

Carbapenems

18

4

0

4

1

3

1

2

3

Lincosamides

18

1

2

1

6

0

4

1

3

Rifampicin

8

0

2

0

2

0

4

0

0

Colistin

4

0

1

0

0

0

0

2

1

Tetracyclines

4

0

1

0

0

0

0

3

0

Linezolid

3

1

0

0

1

0

0

0

1

5 Appropriateness of antimicrobial prescriptions, by specialty, for patients at Australian paediatric hospitals


PICU = paediatric intensive care unit.

Cytomegalovirus disease in immunocompetent adults

Cytomegalovirus (CMV) is an internationally ubiquitous human herpes virus with a worldwide seroprevalence ranging from 45% to 100%.1 A national serosurvey in 2006 estimated that 57% of Australians between the ages of 1 and 59 years were seropositive.2 While primary CMV infection is common in the general community, it is usually asymptomatic or causes a mild mononucleosis-like syndrome.3 The viraemic phase is generally self-limiting in healthy adults, and is followed by a lifelong bloodborne latent phase within peripheral monocytes and CD34+ myeloid progenitor cells4 (Box 1).

However, in certain circumstances CMV infection is capable of producing severe, life-threatening disease, including a wide range of potential clinical manifestations, owing to systemic haematogenous dissemination and a very broad tissue tropism6 (Box 2). Typically, severe CMV disease occurs in the context of an immature, suppressed or compromised immune system, and can lead to death or permanent major sequelae.7 As such, severe CMV infection is a well recognised cause of morbidity and mortality in neonates and immunocompromised adults, such as pharmacologically immunosuppressed transplant recipients and patients with AIDS.7

CMV disease in immunocompetent adults

While CMV is a well recognised pathogen in neonates and immunocompromised adults, the burden of CMV disease in immunocompetent adults is less well understood. This is because severe CMV disease is of considerably lower incidence in this population. However, it is far from non-existent; over 380 published case reports document instances of severe tissue-invasive CMV infection in immunocompetent adults. Similarly to CMV disease in immunocompromised individuals, these cases show a wide range of manifestations, including colitis,9 vascular thrombosis,10 pneumonia11 and myocarditis.12

The most comprehensive evaluation of severe CMV infection in immunocompetent adults to date included a systematic meta-analysis of case reports and reviews documenting 290 instances, across all manifestations.8 This study found that CMV infection most commonly involved the gastrointestinal tract (primarily colitis), followed by the central nervous system (including meningitis, encephalitis and myelitis) and then haematological abnormalities (including haemolytic anaemia and thrombocytopenia). CMV disease of the eye, liver, lung and vasculature were also documented, among other conditions. The authors ultimately concluded that the incidence of severe manifestations of CMV infection in immunocompetent individuals appeared to be significantly more common than previously appreciated.8

It should be noted that the definition of immunocompetency in this analysis, like most published reviews and case reports, excluded only individuals with profound loss of immune function, including patients who had AIDS, pharmacologically immunosuppressed transplant recipients and chemotherapy recipients. However, many case reports of CMV disease in “immunocompetent” adults document comorbidities that may be associated with a degree of immune dysfunction, such as diabetes mellitus or renal failure. Indeed, studies have also shown an increased risk of CMV-related morbidity and mortality in “immunocompetent” critically ill patients.13 It is therefore highly feasible that partial immune dysfunction may represent a currently overlooked risk factor for severe CMV disease. As such, further studies are needed to evaluate the risk of CMV disease in these populations. Nonetheless, this possibility reinforces the importance of considering CMV as a potential infectious agent even in patients with a low degree of immune dysfunction.

Diagnostic challenge of CMV disease

Although uncommon, severe CMV infection in immunocompetent adults often poses a significant diagnostic challenge, and a number of case reports have documented considerable delay to diagnosis.1416 Some patients with CMV colitis, in particular, have had protracted hospitalisations and have undergone surgery to investigate persistent and undiagnosed disease.

The diagnostic difficulty in CMV disease arises from three factors. First, the low incidence of severe CMV disease in immunocompetent individuals warrants a lower index of clinical suspicion for CMV infection at initial presentation. Second, CMV disease can present with a wide array of potential clinical manifestations, owing to broad tissue tropism. Third, certain presentations of CMV disease strongly mimic other diseases, potentially causing diagnostic confusion and delay in diagnosis. Indeed, case studies have documented initial misdiagnoses of colon carcinoma,14 ischaemic colitis,15 inflammatory bowel disease,16 dengue fever17 and lung cancer,18 among others.

Notable case studies

Siegal and colleagues documented the case of an 82-year-old man presenting with a 2-day history of diarrhoea and epigastric pain.15 Non-contrast computed tomography (CT) showed faecal impaction and thickening of the wall of the distal colon, with generalised large-bowel dilatation. Despite repeated negative results from assays for Clostridium difficile toxin, antibiotics were administered. There was no clinical improvement. Sigmoidoscopy and biopsy during the second week of admission showed acute inflammation and lymphoid aggregates, but did not lead to a diagnosis. The patient was treated with mesalamine for suspected ulcerative colitis, with minimal effect. A positive faecal occult blood test result raised the suspicion of ischaemic colitis. However, repeat sigmoidoscopy and biopsy at 1 month after admission showed mucosal ulceration with viral inclusions diagnostic of CMV infection, and treatment with intravenous (IV) ganciclovir was commenced. The authors concluded that CMV should be considered as a potential aetiological agent of severe colitis in immunocompetent individuals when other differentials have been excluded.15

A case study by Falagas and colleagues highlighted the diagnostic difficulty posed by CMV disease in non-immunocompromised adults.14 In this instance, a 57-year-old, HIV-negative man with chronic renal failure presented with acute abdominal pain, diarrhoea, and per rectal bleeding. Colonoscopy showed a large polypoid mass in the hepatic flexure, suspicious for colorectal carcinoma, although a colonic biopsy specimen did not show neoplastic changes. The results of subsequent CT scanning, stool examination and a C. difficile toxin assay were normal. Recurrent symptoms prompted an exploratory laparotomy and right hemicolectomy on Day 9 of admission, at which time histological analysis showed intranuclear inclusions diagnostic of CMV disease. The patient commenced a 2-week course of IV ganciclovir, and his symptoms subsequently abated. The authors concluded that the endoscopic findings of CMV colitis may resemble colon carcinoma and should be considered as a differential diagnosis, even in patients without severe immunosuppression.14

Yu and colleagues published a case report of a 39-year-old woman with a 6-week history of fever of unknown origin who was referred to a tertiary hospital.19 Her liver enzyme levels were elevated, and an abdominal CT scan was consistent with acute hepatitis. Results of serological screening for hepatitis A, B and C viruses, Epstein–Barr virus and HIV were negative. The result of a CMV-polymerase chain reaction (PCR) analysis was positive, and other causes (including drug-induced and autoimmune) were excluded. The severity and progressive nature of the disease necessitated urgent living-donor liver transplantation. A biopsy specimen from her explant liver showed widespread hepatic necrosis and stained positive for CMV protein. Initially, no antiviral therapy was commenced. The patient’s postoperative course was characterised by a rising serum bilirubin level and CMV antigenaemia. A liver biopsy specimen taken on Day 14 after the operation showed moderate degenerative changes and stained positive for CMV protein, at which point IV ganciclovir therapy was initiated, leading to improvement in her clinical condition and liver function. The authors concluded that CMV should be investigated as a potential cause of severe hepatitis, regardless of the patient’s immune status, after more common aetiologies have been excluded.19

Clinical implications

Delayed diagnosis of CMV disease in immunocompetent adults creates the potential for numerous adverse outcomes. Delay in initiation of targeted therapy leads to increasing morbidity and mortality as a result of disease progression. Prolonged hospitalisation is associated with health risks such as nosocomial infection and venous thromboembolism. Patients may also receive unnecessary radiation exposure from repeated CT imaging and be exposed to risks associated with surgical interventions. In addition, financial costs associated with extended hospitalisation and the potential for numerous investigations, surgery and intensive care unit admission are substantial. These consequences of diagnostic delay are of particular note, given the availability of non-invasive diagnostic testing for CMV infection, including serological tests, CMV-PCR and viral culture.20

Treatment of CMV disease in immunocompetent adults

While ganciclovir or valganciclovir are currently recommended as first-line treatment for severe CMV disease in immunocompromised adults, few studies have appropriately evaluated the use of these antiviral agents for the treatment of severe CMV disease in immunocompetent adults. These agents may have major side effects, including myelosuppression and potential carcinogenicity. However, untreated CMV disease is associated with considerable morbidity and mortality, and published case studies and reviews provide consistent case-based evidence of rapid clinical improvement after commencement of therapy in this clinical setting.3,11,17,2123 Furthermore, a recent study found ganciclovir to be a safe and effective treatment for CMV-associated pneumonia in immunocompetent children.24 Therefore, the continued use of antivirals for the treatment of very likely or proven CMV disease in immunocompetent adults appears justified at present. While formal studies evaluating the efficacy and utility of these therapies in the context of immunocompetency would be beneficial, such studies would be difficult to pursue, given the low incidence of severe CMV disease in this population.3

Conclusion

Although severe CMV disease primarily occurs in neonates or severely immunocompromised adults, the burden of disease in immunocompetent adults appears to be greater than previously understood. This may be partly owing to underrecognised risk from immune dysfunction associated with comorbidities such as renal failure or diabetes mellitus. It also appears that diagnostic delay is more likely in this clinical setting, especially for instances of CMV colitis, creating the potential for a range of adverse outcomes. Severe CMV disease in immunocompetent adults is likely to remain a diagnostic challenge in many circumstances. However, earlier consideration of CMV as a potential aetiological agent in individuals with atypical or refractory disease, regardless of immune status, may facilitate early non-invasive diagnosis and the initiation of appropriate directed antiviral therapy.

1 Overview of primary and secondary cytomegalovirus (CMV) infection and disease4,5

2 Non-exhaustive list of recognised potential manifestations of cytomegalovirus disease7,8

Direct effects


Gastrointestinal

Cardiovascular

Colitis

Myocarditis

Enteritis

Venous thrombosis

Gastritis

Neurological

Hepatitis

Meningitis

Pancreatitis

Encephalitis

Cholangitis

Myelitis

Respiratory

Retinitis

Pneumonitis

Uveitis

Haematological

Urological

Thrombocytopenia

Nephritis

Leukopenia

Prostatitis

Anaemia


Disseminated intravascular coagulation


Myelodysplastic change


Indirect effects


Atherosclerosis acceleration

Accelerated AIDS progression

Graft dysfunction and rejection

Increased opportunistic infections

The safety of seasonal influenza vaccines in Australian children in 2013

Fever and febrile convulsions in young Australian children were widely reported after vaccination with one brand of influenza vaccine (Fluvax and Fluvax Junior; bioCSL) in 2010.1 This unexpected increase in risk (estimated incidence of 4.4 seizures per 1000 doses) was confirmed in several studies.26 The method of manufacture of the Fluvax vaccine, which unknowingly preserved strain-specific viral components of new influenza strains in 2010, appears to have been responsible for the higher rate of fever in children.7,8 Despite reassuring data on the safety of other brands of influenza vaccine6,9 and the recommendation that Fluvax vaccine not be administered to young children,10,11 there has been a loss of confidence in the safety of influenza vaccines. In Western Australia, where influenza vaccine is available free of charge for all children aged 6 months to < 5 years, influenza (but not other routine) vaccine uptake was substantially reduced in children during 2010–2012.12

To provide more information on the safety of influenza vaccines in children, the Australian Government Department of Health funded a national pilot of active postmarketing surveillance of influenza vaccines registered by the Therapeutic Goods Administration for use in children. As influenza vaccines can vary in composition each year, studies to ensure that each annual vaccine has a consistently low rate of side effects are important. Further, a government review after the adverse events of 2010 suggested that additional surveillance mechanisms to ensure vaccine safety be evaluated.13 Here, we report the results of prospective active surveillance of influenza vaccine safety in children using solicited parent and carer reporting in 2013.

Methods

Parents and carers of all children aged 6 months to < 10 years who received influenza vaccine in outpatient clinics at six paediatric hospitals in Australia (the Children’s Hospital at Westmead, Sydney; Royal Children’s Hospital, Melbourne; Monash Medical Centre, Melbourne; Women’s and Children’s Hospital, Adelaide; Princess Margaret Hospital for Children, Perth; and Royal Children’s Hospital, Brisbane) and from primary health care providers (Central Immunisation Clinic, Perth; and general practices in the Western Sydney Medicare Local, Sydney) were invited to participate in the study. Participation rate was not formally recorded across the sites. In WA, the upper age limit for inclusion was 59 months (< 5 years).

Recruitment commenced on 18 March 2013 and concluded on 19 July 2013. Data on age, sex, presence of any pre-existing chronic medical conditions for which annual influenza vaccine is highly recommended,14 brand of influenza vaccine, and concomitant vaccines received were recorded. Information was collected in a brief telephone interview conducted by surveillance nurses 3–5 days after vaccination.

Antipyretic or analgesic medications were not routinely recommended for children before or after vaccination; their use was at the discretion of the parent or carer.

Approval for this surveillance was granted by the human research ethics committees of each participating hospital and by the Australian Government Department of Health.

Vaccines

Influenza vaccination is recommended and in most cases funded under the National Immunisation Program (NIP) for people in Australia aged ≥ 6 months with conditions predisposing to severe outcomes from influenza infection. Additionally, in WA, influenza vaccine is offered free of charge to all children aged 6–59 months. Influenza vaccines used in 2013 contained the vaccine virus strains: A(H1N1) — an A/California/7/2009(H1N1)-like virus; A(H3N2) — an A/Victoria/361/2011(H3N2)-like virus; and B — a B/Wisconsin/1/2010-like virus. The four vaccines registered and recommended for use in children aged 6 months to < 10 years were Fluarix (GlaxoSmithKline Australia), Vaxigrip (Sanofi Pasteur), Influvac (Abbott Australasia) and Agrippal (Novartis Australia). The vaccines funded under the NIP were Fluarix and Vaxigrip. Fluvax was not included in this study as it is not registered for use in children aged < 5 years and is not recommended for routine use in children aged 5 to < 10 years.15

Outcome measures

Primary outcomes were the frequency within 72 hours after vaccination of systemic reactions (fever, headache, nausea, abdominal symptoms, convulsions, rash, rigors and fatigue) and injection site reactions (erythema, swelling and/or pain at the injection site). All outcome measures were recorded according to information provided by the parent or carer. Fever (or feeling hot) was recorded either by parental report (yes/no) or, if temperature was measured, fever was defined as ≥ 37.5°C by any route. Severity of injection site reactions was recorded for non-WA sites only and was classified on the basis of parental description as: “severe” when erythema or swelling was estimated as ≥ 50 mm diameter and/or pain prevented normal everyday activities or required medical attention; “moderate” when diameter was > 10 to < 50 mm; and “mild” when diameter was ≤ 10 mm. Information was also collected on use of antipyretics or analgesics after vaccination, and whether medical attention or advice was sought.

Sample size calculation and data analysis

The number of study participants was determined from power calculations using estimates of the expected percentage of fever in vaccinees (5%–10%).16,17 A sample size of 865 was calculated to achieve the point estimate with 95% confidence intervals of 2%–5% absolute precision.

Data were recorded in a REDCap online database,18 and Stata/SE version 12.0 (StataCorp) was used for analysis. Subgroup analyses were performed for dose number (1 versus 2), concomitant versus sole administration of influenza vaccine, and vaccine brand received. To test the difference between binomial variables, the χ2 test was used for independent samples, and the McNemar test for paired samples. The Wilcoxon rank-sum test was used to compare the median values of non-normal continuous variables.

Results

Of 981 children enrolled in the surveillance, 88 (9.0%) were excluded from the analysis: eight of these were aged ≥ 10 years; influenza vaccine was inadvertently given just below the age of 6 months for one; and parents were unable to be contacted for 79 (non-response rate of 8.1%). Of the 893 children eligible for inclusion in the analysis, 419 (46.9%) were from WA, and 474 (53.1%) from other states.

Data on participant characteristics and vaccines received are shown in Box 1. The 893 children received 1052 influenza vaccinations: data were obtained after a single dose (Dose 1) for 693 children; after two doses (Doses 1 and 2) for 159 children; and after Dose 2 only for 41 children (totals: Dose 1, 852; Dose 2, 200). The mean age was 3.6 years (median, 3.1 years), and 484 children (54.2%) had at least one chronic medical condition. Of these, 196 (40.5%) had a respiratory condition and 55 (11.4%) had a cardiac condition. More children aged ≥ 3 years had a chronic medical condition than those aged < 3 years (61.2% v 47.0%).

Most vaccinations given were Vaxigrip or Vaxigrip Junior (776; 73.8%). No children were recorded as receiving Agrippal. Concomitant vaccines were administered with influenza vaccine in 60 of 1052 encounters (5.7%), all of which were with Dose 1 of the influenza vaccine. The median age of children receiving concomitant vaccines was lower than that for those receiving influenza vaccine only (2.7 v 3.3 years, P = 0.033 with Wilcoxon rank-sum test).

Safety outcome data

Data on the frequency of systemic and injection site reactions are shown in Box 2. Overall, reactions occurred in about one in five influenza vaccine recipients. Injection site reactions were more common after Dose 1 than Dose 2 (21.2% v 6.0%), whereas frequency of systemic reactions was similar after Doses 1 and 2 (18.4% v 16.5%). Fever was reported in 47 of 852 children (5.5%) after Dose 1, with a similar rate after Dose 2 (13/200; 6.5%) (P = 0.61). Among the 159 vaccinees with data available for both doses, no obvious differences in the risk of adverse events after vaccination compared with the whole cohort analysis were evident (data not shown).

Overall, there were 60 children whose parents or carers reported fever (either measured temperature elevation or feeling hot) during the 3 days of observation (Box 2). After Dose 1, most children experienced fever on Day 1 (29/47; 61.7% [95% CI, 46.4%–75.5%]), with fewer having fever on Day 2 (18/47; 38.3% [95% CI, 24.5%–53.6%]). After Dose 2, fever occurred on Day 1 in seven of 13 children (53.8% [95% CI, 25.1%–80.8%]). There was no significant difference in fever between age groups.

After Dose 1, older children (aged 3 to < 10 years) had significantly higher rates than younger children of injection site reactions (31.6% v 9.7%; < 0.001), as did children who had received influenza vaccine previously compared with vaccine-naive children (27.7% v 17.7%; P = 0.001).

Certain adverse events were more common after influenza vaccine was given concomitantly with other vaccines than after influenza vaccine given alone. For occurrence of fever with concomitant versus sole administration (13.3% [95% CI, 5.9%–24.6%] v 4.9% [3.5%–6.7%]; = 0.013), the relative risk (RR) was 2.7 (95% CI, 1.3–5.5). Systemic reactions (36.7% [95% CI, 24.6%–50.1%] v 17.0% [95% CI, 14.5%–19.8%]; < 0.001) and analgesic or antipyretic use (30.0% [95% CI, 18.8%–43.2%] v 18.4% [95% CI, 15.8%–21.3%]; = 0.04) were also more common after concomitant administration with other vaccines (RR, 2.2 [95% CI, 1.5–3.1] and 1.6 [95% CI, 1.1–2.5], respectively).

There were some differences between vaccine brands, but they were not consistent across all outcome measures and age groups. Fever rates did not exceed 6.7% for any of the three vaccine brands (data not shown).

Severity of adverse events

Of the 181 injection site reactions reported after Dose 1, severity was reported for 154, and only 11 of these (7.1%) were reported as severe. Of the 60 children for whom fever was reported, 46 had their temperature recorded: four (defined as having fever based on parental report) had a temperature less than 37.5°C, 22 were between 37.5°C and 38.5°C, 18 were between 38.6°C and 39.5°C, and two were > 39.5°C. One child had a febrile convulsion after Dose 1. This child was known to have a seizure disorder and had a history of seizures after vaccination. Despite administration of paracetamol after vaccination, he had a seizure on Day 1 and was hospitalised, but made a complete recovery. Nearly one in five children used analgesics or antipyretics within 3 days of vaccination (Box 2).

Medical attention or advice was sought in the 72 hours after influenza vaccination for 22 children (2.6%) after Dose 1, and 11 (5.5%) after Dose 2 (Box 2). Of the children for whom medical attention was sought after Dose 1, eight attended a hospital emergency department, 10 went to their local medical practitioner, and telephone or email advice was sought for four. The eight children who attended an emergency department included one child with a febrile seizure, two with urticarial rashes, two with croup or bronchitis, one with diarrhoea, one with headache and vomiting, and one with unspecified illness. Two children saw their local medical practitioner because of parental concern about fever. The reasons for medical presentations after Dose 2 were not recorded.

Discussion

This is the first time that active surveillance of influenza vaccine safety has been conducted across multiple states in Australia. The results from this large cohort offer reassurance to parents and health care providers that the seasonal influenza vaccines recommended for use in young children are safe. We found that a low proportion of children (5.5%–6.5%) had fever after vaccination, and recorded temperature elevations were generally low-grade. Although injection site and systemic reactions occurred in about one in five vaccine recipients, these were generally mild.

Our data are similar to two smaller Australian studies in children aged < 5 years: one in WA in 2011, in which 6.9% of children (10/144) reported fever;19 and another in New South Wales in 2010–2011, in which the prevalence of fever was 6.3%–7.1% after use of non-bioCSL vaccine.6 A recent systematic review found a similar overall rate of fever in children aged 6 to < 36 months. After one dose of influenza vaccine, the median average weekly risk of any fever was 8.2% (range, 5.3%–28.3%) in published reports and 26.0% (range, 10.3%–70.0%) in unpublished trials.16 The latter estimate included results from bioCSL Fluvax studies, including a Phase IV clinical trial conducted in 2009 but not published until 2013 (in which 28.6% of children aged 6 months to < 3 years and 19.5% of children aged 3 to < 9 years experienced fever).20

Although one in five parents in our study reported injection site reactions after Dose 1, very few of these were considered severe. Injection site reactions were more common in older children and in those previously vaccinated; however, this may be confounded by older children being more likely to verbally report pain and tenderness. Similar to previous studies,6,19 very few families sought medical advice after vaccination, and in some instances this was for events that were likely to be unrelated to vaccination.

Our study suggests that the risk of fever and other systemic reactions is increased in those who are given influenza vaccine on the same day as other routine vaccines. Similarly, a prospective cohort study in the United States demonstrated that children aged 6–23 months who received influenza vaccine concomitantly with 13-valent pneumococcal conjugate vaccine (PCV13) had higher rates of fever (37.6%) than children who received influenza vaccine (7.5%) or PCV13 (9.5%) on separate days.21 Another study showed an increased, albeit low, absolute risk of febrile seizure associated with concurrent administration of influenza vaccine and PCV13.22

The strengths of this surveillance included the prospective follow-up of vaccinated children, with a short interval between receipt of influenza vaccine and collection of safety outcome data. However, the use of nurse phone calls for soliciting parental reports was labour-intensive. Recently, the use of mobile phone text messaging and web-based technology to contact patients or parents has been shown to be effective for follow-up after vaccination.2325 Although potential variability in data quality due to parental reporting may limit detailed analysis and interpretation, the consistency of our findings with multiple other studies for outcome measures such as fever suggests this was not a limitation.

Vaccination providers and the public can feel confident that a range of measures, including surveillance that employs parent and carer reporting of adverse events, provide information on the safety of the influenza vaccines currently recommended for use in Australian children. This surveillance is ongoing in 2014 and has continued to provide reassuring data on the current season’s influenza vaccines.26

1 Characteristics of study participants and influenza vaccines administered, by age group*


Age


Characteristic

6 months to < 3 years

3 to < 10 years

Total


Total children

436

456

893

Male

158/298 (53.0%)

92/173 (53.2%)

250/471 (53.1%)

Mean age, years (SD)

1.7 (0.7)

5.3 (1.9)

3.6 (2.4)

Median age, years (interquartile range)

1.6 (1.0–2.3)

4.7 (3.7–6.8)

3.1 (1.6–4.8)

Previous influenza vaccine


At least one dose in previous 3 years

91 (20.9%)

209 (45.8%)

300 (33.6%)

Never received

344 (78.9%)

247 (54.2%)

592 (66.3%)

Not recorded

1 (0.2%)

0

1 (0.1%)

Chronic medical conditions


At least one chronic medical condition

205 (47.0%)

279 (61.2%)

484 (54.2%)

No chronic medical conditions

231 (53.0%)

177 (38.8%)

409 (45.8%)

Data on doses recorded


Dose 1

283 (64.9%)

409 (89.7%)

693 (77.6%)

Dose 2

35 (8.0%)

6 (1.3%)

41 (4.6%)

Both Doses 1 and 2

118 (27.1%)

41 (9.0%)

159 (17.8%)

Total vaccines administered

553

498

1052

Fluarix

30 (5.4%)

100 (20.1%)

131 (12.5%)

Influvax or Influvac Junior

54 (9.8%)

55 (11.0%)

109 (10.4%)

Vaxigrip or Vaxigrip Junior

444 (80.3%)

332 (66.7%)

776 (73.8%)

Not recorded

25 (4.5%)

11 (2.2%)

36 (3.4%)


* Age groups were chosen to coincide with the ages at which children are recommended to receive different doses of influenza vaccine, as per the Australian immunisation handbook (children aged 6 months to < 3 years receive a 0.25 mL dose, and children aged 3 to < 10 years receive a 0.5 mL dose).14 Percentages may not sum to 100% due to rounding. † Totals include one child whose age was not recorded. This child had never received influenza vaccine, had no chronic medical conditions and received Dose 1 of Fluarix. ‡ Information on sex was received for 471 participants (data not collected in Western Australia).


2 Safety outcomes and management of children aged 6 months to < 10 years who received influenza vaccines*


Dose 1 (n = 852)


Dose 2 (n = 200)


Chronic medical conditions


Previous influenza vaccine


Age


Outcome

Total

Yes

No

Yes

No

6 m to < 3 y

3 to < 10 y

Total


Systemic reaction of any severity


Fever

47 (5.5%) [4.1%–7.3%]

29 (6.1%) [4.1%–8.7%]

18 (4.7%) [2.8%–7.4%]

20 (6.7%) [4.1%–10.1%]

27 (4.9%) [3.2%–7.0%]

26 (6.4%) [4.3%–9.4%]

21 (4.7%) [2.9%–7.0%]

13 (6.5%) [3.5%–10.9%]

Headache

26 (3.1%) [2.0%–4.4%]

19 (4.0%) [2.4%–6.2%]

7 (1.8%) [0.7%–3.8%]

15 (5.0%) [2.8%–8.1%]

11 (1.9%) [1.0%–3.5%]

1 (0.2%) [0.01%–1.4%]

25 (5.6%) [3.6%–8.1%]

1 (0.5%) [0.01%–2.8%]

Nausea, vomiting or abdominal pain

39 (4.6%) [3.3%–6.2%]

23 (4.9%) [3.1%–7.2%]

16 (4.2%) [2.4%–6.8%]

14 (4.7%) [2.6%–7.7%]

25 (4.5%) [2.9%–6.6%]

18 (4.5%) [2.7%–7.0%]

21 (4.7%) [2.9%–7.0%]

5 (2.5%) [0.8%–5.7%]

Convulsion

1 (0.1%) [0.01%–0.7%]

1 (0.2%) [0.01%–1.2%]

0 (0)
[0–1.0%]

1 (0.3%) [0.01%–1.8%]

0 (0)
[0–0.7%]

0 (0)
[0–0.9%]

1 (0.2%) [0.01%–1.2%]

0 (0)
[0–1.8%]

Rash

15 (1.8%) [1.0%–2.9%]

11 (2.3%) [1.2%–4.1%]

4 (1.1%) [0.3%–2.7%]

8 (2.7%) [1.2%–5.2%]

7 (1.2%) [0.5%–2.6%]

7 (1.7%) [0.7%–3.6%]

8 (1.8%) [0.8%–3.4%]

1 (0.5%) [0.01%–2.8%]

Rigors

6 (0.7%) [0.3%–1.5%]

5 (1.1%) [0.3%–2.4%]

1 (0.3%) [0.01%–1.5%]

2 (0.7%) [0.1%–2.4%]

4 (0.7%) [0.2%–1.8%]

3 (0.7%) [0.2%–2.2%]

3 (0.7%) [0.1%–1.9%]

0 (0)
[0–1.8%]

Fatigue

73 (8.6%) [6.8%–10.7%]

48 (10.1%) [7.6%–13.2%]

25 (6.6%) [4.3%–9.6%]

24 (8.0%) [5.2%–11.7%]

49 (8.8%) [6.6%–11.5%]

35 (8.7%) [6.2%–11.9%]

38 (8.4%) [6.0%–11.4%]

6 (3.0%) [1.1%–6.4%]

Any systemic reaction

157 (18.4%) [15.9%–21.2%]

92 (19.4%) [15.9%–23.3%]

65 (17.2%) [13.5%–21.3%]

60 (20.1%) [15.7%–25.1%]

97 (17.5%) [14.4%–20.9%]

77 (19.2%) [15.5%–23.4%]

80 (17.8%) [14.3%–21.6%]

33 (16.5%) [11.6%–22.4%]

Injection site reaction of any severity


Swelling or lump

49 (5.8%) [4.3%–7.5%]

34 (7.2%) [5.0%–9.9%]

15 (4.0%) [2.2%–6.4%]

26 (8.7%) [5.8%–12.5%]

23 (4.2%) [2.6%–6.2%]

12 (2.9%) [1.6%–5.2%]

37 (8.2%) [5.9%–11.2%]

6 (3.0%) [1.1%–6.4%]

Pain or tenderness

158 (18.5%) [16.0%–21.3%]

106 (22.4%) [18.7%–26.4%]

52 (13.7%) [10.4%–17.6%]

72 (24.1%) [19.3%–29.3%]

86 (15.5%) [12.6%–18.8%]

27 (6.7%) [4.5%–9.6%]

131 (29.1%) [25.0%–33.5%]

7 (3.5%) [1.4%–7.1%]

Any injection site reaction

181 (21.2%) [18.5%–24.1%]

119 (25.1%) [21.3%–29.3%]

62 (16.4%) [12.8%–20.5%]

83 (27.7%) [22.8%–33.2%]

98 (17.7%) [14.6%–21.1%]

39 (9.7%) [7.0%–13.1%]

142 (31.6%) [27.3%–36.1%]

12 (6.0%) [3.1%–10.2%]

Management


Analgesic or antipyretic after vaccination§

164 (19.2%) [16.7%–22.1%]

103 (21.7%) [18.1%–25.7%]

61 (16.1%) [12.5%–20.2%]

69 (23.1%) [18.4%–28.3%]

95 (17.1%) [14.1%–20.6%]

85 (21.2%) [17.3%–25.5%]

79 (18.3%) [14.5%–21.9%]

35 (17.5%) [12.5%–23.5%]

Sought medical attention

22 (2.6%) [1.6%–3.9%]

14 (2.9%) [1.6%–4.9%]

8 (2.1%) [0.9%–4.1%]

10 (3.3%) [1.6%–6.1%]

12 (2.2%) [1.1%–3.8%]

11 (2.7%) [1.4%–4.9%]

11 (2.5%) [1.3%–4.4%]

11 (5.5%) [2.8%–9.6%]


* Data are number (%) [95% CI]. Some children reported more than one symptom. † Missing data for Dose 1, n = 1. ‡ Missing data for Dose 1, n = 5. “Any injection site reaction” includes erythema. § Missing data for Dose 1, n =1. ¶ Missing data for Dose 1, n =2.

Medically assisted circumcision: a safer option for initiation rites

Culturally sensitive integration of medical circumcision could avert adverse effects at traditional male initiation rites

In many traditional cultures, male initiation rites involve circumcision practices that can sometimes result in medical complications. In a recent incident in the Northern Territory, three young men required airlifting from their Borroloola initiation site to Darwin for medical assistance.1 The risk of permanent harm and potentially fatal outcomes could be decreased if safer options were available during initiation ceremonies. In this article, we report that it is possible to provide safe circumcision at male initiation rites.

In December 2013, a traditional initiation ceremony was conducted in Drekikier District, East Sepik Province, Papua New Guinea (PNG). During the 4-week ceremony, circumcision, considered vital for transition from boyhood to manhood, is conducted in the first week. Previously, young initiates suffered excruciating pain and severe blood loss when a carved cassowary bone was used to cut the penis and foreskin. On this occasion, at the invitation of community leaders, a medical team assembled at the site to provide safe male circumcision for 34 initiates.

The team consisted of a medical officer, two community health workers, an HIV counsellor and the provincial HIV response coordinator. Consistent with local cultural traditions, the entire team consisted of men originating from the local cultural group who also participated in cleansing rituals as part of the ceremony. Medical supplies, surgical instruments and a portable steriliser were brought to the initiation site deep in the forest. A specially built traditional dwelling stood in the middle of a small clearing. The few bush tracks that led into the site were carefully concealed to be completely segregated from other villagers, especially women and children.

A small shelter that stood immediately to the back of and continuous with the main ceremony house served as the operating theatre. It had an opening in the roof to allow sunlight in. Two beds and two tables were assembled in the centre of this structure. The beds served as operating tables and the tables were used for medical supplies and surgical instruments. The medical officer and one community health worker performed complete foreskin removals with assistance from other team members. Five to 10 mL of 1% lignocaine was infiltrated around the base of the penis and the procedure was conducted using sterile technique.

Five or six circumcisions were performed per day. Of the 32 initiates who were circumcised, only two experienced adverse events. The first had slight bleeding, rectified by reinforcing the gauze bandage and gentle continuous pressure for 1 minute. The second experienced heightened pain despite having two 500 mg paracetamol tablets after the procedure. This pain resolved after further regular doses of paracetamol.

Two initiates had previous penile modifications and were refused surgery. The injection of substances (such as cooking oil) or insertion of objects (such as ball bearings) under the skin of the penis can cause extensive scarring and disfigurement.2,3 For the safety of the initiates with previous penile modifications, arrangements were made for their circumcision to be done in the district hospital.

A number of challenges were encountered. Health workers needed to be re-deployed from existing programs and some supervisors were reluctant to allow staff to participate. Surgical instruments and medical supplies were sourced from provincial health facilities and were provided with a degree of reluctance. The makeshift operating theatre did not have a good light source, nor was it enclosed by flywire to keep insects out. Sterilisation was challenging, with forceps and tissue scissors washed in water collected from a nearby stream, placed in kidney dishes and sterilised in a pressurised portable steriliser heated over a fire for 30 minutes. This took 1 hour and limited the number of procedures per day.

Despite these challenges, the service proved successful. Of the 32 initiates circumcised, all had successful healing and fully participated in the remaining activities, including instruction on responsible living, family planning, wealth acquisition and respect for one another. All initiates completed the 4-week ceremony with a rousing celebration on 15 January 2014.

Improving the evidence base and increasing the availability of safe male circumcision procedures was a major recommendation from a recent national policy forum in PNG.4,5 Providing safe circumcision at the initiation site meant that some aspects of traditional circumcision were adjusted. Circumcision was delegated and performed entirely by the medical team, albeit a team of local cultural origin. Penile foreskins were completely removed, and medically contraindicated procedures such as urethral poking or scarification were not performed. However, chants and recitals continued in the main ceremony house as initiates were being circumcised.

This experience has shown that it is possible to provide medically assisted circumcision within initiation ceremonies in cultures that traditionally practise male circumcision in PNG. A similar approach may assist cultural groups in Australia to reduce the risk of adverse effects from male circumcision during traditional initiation ceremonies.

Measles: an important cause of fever and rash in a returned traveller

Clinical record

A previously well 21-year-old woman went to her general practitioner in September 2013, before a holiday to Bali, Indonesia, and was vaccinated for hepatitis A and typhoid. Malaria prophylaxis was not prescribed, as her intended destinations were deemed to confer a low risk of acquiring malaria. Notably, she had not received routine childhood vaccinations because of parental preference, receiving only “homeopathic immunisation” in infancy.

During October 2013, she spent 11 days in Bali, primarily in large holiday resorts in the Kuta district, but she did travel to a rural village. She reported receiving several mosquito bites during her trip.

Two days before her return to Australia, she developed fever, vomiting and diarrhoea. These symptoms continued until she presented to her GP 1 day after returning to Australia. She was prescribed metronidazole and loperamide and her diarrhoea resolved, but nausea and lack of appetite persisted. The following day she developed chills with associated headache, myalgias and cough — these symptoms continued until she presented to hospital 7 days after her return to Australia.

On initial review in hospital, 9 days after the onset of her illness, the patient was febrile (38.5°C) and had a faint, blanching maculopapular rash over her torso, which became more confluent over the following days (Figure A). A full blood examination showed mild lymphopenia (lymphocyte count, 0.6 × 109/L [reference interval (RI), 1.0–4.0 × 109/L]). Mild hepatitis was also noted with an elevated alanine aminotransferase level of 120 U/L (RI, < 33 U/L). Three sets of thick and thin blood films were sent to the laboratory, as were three sets of blood cultures along with stool and urine samples for culture and microscopy. Serological tests were performed for dengue fever virus and NS1 antigen as well as for chikungunya virus. A throat swab was sent for respiratory virus multiplex polymerase chain reaction (PCR) testing, and droplet contact precautions were instituted in managing the patient.

Two days after she presented to hospital, the patient developed conjunctivitis, associated with progression of the rash to involve her face. Examination of the buccal mucosa at this stage revealed clusters of white granules (Figure B) consistent with classic Koplik spots, allowing a clinical diagnosis of measles to be made. A throat swab for measles virus PCR testing was subsequently taken, and the diagnosis was confirmed. The genotype of the measles virus was consistent with that of other index cases originating from Bali.

In accordance with the guidelines of the Victorian Department of Health (DOH),1 contact tracing was performed on 128 patients and their family members potentially exposed in the emergency department before the patient was isolated. Under DOH protocols, 18 contacts received prophylactic vaccination with the measles, mumps and rubella (MMR) live attenuated vaccine and four received normal human immunoglobulin 0.5 mL/kg (maximum, 15 mL). To date, the DOH has not identified any secondary cases.

Two days later, the patient’s condition had improved clinically and the Koplik spots on the buccal mucosa had resolved (Figure C). She remained in hospital for 5 days for monitoring of probable measles hepatitis and to prevent further community exposure. Stool culture subsequently grew Campylobacter jejuni; this did not require antibiotic therapy and explained the initial clinical presentation with a diarrhoeal illness that preceded the onset of the typical measles rash and conjunctivitis.

Measles is a highly contagious RNA virus transmitted via respiratory secretions and aerosol. The incubation period is typically of 10–14 days duration, and it is followed by a prodrome of 2–4 days with the development of fever, cough, conjunctivitis and coryza. At this stage, Koplik spots may be visible on the buccal mucosa and may persist for a few days before coalescing or sloughing. Koplik spots are a pathognomonic sign of measles and were first described in 1896 by paediatrician Henry Koplik.2 They have been described as “grains of salt on a red background”.3 The exanthematous phase that follows is characterised by a maculopapular rash, usually beginning on the face before becoming generalised. A number of complications can occur, the most serious of which include measles encephalitis or the much rarer delayed-onset subacute sclerosing panencephalitis.

In our case, concurrent Campylobacter gastroenteritis was thought to be the reason for the unusual initial presentation with diarrhoeal symptoms, and why measles was not initially considered. Consequently, there was substantial exposure of staff and patients in the emergency department to this patient’s infection. The development of conjunctivitis, progression of the rash, and the presence of Koplik spots prompted the initiation of contact tracing based on a clinical diagnosis, and before the confirmatory PCR result. This proved to be crucial in being able to administer the MMR vaccine to susceptible contacts in the 72-hour postexposure window.

Endemic measles has been eliminated from Australia for some time.4 However, sporadic cases continue to occur in non-immune travellers, their immediate contacts, and others in subsequent chains of transmission.

Measles vaccination was licensed in Australia in 1968, and people born before 1966 may generally be considered immune because they are likely to have been exposed to circulating wild-type virus.5 In Australia, about 92% of children have received two doses of MMR by 60 months of age, but vaccination coverage is lower in certain regions.6 There have been recent measles outbreaks in several European countries because of a decline in vaccination rates.7 As measles is one of the most highly transmissible infectious diseases known, with an estimated basic reproductive number (the average number of cases generated by one case in a susceptible population) of 12 to 40,8 very high rates of vaccine coverage are required to prevent local outbreaks.9

Measles notifications in Australia have been trending upwards in the past few years (Box). Of the 37 Victorian cases notified in 2013, 16 were imported cases and 20 were secondary or tertiary cases linked to an overseas-acquired case. None of the Victorian patients with notified cases were known to be fully vaccinated. The most common countries of acquisition were Indonesia and Thailand (Victorian DOH, unpublished data, April 2014). From January to May 2014, 209 cases have been notified in Australia, with all states and territories apart from Tasmania reporting cases. This already exceeds the highest number of cases reported per year in Australia since 1999.

As was the case in our patient, ensuring that two documented doses of MMR vaccine are administered before travel is an often forgotten part of the pretravel consultation. A verbal recollection of vaccination or prior infection is often inaccurate. An alternative option is serological testing for the presence of measles IgG.

If diagnosis and appropriate infection control measures11 are delayed, follow-up of contacts can be resource intensive. In Victoria, the DOH traces and manages community contacts. However, health care-associated exposures remain the responsibility of the individual institution. In cases such as ours, the cost and resources involved can be substantial.

Lessons from practice

  • Measles is an important and often missed part of the pretravel consultation; it should be considered a routine aspect of travel vaccination decision making.
  • Consider measles as a differential diagnosis in febrile returned travellers born after 1966, especially if vaccination records are incomplete and the incubation and clinical presentation are consistent.
  • Early isolation with airborne precautions is recommended in all potentially measles-susceptible patients who present with fever and rash. It can help to minimise the cost of subsequent contact tracing and measles prophylaxis.

Notifications of cases of measles in Australia by year, 2002–201310