×

The global challenges of infectious diseases

Antimicrobial resistance, infection control, outbreak containment, vaccine development and diagnostic advances: adapting to a changing world

In 2012, on behalf of the Australasian Society for Infectious Diseases (ASID), we reported in the Journal on the infectious diseases challenges for Australia in the coming decade.1 We identified antimicrobial resistance (AMR) as a public health crisis requiring global professional and political action, and reflected on how the spread of infectious diseases and AMR is affected by interconnected factors including mass transportation, climate change, environmental perturbations and mass food production. We also noted how enhanced molecular capabilities in therapeutics and diagnostics provide new opportunities for detection and containment.

In this article, we take stock on the progress and changes in the global landscape since our previous report.

The past 3 years have seen increased global recognition of AMR. An ambitious strategy has been launched by the World Health Organization, which convened a ministerial conference on antibiotic resistance in June 2014 and published a draft global action plan.2 Government policies for combating AMR have also been developed in 2014, such as the national strategy in the United States3 and the 5-year plan in the United Kingdom.4 These provide blueprints for action, as shown by the inclusion of $1.2 billion funding for AMR in the 2016 US budget.

The Australian Government has also provided international leadership by taking a strong One Health approach to its national AMR strategy. It has established a high-level steering group chaired jointly by the heads of the Department of Health and Department of Agriculture, supported by the Australian Strategic and Technical Advisory Group on AMR, which has highlighted the need for data on antibiotic usage and resistance to increase understanding of the drivers of AMR.5 The Australian Commission on Safety and Quality in Health Care (ACSQHC) is setting up comprehensive surveillance of AMR and consumption through the Antimicrobial Use and Resistance in Australia project,6 and a similar exercise is planned for animals and agriculture.7

One way to measure success of programs to limit AMR is through reduction of health care-associated infections (HAIs). The annual costs of HAIs in the US alone have been estimated at $23 billion, with 115 000 deaths per year.8 In Australia, the ACSQHC has been instrumental in efforts to reduce HAIs, largely via hospital accreditation. The ACSQHC has championed hand hygiene initiatives, national infection control standards and mandatory antimicrobial stewardship programs in all Australian hospitals. These efforts promise significant benefits, as shown by a recent report of a significant reduction of Staphylococcus aureus bloodstream infections in Australian institutions.9

Despite the advances in combating AMR, we remain vulnerable to outbreaks. In his Natural history, Pliny the Elder (23–79 AD) wrote, “There is always something new out of Africa”. The same applied in 2014. Just over 12 months ago, no one could have foreseen the global ramifications of the Ebola virus epidemic. A few isolated cases quickly led to epidemic spread in impoverished urban centres of Sierra Leone, Liberia and Guinea that rapidly overwhelmed local health systems. This outbreak has highlighted not only our global vulnerability to epidemics, but also the immense value of traditional strict infection control practices, which when applied have resulted in a marked diminution in the projected size of the epidemic. New technologies have enabled development of novel rapid diagnostics and candidate vaccines which provide enormous hope for future epidemics.10

Vaccines against dengue virus and Clostridium difficile are two other examples where there is promise for future advances. However, possession of effective vaccines is not sufficient for control. Infrastructure for delivery needs to be present, and consumers must have confidence in vaccine safety and efficacy. Controlled pathogens can re-emerge when this framework breaks down, as shown by the resurgence of poliomyelitis in war-torn Syria and outbreaks in Pakistan after the murder of vaccine volunteers, and the recent measles outbreak in the US linked to Disneyland in California. The latter shows that electronic media can be a powerful tool for consumer education but also a means to spread misinformation.

The recent dramatic outbreaks of disease caused by Ebola virus, Hendra virus and Middle East respiratory syndrome coronavirus overshadow many advances in management of endemic infections previously thought to be incurable. Hepatitis C infection can now be cleared in a high proportion with antiviral agents, and prospects for a vaccine have never looked better. HIV has now become a long-term chronic viral illness for those infected who have access to newer, better tolerated antiretroviral agents. If longer-acting agents in clinical trials prove effective, further advances may be made, including control of HIV in marginalised groups and more effective prevention. Research into the role of human microbiota in the pathogenesis of both communicable and non-communicable diseases may provide further therapeutic advances. Faecal microbiota transplantation has now been proven to be an effective therapy for relapsing C. difficile infection and may have other future applications.

These advances have been enabled by the revolution in molecular techniques, including rapid diagnostics such as matrix-assisted laser desorption ionisation time of flight mass spectroscopy, multiplex polymerase chain reaction, and whole-genome sequencing for outbreak investigation. Further advances are expected when they become more widely available in microbiology laboratories. However, technological advances may not always bring benefits. Robotisation of specimen handling is fuelling the creation of remote, 24-hour automated laboratories, with downsizing or closure of on-site hospital laboratories and loss of well trained laboratory scientists. This could see clinicians being given more complex data (eg, on a new obscure organism), without the ability to interpret their significance if there is a lack of available microbiological expertise. Compounding this is the decline in understanding of basic microbiology, infections and antibiotic use in newly graduated junior doctors in Australia.11 The end results may be increased inappropriate testing, antibiotic overprescribing and errors in prescribing, which would be counterproductive to our national quality and stewardship aims. This knowledge gap needs to be addressed as a priority by Australian medical schools.

In the field of infectious diseases, every year is replete with surprises. The ASID Annual Scientific Meeting (to be held in 2015 in Auckland on 18–21 March) is a testament to this, presenting both new research and clinical experiences from across the globe. ASID recognises that global strategies to reduce AMR, coupled with the extraordinary advances in molecular diagnostics, are essential for outbreak preparedness and to advance control of endemic pathogens. However, to attempt to see beyond the present to the next 10 years in infectious diseases would be audacious. As Niels Bohr is believed to have said, “prediction is very difficult, especially about the future”.

Should we continue to isolate patients with vancomycin-resistant enterococci in hospitals?

The routine use of contact precautions for patients with vancomycin-resistant enterococci cannot be justified once colonisation with this multidrug-resistant bacterium becomes endemic

Infections with vancomycin-resistant enterococci (VRE), which have become more common in Australian hospitals since the late 1990s, are associated with poor patient outcomes. Patients with gastrointestinal colonisation of VRE are at greater risk of infection, and patients infected with VRE are at higher risk of all-cause mortality.1

During outbreaks, VRE is assumed to spread between patients mainly via the hands of health care workers or in the hospital environment. Widely recommended strategies for minimising the risk of VRE transmission include screening to identify colonised patients, and subsequent contact precautions to minimise cross-transmission. Many hospitals use contact precautions for patients colonised or infected with VRE on current and each subsequent hospital admission, assuming VRE colonisation is lifelong. These recommendations for contact precautions are based on observational studies conducted primarily during outbreaks, inductive reasoning based on the known transmission potential, and expert opinion. However, dissent has been expressed against the routine use of contact precautions, particularly in hospitals where VRE is endemic.2

VRE is endemic in many Australian hospitals.3 We have recently changed our policy requiring the routine use of contact precautions for patients found to be colonised with VRE, to a risk-based policy applied to all patients at Alfred Health. By outlining the rationale for this change, we hope that it will inform VRE control policies at other Australian hospitals.

By comparing routine passive surveillance with a point prevalence survey, we found that a strategy of screening of close contacts of patients with VRE did not identify the majority of VRE carriers in hospital.4 This may be due to exposure to antibiotics having a major role in VRE acquisition in the endemic hospital setting. Consistent with other studies, we have recently shown that antibiotic exposure, particularly to meropenem, is an important risk factor for VRE colonisation among patients.4 Although the magnitude of the effect of re-exposure to antibiotics on detectability and transmissibility of VRE has not been definitively established, we note that no patients who had colonisation detected more than 4 years prior were found to have VRE, despite 40% being exposed to antibiotics within the previous 3 months.5

In an earlier study where VRE transmission through contacts was documented, exposure to broad-spectrum antibiotics was an important risk factor among incident cases.6 Therefore, these studies suggest that during cross-transmission of VRE in hospital, antibiotics are the major facilitator and predictor of new VRE acquisition. Similarly, a recent study based on phylogenetic analysis and mapping of the vanB gene suggested that about half of hospital-acquired vancomycin-resistant Enterococcus faecium had recently acquired a transposon coding for vancomycin resistance.7 This sequence was the same as a Tn1549 sequence present in anaerobic bacteria, but was inserted in different sites in the E. faecium genome, suggesting that a substantial proportion of new VRE may have emerged through de-novo generation due to antibiotic selection pressure rather than cross-transmission.7

Studies also suggest that most patients clear detectable levels of VRE carriage in a relatively short period.5,8 Hospitals have varying policies by which patients are defined as cleared, based on screening of rectal swabs or faecal culture. Although a negative culture may not necessarily prove clearance, as intermittent shedding has been described, it is likely that a VRE-negative culture from a faecal specimen indicates either complete clearance or at least a very low density of VRE, which may have only marginal clinical significance. Recently, we studied the long-term carriage of VRE in a retrospective cohort study, and observed that only 12.6% of patients were positive for VRE if the initial detection was between 1 and 4 years before follow-up sampling, and none were positive if the initial detection was more than 4 years before follow-up.5 In addition, molecular typing suggested that at least half of the patients who remained VRE-positive at the time of the study were recolonised with new strains.5

Although contact precautions have been shown to minimise the risk of cross-transmission of VRE during outbreaks, there is accumulating evidence that they adversely affect the care of patients and impair patient flow. Studies, mostly conducted in hospitals in the United States, have found contact precautions are associated with adverse impacts on psychological outcomes, poorer satisfaction with care and perception of quality of care, less timely patient management, and fewer visits by health care workers.9 In studies conducted at our hospital, we have also found increased rates of non-pressure-related injuries and medication errors, and delayed access to radiological investigations among patients colonised with VRE.10,11 While these impacts may be justified and mitigated where there are few colonised patients or in an acute outbreak setting, they are less justified in an ongoing endemic setting. This is particularly true for VRE, where subsequent clinically significant bloodstream infection is uncommon among colonised patients.12

What are the alternatives to contact precautions? Recent studies have shown that interventions that are universally applied (termed “horizontal” interventions) are more effective than those that are targeted to specific pathogens (“vertical” interventions, including contact isolation of patients colonised with VRE) in controlling multidrug-resistant organisms.13 In a systematic review, we found that the universal daily topical application of 2% chlorhexidine gluconate using impregnated washcloths was associated with a reduction in new VRE colonisation, and also reduced methicillin-resistant Staphylococcus aureus colonisation and central line-associated bloodstream infections.14 Thus, the use of chlorhexidine washcloths provides an example of a universal intervention not directed towards a specific pathogen, but rather having an impact on a wider range of important multidrug-resistant organisms.

Similarly, effective antimicrobial stewardship programs should be another area of focus, as antibiotic selection pressure appears to be a significant factor associated with both emergence and spread of VRE in hospitals. In addition, elements of standard care such as adherence to hand hygiene, cleaning and disinfection after room separation and during room occupancy, hospital design elements including provision of sufficient toilets and bathrooms, and cleanable furnishings should be improved to reduce the risk of potential transmission of any multidrug-resistant organism in hospital. Furthermore, continued surveillance and review of hospital infection rates in high-risk areas are required to monitor for changes in epidemiology.

In conclusion, emerging evidence suggests that a significant proportion of VRE colonisation is attributable to exposure to broad-spectrum antibiotics; however, the clearance of carriage appears to be the rule, rather than the exception. Both these factors imply that only broad-based, continuous surveillance can identify patients with VRE.

If patients with VRE cannot easily be identified with faecal screening, then universal interventions, such as daily topical application of 2% chlorhexidine gluconate using washcloths, are likely to be more effective in preventing transmission in high-risk settings, such as intensive care units. Although the evidence supporting its use outside of intensive care units is weaker, we have found it to be feasible to provide washcloths to patients to self-apply after routine bathing in other high-risk settings such as haematology–oncology units.15 However, supervision and adherence may be a problem outside intensive care settings. Topical application of chlorhexidine gluconate using washcloths is also likely to reduce other significant infections, such as central line-associated bloodstream infections. A focus on horizontal rather than vertical interventions also avoids the adverse consequences associated with contact precautions. Limited facilities for isolating patients might then be better allocated to other hospital threats, such as norovirus or other multidrug-resistant pathogens.

Primary abdominal tuberculosis presenting as chronic dyspepsia

To the Editor: Tuberculosis (TB) continues to be a leading cause of preventable morbidity and mortality worldwide. Although Australia has the lowest rates in the world, more recently there has been a spike secondary to increased international travel and migration.1

TB can affect virtually any organ system in the body and can present with atypical or non-specific symptoms. A population-based study in America found that classical symptoms of cough and fever of > 2 weeks’ duration and weight loss were variably present and were insensitive predictors for TB.2

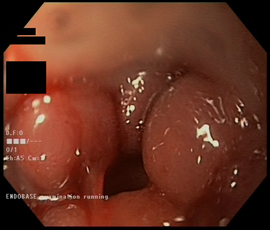
A 51-year-old immunocompetent man who had migrated from Somalia 18 years previously presented with a 6-year history of being treated with proton pump inhibitors for chronic duodenal ulcers. Repeated gastroscopies showed oedematous thickened duodenum. He had a 6-month history of anorexia, nausea, vomiting and weight loss, and was referred for diagnostic laparoscopy for suspected gastrointestinal malignancy.

A computed tomography scan of the abdomen showed small coeliac axis lymph nodes and oedematous thickened duodenum (Box). Gastroscopic biopsy samples over the past 6 years had shown chronic inflammation but no granulomas. Laparoscopy showed florid peritoneal nodules suggestive of miliary TB. A biopsy sample was positive for polymerase chain reaction (Xpert MTB/RIF, Cepheid) and cultures for Mycobacterium tuberculosis. The patient was diagnosed with gastrointestinal TB. He responded well to antitubercular treatment.

Gastrointestinal TB is difficult to diagnose. From a review of 23 patients in India, the most common symptoms of duodenal TB were vomiting (14 patients), epigastric pain (13), and weight loss and anorexia (7).3 Patients with extrapulmonary TB may or may not have concomitant pulmonary TB.2

The ileocaecal region is most commonly involved, followed by the colon, jejunum, appendix, duodenum, stomach, sigmoid colon and rectum.4 Gastroduodenal TB is rare and is often misdiagnosed as peptic ulcer disease. Preoperative endoscopic biopsies have rarely shown underlying aetiology.3

Abdominal TB, although uncommon in developed nations, should be suspected in immunocompromised patients or people from highly endemic areas presenting with longstanding non-specific symptoms that do not resolve with standard therapy. Delayed diagnosis can lead to complications such as peritonitis, and intestinal obstruction and perforation. Therefore, early diagnosis and treatment improves patient outcomes without the need for surgical intervention.

An endoscopic image showing duodenal mucosal oedema

Latent infection in HIV-positive refugees and other immigrants in Australia

To the Editor: Refugees and other immigrants may carry latent infections not endemic to Australia. Immunocompromised people, including those living with HIV, are at particular risk of reactivation of such infections.1 Screening for schistosomiasis and strongyloidiasis in patients with HIV is not currently recommended by Australian guidelines2 or the United States guidelines that they reference;3 however, it is recommended by those of the United Kingdom.4

We sought to determine the prevalence of latent tuberculosis (TB), Schistosoma spp. and Strongyloides stercoralis in a cohort of people living with HIV attending a tertiary care hospital in Melbourne. The study received approval from our research ethics committee. Between 1 January 1990 and 6 March 2014, a total of 500 patients were under the care of the HIV clinic. These patients were included in a retrospective analysis of data extracted from existing pathology and administrative databases.

Mean age at presentation was 38 years, median length of time attending the clinic was 24.5 months (range, 1–289 months), and 383 patients (77%) were male. Two hundred and twenty patients (44%) were born outside Australia in over 60 different countries. Fifty-eight patients (12%) originated from low-income countries, 106 (21%) from middle-income countries, and 324 (65%) from high-income countries, including Australia.

All patients were included to assess screening for TB in accordance with existing guidelines, which currently recommend screening at diagnosis.2,3 Only patients from areas endemic for schistosomiasis (> 10% prevalence)5 were included in the data extraction for schistosomiasis screening. Similarly, only patients from areas endemic for strongyloidiasis (> 20% or unknown prevalence)6 were included in the data extraction for strongyloidiasis screening.

We also performed a prospective analysis of previously unscreened patients attending the clinic from 7 March to 29 August 2014.

Serological testing comprised QuantiFERON-TB Gold (Cellestis) (Mantoux testing for some patients before 2004), Schistosoma IgG indirect haemagglutination assay (ELITech), and Strongyloides IgG enzyme immunoassay (DRG Diagnostics).

In the retrospective audit, five of 58 patients who had been screened for schistosomiasis returned positive serology results, indicating past or current infection. In the prospective sample, one of 22 patients was found to have a past or current Schistosoma infection that was previously undiagnosed despite the patient originating from an endemic country.

In our retrospective analysis, seven of 83 patients who had been screened for strongyloidiasis returned positive serology results, indicating past or current infection. In the prospective phase, one of 20 patients was found to have a past or current S. stercoralis infection that was previously undiagnosed despite the patient having come from an endemic country.

In the retrospective audit, 10 patients were diagnosed with active TB and were excluded from further analysis. TB screening was recorded in 257 of 490 patients (52%); of these, 24 (9%) were positive and 11 (4%) had indeterminate results. In the prospective sample, two of 19 patients not previously screened for TB returned positive results. Both of these patients were born in high-risk countries.

Our results suggest that screening for TB, strongyloidiasis and schistosomiasis should be a part of primary care for HIV-infected patients originating from areas endemic for these infections.

Compliance with Australian splenectomy guidelines in patients undergoing post-traumatic splenectomy at a tertiary centre

To the Editor: The lack of a functioning spleen is associated with a lifelong risk of overwhelming post-splenectomy infection (OPSI). Historically, mortality rates associated with OPSI have been in excess of 50%.13 OPSI is a preventable illness through vaccination, education, prophylactic antibiotic use and other measures, as summarised in the national Australasian Society for Infectious Diseases (ASID)-endorsed guidelines for prevention of sepsis in asplenic and hyposplenic patients.4

We performed a retrospective cohort study among adult patients who had undergone post-traumatic splenectomy at a tertiary referral centre in Sydney, to assess compliance by health professionals and identify factors that could improve uptake of ASID recommendations. We reviewed hospital medical records and discharge summaries to assess compliance with recommendations before and after the publication of the ASID guidelines.

The Research and Ethics Office of the South Western Sydney Local Health District granted site-specific approval on the basis of low and negligible risk.

A total of 79 patients were identified, 37 in the preguideline group (January 2003 – June 2008) and 42 in the postguideline group (July 2008 – December 2013). Our findings are summarised in the Box.

Overall, compliance with the recommendations was poor, except for the rate of first vaccination against Streptococcus pneumoniae, Neisseria meningitidis and Haemophilus influenzae type b (Box). At discharge, most patients were advised to follow up with their general practitioner; however, GPs were neither provided with the information on the type of vaccination given in the hospital, nor with the appropriate recommendation on follow-up vaccinations.

Our study highlights gaps in best practice and areas for quality improvement and education. Lack of awareness of the guidelines among the surgical teams was found to be a notable factor in the poor compliance with the 2008 ASID guidelines. Asplenia and hyposplenia care should involve a multidisciplinary approach with involvement of surgeons, infectious diseases physicians, haematologists, pharmacists and clinical nurse coordinators.

We recommend the ASID 2008 guidelines be updated, as there have been changes in the vaccination recommendations since publication. A national spleen registry could be considered, for sending vaccination reminders and providing long-term follow-up and ongoing support. This would also allow prospective data collection for assessing compliance and measuring rates of OPSI.

Compliance with recommendations in the ASID management guidelines for prevention of sepsis in patients with asplenia or hyposplenia,4 before and after guideline publication in 2008


Number of patients*


Areas of compliance

Preguideline (n = 37)

Postguideline (n = 42)

P


Patient education

8

22

0.08

First vaccination after surgery


Pneumococcal

34

39

0.87

Meningococcal

34

39

0.87

Haemophilus influenzae type b

34

38

0.82

Influenza

2

5

0.31

Day of first vaccination, median (range)

7 (− 7 to 44)

7 (1 to 45)

0.47

Prophylactic antibiotic use

11

17

0.32

Reserve antibiotic supply

1

5

0.20

Risk-reduction measures


Patient alerts (eg, bracelet)

1

9

0.04

Splenic salvage

0

0

Risk of sepsis included in histology report

0/36

0/42

Risk of sepsis reported if Howell-Jolly body seen in peripheral blood smear

0/15

0/19

Meningococcal vaccination for travellers to high-risk areas

0

0

Informing the patient of malaria risks

1

3

0.61

Informing the patient of Babesia risks

0

1

> 0.99

Patient warned of risks associated with animal bites

1

1

Spleen registry referral

0

3

0.24


ASID = Australasian Society for Infectious Diseases. * Unless otherwise indicated. † Optimal timing uncertain; ideally 14 days after emergency splenectomy, or earlier if there is a risk of loss of the patient to follow-up. ‡ Amoxicillin 250 mg daily was the most commonly prescribed prophylactic antibiotic, with a variable duration of recommendation (1 year to lifelong).


Effectiveness of a care bundle to reduce central line-associated bloodstream infections

Central line-associated bloodstream infections (CLABSIs) are an important source of morbidity, mortality and cost.1 About 4000 CLABSIs occur in Australian intensive care units (ICUs) each year, with an estimated nationwide cost of $36.26 million and a mortality rate of 4%–20%.2,3 The importance placed on CLABSI and its prevention has prompted standardised monitoring for quality assurance and innovation of preventive strategies.1,4,5 Care bundles focused on improving line insertion procedure have proven successful overseas.1,6 Local implementation of a similar care bundle to that used overseas across New South Wales proved successful, and prompted the Australian and New Zealand Intensive Care Society CLABSI Prevention Project.7,8 Despite these interventions, CLABSI rates range from 0.9 to 3.6 per 1000 central line days.6,7,920

The Victorian Healthcare Associated Infection Surveillance System (VICNISS) collects standardised ICU CLABSI rates for the state of Victoria.21 Since 2006, the University Hospital Geelong (UHG) ICU has reported CLABSI rates to VICNISS.

An elevated reported CLABSI rate at UHG in 2007 and 2008 (3.8 and 3.6, respectively, compared with the state average of 2.7 per 1000 central line days)22 prompted development and introduction of a CLABSI prevention care bundle. Our care bundle used an effective line insertion procedure identified from previous studies,1,6,7 but also incorporated a novel maintenance procedure. In this article, we report the effectiveness of this care bundle in a tertiary ICU in Victoria.

Methods

We undertook a before-and-after study, retrospectively accessing the pre-intervention data, at an adult, tertiary, 19-bed ICU that admits medical, surgical and cardiac surgical patients. Ethics approval was obtained from the Barwon Health Research Review Committee. This project was performed as part of the authors’ usual roles and no funding or subsidy was received. All of us had full access to the study data.

Intervention

The care bundle was based on the Australian and New Zealand Intensive Care Society CLABSI prevention project,8 comprehensive literature review and collaboration between UHG ICU, UHG Infection Control Services and other key stakeholders. The final care bundle (Appendix 1) included standard line insertion procedure consistent with that described previously,6,7 bedside audit by an observer with stopping rules, and a novel line maintenance procedure that included placement of a Biopatch (Johnson and Johnson), sterile line access, daily 2% chlorhexidine body wash, daily central venous catheter (CVC) review with early line removal, and liaison nurse follow-up of all CVCs present at discharge.

Study procedure

All adult patients admitted to UHG ICU between 1 July 2006 and 30 June 2014 were captured in this study. The care bundle was introduced in 2009, dividing patients into a pre-intervention period (1 July 2006 to 31 December 2009) and a post-intervention period (1 January 2010 to 30 June 2014). Case identification of CLABSI was based on the VICNISS dataset and review of blood cultures. All VICNISS-reported CLABSI cases were reviewed by one of us (D E) to confirm that they fulfilled the current VICNISS definition (Appendix 2). This definition is consistent with the internationally accepted O’Grady definition that has been previously applied.7,23

All confirmed CLABSIs were included in the analysis, irrespective of whether line insertion occurred in the ICU. Cohort demographic, basic clinical and microbiological data were collected from the hospital electronic database. Patient medical records of all VICNISS-reported CLABSI cases were reviewed to confirm CLABSI definition and collect additional clinical information. Finally, all positive blood cultures were blindly and independently reviewed by an infectious diseases specialist to identify any missing CLABSI cases.

Statistical analysis

Data were analysed using SAS, version 9.4 (SAS Institute). All data were visually assessed for normality using histograms. The primary outcome (CLABSI events) was compared first as an overall comparison of proportions and presented as a relative risk with 95% confidence intervals and second as the number of CLABSI events per quarter using Poisson regression.

Comparisons of pre- and post-intervention periods were performed for categorical variables using χ2 tests for equal proportions and reported as numbers (%). Normally distributed variables were compared using Student t tests and reported as mean (SD), and non-normally distributed data were compared using Wilcoxon rank-sum tests and reported as median (interquartile range). A two-sided P of 0.05 was considered to be statistically significant.

Results

Patient cohort characteristics are detailed in Box 1. The post-intervention cohort was significantly younger (mean age, 59.4 years v 64.2 years; P < 0.001) with a higher mean illness severity score (Acute Physiology and Chronic Health Evaluation [APACHE] III score, 50 v 48; P = 0.001), an increased proportion of medical patients (3250/6273 [52%] v 1863/4701 [40%]; P < 0.001), an increased requirement for mechanical ventilation (3223/6273 [51%] v 2014/4701 [43%]; P < 0.001) and an increased admission source from the wards or emergency department. Although the clinical significance of the differences in age and APACHE score are questionable, when all differences are considered together, they favour an increased risk of CLABSI in the post-intervention cohort.

A total of 24 783 central line days occurred between July 2006 and June 2014 (Box 2). Thirty cases of CLABSI were included in the analysis (eight did not satisfy CLABSI definition criteria and were excluded — seven pre-intervention and one post-intervention; Appendix 3). No CLABSI cases additional to VICNISS-reported cases were identified. In the pre-intervention period, there were 9844 central line days and 22 cases of CLABSI, resulting in a CLABSI rate of 2.2/1000 central line days. In the post-intervention period, there were 14 939 central line days and eight cases of CLABSI, resulting in a CLABSI rate of 0.5/1000 central line days. This represents a rate ratio of 0.23 (95% CI, 0.11–0.54; P = 0.005). The temporal change in CLABSI rates is shown in Appendix 3, with a peak CLABSI rate of 5.2/1000 (4/766) central line days in quarter 4 of 2008, and a CLABSI rate of zero since June 2012. The difference in the quarterly CLABSI rate before and after the intervention was introduced was significant (P < 0.001), as was the difference in the number of quarters in which CLABSI rate was zero (pre-intervention, 3/14 v post-intervention, 12/18; P = 0.01).

The blood culture collection rate (60.1 [2827/4701] v 61.5 [3859/6273] per 100 patients) was similar in the pre- and post-intervention periods, while the positive culture rate significantly fell from 9.1% (258/2827) to 7.2% (279/3859) (P = 0.005) (Box 2). Characteristics of the confirmed CLABSI cases are presented in Box 3. The site of blood culture collection was similar between the two cohorts; however, no common skin commensals were isolated as a causative organism in the post-intervention cohort.

Discussion

Our study describes a significant reduction in the CLABSI rate in a tertiary Australian Victorian ICU from a peak quarterly rate of 5.2 to zero after implementation of a care bundle that incorporated a novel line maintenance procedure. Overall, the CLABSI rate, per 1000 central line days, decreased from 2.2 in the pre-intervention period to 0.5 in the post-intervention period. In real terms, the reduced CLABSI rate equates to 15 fewer cases of CLABSI for the post-intervention period with an estimated total reduction in ICU length of stay of 38 days, hospital length of stay of 113 days and resultant cost saving of about $210 000.

To our knowledge, this is the first time that a zero CLABSI rate has been achieved and sustained in an Australian ICU. Burrell and colleagues reported a CLABSI rate of 0.9/1000 central line days from several centres.7 Department of Health data from Western Australia have shown similarly low CLABSI rates, but their processes were not reported.5,7,24

The finding of clinical effectiveness after introduction of the care bundle suggests that the observed benefits are causally associated. It is plausible that the maintenance procedure was crucial in reducing CLABSI, given that zero CLABSI was achieved despite the inclusion of lines inserted outside the ICU. It remains possible that changes in the patient cohort or procedures relating to CLABSI surveillance could account for the observed changes. In particular, there were seven CLABSIs that did not meet definition criteria in the pre-intervention period compared with one in the post-intervention period, raising the possibility of previous overreporting. Otherwise, the identified post-intervention cohort changes when taken together are considered as predisposing to CLABSI. In addition, the central line days and blood cultures per patient do not support altered clinical practice as an explanation.

Our study’s strengths include a large patient cohort with availability of population characteristics, a microbiological blood culture dataset, an independent review of all positive blood cultures, and the application of the current standard CLABSI definition across the entire study period. This reduces the likelihood that the observed change was driven by changes in non-infection control related clinical practices. This study is limited by a single-centre retrospective, observational design, limiting generalisability and the ability to establish causality. However, these limitations are largely comparable to prior similar studies.6,7,25 Other limitations included potential confounding from lines inserted outside the ICU and the absence of adherence data for the individual components of our line maintenance procedure to show actual change in clinical practice. However, in our experience, the care bundle has been embedded into routine and has markedly improved clinical practice.

In conclusion, our study suggests that a central line care bundle with this novel line maintenance procedure can effectively reduce the CLABSI rate to zero and that this zero CLABSI rate can be sustained. Validation of our study by other centres, especially if performed prospectively, would further support our findings.

1 Patient population characteristics, and ICU interventions and outcomes, for the pre- and post-intervention periods


Pre-intervention

Post-intervention

P


No.

4701

6273


Mean age in years (SD)

64.2 (16.6)

59.4 (21.2)

< 0.001

Male, no. (%)

2870 (61%)

3857 (61%)

0.64

Median APACHE III score (IQR)

48 (37–64)

50 (38–67)

0.001

Comorbidity, no. (%)


Respiratory

233 (5%)

204 (3%)

< 0.001

Cardiovascular

453 (10%)

176 (3%)

< 0.001

Hepatic

42 (1%)

117 (2%)

< 0.001

Renal

103 (2%)

134 (2%)

0.84

Immunosuppression

271 (6%)

544 (9%)

< 0.001

Cancer

231 (5%)

301 (5%)

0.78

Category, no. (%)


Medical

1863 (40%)

3250 (52%)

< 0.001

Surgical

1071 (23%)

1027 (16%)

< 0.001

Cardiac surgical

1767 (38%)

1996 (32%)

< 0.001

ICU admission source, no. (%)


Operating theatre

2752 (59%)

2988 (48%)

< 0.001

Emergency department

910 (19%)

1565 (25%)

< 0.001

Ward

801 (17%)

1280 (20%)

< 0.001

Other ICU

235 (5%)

439 (7%)

< 0.001

ICU outcomes


Mechanical ventilation, no. (%)

2014 (43%)

3223 (51%)

< 0.001

Median ICU stay in hours (IQR)

41.2 (22.3–65.9)

41.7 (21.7–73.3)

0.01

Median hospital stay in days (IQR)

9.9 (5.8–18.9)

9.0 (5.1–16.6)

< 0.001

ICU mortality, no. (%)

333 (7%)

423 (7%)

0.70

Hospital mortality, no. (%)

534 (11%)

672 (11%)

0.34


APACHE = Acute Physiology and Chronic Health Evaluation. ICU = intensive care unit. IQR = interquartile range.


2 Summary of total ICU patient admission, central line, blood culture and CLABSI data for the pre- and post-intervention periods


Pre-intervention

Post-intervention

Rate ratio (95% CI)

P


Total patient days

8070

10 899


Total central line days

9844

14 939


Central line days per patient days

1.22

1.37


Total blood cultures

2827

3859


Blood cultures per patient days

0.35

0.36

1.01 (0.97–1.05)

0.59

ICU bacteraemia, no. (%)

258 (9.1%)

279 (7.2%)

0.79 (0.67–0.93)

0.005

CLABSI, no.

22

8

0.23 (0.11–0.54)

0.005

CLABSI rate per 1000 central line days

2.2

0.5


CLABSI = central line-associated bloodstream infection. ICU = intensive care unit.


3 Characteristics of CLABSI cases for the pre- and post-intervention periods

Characteristics of infected lines

Pre-intervention (n = 22)

Post-intervention (n = 8)


Line type, no. (%)


CVC

21 (95%)

6 (75%)

Vascath

7 (32%)

3 (38%)

PAC

1 (5%)

1 (13%)

Other

3 (14%)

2 (25%)

Median dwell time, days (IQR)

6 (5–8)

5 (4–6)

Inserted in ICU, no. (%)

15 (68%)

7 (88%)

CLABSI organism, no. (%)

Staphylococcus aureus

6 (27%)

2 (25%)

Staphylococcus epidermidis

6 (27%)

0

Enterobacter spp.

1 (5%)

2 (25%)

Candida spp.

6 (27%)

2 (25%)

Enterococcus

4 (18%)

1 (13%)

Other

2 (9%)

3 (38%)

Positive blood culture site, no. (%)

Peripheral

5 (23%)

2 (25%)

Arterial

1 (5%)

0

Central

8 (36%)

2 (25%)

Unknown

19 (86%)

5 (63%)


CLABSI = central line-associated bloodstream infection. CVC = central venous catheter. ICU = intensive care unit. IQR = interquartile range. PAC = pulmonary artery catheter.


HIV testing rates and co-infection among patients with tuberculosis in south-eastern Sydney, 2008–2013

The association between HIV infection and tuberculosis (TB) is well recognised, and the rationale for offering a routine HIV test to all people with TB has been presented previously.1 Recent clinical trials found that commencing antiretroviral therapy for HIV infection before the completion of TB therapy is associated with improved survival, and treatment should be commenced simultaneously for HIV and TB in people with co-infection and a CD4 T-cell count less than 50 cells/mm3.2,3 These recent clinical end point data reinforce the patient benefit of being tested for HIV infection when diagnosed with TB.

In Australia, HIV testing was undertaken in 76%–81% of patients with TB between 2008 and 2010.4,5 In 2010, 3.4% of patients with TB with a known HIV test outcome were reported as testing positive for HIV.5

South Eastern Sydney Local Health District (SESLHD) is a NSW Health district with a population of more than 800 000 people, and is an area of relatively high HIV prevalence and incidence in Australia.6 The district has four publicly funded chest clinics for the management of TB. At 53%, the rate of HIV testing among patients with TB managed in SESLHD in 2008 was statistically significantly lower than the national rate in 2008.

We evaluated changes in the HIV testing practices across the health district after a simple intervention and examined the rate of HIV co-infection in this population.

Methods

Clinicians managing publicly funded chest clinics had regular clinical meetings between 2008 and 2012. These meetings involved discussion of diagnosis and management of TB, and included senior respiratory physicians, senior nursing staff, a microbiologist and an infectious diseases physician. Publications about HIV and TB co-infection were made available to the clinicians managing TB in the health district from 2008, and HIV testing data were fed back and discussed at clinician meetings.13,7,8 Cases of TB in SESLHD residents and others treated at SESLHD clinics were notified to the SESLHD Public Health Unit; these included microbiologically confirmed cases and cases that were treated for TB without microbiological confirmation. Data about patients’ HIV testing status were collected routinely by chest clinic staff.

TB notification data for 2008–2013 were extracted from the NSW Notifiable Conditions Information Management System, accessed through the Secure Analytics for Population Health Research and Intelligence.

Variables extracted for analysis were date of notification for TB, name of treating chest clinic, local health district of residence, HIV test offered and HIV test result, including CD4 T-cell count for new diagnoses. For the analysis, HIV status was categorised as known (tested for HIV antibody and found to be positive, including known before the diagnosis of TB, or negative), or unknown (not tested or declined an offer of testing).

The χ2 test was used to test for differences in the proportions of HIV testing and co-infection between clinics and over the study period. Statistical analyses were conducted using SPSS, version 22 (IBM Corporation) and SAS Enterprise Guide 6.1 (SAS Institute).

Ethics approval was not sought, as the data were aggregated and de-identified in a form suitable for feedback to clinical services as part of quality activities.

Results

During the 6-year study period, 539 cases of TB were notified, and 506 of these were managed in SESLHD chest clinics (Box). Thirty-three SESLHD residents were managed at other chest clinics and were excluded from this analysis. Of the 506 patients treated at SESLHD chest clinics, 107 were not residents of SESLHD.

The proportion of patients tested for HIV co-infection varied between clinics from 62% to 85% (χ2 = 25.5; df = 3; P < 0.001), and the proportion of people with known HIV status increased over time from 53% in 2008 to 87% in 2013 (χ2 = 27.1; df = 5; P < 0.001).

Of patients for whom HIV status was known, the proportion of cases with HIV co-infection varied between clinics, ranging from 1.5% to 9.7% (χ2 = 10.0; df = 3; P = 0.02). Only seven people offered an HIV test declined this intervention in the 6-year period. The overall rate of HIV co-infection among people managed for TB in SESLHD was 5.4% of those in whom the HIV status was established. Based on these data, the lowest possible rate of co-infection is 4.0% if it is assumed that the 27.1% not tested were not infected.

Eleven of the 20 patients who were HIV positive were diagnosed with HIV infection at or after the time of their TB diagnosis. The median CD4 T-cell count at the time of HIV diagnosis for these people was 30 cells/mm3 (range, 10–250 cells/mm3).

Discussion

Between 2008 and 2013, there was an increase in the proportion of patients treated for TB for whom HIV status was known. Of these patients, 20 were HIV positive (5.4%), and 11 of these were diagnosed with HIV at the time of, or after, their TB diagnosis.

Although Australia has a low prevalence of both HIV and TB, the two conditions coexist worldwide, and the early diagnosis and treatment of both conditions is of benefit to the individual and the population as a whole. Recent data have confirmed the reduction of HIV transmission risk to sexual partners of people with HIV when antiretroviral therapy is used.9

The proportion of people diagnosed with advanced HIV infection (CD4 T-cell count less than 200 cells/mm3) has not declined over time in Australia, and HIV testing at the time of TB diagnosis may enable earlier HIV diagnosis in a population who may not be perceived to be at risk for HIV infection otherwise.10 It is notable, however, that most of the newly diagnosed cases of HIV infection in SESLHD had severe immunodeficiency at the time of diagnosis. Treatment at this level of immunodeficiency is still associated with a survival benefit, and the potential to trace contacts of sexual partners and reduce further HIV transmission.

The increase in known HIV status over the study period may be associated with the clinician-led intervention described here or to other secular trends. Clinicians may have independently determined that HIV testing was of benefit to their patients, or they may have been responding to the 2009 NSW Health policy directive recommending assessment of HIV antibody status at the time of TB diagnosis.11 Due to the retrospective nature of our study, causes for this increase could not be ascertained.

The proportion of TB cases with HIV co-infection in SESLHD is numerically, but not statistically significantly, higher than that reported in national data. The identified co-infection rates among people treated for TB in SESLHD reinforces the recommendation that the routine offer of HIV testing to all patients with TB is cost-effective, and may increase early detection and reduce the consequences of untreated HIV infection in this population.1 It is possible, however, that referral bias may have influenced the co-infection rate in this population.

There is an ongoing need to aim for universal testing for HIV infection early after the diagnosis of TB in SESLHD and nationally.

Cases of tuberculosis managed in South Eastern Sydney Local Health District, 2008–2013, by patient HIV status and clinic or year of notification


TB cases managed

HIV status known

HIV positive (of known HIV status)

HIV not tested

HIV test offered but declined


Clinic


A

143

113 (79.0%)

11 (9.7%)

27 (18.9%)

3


B

213

131 (61.5%)

2 (1.5%)

79 (37.1%)

3


C

89

76 (85.4%)

6 (7.9%)

12 (13.5%)

1


D

61

49 (80.3%)

1 (2.0%)

12 (19.7%)

0


Year


2008

85

45 (52.9%)

4 (8.9%)

39 (45.9%)

1


2009

80

56 (70.0%)

3 (5.4%)

20 (25.0%)

4


2010

100

79 (79.0%)

5 (6.3%)

21 (21.0%)

0


2011

98

72 (73.5%)

4 (5.6%)

24 (24.5%)

2


2012

73

56 (76.7%)

1 (1.8%)

17(23.3%)

0


2013

70

61 (87.1%)

3 (4.9%)

9 (12.9%)

0


Total

506

369 (72.9%)

20 (5.4%)

130 (25.7%)

7 (1.4%)


Evolving views and practices of antiretroviral treatment prescribers in Australia

The most recent Australian HIV clinical treatment guidelines support early antiretroviral treatment (ART) initiation, whereby asymptomatic patients should start treatment once their CD4+ cell count approaches 500 cells/mm3 or even earlier.1 This is consistent with a global movement based on emerging evidence and growing expert consensus that early initiation of ART has clear clinical benefits to individual patients and a potentially important population effect in reducing HIV transmission to patients’ uninfected sexual partners.2,3 Compared with earlier regimens, current ART regimens are less toxic, have simpler dosing requirements and lower pill burdens, and do not generally require as high a degree of drug adherence to achieve viral suppression.3 These developments have influenced policy regulation, resource allocation and ART initiation practices in Australia4,5 and other high-income countries.6,7

There is a paucity of research on prescriber characteristics relating to ART initiation practices. In some of the few studies that have been conducted, prescribers’ knowledge about ART guideline changes, familiarity with ART regimens, experience of and specialty in treating HIV-positive patients, and beliefs in ART effectiveness were closely associated with their initiation practices.79

We examined whether there have been recent changes in Australian ART prescribers’ perceptions of and practices towards early ART initiation. We also assessed prescriber factors that are likely to influence recommendation of ART initiation, including prescribers’ perceptions of their HIV-positive patients.

Methods

Repeated online cross-sectional surveys targeting all ART prescribers in Australia were conducted in 2012 (mid April to mid May) and 2013 (mid May to mid July). At each round, invitations were sent to online registrants of the Australasian Society for HIV Medicine (ASHM), which provides ongoing professional training for clinicians throughout Australia who specialise in treating patients with HIV. The surveys were self-completed and anonymous, and participants did not receive reimbursement for completing them. Detailed descriptions of the 2012 round are published elsewhere.10 The study was approved by the Human Research Ethics Advisory Panel I of the University of New South Wales (which reviews social and health research).

In both rounds, the surveys included questions on demographics, clinical experience in treating HIV-positive patients and primary concerns relating to recommendation of ART initiation. Participants were also asked to indicate the CD4+ T-cell count at which they would most strongly recommend ART initiation. Answers to questions on prescribers’ primary concerns when recommending ART initiation — one in relation to ART’s health benefits to individual patients and the other in relation to its benefits to population health — were measured by 11-point Likert scales, ranging from completely disagree (0) to completely agree (10).

In 2013, new questions were added to assess prescribers’ beliefs in and practices of early initiation of ART. Early initiation was defined as commencing ART when a patient’s CD4+ T-cell count approaches 500 cells/mm3 or immediately after a patient is diagnosed with HIV irrespective of CD4+ T-cell count. A series of scenario-based questions was also added, to explore perceived patient characteristics that could potentially change prescribers’ practices of recommending early initiation of ART. The scenarios examined a range of patient characteristics, including demographic factors (eight items; eg, unstable housing), behavioural factors (six items; eg, male-to-male sex) and clinical factors (eight items; eg, an HIV diagnosis in the past 6 months). To reduce response bias, each new item was presented in a random order, accompanied by a five-point Likert scale, ranging from strongly disagree (1) to strongly agree (5).

Prescribers who were treating no more than 10 HIV-positive patients were classified as having a low HIV caseload; those treating 11–50 as having a medium HIV caseload; and those treating more than 50 as having a high HIV caseload.

Descriptive statistics, including estimated confidence intervals (CIs), are reported. Data from the two rounds were compared using χ2 tests. Adjusted odds ratios (AORs) and 95% CIs from multivariable generalised linear regression analyses for the ordinal dependent variables are reported for factors significantly associated with prescribers’ attitudes towards and practices of ART initiation. All data analyses were performed in STATA 11.2 (StataCorp).

Results

We analysed 108 valid responses (out of 113 eligible ones) from 2012 and 82 valid responses (out of 91 eligible ones) from 2013. The estimated response rates were 51% in 2012 (113/222) and 41% in 2013 (91/222); about 200–250 ART prescribers had been active ASHM online registrants over the survey periods.

Prescribers’ demographic and clinical profiles were very similar in the two rounds (Box). In both rounds, more than half of the respondents were male. The median age of participants was 49 years in 2012 and 50 years in 2013. Each year, close to half were practising in New South Wales, over 60% had more than 10 years’ experience in treating HIV-positive patients, and about 40% had a high HIV caseload. The sample in 2013 had significantly fewer hospital-based infectious diseases specialists than that in 2012 (P = 0.006).

Support for early ART initiation

In 2013, 41 prescribers indicated that they would most strongly recommend early ART initiation compared with 29 prescribers in 2012 (50.0% [95% CI, 38.7%–61.3%] v 26.9% [95% CI, 18.8%–36.2%]; P = 0.001). This difference remained significant after adjustment for prescriber type (AOR, 1.78 [95% CI, 1.21–2.62]; P = 0.003).

However, only 16 prescribers in 2013 (19.5% [95% CI, 11.6%–29.7%]) would both most strongly recommend and routinely recommend early ART initiation. This was despite the fact that many agreed that available evidence supports early ART initiation. In 2013, 43 prescribers (52.4% [95% CI, 41.1%–63.6%]) agreed that ART initiation at a CD4+ T-cell count approaching 500 cells/mm3 was supported by evidence, and 23 prescribers (28.0% [95% CI, 18.7%–39.1%]) agreed that immediate ART initiation after a diagnosis of HIV, irrespective of CD4+ T-cell count, was supported by evidence.

In 2013, 82 prescribers reported that they had initiated ART for a total of 824 HIV-positive patients in the previous 12 months — an average of 10 patients per year per prescriber (median, 6; range, 0–60). The number of patients for whom ART was initiated was significantly associated with prescribers’ HIV caseload even after adjusting for prescriber type (AOR, 1.73 [95% CI, 1.47–2.03]; < 0.001); of the 37 who had initiated ART for 10 or more patients, 29 had a high HIV caseload.

ART primarily as treatment, not as prevention

In both rounds, prescribers’ primary concern was predominantly individual patient benefit (102 prescribers [94.4%] in 2012 v 80 prescribers [97.6%] in 2013; P = 0.29). A small proportion indicated any population benefit as a primary concern (20 prescribers [18.5%] in 2012 v 23 prescribers [28.0%] in 2013; P = 0.12).

According to prescribers in 2013, only a small proportion of the 824 patients for whom ART was initiated (108 patients [13.1%; 95% CI, 10.9%–15.6%]) were given ART to prevent onward HIV transmission. ART initiation primarily for HIV prevention was also associated with prescribers’ HIV caseload, even after adjustment for prescriber type (AOR, 1.69 [95% CI, 1.18–2.41]; = 0.004); 27 of 38 prescribers who had done so had a high HIV caseload.

Conditional support for ART as prevention

In 2013, 60 prescribers (73.2% [95% CI, 62.2%–82.4%]) reported that they routinely recommended ART to treatment-naive, asymptomatic patients with a CD4+ T-cell count of 350–500 cells/mm3, as suggested by the latest clinical guidelines.1

However, a range of perceived patient characteristics were found to substantially alter the likelihood of ART recommendation by prescribers. Notably, all prescribers in 2013 stated that they would recommend ART to patients with an uninfected regular partner. Also, the vast majority would recommend ART to patients engaging in unprotected intercourse with any non-HIV-positive partner (80 prescribers [97.6%; 95% CI, 91.5%–99.7%]) or selling sex (79 prescribers [96.3%; 95% CI, 89.7%–99.2%]).

In contrast, ART was less likely to be recommended to patients with a history of medication non-adherence (34 prescribers [41.5%; 95% CI, 30.7%–52.9%]) or a history of at least three missed clinical appointments in the previous 12 months (36 prescribers [43.9%; 95% CI, 33.0%–55.3%]).

Discussion

Australian ART prescribers have made swift yet cautious moves towards early ART initiation since 2012, keeping pace with clinical guideline changes.4,5,11 With regard to ART initiation, prescribers prioritise individual patient health over HIV prevention benefit. Early ART initiation was supported by most prescribers primarily as treatment rather than as prevention, with the exception of high HIV caseload prescribers.

While HIV caseload was found to be a key prescriber factor in early ART initiation, perceived patient characteristics (history of medication non-adherence and missed clinical appointments) also influenced clinician compliance with guideline-recommended, routine ART initiation (ie, at a CD4+ T-cell count of 350–500 cells/mm3). Poor clinical engagement and potential ART non-adherence, which suggest increased risk of onward HIV transmission, have previously been shown to be linked with patients’ suboptimal viral suppression.12

In support of early ART initiation, the Australian Pharmaceutical Benefits Advisory Committee recently removed one fundamental structural barrier by expanding the government subsidy for ART to patients who are asymptomatic and have a CD4+ T-cell count above 500 cells/mm3. Future research should assess the influence of this change on ART prescribers’ views and practices.

The main limitations of this study are the small sample sizes and moderate response rates, although response rates are difficult to calculate accurately because the total number of clinicians who are able to prescribe ART in Australia is unknown. Given that there are about 1200 new HIV diagnoses annually in Australia13 and that ART was initiated for 824 patients in 2013, we probably captured a considerable proportion of ART prescribers. Finally, the repeated, anonymous, cross-sectional design precludes causal inferences and further analysis of changes for each individual prescriber.

Our findings show increasing acceptance of and support for early ART initiation primarily as treatment and not as prevention.

Demographic characteristics and clinical experience of antiretroviral treatment prescribers who participated in surveys in 2012 and 2013


2012 (n = 108)

2013 (n = 82)

P


Demographics


Gender


0.79

Male

61 (56.5%)

50 (61.0%)


Female

46 (42.6%)

31 (37.8%)


Transgender

1 (0.9%)

1 (1.2%)


Age


0.84

< 45 years old

38 (35.2%)

26 (31.7%)


45–54 years old

42 (38.9%)

32 (39.0%)


≥ 55 years old

28 (25.9%)

24 (29.3%)


Clinical experience


Primary work place location


0.52

New South Wales

52 (48.1%)

46 (56.1%)


Victoria

27 (25.0%)

16 (19.5%)


Other Australian states or territories

29 (26.9%)

20 (24.4%)


Prescriber type


0.006

Hospital-based infectious diseases specialist

23 (21.3%)

9 (11.0%)


Sexual health centre-based physician

28 (25.9%)

35 (42.7%)


Section 100 accredited general practitioner

44 (40.7%)

36 (43.9%)


Other*

13 (12.0%)

2 (2.4%)


Period of treating HIV-positive patients


0.51

1–5 years

23 (21.3%)

14 (17.1%)


6–10 years

18 (16.7%)

13 (15.9%)


> 10 years

65 (60.2%)

55 (67.1%)


Missing

2 (1.9%)

0


Number of HIV-positive patients as a primary provider


0.15

1–10 patients (low HIV caseload)

22 (20.4%)

9 (11.0%)


11–50 patients (medium HIV caseload)

43 (39.8%)

33 (40.2%)


> 50 patients (high HIV caseload)

41 (38.0%)

40 (48.8%)


Missing

2 (1.9%)

0


* In 2012, other included five hospital-based prescribers of unspecified specialty, five hospital-based immunology specialists, one prison-based physician, one sexual health physician working in private practice and one participant for whom prescriber type was missing; in 2013, other included one non-hospital-based immunology specialist and one GP who did not have Section 100 accreditation.


First reported case of transfusion-transmitted Ross River virus infection

We describe the first documented case of Ross River virus (RRV) infection transmitted by blood transfusion. The recipient had a clinically compatible illness, and RRV infection was confirmed by serological tests. The implicated donation was positive for RRV RNA. We discuss the risk to blood recipients and the implications for blood donation in Australia.

Clinical record

In May 2014, the Australian Red Cross Blood Service (the Blood Service) in Western Australia received a delayed notification from a donor who had developed fatigue and arthralgia 2 days after giving blood in March 2014 and was subsequently diagnosed with acute Ross River virus (RRV) infection (Box).

PathWest Laboratory Medicine WA detected RRV IgM antibodies using an inhouse indirect immunofluorescence antibody (IFA) test, but no RRV antibodies were detected using an inhouse haemagglutination inhibition (HI) antibody test 10 days after blood donation. RRV IgM antibodies are detected by IFA testing within a few days of onset of illness and routinely persist for several weeks or, occasionally, months or years. IFA tests are less prone to false-positive results compared with enzyme immunoassays. The HI antibody test primarily detects IgG antibodies, which appear within several weeks but after the IgM response.

Blood Service procedure stipulates that donors with a diagnosed RRV infection are unable to donate fresh components for 4 weeks after recovery. Moreover, fresh components donated from 4 weeks before illness onset to 4 weeks after recovery must be recalled.

The components from the implicated donation were identified: the red blood cell (RBC) component had been transfused to a patient on 12 March 2014, the plasma had been pooled for the manufacture of plasma-derived products and the platelet component had not been used. The treating clinician of the RBC recipient was notified as part of the recall procedure.

The recipient was having regular blood transfusions due to myelodysplastic syndrome that was associated with chronic fatigue and joint pains. The recipient reported a worsening of symptoms in the months after transfusion of the infected blood; however, there was not a clear exacerbation of these symptoms consistent with the incubation period of RRV.

On notification from the Blood Service, the recipient’s treating clinician requested serological testing for RRV on 28 May 2014, which found detectable IgM antibodies using the IFA assay and a high titre of antibodies by HI testing (antibody titre, > 1 : 640). The detection of both IgM and HI antibodies indicates RRV infection in recent months. Previous testing for RRV IgM and HI antibodies in 2006 and August 2013 had been negative. Subsequent inhouse reverse transcriptase polymerase chain reaction (RT-PCR) analysis for RRV RNA performed on stored serum from 28 May gave a negative result. These results are consistent with RRV illness several months before 28 May, with resolution of the transient viraemic phase. No samples from the recipient in March 2014 were available for serological or PCR testing.

In response to this possible case of transfusion-transmitted RRV, the associated archived donor sample was retrieved and sent to the Victorian Infectious Diseases Reference Laboratory for RRV serological tests and RT-PCR analysis. This sample tested negative for RRV IgM and IgG but RRV RNA was detected by two inhouse RT-PCR tests and verified by sequencing. These results are consistent with the blood donation being collected during the pre-seroconversion but transient viraemic phase of RRV illness.

Discussion

Since the isolation of RRV from humans was first reported in 1972,1 our understanding of the epidemiology of the disease has increased considerably. RRV is now known to be the most common mosquito-borne disease of humans in Australia,2 and is endemic in several regions. An average of around 5000 cases of RRV disease are notified annually in Australia, with considerable yearly, seasonal and regional variability due to differences in environmental conditions that affect the mosquito vectors and native animal hosts of the virus.2 The incubation period averages 7 to 9 days with a range of 2 to 21 days.3 Symptoms of RRV most commonly include joint manifestations, which are usually symmetrical and acute in onset, with rash and fever being less common.3 As many as 55% to 75% of RRV infections are asymptomatic.3

Arboviruses such as dengue viruses and West Nile virus are known to be transfusion transmissible,4 and the potential of RRV to be transfusion transmissible was raised in this Journal in 1995.5

Although not previously documented, transfusion transmission of RRV has been considered theoretically possible, given a likely period of asymptomatic viraemia before the onset of symptoms.4,6 This risk is supported by the observation of asymptomatic viraemia typically lasting 5 days after RRV infection in a mouse model.7 On the assumption that transfused blood could transmit RRV, this study estimated the risk of RRV transfusion transmission during a 2004 outbreak in Cairns as one in 13 542 donations. This risk was of the same order of magnitude as that estimated for dengue virus transmission by transfusion during a contemporaneous dengue fever outbreak in Cairns.7

The donor we describe developed an illness clinically compatible with RRV infection 2 days after donating blood and was shown to have a serological profile consistent with acute RRV infection 10 days after donating. The donated blood was subsequently shown to contain RRV RNA by two inhouse RT-PCR tests, and this was confirmed by sequencing.

While the exacerbation of the chronically ill recipient’s fatigue and muscle and joint pains was not clearly consistent with the incubation period of RRV subsequent to the transfusion, the results of RRV serological tests performed about 2 months after transfusion were consistent with infection within this 2-month period. Unfortunately, there were no stored blood specimens collected from the recipient shortly after receiving the blood donation, and hence it was not possible to compare sequences with the donor virus to confirm transmission.

Surveillance by the WA Department of Health showed that the recipient was the only person for whom RRV infection was reported between 1 July 2013 and 30 June 2014 from the local government area in which she resided. The recipient also spent most of her time indoors and could not recall being bitten by mosquitoes. Taken together, these lines of evidence strongly support the likelihood that the recipient’s RRV infection was transmitted by transfusion. Thus, this is the first report of transfusion-transmitted RRV.

Laboratory testing for RRV is not done for Australian blood donors during the donation process, and there is no validated blood screening test for RRV. To manage the risk of transfusion transmission, the Blood Service does not permit donors with symptoms compatible with RRV to donate until they are fully recovered. However, given that most RRV infections are asymptomatic and viraemia is present during the incubation period, excluding donors based on symptoms will not prevent all potentially infectious donations entering the blood supply. Provided infected donors report subsequent illness immediately to the Blood Service, the recall process should prevent the proportion of donations from symptomatic RRV infected donors from being used. Unfortunately, in this case, where notification was delayed for 2 months, the blood component had already been transfused. In response to this, the Blood Service is taking steps to strengthen its messaging to donors regarding development of post-donation illnesses.

In 2012, the Blood Service established a sample archive of every blood donation to meet regulatory standards and assist in investigation and lookback (tracing and notifying patients who may have received infected blood components and investigating donations and donors when a patient has a suspected transfusion-transmissible infection). This archive provides the ability to perform further testing on samples from past donations, as in this case, providing data on the actual risk associated with transfused donations from implicated donors and for investigations where an infection is reported in a recipient.

Transfusion transmission of RRV no longer appears to be only a theoretical risk. However, with about 5000 mosquito-related RRV notifications per year, transfusion transmission of RRV — or the related Barmah Forest virus, which has a lower incidence — is likely to remain a rare event. Any actions taken to prevent infected components entering the blood supply need to take into account the cost, the impact on supply and the severity of the infection in recipients. Laboratory screening is not a feasible option, given that RRV nucleic acid testing is not validated for blood donation screening or available for the large-scale nucleic acid detection equipment used by the Blood Service. In addition, the cost of individual testing is unlikely to be cost-effective and, although RRV can cause debilitating symptoms in some patients, most infections are either asymptomatic or mild and self-limiting.8

Identifying donors who are at risk of exposure and temporarily excluding them from donating fresh blood components in areas and times of RRV outbreaks is one potential risk-mitigation option. When this strategy was applied to dengue fever, it was estimated to cost the Blood Service around $1.0–$3.8 million.9 However, irrespective of the financial cost, this option is unlikely to be feasible, since RRV is endemic in many parts of Australia and such restrictions might have a critical impact on supply. Pathogen reduction technology (PRT) is an alternative risk-management option that would not have an impact on supply. The Blood Service is investigating the effectiveness of PRT for the prevention of arboviral transfusion transmission, including RRV, but further research is needed.10

The Australian blood supply is one of the safest in the world with respect to transfusion-transmitted infections. Yet, it is important to remember that blood transfusion is not without risk and should only be undertaken when the efficacy of the transfusion and improved clinical outcome outweigh the risks.11

Timeline of major events related to the case of Ross River virus (RRV) transfusion transmission, 2014


PCR = polymerase chain reaction.

Pyogenic brain abscess due to Streptococcus anginosus

A 23-year-old previously healthy Filipina migrant woman presented with confusion and worsening headache.

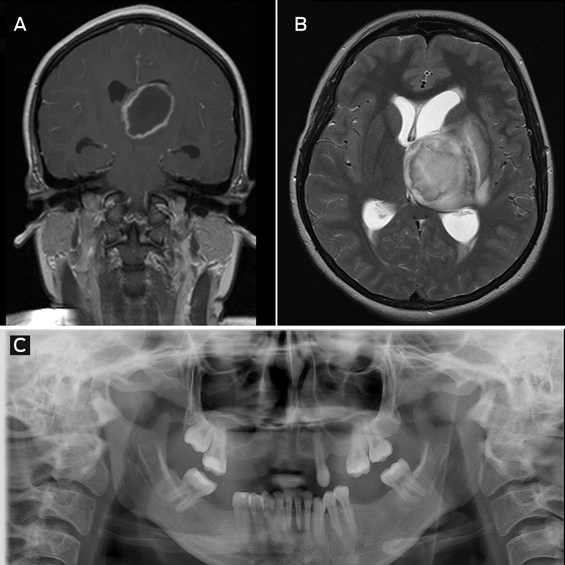
Magnetic resonance imaging showed a 4.6 × 5.1 cm ring-enhancing lesion in the left thalamus, with extensive surrounding oedema (Figure, A and B).

Microscopy of a biopsy sample showed pus and gram-positive cocci. Cultures grew Streptococcus anginosus (also known as Streptococcus milleri), an organism that is part of normal oral flora and a well known cause of metastatic abscesses.

The patient admitted to undergoing multiple recent tooth extractions (Figure, C). She was treated with 6 weeks of intravenous benzylpenicillin and made a full recovery, with complete abscess resolution on follow-up imaging.