In mid-August 2012, Pamela (not her real name), a university lecturer, visited the Amazon rainforest in north-eastern Peru to conduct a mammal survey, watching and recording wildlife, for a week. She also owned a small sheep farm in Victoria. She had no pre-existing comorbidities.
During her stay in Peru she noticed increasing soreness and a slight discharge behind her right ear. While flying back to Australia, Pamela felt that “things” were moving in a hole behind her right ear, where intense pain was felt intermittently.
Upon arrival in Melbourne, she presented to The Travel Doctor clinic, suspecting that she might have contracted myiasis. On examination, there was an open cavity of about 1 cm in diameter behind her right pinna, filled with maggots wriggling in serous fluid (Box, A). The diagnosis of wound (rather than dermal) myiasis was immediately obvious.
Twenty-three live larvae were extracted from the cavity. After the procedure, the pain subsided significantly and the wound healed within 12 days. At the Victorian Infectious Diseases Reference Laboratory, the maggots were identified as larvae of Cochliomyia hominivorax, the New World screw-worm fly (NWSF). All containers used for transport and storage were autoclaved and destroyed as biological waste.
Human cutaneous myiasis is typically furuncular and confined to dermal tissues. For example, the larvae of the African tumbu and South America bot flies form characteristic localised lesions, each containing one maggot.1 However, typical of wound myiasis, this infection was much deeper, containing multiple larvae.1 NWSF larvae can typically burrow to a depth of 4 cm, producing large cavities as seen in this case.2 The NWSF is attracted to wounds to lay eggs. Unlike most other species of blowflies, adult female screw-worms lay their eggs at the edges of wounds on living, injured mammals.2 Pamela underwent a minor facelift in January 2012, with gathered epithelial tissue behind her ears. Pamela’s site of infection was most likely an abrasion on the skinfold from a hatband.
The main diagnostic feature was the presence of dark pigmentation of the dorsal tracheal tubes extending over 2–3 segments at the posterior end (Box, B).2 The larvae were in the third instar and close to maturity (Box, C).2 Full development takes 5–7 days, after which they fall to the ground to pupate.2
The range of the NWSF is restricted to Central and South America.1,2 Before major eradication campaigns, it extended from the southern states of the United States to Argentina. The NWSF is exotic to Australia and suspicion of infestation in animals is notifiable under state and territory animal health legislation.3 By contrast, screw-worm fly infestation in humans is not notifiable.4
Although the results of surveillance corroborate a low likelihood of incursion into Australia,5 with large feral animal populations in the north and large numbers of livestock along the eastern seaboard, there is a significant possibility of the screw-worm fly becoming established if it manages to gain entry into Australia.6–8
Biosecurity practices and prompt recognition and reporting of an incursion (Emergency Animal Disease Watch Hotline, 1800 675 888),5,9 are critical to Australia’s preparation for screw-worm flies and other exotic diseases and pests. Pamela’s case reinforces that the risk for Australia is real.
Box –
Wound myiasis from New World screw-worm fly infestation
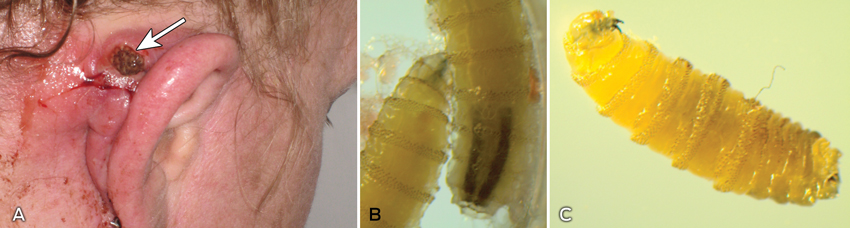
A: Open cavity behind the patient’s right pinna, filled with maggots. B: Larvae (third instar) of Cochliomyia hominivorax. The main diagnostic feature was the dark pigmented dorsal tracheal tubes at the posterior end of the larvae. C: Larva (third instar) of C. hominivorax. The hook-like mouthpart (on the left) of a live larva constantly strikes with a digging movement inside the host tissue.
