Antimicrobial agents play a central role in modern health care, especially in the hospital setting. Many of the modern advances in health care such as intensive care, neonatal care, cancer chemotherapy, complex surgery and prosthetic joint replacement depend on the ongoing effectiveness of antimicrobials. However, antimicrobial resistance (AMR) has emerged in the most common and important pathogens, and as resistances have accumulated, multiresistant strains have arisen. The impact of resistance and multiresistance is being felt worldwide.1
In Australian hospitals, some multiresistant organisms were epidemic and have now become endemic in many facilities, particularly those delivering tertiary and quaternary care. Much of this resistance is driven by hospital antimicrobial use. Because antimicrobials are necessary for providing safe care in hospitals, questions arise about what factors in antimicrobial use may be adjusted in order to deliver both low levels of resistance and low prevalence of multiresistant organisms. Factors to consider include relationships between volumes of antimicrobials used and AMR; patterns of use and AMR; and appropriateness of prescribing.
The Australian Commission on Safety and Quality in Health Care (the Commission) has produced a range of resources regarding antimicrobial stewardship, now considered to be the most effective tool in promoting rational antimicrobial use. Antimicrobial stewardship is a term that describes a suite of activities designed to maximise the rational use of antimicrobials and minimise the selection pressure for AMR. In 2011, the Commission released a blueprint for antimicrobial stewardship in Australian hospitals.2 In 2012, the Commission released the National Safety and Quality Health Service Standards (NSQHSS) for hospital accreditation. Within Standard 3: Preventing and controlling healthcare associated infections3 there is a requirement for hospitals to develop and implement an antimicrobial stewardship program, and regularly review its effectiveness (Standard 3.14). Subsequently, the Commission has developed a clinical care standard for antimicrobial stewardship, designed to provide a basic set of nine standards that prescribers of antimicrobials should follow.4
In 2013, the Commission also commenced the task of coordinating the development of a national surveillance system for antimicrobial resistance and antimicrobial use — the AURA (Antimicrobial Use and Resistance in Australia) project (http://www.safetyandquality.gov.au/national-priorities/amr-and-au-surveillance-project). Two key elements of the system are passive and targeted surveillance of antimicrobial use in hospitals. In this context, passive surveillance refers to the collation of data primarily collected for other purposes (such as pharmacy dispensing data), while targeted surveillance refers to data gathered for a specific purpose — for example, data on appropriateness of prescribing and compliance with guidelines.
The AURA project was in a good position to develop both of these types of surveillance by building upon existing initiatives. The National Antimicrobial Utilisation Surveillance Program (NAUSP), established in 2004 and funded by the Australian Government Department of Health, forms the basis of the passive antimicrobial surveillance. The program built on a South Australian initiative to incorporate data from other Australian states. Targeted surveillance is based on the National Antimicrobial Prescribing Survey (NAPS), a 2011 initiative of clinicians at Royal Melbourne Hospital to establish a national auditing tool for hospital stewardship teams to use in assessing appropriateness of prescribing in their own hospitals using published methodology.5 This has matured into an online tool that was rolled out nationally in 2013. Although both programs are built on voluntary participation (there are currently no mechanisms available to mandate participation), by 2014 NAUSP had 129 participants and NAPS had 248 participants.
Data sources and representativeness
The data presented here are from the 2014 NAUSP report6 and the 2013 and 2014 NAPS reports.7,8 All these results must be interpreted with caution, given the voluntary nature of participation in the programs.
We examined the representativeness of participation in both programs in 2014 using the data provided in the Australian Institute of Health and Welfare (AIHW) publication on hospital peer groups in November 2015, to which we added two hospital sites that had provided data in 2014 but did not appear on the AIHW list.9 Of the 748 public hospitals in Australia, the NAUSP program collected data from 14.8%, and the NAPS program collected data from 26.3%. The percentages from the 497 private hospitals were 3.6% and 10.3% respectively. The Northern Territory did not provide usable data to NAUSP in 2014. In addition, NAUSP did not collect data from children’s hospitals (see below). Participation was greatest from principal referral hospitals, and public and private acute hospitals in groups A and B of the AIHW peer group list; NAUSP collected data from 61.0% of 195 hospitals in these categories, while NAPS also collected 61.0%; of these 45.1% were in common. The majority of participants were from remoteness groups “major city” and “inner regional” (93.0% for NAUSP and 76.0% for NAPS), reflecting the availability of resources in larger/hospitals and centres. Overall, 92 hospitals contributed data to both programs in 2014. A more detailed analysis of representativeness is given in Supplementary Tables S1–S3 in the Appendix at mja.com.au. Information on the types of data collected in each program, including their limitations, is given in the volumes of use and appropriateness sections below. The imbalances created by voluntary participation are found in these tables.
Volumes of antibacterial use, including variations and trends
NAUSP collects data from public and private hospitals, excluding paediatric hospitals and paediatric wards. These exclusions are because there is no internationally agreed measure equivalent to that used for adults, namely defined daily doses (DDD) per 1000 occupied bed days (OBD). It reports on use of antibacterials, but not antifungals or antiviral agents, dispensed to adult, acute care inpatient wards and emergency departments. Data from psychiatric services, rehabilitation, dialysis and day surgery units are not included in order to align with international definitions of somatic care, and outpatient data are also not included. The data also exclude most topical formulations, as well as antimycobacterials (except rifampicin) and antimicrobials prepared as infuser packs. NAUSP undertakes data validation at the time of receipt, including outlier detection. All suspect data are queried with the relevant participant, and corrections made if errors are confirmed.
Across all Australian hospitals participating in calendar year 2014, the total aggregate use rate of systemic antimicrobials was 936 DDD/1000 OBD, ranging from a low of 330 to a high of 2040 DDD/1000 OBD — more than a sixfold difference. The overall rate compares with 597 DDD/1000 OBD in Sweden,10 747 DDD/1000 OBD in the Netherlands,11 and 944 DDD/1000 OBD in Denmark.12 These are the only countries currently publishing comparable data.
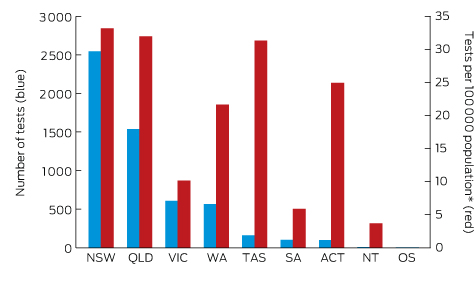
There were noticeable variations between states (Box 1), the highest rates being in Tasmania. The reasons for such variations are not clear. While there is likely to be less antimicrobial use in small states and territories due to lack of availability of highly complex interventions, this would not seem to account for the pattern observed. Higher use in Tas may have been related to statewide adoption of combination narrow spectrum antimicrobials for urinary and intra-abdominal infections (eg, amoxicillin + gentamicin + metronidazole = 10–12 DDD compared with ceftriaxone + metronidazole = 2 DDD). Imbalances in representativeness between states (see Supplementary Table S2 in the Appendix at mja.com.au) are also likely to have contributed to the variation, although even greater variation has been observed nationally between hospitals in the same peer group.13
There is also some variation in use related to hospital type. Using the new peer group classification of public hospitals promulgated by the AIHW,9 aggregate rates of usage in principal referral hospitals in 2014 were 927 DDD/1000 OBD (range, 544–1511), 985 DDD/1000 OBD in large public acute hospitals (range, 451–2050), and 872 DDD/1000 OBD in medium public acute hospitals (range, 504–1345). This variation was different to what might have been expected, given the assumption that principal referral hospitals would have the most complex patients and procedures and therefore require the highest antimicrobial use. This may also be a reflection of the presence of more mature stewardship programs in principal referral institutions.
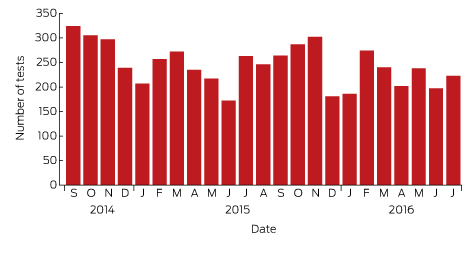
Box 2 shows usage rates of the various classes of antimicrobials over the ten years to 2014. There has been a steady decline in total usage nationally since 2010. Some of this can be attributed to the increasing numbers of smaller institutions joining the program, but it is thought that at least some part of the reduction can be attributed to an increasing focus on antimicrobial stewardship. During the period from January to December 2014, the aggregate antibacterial usage rate for all participants (n = 129) was 936 DDD/1000 OBD (Box 2). Compared with a rate of 961 DDD/1000 OBD for the previous year (n = 113), this represents a 2.6% decrease. Excluding the new participants, the decrease was still 1.6%.
The most commonly prescribed antibacterials in Australia are shown in Box 3 as a percentage of all use or prescriptions. The differences in data collection methods between NAUSP and NAPS mean that there are differences in many of the percentages: NAUSP captures all use throughout the year and provides output as a percentage of total DDD/1000 OBD. NAPS output is cross-sectional data at a point in time or over a short time interval. Hence, agents such as cefazolin, which is prescribed frequently but often for very short durations, features prominently in NAPS, but less so in NAUSP. Of note is the significant proportion of use/prescriptions for ceftriaxone (4.5% in NAUSP and 9.1% in NAPS), an agent that many antimicrobial stewardship teams would consider should be reserved for specific indications and should only be prescribed with stewardship team approval.
Appropriateness of antimicrobial use, including variations
The principal aim of the NAPS tool is to provide data to antimicrobial stewardship teams on the rates of appropriate use and compliance to guidelines in their own hospitals. The stewardship teams are able to use the data to identify local issues and prioritise their stewardship activities. The utility of the online collection and storage of data allows individual teams to compare themselves with their peers, and provides the opportunity to gain better insight into national and regional rates. Participation is voluntary, but has been significantly boosted by the release of Standard 3.14 in the Commission’s hospital accreditation standards. Participation resource requirements are significantly lower than for NAUSP, because NAPS surveys are conducted annually, largely as a point prevalence survey to coincide with antimicrobial awareness week in November. The survey methods have been developed to support hospitals of all sizes and complexity, so that point prevalence surveys (single and repeated), period prevalence surveys, and random patient selection surveys are all available to hospitals. Benchmarking is only available for point prevalence and random selection surveys. The NAPS tool has been developed using published methods5 modelled on those developed and applied in Europe,14 and which are now being applied internationally.15,16
To ensure data validity, participants are required to follow a structured assessment guide. In addition, training is provided to all participants and phone advice is offered by the NAPS team for participants who have uncertainties or questions about specific prescriptions. To reduce the impact of lack of expertise in sites that do not have direct access to expert advice from infectious diseases physicians or microbiologists, remote support is provided by skilled antimicrobial stewardship personnel.17 The validity of this approach has been reinforced by the consistency of findings between the years 2013 and 2014 (Box 4). In 2014, 248 hospitals participated, including 197 public hospitals (26.3% of all public hospitals in Australia) and 51 private hospitals (10.3%). This was a 64% increase on the number of participants in the previous year. The most popular method, a whole-of-hospital point prevalence survey on a single day, was conducted by 42.3% of participants, followed by a whole-of-hospital repeated point prevalence survey (with the time between surveys varying from consecutive days to several months) by 28.6%. Together, these two methods accounted for 70.9% of hospitals but 79.9% of all prescriptions reviewed. The remaining 29.1% of hospitals chose to survey selected wards or specialties, collected a random sample, selected antimicrobials or indications, or used other methods. The total number of prescriptions reviewed by all hospitals was 19 994. The variation in data collection methods means that the data presented here should be considered at best indicative.
Box 4 shows the overall findings for the key indicators of appropriateness and compliance with guidelines, comparing results from 2014 with those found in 2013. For these indicators, all participants were provided with standard recommendations for assessing appropriateness, and the Therapeutic guidelines: antibiotic18 or locally developed guidelines/protocols were used to judge compliance. Best practice rates for some of these indicators were included. Among the results were:
-
Only 74% of prescriptions had an indication documented in the medical record (best practice, >95%). If prophylaxis indications were excluded, that figure rose to 79.2%.
-
The prescription was considered inappropriate in 24% of cases where a satisfactory assessment of the prescription could be made.
-
Non-compliance with guidelines was detected in 26% of cases where compliance was assessable.
In 2014, there were some differences between states in rates of appropriate prescribing, with the Australian Capital Territory having the lowest rate (68.2%) and Queensland the highest (79.2%). Similarly, rates of compliance with guidelines had differences across states, with ACT having the lowest 65.2% and Queensland the highest (72.5%). There was little variation in rates of appropriate prescribing across hospital peer groups, but there was a tendency for compliance with guidelines to be lower in smaller hospitals. Remoteness had little impact on either appropriateness or compliance with guidelines. Rates for both were slightly lower in private hospitals (75.1% and 65.2% respectively) compared with public hospitals (77.2% and 70.6% respectively).8
A notable finding was the frequency with which surgical antimicrobial prophylaxis was administered for more than 24 hours. For most surgical procedures where antimicrobial prophylaxis is warranted, a single dose of the agent at the time of skin or mucosal incision, or less than 1 hour before the procedure, is known to be adequate.18 In 2013, more than 40% of surgical prophylaxis courses lasted longer than 24 hours, falling to 36% in 2014. The findings of the 2014 survey also identified that surgical prophylaxis was not indicated at least 20% of the times that it was prescribed.
Antimicrobial agents that are often used as directed therapy, for instance flucloxacillin for staphylococcal infection, or antimicrobials prescribed as part of treatment protocols for cancer chemotherapy, tended to have high rates of appropriate use in 2014. For prescriptions that could be adequately assessed, five antimicrobials (cefalexin, amoxicillin–clavulanate, azithromycin, cefazolin and ceftriaxone) all had rates of inappropriate use above 30%, with that for cefalexin exceeding 40%.
Apart from surgical prophylaxis as discussed above, the other notable condition for which antimicrobials were frequently prescribed inappropriately in 2014 was infective exacerbations of chronic obstructive pulmonary disease, with a rate of appropriate prescribing of only 62%. For the latter condition, appropriate prescribing involves the use of oral amoxicillin or doxycycline, and not broader spectrum or intravenous antibacterials.
Possible areas for action and intervention
Despite the voluntary nature of participation in the NAUSP and NAPS, a picture of antimicrobial practices in Australian hospitals is now emerging from these datasets. Before the emergence of these programs, there was no information about antimicrobial use across Australia. The datasets indicate that there are major opportunities for improvement for antimicrobial stewardship programs, and provide strong evidence for their introduction in hospitals where stewardship systems have not yet become established,. Stewardship programs should focus on the implementation of the Antimicrobial Stewardship Clinical Care Standard,4 and also ensure that prescribers have access to treatment guidelines, especially the national Therapeutic guidelines: antibiotic.18
The most important benefits of NAUSP and NAPS are that they provide stewardship programs with the capacity to benchmark and identify issues peculiar to their own institution. This greatly assists in directing efforts to the areas of greatest need at the local level. Nevertheless, NAUSP has identified high rates of use across Australia (57% higher than Sweden for example), albeit with a trend downward. NAPS is the only published antimicrobial prescribing survey that includes appropriateness of use as a composite measure of prescribing quality. This is important because clinical guidelines cannot cover all aspects of empirical and directed therapy. Recent reports show that the number of hospitals participating in NAPS well exceeds those participating in point prevalence surveys in other countries.15,16 Further, NAPS has identified major areas for intervention, such as the appropriate use of surgical prophylaxis, and prescribing for infective exacerbations of chronic obstructive pulmonary disease. The Commission believes that surgical prophylaxis is worthy of a national approach and has contacted several peak bodies such as the Royal Australasian College of Surgeons to drive improvements in this area.
The adoption of the NSQHSS has provided a significant boost to participation in NAUSP and NAPS. Stewardship programs are now able to compare their performance with overall use and prescribing practices. The findings of these two programs are already generating benefits for the participants. However, participation is still voluntary. Ultimately, all hospitals will be required to generate data of this kind for accreditation against Standard 3 of the NSQHSS. Participation in these national programs will be a simple method for them to achieve this.
The voluntary nature of participation in these programs has necessarily created imbalances in participation between hospital types and jurisdictions. Participation requires time and effort from hospital pharmacists, including stewardship pharmacists, infectious diseases physicians, microbiologists and often infection control staff and other nursing staff. Hospitals vary greatly in their size, throughput and resources (see separation rate variation in Supplementary Table S1 in the Appendix at mja.com.au). In some circumstances, particularly in outer regional and remote areas, pharmacy services are delivered offsite, and the hospital does not have access to the data required for NAUSP participation. Nevertheless, the Commission will continue to promote participation in both programs for all hospitals because the principles of antimicrobial stewardship apply everywhere that antimicrobials are used.
Both NAUSP and NAPS have identified specific issues and gaps in their data collection. For NAUSP, the single most important issue is the measure used — DDD/1000 OBD. While this measure is suitable for international comparisons, there are a number of instances where the internationally agreed DDD does not concur with the most commonly prescribed daily dose in Australia. Another important issue is the lack of DDDs for children, leading to underreporting of total volumes of use in the paediatric population. Moreover, generating totals for antimicrobials does not reveal how many patients are exposed to antimicrobials during their stay. This is likely to be a more relevant measure of selection pressure for antimicrobial resistance. The NAPS data are also vulnerable to the level of expertise of the participants in assessing appropriateness of use and compliance with guidelines, although, as noted above, strenuous efforts are being made to overcome this problem. Ultimately, all participants will be trained and skilled to undertake these surveys. As the AURA project moves from establishment to maintenance, it will be necessary to fill in the gaps and solve the issues found in both programs, as well as to encourage both ongoing and increased participation.
The building of workforce capacity and competence to undertake antimicrobial stewardship is an essential requirement to meet the objectives of the National Antimicrobial Resistance Strategy.19 The evolution of pharmacy and clinical information systems, and the introduction of electronic medical records and electronic medicines management, will improve data capture and interpretation for NAUSP and NAPS significantly and will enhance the quality of data contributing to national surveillance of antimicrobial use.
Box 1 –
Total hospital antibacterial use by state (all NAUSP hospitals, all antibacterial classes), 2014*
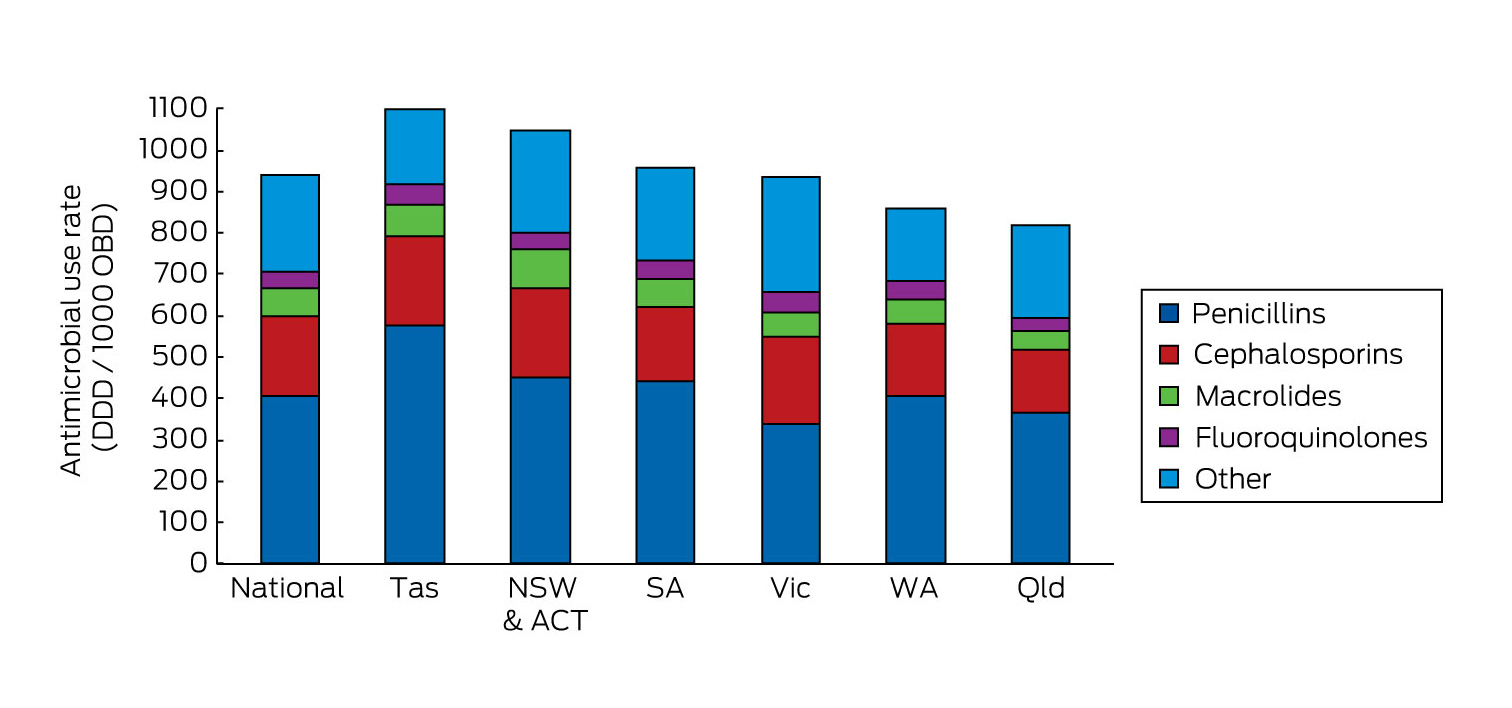
DDD = defined daily doses. NAUSP = National Antimicrobial Utilisation Surveillance Program. OBD = occupied bed days. * Northern Territory did not provide usable data in 2014.
Box 2 –
Total hospital antibacterial use by year (all NAUSP hospitals, all antibacterial classes)
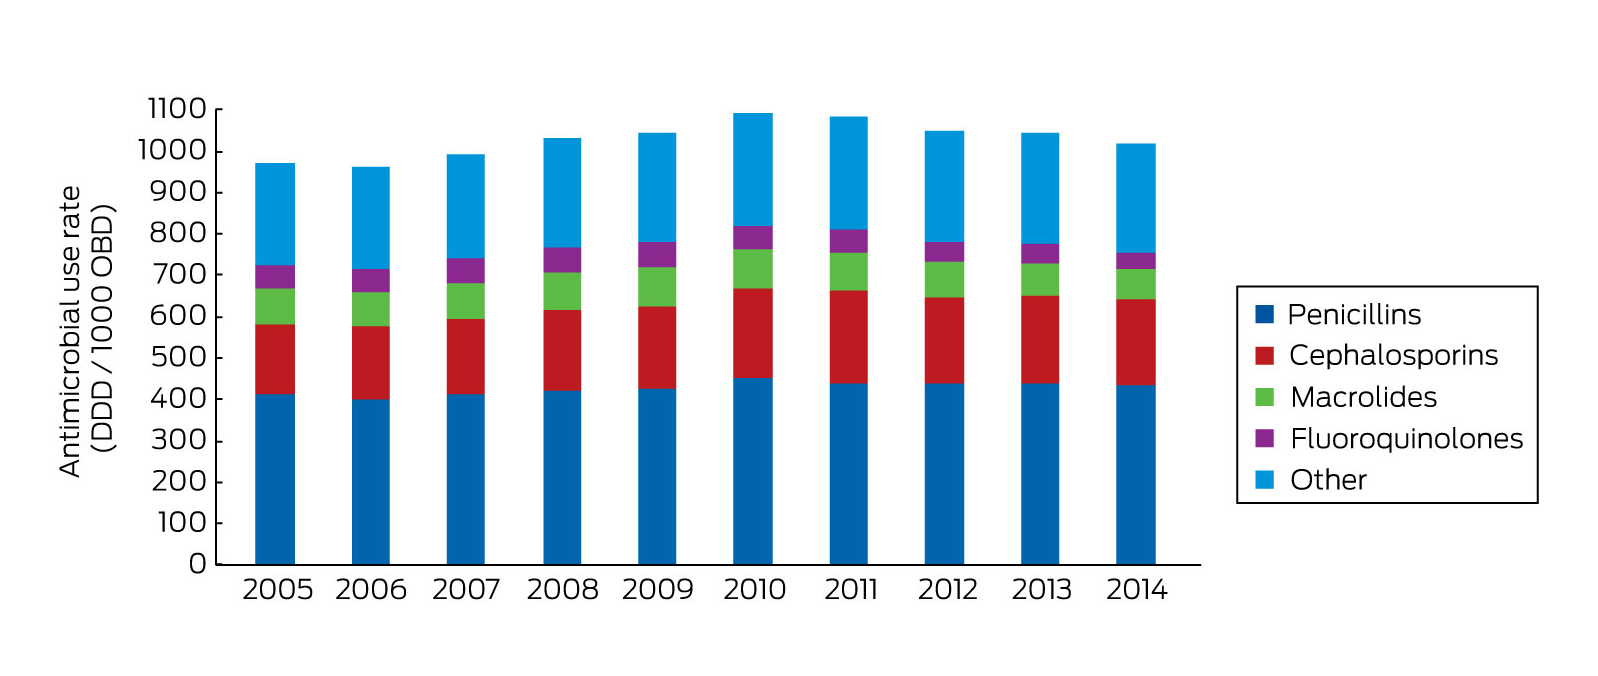
DDD = defined daily doses. NAUSP = National Antimicrobial Utilisation Surveillance Program. OBD = occupied bed days.
Box 3 –
Top ten antimicrobials in 2014 — proportion of total use (NAUSP) or prescriptions (NAPS)
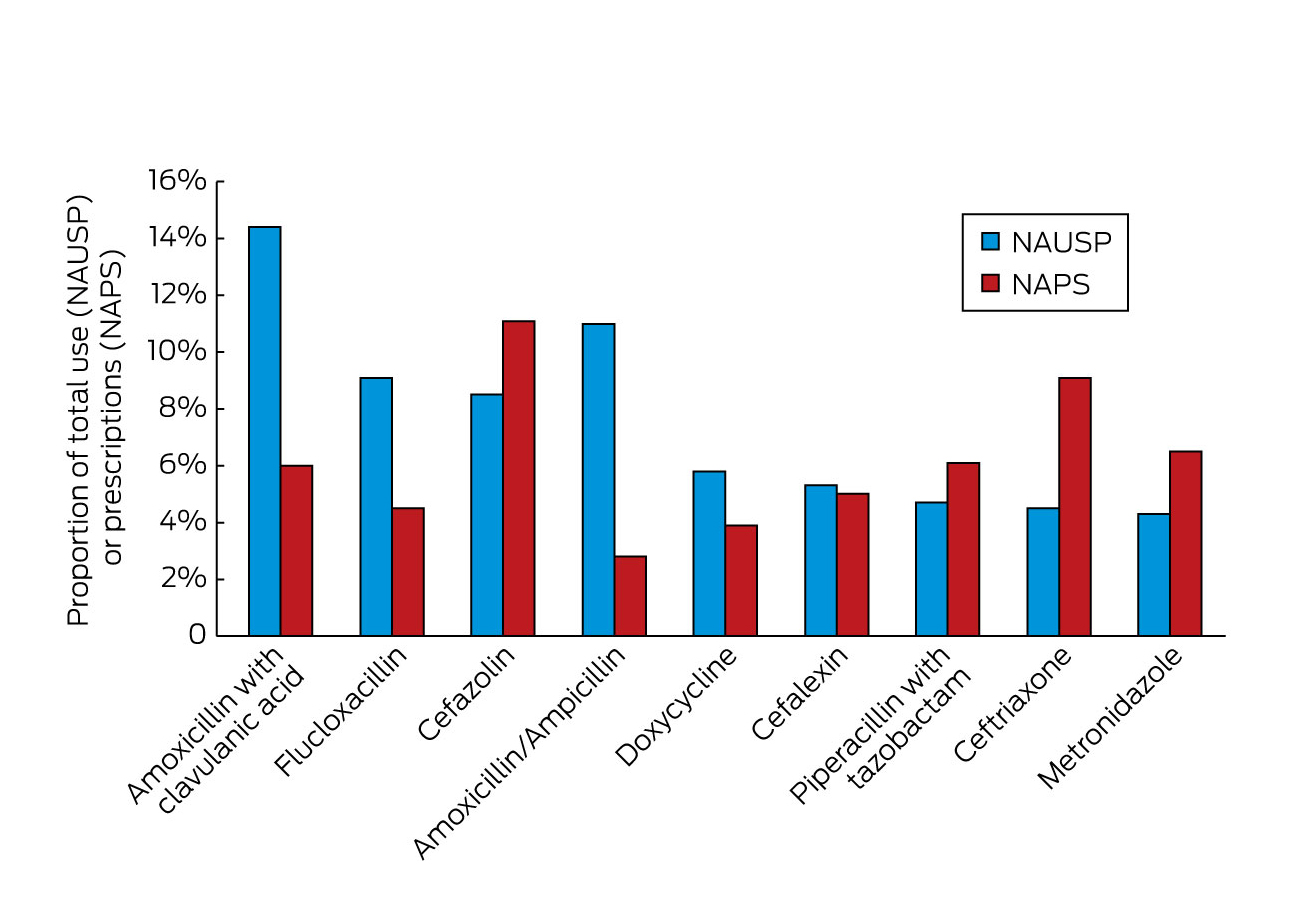
NAPS = National Antimicrobial Prescribing Survey. NAUSP = National Antimicrobial Utilisation Surveillance Program.
Box 4 –
Results of key indicators in 2013 and 2014 for all participating hospitals8
|
Key indicator |
% of total prescriptions |
% change from 2013 |
|||||||||||||
|
2013 |
2014 |
||||||||||||||
|
|
|||||||||||||||
|
Indication documented in medical notes (best practice, > 95%) |
70.9 |
74.0 |
+ 3.1 |
||||||||||||
|
Appropriateness |
|
|
|
||||||||||||
|
Appropriate (optimal and adequate) |
70.8 (75.6)* |
72.3 (75.9)* |
+ 1.5 |
||||||||||||
|
Inappropriate (suboptimal and inadequate) |
22.9 (24.4)* |
23.0 (24.1)* |
+ 0.1 |
||||||||||||
|
Not assessable |
6.3 |
4.7 |
– 1.6 |
||||||||||||
|
Compliance with guidelines |
|
|
|
||||||||||||
|
Compliant with Therapeutic guidelines: antibiotic18 or local guidelines |
59.7 (72.2)† |
56.2 (73.7)† |
– 3.5 |
||||||||||||
|
Non-compliant |
23.0 (27.8)† |
24.3 (26.3)† |
+ 1.3 |
||||||||||||
|
Directed therapy‡ |
na |
10.4 |
na |
||||||||||||
|
No guideline available |
11.0 |
4.6 |
− 6.4 |
||||||||||||
|
Not assessable |
6.3 |
4.5 |
− 1.8 |
||||||||||||
|
Surgical prophylaxis given for > 24 hours (best practice, < 5%) |
41.8 |
35.9§ |
− 5.9 |
||||||||||||
|
|
|||||||||||||||
|
na = not applicable * Figures without parentheses apply to all prescriptions. Figures in parentheses apply to prescriptions where appropriateness was assessable (12 001 prescriptions in 2013; 18 998 prescriptions in 2014); the denominator excludes antimicrobial prescriptions marked “Not assessable”. † Figures without parentheses apply to all prescriptions. Figures in parentheses apply to prescriptions where compliance was assessable (10 599 prescriptions in 2013; 15 899 prescriptions in 2014); the denominator excludes antimicrobial prescriptions marked “Directed therapy”, “Not available” or “Not assessable”. ‡ Introduced in the 2014 survey as a new classification category. § Where surgical prophylaxis was selected as the indication (2785 prescriptions). |
|||||||||||||||