“Speak up. Step up. Stand out.” With this slogan for the fifth annual Crohn’s and Colitis Awareness Week, the Crohn’s & Colitis Foundation of America was asking everyone to raise awareness of Crohn’s disease and ulcerative colitis. Despite the invisible nature of these incurable diseases, patients with inflammatory bowel disease have symptoms including severe abdominal pain, weight loss, and diarrhoea. The onset of Crohn’s disease is characterised most often by an inflammatory phenotype; most patients develop stricturing or penetrating complications, or both, over time.
Preference: Infectious Diseases and Parasitology
434
[Comment] From arterial ageing to cardiovascular disease
Although cardiovascular disease is one of the most prevalent and studied diseases in high-income countries, its aetiology has not been fully unveiled. Study of its pathophysiology in other regions will help develop a greater understanding of the disease.
Prevalence of microcephaly in an Australian population-based birth defects register, 1980–2015
The known Microcephaly has recently received increased attention because it is associated with congenital Zika virus infection. The World Health Organization recommends that countries at risk of Zika virus transmission collate baseline data on the historical prevalence of microcephaly.
The new We report the prevalence and characteristics of microcephaly in a geographically defined Australian population over a 35-year period. Significant rate differences between Aboriginal and non-Aboriginal births were identified.
The implications Our study provides a useful baseline that will allow changes in microcephaly prevalence to be measured, and raises important matters for consideration by other jurisdictions reviewing their birth defects surveillance systems.
Microcephaly is a birth defect in which a child’s head is smaller than expected for their age, sex and ethnicity; there are, however, varying operational definitions of how much smaller (eg, head circumference below the first or third percentile, or more than two or three standard deviations below the mean value). The lack of a universally accepted definition complicates the comparison of prevalence estimates, which range from 2 to 12 per 10 000 live births in the United States,1 0.5 to 10 per 10 000 total births in EUROCAT registries (source: http://www.eurocat-network.eu/accessprevalencedata/prevalencetables), and 2 to 6 per 10 000 total births in Australia.2–4
Known causes of microcephaly include genetic conditions, metabolic diseases, teratogens (eg, alcohol), severe malnutrition (eg, extreme placental insufficiency), and transplacental infections.5 For many children the cause is unknown.
Microcephaly has recently gained increased attention because of its association with congenital Zika virus infection.6 It is predicted that more than 2.2 billion people live in areas where there is a risk of Zika virus infection.7 Local transmission has recently been reported in Singapore8 and in other common travel destinations for Australians.9 The most common vector, the mosquito Aedes aegypti, is found in northern and central Queensland; although local transmission of Zika virus has not been reported, returning travellers with Zika viraemia could infect local mosquitoes and thereby cause a local outbreak. A. aegypti was once present in other Australian states and territories, and there is concern that the mosquito could become re-established outside Queensland.10
Because of the many travellers returning from Zika-affected countries and the potential for Zika virus transmission to become established in Australia, we report baseline data on the prevalence and characteristics of microcephaly in a geographically defined Australian population over a 35-year period (1980–2015).
Methods
Cases of microcephaly were identified in the Western Australian Register of Developmental Anomalies (WARDA), a population-based statutory register with high ascertainment of developmental anomalies (cerebral palsy and birth defects).3,11 Birth defects are defined as structural or functional abnormalities present from conception or before the end of pregnancy and ascertained after a live birth (diagnosed by 6 years of age), stillbirth (minimum 20 weeks’ gestation), or a pregnancy terminated because of detected fetal anomalies (regardless of gestational age). Each defect (up to ten per case) is coded according to the British Paediatric Association extension to the International Classification of Diseases, ninth revision (BPA–ICD9).12
WARDA defines microcephaly as an occipito-frontal head circumference below the third percentile or more than two standard deviations (SDs) below the mean sex- and age-appropriate distribution curve. Any known primary cause (eg, infection, clinical syndrome) is recorded, but the head circumference measurements are not recorded. All identified cases fulfilled the third percentile criterion; either the head circumference measurement was validated by WARDA staff, or the notifier (specialist, genetics services, neonatal units) confirmed applying this criterion. The definition and registration criteria have not changed since 1980.
We identified all cases of microcephaly (BPA–ICD9, 742.10) recorded during January 1980 – December 2015. Each case was reviewed and classified according to aetiology:
-
cause unknown;
-
microcephaly associated with a chromosomal defect;
-
monogenic disorder known to affect head size;
-
known environmental cause (eg, fetal alcohol spectrum disorder [FASD]);
-
congenital infection; or
-
other cause.
We also grouped cases according to whether microcephaly was the only defect (“isolated”), or further major birth defects were reported (“associated”). We examined the age at diagnosis and notification sources.
Microcephaly prevalence was defined as the total number of cases (in live births, stillbirths and terminations of pregnancy for fetal anomaly) divided by the number all births in WA, expressed as number per 10 000 births. Tabulated denominator data for all WA live and stillbirths of at least 20 weeks’ gestation during the study period were obtained from the statutory WA Midwives Notification System. The average annual change in prevalence was calculated by Poisson regression with an offset term. Birth prevalence rates were analysed according to sex, mother’s Aboriginal status, region of residence, known v unknown cause, and isolated v associated microcephaly. We examined associated defects by organ system in cases with known and unknown causes. The prevalence of microcephaly of known and unknown cause in Aboriginal births (5.7% of births during the study period) was compared with that in non-Aboriginal births as prevalence ratios (PRs) with 95% confidence intervals (CIs). Analyses were performed in SPSS 23 (IBM) and EpiBasic (Aarhus University, Denmark).
Ethics approval
Ethics approval was obtained from the Human Research Ethics Committee of the WA Health Department (reference, 2016/19).
Results
Among 963 126 births during 1980–2015, 478 cases of microcephaly were ascertained, a prevalence of 5.0 per 10 000 births (95% CI, 4.53–5.43). For births during 1980–2009 (ie, with at least 6 years’ follow-up and therefore with complete case ascertainment), 416 cases were identified, a prevalence of 5.5 per 10 000 births (95% CI, 4.95–6.02), or 1 in 1830 births.
Of the cases from 1980–2009, 389 (93.5%) involved live births; there were seven stillbirths (1.7%) and 20 terminations of pregnancy for fetal anomaly (4.8%). A cause of microcephaly was identified in 186 cases (45%), and more frequently for Aboriginal (64 cases, 70%) than non-Aboriginal births (122, 38%). The most frequent known cause in Aboriginal births was FASD (11 per 10 000 births; 95% CI, 8.2–14.6); in non-Aboriginal births the most frequent causes were monogenic disorders (0.68 per 10 000 births; 95% CI, 0.51–0.90) and chromosomal defects (0.59 per 10 000 births; 95% CI, 0.42–0.79) (Box 1).
The prevalence of microcephaly of unknown cause was higher among Aboriginal than non-Aboriginal births (6.1 v 2.8 per 10 000 births; PR, 2.2; 95% CI, 1.38–3.22); this was also true for each type of known cause, but was statistically significant only for known environmental (PR, 200; 95% CI, 73–756) and infectious causes (PR, 4.2; 95% CI, 1.40–10.6) (Box 1).
There was no significant temporal trend in microcephaly prevalence during 1980–2009 (Wald χ2 test, P = 0.23; Box 2). The prevalence of microcephaly of unknown cause declined from 3.4 per 10 000 births (95% CI, 2.7–4.2) during 1980–1989 to 2.6 per 10 000 births (95% CI, 2.0–3.2) during 2000–2009, a mean decline of 1.3% per year (95% CI, –2.4% to –0.2%; P = 0.02); that of microcephaly with a known cause increased by a mean 0.4% per year (95% CI, –1.3% to 2.0%; P = 0.67). The average annual increases in the prevalence of microcephaly associated with chromosomal defects (0.6%; 95% CI, –2.1% to 3.4%; P = 0.64), monogenic disorders (0.6%; 95% CI, –2.2% to 3.4%; P = 0.67), and environmental causes (2.6%; 95% CI, –0.3% to 5.4%; P = 0.08) were statistically non-significant. We found a significant 5.6% average annual decline in the prevalence of microcephaly associated with congenital infection (95% CI, –10.0% to –1.1%; P = 0.01); the change was evident for both Aboriginal (4.4% decline; 95% CI, –12.9% to 4.2%; P = 0.32) and non-Aboriginal births (6.0% decline; 95% CI, –10.6% to –1.5%; P = 0.008), but was statistically significant only for non-Aboriginal births.
The prevalence of microcephaly was similar for male and female children, but higher for Aboriginal than non-Aboriginal Australians (PR, 4.5; 95% CI, 3.55–5.73; Box 1). Prevalence was much higher in remote regions, particularly that of microcephaly of known cause (Box 3); this was influenced by the higher proportion of Aboriginal births (and FASD) in these areas (data not shown).
The 81 cases of isolated microcephaly (20% of all cases) were all of unknown cause. All 186 cases with a known cause were associated with other major birth defects, compared with 65% of the 230 cases without a known cause (Box 4).
The overall prevalence of isolated microcephaly declined by a mean 3.4% per year (95% CI, –5.3% to –1.4%; P = 0.001); there was no significant change in the prevalence of microcephaly with associated defects (P = 0.86) (Box 2). Temporal changes in the availability of folate supplements and the introduction of folic acid fortification of some foods were not associated with changes in the prevalence of microcephaly (data not shown).
Microcephaly was diagnosed after the age of 12 months in 27% of cases, increasing from 19% during the 1980s to 29% in the 1990s and 31% during 2000–2009 (Box 5). Isolated cases were more likely to be diagnosed later (35% after 12 months of age), as were cases with a known cause (30% after 12 months of age). For most cases with a known cause diagnosed after 12 months of age, the cause was FASD (52%).
The major notification sources were geneticists, paediatricians, and obstetric and paediatric hospitals. While paediatric and obstetric hospitals maintained steady notification rates, genetics services played an increasingly important role; they contributed more than one-quarter of reported cases during 2000–2009 (data not shown). Most cases were notified by more than one source (mean, 2.8 notifications per case [SD, 1.76]; median, 2 notifications per case [interquartile range, 1–4]).
Discussion
Our study, the first descriptive epidemiological investigation of microcephaly in Australia, provides baseline data on the prevalence of microcephaly in Western Australia over a 35-year period. Most cases of microcephaly were in live-born infants (93.5%), and the overall prevalence was 5.5 per 10 000 births, with annual rates ranging between 2.9 and 7.7 per 10 000 births.
There are few published epidemiological studies of microcephaly, and comparisons are complicated by differences in case definition, period of ascertainment, pregnancy outcomes included, underlying population differences, and environmental variables. These difficulties were illustrated by a recent report of important variations in the prevalence of microcephaly recorded by 16 European birth defects registries.13 In Australia, national estimates are difficult because of major differences between states in the scope of birth defects data collections.14 The most recent national data (for births during 2002–2003),2 which did not include data from the Northern Territory, found a lower prevalence of microcephaly (1.9 per 10 000 births) than we did. Our results, however, are similar to those reported by other registers using the same case definition and equivalent follow-up periods, including the Atlanta Congenital Defects Program1 and the South Australian Register4 (5.0–5.2 per 10 000 births).
Our prevalence estimates, and those reported by birth defects registries in other countries, are well below the rate of 230 cases per 10 000 births expected when a case definition of an occipito-frontal head circumference more than two SDs below the mean for age and sex is applied. This implies that specialists are moderating their notifications according to criteria other than head circumference; these may include notifying cases when they have clinical concern about the child, or when there is an association with a particular cause (eg, trisomy 18). This moderation probably operates in most surveillance systems, including our own. Although head circumference or percentile measures were checked before registering a case of microcephaly in the database, the measurements themselves are not recorded by WARDA. Adding these data to the collection is planned, facilitating assessment of case severity and comparisons with registries using different registration criteria.
We identified a cause for microcephaly in 45% of cases, and more frequently for births to Aboriginal (70%) than to non-Aboriginal mothers (38%). The figure for non-Aboriginal births was similar to those reported from Atlanta (40%)15 and by a German clinic-based study in which the most common cause was genetic in nature (29% of 680 cases;16 similar to the 28% of non-Aboriginal births in our study). We found an average annual decline in microcephaly cases of unknown cause of 1.3%; this may be attributable to improved genetic diagnostic technologies and increasing diagnosis of FASD, factors that may also account for the declining number of cases of isolated microcephaly.
Our results highlight the contribution of FASD to microcephaly in Aboriginal children, with a prevalence of FASD-associated microcephaly (11 per 10 000 births) 260 times that for non-Aboriginal births (0.04 per 10 000 births). FASD also contributed to higher prevalence rates in remote areas of WA. A recent study found that the prevalence of fetal alcohol syndrome in remote WA Aboriginal communities among 7–8-year-old children was 12%, and that 69% of these children had microcephaly;17 another study reported a twofold increase in FASD notifications to WARDA for both Aboriginal and non-Aboriginal births during 1980–2010, coinciding with increased state and national awareness of FASD.18 Nevertheless, FASD is still underdiagnosed, and this may partly explain the higher prevalence of microcephaly of unknown cause in Aboriginal children (6.1 v 2.8 per 10 000 non-Aboriginal births), and may also account for some cases of unknown cause in non-Aboriginal infants. The higher prevalence of microcephaly of unknown cause among Aboriginal Australians may also be related to the relative lack of access to or engagement with health care services and the paucity of genomic reference data for Aboriginal Australians.19 The release of the Australian guide for diagnosing FASD20 and the Partnership Grants (“Models and quality of genetic health services for Aboriginal and Torres Strait Islander people”) co-funded by the National Health and Medical Research Council and the Lowitja Institute may advance aetiological investigations. In addition, a major research program for investigating the diagnosis, prevention and management of FASD is underway in WA.21
In 27% of cases, microcephaly was diagnosed in children more than 12 months old. This large proportion would be missed were ascertainment periods shorter. This factor may be particularly important when differentiating cases of known and unknown cause, especially when microcephaly is associated with conditions (such as FASD and specific genetic anomalies) that are often diagnosed at a later age.18
Further major birth defects were associated with 80% of cases of microcephaly. The most frequent in cases of unknown cause were those affecting the nervous system (61% of associated defects), including neural tube defects (13%). The US National Birth Defects Prevention Network suggests excluding microcephaly associated with neural tube defects, holoprosencephaly, craniosynostosis, and conjoined twins.5 We favour broader inclusion criteria, especially in light of the evolving understanding of the full spectrum of defects that may be associated with congenital Zika infection. One in five definite or probable cases of congenital Zika syndrome in a large case series from Brazil were associated with brain abnormalities in infants without microcephaly, suggesting that surveillance should not focus on microcephaly alone.22 Other defects associated with Zika infection include intracranial calcifications, craniofacial malformations, severe arthrogryposis, and eye defects.23 WARDA includes each of these in its data collection.
Zika virus is the first mosquito-borne virus associated with human birth defects, and is also sexually transmissible. A recent editorial in the MJA24 highlighted the robust Australian systems that enable rapid responses to newly identified communicable diseases, but our capacity for monitoring birth defects was not discussed. Medical practitioners have been advised to ask pregnant women about their recent travel history and to offer testing to those who have visited Zika-affected areas. Birth defect registries that record the causes of birth defects are therefore likely to capture cases of microcephaly or other defects associated with Zika virus exposure in returned travellers. Our capacity to detect changes in the prevalence of microcephaly caused by local transmission of the virus is less clear, as infection is frequently asymptomatic, and the collection of data on birth defects in this country is not standardised, with wide variability between states in case ascertainment.14
As remote regions in Northern Australia either already harbour or are at risk of harbouring A. aegypti mosquitoes, enhanced monitoring of birth defects in these areas (and also of FASD) is important. The Australian Paediatric Surveillance Unit project for the surveillance of microcephaly in infants under 12 months of age is important for responding to the challenges of geographically equitable case ascertainment.25
Attempts to standardise state and territory birth defects data collections have been unsuccessful.26 In the absence of national data, our study provides a useful baseline for measuring changes in microcephaly prevalence, and highlights important matters for consideration by other jurisdictions reviewing their birth defects surveillance systems.
Box 1 –
Prevalence of microcephaly (per 10 000 births) by cause and Aboriginal status of the mother, Western Australia, 1980–2009
|
Cause |
All cases |
Aboriginal |
Non-Aboriginal |
Prevalence ratio (95% CI) |
|||||||||||
|
Number |
Prevalence (95% CI) |
Number |
Prevalence (95% CI) |
Number |
Prevalence (95% CI) |
||||||||||
|
|
|||||||||||||||
|
Total number of cases |
416 |
5.5(4.95–6.02) |
91 |
21(16.5–25.2) |
325 |
4.5(4.05–5.05) |
4.5(3.55–5.73) |
||||||||
|
Unknown cause |
230 (55%) |
3.0(2.64–3.44) |
27 |
6.1(4.01–8.86) |
203 |
2.8(2.46–3.25) |
2.2(1.38–3.22) |
||||||||
|
Known cause |
186 (45%) |
2.4(2.10–2.82) |
64 |
14(11.11–18.43) |
122 |
1.7(1.41–2.03) |
8.5(6.17–11.6) |
||||||||
|
Chromosomal |
47 (11%) |
0.62(0.45–0.82) |
5 |
1.1(0.37–2.63) |
42 |
0.59(0.42–0.79) |
1.9(0.59–4.86) |
||||||||
|
Monogenic |
54 (13%) |
0.71(0.53–0.93) |
5 |
1.1(0.37–2.63) |
49 |
0.68(0.51–0.90) |
1.6(0.51–4.12) |
||||||||
|
Environmental |
53 (13%) |
0.70(0.52–0.91) |
49* |
11(8.2–14.6) |
< 5 |
0.06(0.01–0.14) |
200(73–756) |
||||||||
|
Fetal alcohol spectrum disorder* |
52 |
0.68(0.51–0.90) |
49* |
11(8.2–14.6) |
< 5 |
0.04(0.01–0.12) |
260(85–1320) |
||||||||
|
Infectious |
29 (7%) |
0.38(0.26–0.55) |
6* |
1.4(0.50–2.94) |
23 |
0.32(0.20–0.48) |
4.2(1.40–10.6) |
||||||||
|
Cytomegalovirus* |
24 |
0.32(0.20–0.47) |
5* |
1.1(0.37–2.63) |
19 |
0.26(0.16–0.41) |
4.2(1.24–11.8) |
||||||||
|
Other infections |
5 |
0.07(0.02–0.15) |
< 5 |
0.22(0.01–1.26) |
< 5 |
0.06(0.01–0.14) |
4.0(0.08–40.8) |
||||||||
|
Other cause |
< 5 |
0.05(0.01–0.14) |
0 |
— |
< 5 |
0.06(0.01–0.14) |
— |
||||||||
|
|
|||||||||||||||
|
* One child was diagnosed with both cytomegalovirus infection and fetal alcohol spectrum disorder. |
|||||||||||||||
Box 2 –
Prevalence of microcephaly in Western Australia, 1980–2015: overall prevalence, and prevalence of cases with and without associated anomalies*
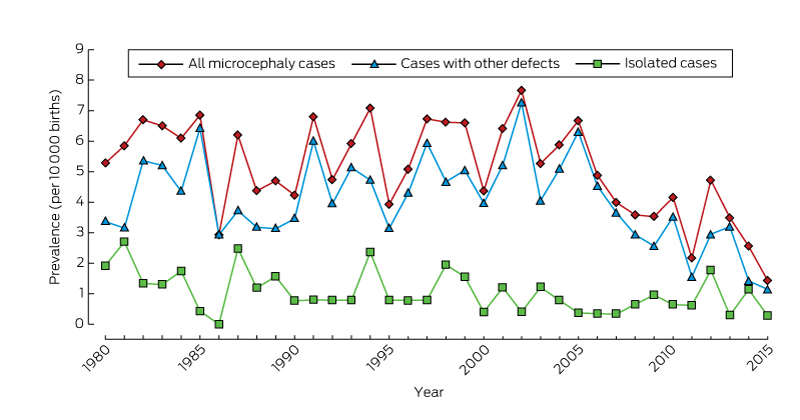
* From 2009, there is less than 6 years’ follow-up of births, so that ascertainment of cases will be incomplete.
Box 3 –
Prevalence (per 10 000 births) of microcephaly in Western Australia, 1980–2009
|
|
All cases |
Microcephaly of known cause |
Microcephaly of unknown Cause |
||||||||||||
|
Number |
Prevalence (95% CI) |
Number |
Prevalence (95% CI) |
Number |
Prevalence (95% CI) |
||||||||||
|
|
|||||||||||||||
|
All |
416 |
5.5 (4.95–6.02) |
186 |
2.4 (2.10–2.82) |
230 |
3.0 (2.64–3.44) |
|||||||||
|
Sex |
|
|
|
|
|
|
|||||||||
|
Male |
199 |
5.1 (4.41–5.85) |
85 |
2.2 (1.74–2.69) |
114 |
2.9 (2.41–3.51) |
|||||||||
|
Female |
216 |
5.8 (5.08–6.66) |
101 |
2.7 (2.22–3.31) |
115 |
3.1 (2.56–3.72) |
|||||||||
|
Missing data |
1 |
|
|
|
1 |
|
|||||||||
|
Aboriginal status of mother |
|
|
|
|
|
|
|||||||||
|
Aboriginal |
91 |
21 (16.52–25.2) |
64 |
14 (11.11–18.4) |
27 |
6.1 (4.01–8.86) |
|||||||||
|
Non-Aboriginal |
325 |
4.5 (4.05–5.05) |
122 |
1.7 (1.41–2.03) |
203 |
2.8 (2.46–3.25) |
|||||||||
|
Residential location* |
|
|
|
|
|
|
|||||||||
|
Metropolitan |
261 |
4.8 (4.24–5.42) |
103 |
1.9 (1.55–2.30) |
158 |
2.9 (2.47–3.40) |
|||||||||
|
Rural |
74 |
5.2 (4.12–6.50) |
31 |
2.2 (1.49–3.12) |
43 |
3.0 (2.21–4.10) |
|||||||||
|
Remote |
81 |
11 (8.56–13.4) |
52 |
6.9 (5.17–9.07) |
29 |
3.9 (2.59–5.54) |
|||||||||
|
|
|||||||||||||||
|
* According to the postcode of the mother as recorded by WARDA at the time of her child’s birth. The eight WA Department of Health residential location categories were grouped into three classes: metropolitan; rural (Great Southern, South-West, Wheatbelt, Midwest Murchison); and remote (Kimberley, Pilbara–Gascoyne, Goldfields–Southeast). |
|||||||||||||||
Box 4 –
Association of microcephaly (of known and unknown cause) with other congenital anomalies, Western Australia, 1980–2009
|
|
All cases |
Microcephaly of known cause |
Microcephaly of unknown Cause |
||||||||||||
|
|
|||||||||||||||
|
Total number of cases |
416 |
186 |
230 |
||||||||||||
|
Isolated microcephaly |
81 (20%) |
0 |
81 (35%) |
||||||||||||
|
Microcephaly associated with other defects |
335 (80%) |
186 (100%) |
149 (65%) |
||||||||||||
|
Associated defects by diagnostic category |
335 |
186 |
149 |
||||||||||||
|
Nervous system, apart from microcephaly |
141 (34%) |
50 (27%) |
91 (61%) |
||||||||||||
|
Neural tube defects |
25 (6%) |
6 (3%) |
19 (13%) |
||||||||||||
|
Chromosomal |
47 (11%) |
47 (25%) |
0 |
||||||||||||
|
Cardiovascular |
49 (12%) |
29 (16%) |
20 (13%) |
||||||||||||
|
Respiratory |
15 (4%) |
10 (5%) |
5 (3%) |
||||||||||||
|
Gastrointestinal |
48 (12%) |
20 (11%) |
28 (19%) |
||||||||||||
|
Musculoskeletal |
72 (17%) |
35 (19%) |
37 (25%) |
||||||||||||
|
Urogenital |
68 (16%) |
43 (23%) |
25 (17%) |
||||||||||||
|
Eye |
36 (9%) |
24 (13%) |
12 (8%) |
||||||||||||
|
Ear, face, neck |
8 (2%) |
3 (2%) |
5 (3%) |
||||||||||||
|
Integument |
4 (1%) |
2 (1%) |
2 (1%) |
||||||||||||
|
Other major diagnoses |
158 (38%) |
142 (76%) |
16 (11%) |
||||||||||||
|
Monogenic condition |
58 (14%) |
54 (29%) |
4 (3%) |
||||||||||||
|
Fetal alcohol spectrum disorder |
52 (12%) |
52 (28%) |
0 |
||||||||||||
|
|
|||||||||||||||
|
|
|||||||||||||||
Box 5 –
Number of cases of microcephaly in Western Australia, 1980–2015, by age at diagnosis
|
Age at diagnosis |
Follow-up period |
||||||||||||||
|
At least 6 years (416 cases) |
Less than 6 years (62 cases) |
||||||||||||||
|
1980–1989 |
1990–1999 |
2000–2009 |
2010–2015 |
||||||||||||
|
|
|||||||||||||||
|
Prenatal |
16 (12%) |
25 (17%) |
18 (13%) |
18 (29%) |
|||||||||||
|
Within first month of life |
47 (36%) |
49 (33%) |
40 (29%) |
16 (26%) |
|||||||||||
|
> 1 month to 1 year |
33 (26%) |
26 (18%) |
36 (26%) |
16 (26%) |
|||||||||||
|
> 1 year to 3 years |
16 (12%) |
24 (16%) |
27 (19%) |
7 (11%) |
|||||||||||
|
> 3 years to 6 years |
9 (7%) |
19 (13%) |
17 (12%) |
3 (5%) |
|||||||||||
|
Post mortem |
8 (6%) |
4 (3%) |
2 (1%) |
2 (3%) |
|||||||||||
|
|
|||||||||||||||
|
|
|||||||||||||||
PM to address national conference
Prime Minister Malcolm Turnbull will address the Saturday morning session of the AMA National conference, as the event’s keynote speaker.
The 2017 AMA National Conference will take place at the Sofitel on Collins, Canberra, from 27-29 May.
National political and medical leaders and experts will present at this year’s conference to cover a diverse range of issues central to AMA members.
The 2017 AMA National Conference Program will discuss and debate topical medical, political and ethical issues affecting health and care in Australia.
- Tackling Obesity – will deliver opinion from a range of experts into the global obesity epidemic, including how AMA policy can help shape an effective and informed method of address by the Australian Government.
- Threats Beyond Borders – is an interactive panel discussion on potential infectious diseases that could cross Australian borders and will explore the role of a National Centre for Disease Control (CDC).
- Improving Australia’s organ donation rate – will examine ethical and practical considerations in how to match Australia’s leading global role of successful organ transplant outcomes with our need to increase organ donation rate.
- Doctors’ Health and Wellbeing – will discuss emerging issues relating looking after doctors’ health during medical training and throughout their professional careers. The session will explore the success and otherwise of initiatives being implemented in this area.
Pre-conference masterclass on offer – Limited places only
In conjunction with the 2017 AMA National Conference, the Pam McLean Centre and will provide a pre-conference masterclass open to all doctors on Thursday 25 May, also held at the Sofitel on Collins, Melbourne.
The masterclass on ‘Dealing with Bad health News’ will be an interactive, evidence based full-day masterclass designed to provide a safe learning environment for participants to explore different communication approaches to help patients deal with bad health news.
Under the guidance of an expert facilitator, Professor Stewart Dunn (Director, Pam McLean Centre), participants will develop skills in interpreting human behaviour by improving the way they recognise, identify and respond to emotional reactions.
This is an accredited activity for RACGP Category 1 and ACRRM Core PDP points.
Pre-conference masterclass details are:
- Time: 9:30 – 5:00
- Date: Thursday, May 25, 2017
- Venue: Sofitel, 25 Collins Street, Melbourne, VIC 3000
- Tickets: Conference attendees – $660, AMA members – $770, non-AMA members – $880
For more information about the whole conference visit: https://natcon.ama.com.au/
Mapping HIV virus for more effective treatment
Deakin University scientists, with support from CSIRO, have revealed for the first time the individual protein blocks that form the HIV virus.
It is hoped that the research will enable the development of effective and affordable new antivirals to treat millions of people living with HIV.
The exact way the virus formed had eluded scientist for the past 30 years so that current antivirals created only a partial understanding of how the pieces joined together.
“Inadequate supply of anti-HIV drugs in low- and middle-income countries has created an ideal breeding ground for the emergence of drug resistant HIV, which threatens the long-term effectiveness of patient care using existing anti-HIV agents,” said senior researcher Professor Johnson Mak, from Deakin University’s Centre for Molecular and Medical Research.
Professor Mak hoped his team’s work would go on to inform the development of new drugs that work by interfering with the formation of infectious virus particles – essentially blocking HIV from taking a hold on patients.
HIV continues to be a major global public health issue. UNAIDs estimates in 2015, an estimated 36.7 million people were living with HIV, there were 2.1 million new infections worldwide and in the same year 1.1 million people died of AIDS-related illnesses.
The AMA this year launched its updated position statement on blood borne viruses (BBVs). The statement expressed the AMA’s support for the availability of new, regularly evaluated treatments for BBVs.
Further, it acknowledged that prevention, treatment, and management of BBVs is a public health priority that requires a coordinated and strategic policy response, with national leadership driving actions to sustain improvements in their prevention, detection, and treatment. A copy of the statement can be found at: position-statement/blood-borne-viruses-bbvs-2017
Meredith Horne
UHT milk used to study age-related diseases
A new study on UHT milk jointly undertaken by ANU, CSIRO, University of Wollongong and international researchers is helping scientists to better understand Alzheimer’s, Parkinson’s and type 2 diabetes – opening the door to improved treatments for these age-related diseases.
The research examined how milk proteins changed structurally when heated briefly to around 140 degrees to produce UHT milk, causing the gelling phenomenon with long-term storage.
These proteins are the same type of protein clusters found in plaque deposits in cases of Alzheimer’s and Parkinson’s.
Fifty different diseases have been recognised as being associated with protein aggregation.
“Parkinson’s, dementia and type 2 diabetes are big problems for the ageing population in Australia and many other countries around the world,” said Professor John Carver from the ANU Research School of Chemistry.
“Any means we can understand these proteins, their structure and why they form amyloid fibrils has the potential for developing treatments.”
Aging relating diseases affect about 500 million people worldwide and is set to increase over the next 20 to 30 years.
Population projections by the Australian Treasury forecasts the number of Australians aged 65 is increasing rapidly, from 2.5 million in 2002 to 6.2 million in 2042, or from 13 per cent of the population to 25 per cent.
The collaborative research was published in the published in the journal Small. The research does not suggest UHT milk can cause these age-related diseases.
Meredith Horne
[Correspondence] Stoop to conquer: preventing stroke and dementia together
The timely editorial in The Lancet (Dec 3, p 2713)1 calls for a broadening of our approaches to dementia research. Treatment and prevention of cerebrovascular diseases appear to be the most obvious examples. Covert cerebrovascular disease can contribute to or trigger neurodegeneration. Alzheimer’s and other neurodegenerative diseases are common in the elderly, most of whom do not develop dementia. However, if an individual has a component of vascular disease, which occurs in 80% of patients with Alzheimer’s disease, it doubles the chances of developing dementia.
[Correspondence] Health systems resilience: meaningful construct or catchphrase?
Resilience is an emerging concept in the health systems discourse, further highlighted by infectious disease outbreaks including Ebola virus disease, Zika virus disease, and Middle East respiratory syndrome. However, the definition and exploration of resilience within health systems research remains a source of debate, as underscored at the recent 4th Global Symposium on Health Systems Research; Vancouver, BC, Canada; Nov 14–18, 2016.
Tick-borne infectious diseases in Australia
The incidence of tick-related medical problems in Australia is largely unknown. Appropriate diagnostic tests are not always available and, of all tick-related diseases, only Q fever is notifiable.1 Anecdotally, however, many patients present to their doctor after a tick bite. This narrative review focuses on tick-borne infections but also touches briefly on other medical problems caused by tick bites.
Australian ticks
There are many different species of ticks in Australia. Only a few species are known to bite humans, and the microbes within these particular ticks — viruses, bacteria or protozoa — are potential causes of infection in humans who are bitten (Box).
However, the mere detection of a potential human pathogen in a tick does not mean that it can be transmitted to a person when bitten. To be transmitted to a person, the microbe must be present in the salivary glands of the tick while it is feeding.
Most studies of Australian ticks to date have investigated the whole microbiome of the tick and not their salivary glands specifically. Some pathogens may be present in the tick faeces, but transmission would require the patient to scratch the faeces into their skin — an unlikely scenario in most cases.
To be confident that a microbe in a tick is responsible for a particular illness in a patient bitten by that tick, it is essential to also detect the microbe in the sick patient, either directly by culture or detection of microbial nucleic acid or antigen, or indirectly by detecting newly produced antibodies to the microbe in the patient’s blood. This requires the diagnostic laboratory to have assays that are both sensitive and specific for detecting the microbe in question. Few such assays are currently available in Australian diagnostic laboratories. Antibody assays are designed using antigens from a specific microbe and in many cases these microbes are not present in Australia. Such assays, even if reasonably sensitive and specific, must have acceptable positive and negative predictive values in Australia, so that patients and their doctors can have confidence in either a positive or negative result from any particular laboratory assay.
There have been two major studies of Australian ticks,2,3 which defined their variety and number. Australian ticks are divided into two large groups: soft-bodied and hard-bodied, comprising 14 and 56 species respectively.4 Five species of ticks have been introduced into Australia,4 but most are not important in biting humans. Of the endemic species, which are the majority, two are notorious for biting humans. On the east coast of Australia, the paralysis tick (Ixodes holocyclus) is the most notable; elsewhere in Australia, it is the ornate kangaroo tick (Amblyomma triguttatum). Both ticks are known to sometimes transmit human pathogens to people when they bite. The southern reptile tick (Bothriocroton hydrosauri) also bites humans and transmits infection (Box).3
There are four stages in the life history of ticks: egg, larva, nymph and adult (male and female). The larva, nymph and adult female (egg-producing) stages require a blood meal from a vertebrate animal to metamorphose into the next life stage. The stages that most often cause problems to humans are nymphs and adult females.
Most people are bitten by ticks without any problem arising from this abnormal host–ectoparasite feeding interaction. Humans are incidental hosts and attached ticks are usually detected by the individual within a few hours, or a day at the most, and killed. Most are probably not even aware when they are bitten by a tick, as the tick injects a local anaesthetic into the skin. However, once it starts to feed, it becomes noticeable as it enlarges.
The range of problems that may occur after tick bites can be classified as follows: infection; allergy; paralysis; autoimmunity; post-infection fatigue; and Australian multisystem disorder.
Viral infections
Although there are several viral infections associated with ticks in other parts of the world (eg, tick-borne encephalitis virus in Europe), there are no definite tick-borne viral infections of humans yet discovered in Australia. The seabird soft tick (Ornithodoros capensis) has been shown to contain several viruses including the Saumarez Reef virus.5 When this tick bites humans, a dermatological condition develops in some patients, but it is not yet clear whether this is due to a virus or an allergen in the tick saliva. A phlebovirus present in an Australian bird tick (I. eudyptidis) is pathogenic for the shy albatross6,7 and is closely related to the human pathogenic viruses that cause severe fever with thrombocytopenia syndrome and Heartland virus disease. This suggests that human pathogenic viruses may be present in Australian ticks, although there is currently no evidence of I. eudyptidis biting humans.
Bacterial infections
Many different bacteria have been detected in Australian tick species,8–13 mostly using molecular techniques. Some are known human pathogens or are closely related phylogenetically to known human pathogens; others are unique bacteria that are part of the tick microbiome.
Apart from the occasional local bacterial infection at the tick bite site (eschar), there are only two definite, known systemic infections following tick bites in Australia — rickettsial infection and Q fever — although there are other possible microbial pathogens and possibly as yet unknown infections (Box).
The two genera of bacteria currently confirmed as Australian tick-transmitted human pathogens are rickettsial species and Coxiella burnetii.
Rickettsial species
In Australia, rickettsial species cause Queensland tick typhus, Flinders Island spotted fever and Australian spotted fever. However, tick-transmitted rickettsiae in various parts of the world have recently been reviewed,14 and the findings emphasise the possibility that Australian clinicians may encounter patients who have returned to Australia after travelling and who present with a tick-borne infection contracted in another country.
The first case of Australian tick typhus was reported in 1946 from north Queensland15 and later that same year a series of cases, including the isolation of the causative agent, Rickettsia australis, from patients was described.16 The organism has since been isolated from a patient in south-east Queensland17 and from I. holocyclus and I. tasmani ticks.18 Queensland tick typhus was the first tick-transmitted infection recognised in Australia. It is seen regularly on the east coast of Australia from the Torres Strait Islands to the south-eastern corner of Victoria. The northern suburbs of Sydney are a particularly common location for transmission of this infection.19,20 Although often a mild condition involving fever, rash and eschar and readily treated with a short course of doxycycline, the infection may be severe21,22 or fatal,23 and may have unusual feaures.24 In north-eastern New South Wales, 15.4% of paralysis ticks contained R. australis.13 Hence, being bitten by this tick, in this location, appears to offer a 1 in 6 risk of being infected with the rickettsia.
A different rickettsial infection (Flinders Island spotted fever) has been observed in patients from Flinders Island, Tasmania.25,26 R honei was isolated from febrile patients27 and shown to be genetically different from R. australis. The tick vector was the southern reptile tick, which is known to bite humans, and on Flinders Island, 63% of these ticks were found to contain R. honei.28 Flinders Island spotted fever is now known to also occur in South Australia,29,30 Western Australia31 and other parts of the world.14
A related bacterium, Rickettsia honei subsp. marmionii, causes a similar infection, Australian spotted fever, and has been detected in the ticks I. tasmani (unpublished data) and Haemaphysalis novaeguineae in Queensland,32 and has been associated with several cases of human disease in eastern Australia.33
Two further species of rickettsia identified in Australian ticks may be considered potential human pathogens, although their presence in febrile patients is yet to be confirmed. Rickettsia gravesii has been detected in ornate kangaroo ticks in WA34 and Queensland (unpublished data). In a WA study, rogainers (outdoor recreationists) had a significantly higher seroprevalence to spotted fever group rickettsiae than controls with minimal bush exposure,35 suggesting exposure to a possible tick-transmitted rickettsia. A Tasmanian study found that 55% of I. tasmani ticks collected from Tasmanian devils contained rickettsial DNA. Further molecular characterisation of the DNA demonstrated sufficient divergence from previously described species to designate this new organism Candidatus Rickettsia tasmanensis.36 Because I. tasmani is known to bite humans, this rickettsia must be considered as a potential human pathogen.
Coxiella burnetii
This bacterium causes Q fever and usually infects humans by inhalation of infectious aerosols from carrier vertebrate animals such as goats, sheep, cattle and domestic pets. However, it is present in both paralysis ticks13 and ornate kangaroo ticks,37,38 and although, anecdotally, there are other cases of Q fever being transmitted by ticks, there is only one published case where the patient developed pericarditis, a rare presentation of Q fever, after being bitten by an ornate kangaroo tick.39
In north-eastern NSW, 5.6% of paralysis ticks contained the com1 gene of C. burnetii.13 This bacterium has been isolated from the bandicoot tick (Haemaphysalis humerosa) from both sides of Australia,40,41 although it is unlikely that this tick species bites humans.
Other possible bacterial pathogens causing rickettsial illness
Candidatus Neoehrlichia mikurensis has been shown to be a human pathogen in other countries,14 causing febrile illness and post-infection fatigue especially in immunocompromised patients. Recent Australian studies demonstrated the presence of Candidatus Neoehrlichia spp. in paralysis ticks,11,12 but their presence in Australian patients is yet to be shown.
Anaplasma and Ehrlichia species have been detected by molecular means in paralysis and ornate kangaroo ticks,11 and these bacteria from the ornate kangaroo tick in the southwest of WA have been named Anaplasma bovis strain Yanchep and Candidatus Ehrlichia occidentalis, respectively (personal communication, Alex Gofton, PhD student, Vector and Waterborne Pathogens Research Group, Murdoch University, January 2017). Certain species of these bacterial genera are known to be human pathogens (eg, E. chaffeensis, A. phagocytophilum). There is thus a possibility that these Australian bacteria may also be human pathogens.
Although a Borrelia species has been detected in the Australian echidna tick (Bothriocroton concolor),42 this bacterium belongs to a unique clade unrelated to the Borrelia species responsible for causing Lyme disease. This tick is not known to bite humans, so the bacterium is unlikely to be a human pathogen. A Borrelia species detected in native rats was not virulent for a human after experimental challenge.43 Lyme disease bacteria are probably not present in Australian ticks.10,44,45
Fancisella spp. are tick-transmitted bacteria that cause classic tularaemia. The tropical reptile tick from northern Australia (Amblyomma fimbriatum), which is not known to bite humans, has been shown to contain DNA from this bacterium.46 A case of a localised Francisella infection following a bite from a ring-tail possum has been reported,47 but it is not yet clear whether tularaemia is a tick-transmitted infection in Australia.
Protozoal infections
Babesia spp. are recognised human and animal pathogens transmitted by tick bites, especially in the northern hemisphere. In Australia, cattle are often infected with B. bigemina and/or B. bovis (cattle tick fever) via the bite of the Australian cattle tick (Rhipicephalus australis); and dogs with B. vogeli and/or B. gibsoni via the brown dog tick (R. sanguineus) and possibly the bush tick (Haemaphysalis longicornis).48,49 Only the bush tick is thought to bite humans.
A single case of human babesiosis caused by B. microti has been described in an Australian man who lived in close proximity to dogs but who did not recall being bitten by a tick and had not travelled outside of Australia for nearly 40 years.49 This was thought to have been a locally acquired infection, but there have been no subsequent cases of human babesiosis diagnosed in Australia.
Allergy following tick bites
A local allergic reaction to ticks is not uncommon and may take the form of urticaria or induration (due to tick saliva), scrub itch (due to infestations of nymphs) or rash.50–52
Occasionally, the allergic reaction can be systemic, including wheezing, anaphylaxis and even death.53 Severe allergy has recently been described following prior sensitisation of a patient due to the ingestion of red meat.54
Paralysis following tick bites
I. holocyclus is known as the Australian paralysis tick because it injects a mixture of neurotoxins into its host when it bites. The role of these toxins for the tick is uncertain, but they often have a profound impact on the host animal. The toxins, known as holocyclotoxins, are small, cyclic polypeptides similar to botulinum toxin. They can affect native animals, family pets and occasionally humans, especially if they are small,55,56 and may cause ataxia followed by an ascending, symmetrical, flaccid paralysis similar to Guillain-Barré syndrome. Cranial nerves may be involved, leading to facial paralysis or ophthalmoplegia. The paralysis can extend even after the tick has been removed. There have been human deaths due to tick toxin, but not for many decades.55
Autoimmunity following tick bites
There is one report of Graves’ disease developing in a patient bitten by an unknown species of Australian tick in WA.57 The patient also had mild rickettsial infection following the bite. It was hypothesised that molecular homology between the thyroid-secreting hormone receptor of the patient and the rickettsial ATPase enzyme resulted in the synthesis of an antibody that cross-reacted with the host thyroid receptor, leading to increased synthesis of thyroid hormones.
Post-infection fatigue
This phenomenon is well known to be a consequence of several infections (eg, Ross River virus infection, Q fever, Epstein-Barr virus infection), although the antecedent infection may not be clearly identified by the patient. It is not yet widely recognised as a problem following rickettsial infection, although it has been suggested by a study involving two large cohorts of fatigued and non-fatigued patients,58 and a case report.59 In addition, there was a report of endemic typhus in SA,60 where patients often had a prolonged fatigue-like condition.
Australian multisystem disorder
This term has been proposed to describe patients with a range of symptoms of currently unknown aetiology, although they have been linked to tick bites in Australia.45 The main symptoms are fatigue, joint and muscle pain, and neurocognitive impairment, but vary from patient to patient. This is the group of patients who may have described themselves as having chronic Lyme (or Lyme-like) disease.44
Because so little is known about the medical effects of tick bites in Australia, it is important for medical practitioners to keep an open mind when dealing with patients who speak of problems associated with tick bites. While the patient may well have other underlying medical issues brought to light by the tick bite, a considered investigation of the whole clinical story is indicated.
If the tick bite is recent (eg, within 4 weeks) and the patient is symptomatic, an EDTA blood sample should be sent to a diagnostic laboratory for microbial polymerase chain reaction testing and culture, accompanied by a serum sample for antibody testing. This acute serum should be stored by the laboratory and tested in parallel with a later serum from the patient, looking for seroconversion or a significant rise in antibody titre, if the patient continues to be unwell and has not responded to treatment. The second (convalescent) serum is an important sample, as it may well contain antibodies to the causative microbe that were absent in the first (acute) serum.
However, when the tick bite has occurred some time ago (more than 8 weeks), serology is difficult to interpret, because antibody titres are stable and may reflect either recent or long-past infection.
In relation to Lyme disease, given the likely absence of the relevant bacteria in Australian ticks,10,44,45 there is little value in laboratory testing for the disease if the patient has not been to an endemic region of the world.
Conclusion
Much remains to be learned about the medical consequences of tick bites in Australia. While rickettsial infections are currently the most commonly known, it is likely that ongoing research will reveal new tick-borne viral, bacterial and protozoal infections, including the possibility of zoonotic transmission from wild and domestic mammals and birds which have been bitten by ticks.
This highlights the importance of the One Health concept (https://www.cdc.gov/onehealth), which recognises the importance of the interaction between human health, animal health and the environment, and will enable the identification of new and emerging diseases.
Box –
Australian tick species known to bite humans, and associated pathogens and diseases
|
Tick species |
Common name |
Known human pathogen |
Disease |
Possible human pathogen |
|||||||||||
|
|
|||||||||||||||
|
Ixodes holocyclus |
Paralysis tick (scrub tick in Queensland) |
Rickettsia australis |
Queensland tick typhus |
Candidatus Neoehrlichia spp. |
|||||||||||
|
|
|
Coxiella burnetii |
Q fever |
Bartonella henselae; Ehrlichia spp. |
|||||||||||
|
Ixodes tasmani |
Common marsupial tick |
R. australis |
Queensland tick typhus |
Candidatus R. tasmanensis |
|||||||||||
|
|
|
R. honei subsp. marmionii |
Australian spotted fever |
Bartonella spp. |
|||||||||||
|
Ixodes cornuatus |
Southern paralysis tick |
R. australis |
Queensland tick typhus |
|
|||||||||||
|
Amblyomma triguttatum |
Ornate kangaroo tick |
C. burnetii |
Q fever |
R. gravesii; Anaplasma sp.; Ehrlichia sp. |
|||||||||||
|
Bothriocroton hydrosauri |
Southern reptile tick |
R. honei |
Flinders Island spotted fever |
|
|||||||||||
|
Haemaphysalis novaeguinae |
No common name |
R. honei subsp. marmionii |
Australian spotted fever |
|
|||||||||||
|
Haemaphysalis longicornis |
Bush tick (introduced, not native to Australia) |
|
|
Babesia sp. |
|||||||||||
|
Ornithodoros capensis |
Seabird soft tick |
|
|
Virus |
|||||||||||
|
|
|||||||||||||||
|
|
|||||||||||||||
Controversies in diagnosis and management of community-acquired pneumonia
Community-acquired pneumonia (CAP) continues to generate a large amount of interest, both for the clinician and the researcher. It is a very frequent diagnosis and the leading infection-related cause of death in most developed countries.1
Although CAP is a relatively common infection, there are wide disparities in its management, including the class of antibiotics chosen, the duration of therapy and the role of adjunctive therapy such as corticosteroids. In this review, we assess the evidence for the approaches to some of these clinical questions regarding CAP management. We agree with the Australian antibiotic guidelines2 regarding recommended antibiotics. Therefore, we do not specifically consider the question of the most appropriate class of antibiotics for treating patients with CAP — the Box summarises the antibiotics commonly used in Australia.
We used a PubMed search for original and review articles from 2005 to 2017, and reviewed specialist society publications and guidelines from Australia and overseas, to formulate an evidence-based overview of the topic as applied to clinical practice.
Are we overdiagnosing CAP?
Although it may seem self-evident, an essential question in the management of patients with CAP is whether the diagnosis is in fact correct. CAP can present in variable ways, some of which are similar to other conditions such as acute bronchitis, viral respiratory tract infections and cardiac failure. Patients with dementia, who are more likely to develop CAP, may not be able to give a reliable description of symptoms.3 Patients may present with two or more conditions at once, confusing the diagnostic process.3 This may occur as a coincidence or alternatively be due to a cause–effect relationship between them. Examples of the latter include that a chest infection can precipitate either an exacerbation of cardiac failure or an acute coronary syndrome.4 In addition, particularly in the era of the 4-hour National Emergency Access Target, staff members in the emergency department (ED) are under greater pressure to move patients out of the ED and thus may need to change the focus of their assessment to “does this patient need admission?” rather than “what is the correct diagnosis?”.
From clinical studies of CAP performed in Australia, of all the patients screened for inclusion on the basis of being given the label of CAP in the ED, a large proportion are subsequently excluded from the study because their chest x-ray is not consistent with CAP.5,6 This issue is not limited to Australia, with international studies showing that chest x-rays reported by treating clinicians as being consistent with CAP are not confirmed as being so by a radiologist in 20–50% of cases.7–11
There are several downsides to excessive diagnosis of CAP. The most obvious is the use of unnecessary antibiotics in patients who have conditions that do not require antibiotics such as viral respiratory infections or cardiac failure. This has the potential to add to the problem of antibiotic resistance as well as putting the patient at risk of antibiotic-related complications such as Clostridium difficile-associated diarrhoea. A further issue, particularly when cultures are not performed in patients initially labelled as having CAP, is the potential delay in diagnosis and inappropriate antibiotic therapy of those patients whose true diagnosis is something more serious, such as sepsis, infective endocarditis or pulmonary embolism. Some of these misdiagnosed patients can have their admission prolonged by many days due to the non-performance of blood cultures. We believe that the diagnostic uncertainty for admitted patients initially given the diagnosis of CAP means that recommendations that discourage the performance of blood cultures in CAP patients are inappropriate.12–15
Duration of antibiotic therapy
The optimal duration of antimicrobial therapy for CAP is another area of controversy. The tendency in hospitals appears to be to overtreat rather than undertreat, often with a long oral tail.16–18 Whether this is a case of believing that “more is better” or due to the disparity between the time to clinical resolution compared with microbiological resolution, the excessive prescription of antibiotics puts the patient at greater risk of side effects and colonisation with resistant organisms, including nasopharyngeal carriage of penicillin-resistant Streptococcus pneumoniae.19,20 Ecologically, the prescription of antibiotics for respiratory infection contributes to a rise in resistance in the community.21
Should the physician turn to national guidelines for advice on duration and choice of antibiotic (Box); the Australian Therapeutic guidelines: antibiotic recommend 7 days of total therapy for moderate and most cases of severe pneumonia,2 as does the British Thoracic Society,22 while the United Kingdom NICE guidelines suggest 5 days for mild CAP and 7–10 days for moderate to severe CAP.23 However, the Infectious Diseases Society of America (IDSA) supports a 5-day treatment for inpatient CAP, provided the patient is afebrile and clinically improving.24 So, with all this variation, which is correct?
There is agreement that a 7-day course of an antibiotic is effective for most cases of CAP, and this is relatively non-controversial, albeit adhered to poorly.25 There is increasing evidence, however, that shorter courses of 5 or even 3 days’ therapy may be just as effective. Overseas literature provides support for short course therapy with azithromycin, including as little as a single dose.26 This likely relates to the high tissue penetration and persistence of adequate tissue levels of this macrolide for some days following administration.27 A multicentre randomised clinical trial evaluating the safety of the IDSA recommendations found that a 5-day course of therapy is safe and effective, although most patients received quinolone antibiotics, a class of antibiotic rarely used in Australia for treating CAP.28 Regarding the β-lactam therapy that would be more likely prescribed in the Australian setting, a 3-day course of intravenous (IV) amoxycillin monotherapy has been shown to be as effective as 3 days of IV amoxycillin followed by 5 days of oral amoxycillin in adult patients who were improving at 72 hours.29 Two previous studies reached a similar conclusion in paediatric populations.30,31
Given the accumulating evidence, we suggest that a 5-day course of antibiotics should be effective in most cases of uncomplicated CAP, even though complete symptom resolution is unlikely to have occurred at this time point. For patients on IV therapy who are clinically improving at 72 hours, a switch to oral therapy is appropriate, but clinicians should keep in mind that the oral antibiotics should complete the 5-day total course and not add another 5 days to what has already been prescribed. If improvement has been rapid in the first 72 hours, it would be reasonable to cease all therapy at 3 days, provided close follow-up is available.
Some international studies have suggested that bundles of care for patients with CAP, which include antibiotic administration within 4 to 8 hours of presentation, may lead to better patient outcomes.32–34 However, it is not clear that this would provide benefits in the Australian setting. In relation to the United States studies,33,34 this finding may reflect past differences in the US health system, where antibiotics may not have been given until the patient was seen by their attending physician, potentially leading to delays in therapy. The US recommendations have now changed to recommend commencement of antibiotics while the patient is in the ED.24 This is already the norm in Australia.
Other studies35,36 have suggested that increases in mortality in patients with CAP may be due to an atypical presentation which leads to a delay in diagnosis, rather than being associated with a delay in antibiotic administration. When this was taken into account in one study, the association between a delay in antibiotic administration beyond 4 hours and increased mortality was not statistically significant.35
Potential cardiac side effects of newer macrolide antibiotics
A 2012 study reported an excess of both cardiovascular and all-cause deaths in patients with pneumonia treated with a 5-day course of azithromycin compared with those treated with other antimicrobials, potentially related to its ability to prolong the QT interval.37 As a result, in 2013, the US Food and Drug Administration issued a warning regarding prescription of azithromycin for CAP, even though that study had a number of limitations, including its non-randomised nature and outpatient study population.
However, the case was far from closed, and results from other retrospective studies reached the opposite conclusion. Mortensen and colleagues studied older patients with CAP and found that those treated with macrolides had a lower rate of mortality, in spite of a small rise in rates of myocardial infarction “consistent with a net benefit”.38 This conclusion was shared by Cheng and colleagues in their 2015 meta-analysis.39 In 2016, a Canadian population-based retrospective cohort study involving about one million adults aged over 65 years found no increase in rates of cardiac arrhythmias at 30 days, in addition to lower all-cause mortality, in patients treated with a macrolide antibiotic.40
Given the evidence that the benefit of using macrolide therapy outweighs potential cardiac risk, we support recommendations to use a macrolide in place of doxycycline for atypical cover when the latter cannot be used, and the use of azithromycin in combination therapy for severe hospitalised CAP, such as that requiring management in an intensive care unit (ICU). We also point out the excellent oral bioavailability of oral azithromycin,27 and recommend its use in preference to the IV formulation in patients for whom oral therapy is tolerated and expected to be absorbed.
The link between CAP and cardiovascular disease
In recent years, evidence has emerged regarding the role of inflammatory conditions in the development of cardiovascular disease such as myocardial infarctions and strokes.41 It is postulated that inflammation, especially when persistent, may have an effect on vascular plaques, making them more unstable or prone to acute occlusion.42,43 Various infections including CAP, influenza and human immunodeficiency virus, as well as other sources of chronic inflammation such as rheumatoid arthritis, have all been shown to be associated with higher rates of acute cardiovascular disease and deaths.4,44–51
In a large study, in the 30 days following an episode of CAP requiring inpatient care, incidence of worsening heart failure, cardiac arrhythmia and acute myocardial infarction were 21%, 10% and 3% respectively.4 However, it is important to note that the problem does not end after 30 days. There is a measurably higher rate of cardiovascular deaths in the following few years, when patients admitted with CAP are compared with matched cohorts admitted with non-infection-related conditions. The rate increases most in older patients (aged over 40 years) and those with greater number of cardiovascular risk factors.52
The mechanism of this increase in cardiovascular complications during and after the CAP episode appears to be multifactorial. Inflammation is a pro-thrombotic state; myocardial inflammation and damage may occur, potentially in response to NADPH oxidase 2 upregulation; cardiac strain may be present in the setting of increased sympathetic nervous system activity with relative hypoxia caused by the lung consolidation; increased fluid and sodium loading associated with some IV antibiotic may worsen fluid overload problems in some cardiac failure patients; and QT interval prolongation with the use of other antibiotics may contribute to arrhythmic potential.46,47,53
What remains to be seen is whether we can act on this in a useful way. It is notable that the vast majority of patients who die from CAP are very old with multiple comorbidities, for whom death may be an expected terminal event. While acutely addressing cardiac risk factors with, for example, the addition of anti-platelet agents like aspirin or cholesterol-lowering statin therapy has not yet been shown to alter mortality in the acute setting,54 it would appear prudent to assess whether such treatments are indicated in patients admitted with CAP, especially if they are aged over 40 years.52
The role of corticosteroids in the management of CAP
Given that the inflammatory state during and after an episode of CAP appears to have an important role in contributing to both morbidity and mortality,4,44–47 there has been interest in the role of inflammatory modulators such as corticosteroids as adjunctive CAP therapy. Levels of cytokines vary with severity of CAP and highest levels of the pro-inflammatory cytokine interleukin (IL)-6 and the anti-inflammatory cytokine IL-10 are associated with higher chance of dying from severe CAP.55 Glucocorticoids reduce the levels of such cytokines,56 and thus are theoretically attractive as a means to reduce CAP mortality.
There have been a number of attempts to address the question about whether this theoretical benefit may be true. Individual studies have varied in terms of the severity of the CAP studied, the choice of corticosteroid used, the route by which it was given, its dose and duration, and the outcomes measured. Results have been mixed, and several attempts at performing meta-analyses on these studies — with all the expected problems associated with attempting to combine such a heterogeneous collection of methodologies — have shown marginal benefits in terms of mortality, particularly in patients with the most severe CAP managed in the ICU, as well as a shorter time to becoming afebrile.57–60 These small benefits need to be weighed against the potential downside of high-dose corticosteroids, both in terms of potential side effects like immune suppression and also the fact that outcomes may have been worse in patients whose infection was caused by an influenza virus or Aspergillus.61,62
Thus, the potential role of corticosteroids as adjunctive therapy in CAP appears to be very limited. They could be considered in patients with CAP severe enough to require management in the ICU, but caution should be taken until the aetiology is known, particularly during influenza season. Their use should also be very carefully considered in patients at higher risk from corticosteroid complications, such as the immunocompromised, women who are pregnant, patients with recent gastrointestinal haemorrhages, and patients at greater risk of neuropsychiatric problems.59 The possible shortened time to defervescence is not sufficiently clinically useful to justify the potential harm from such therapy.
Conclusion
In this era of burgeoning antibiotic resistance, the treatment of CAP is an area where we have the potential to reduce antibiotic consumption. We are diagnosing it too often and treating it for too long. Most non-ICU patients with CAP could be treated for 3–5 days in total.
CAP is a common cause of death, both in the short term and also in the subsequent few years, and many of these deaths appear to be cardiovascular related. Although most deaths from CAP occur in very old people with multiple comorbidities — and so may not easily be prevented — the management of a patient with CAP should be seen as an opportunity to address and treat cardiac risk factors when they are present.
Box –
Antibiotics commonly used to treat community-acquired pneumonia (CAP) in Australia2
|
CAP severity |
Antibiotic |
Comments |
Suggested duration |
||||||||||||
|
|
|||||||||||||||
|
Mild (treated as outpatient) |
Doxycycline |
Monotherapy; avoid in pregnancy and young children |
3–5 days |
||||||||||||
|
Amoxycillin |
Monotherapy; side effect profile better than amoxycillin–clavulinate and spectrum of activity more appropriate |
3–5 days |
|||||||||||||
|
Macrolide (eg, clarithromycin, azithromycin or roxithromycin) |
Monotherapy; potential option when patient intolerant of doxycycline and amoxycillin |
3–5 days |
|||||||||||||
|
Amoxycillin–clavulinate |
Consider in patients from nursing homes or following recent hospital admissions |
5 days |
|||||||||||||
|
Cefuroxime* |
Consider in patients with non-hypersensitivity reactions to amoxycillin |
3–5 days |
|||||||||||||
|
Moderate (admitted patients not requiring ICU) |
Benzylpenicillin |
Use in combination with either doxycycline or a macrolide |
Switch to oral therapy when clinical improvement occurs, generally in 1–3 days |
||||||||||||
|
Doxycycline |
Oral; used in combination with benzylpenicillin |
5 days |
|||||||||||||
|
Macrolide (eg, clarithromycin or azithromycin) |
Alternative second agent to doxycycline (oral or IV); used in combination with benzylpenicillin |
5 days |
|||||||||||||
|
Moxifloxacin |
Use as monotherapy if hypersensitivity reaction to penicillins; excellent oral bioavailability |
5 days |
|||||||||||||
|
Severe (patients potentially requiring ICU care) |
Ceftriaxone plus azithromycin IV |
Alternative choices may be appropriate in tropical northern Australia |
7 days |
||||||||||||
|
|
|||||||||||||||
|
ICU = intensive care unit. IV = intravenous. * Cefaclor is not useful owing to poor antibacterial activity and high rate of causing rashes; cephalexin is not ideal given the poor spectrum of activity against respiratory pathogens. |
|||||||||||||||