×

Screening tests for gonorrhoea should first do no harm

False-positive diagnosis causes important harms and should be minimised

Gonorrhoea infection often has no clinical symptoms in women. Untreated, it may lead to pelvic inflammatory disease and carry risk of chronic pelvic pain, recurrent pelvic inflammatory disease, ectopic pregnancy and infertility. The risk of hospitalisation with pelvic inflammatory disease after gonorrhoea infection may be even greater than for chlamydia.1

Preventing these complications is the rationale behind opportunistic screening. General practitioners are recommended to screen all sexually active Australians aged 15–29 years for chlamydia, but to screen only those at highest risk for gonorrhoea.2 However, as reported by Chow and colleagues in this issue of the Journal,3 gonorrhoea screening appears to have become increasingly common among all Australian women, including those at low risk. Two factors which may partly account for the increase in testing are (i) clinicians misinterpreting guidelines as meaning that opportunistic screening should be done for both infections,4 and (ii) use of dual nucleic acid amplification tests (NAATs) by laboratories to test for both infections, even when clinicians have only requested chlamydia testing.

As shown by Chow et al, the apparent recent increase in gonorrhoea incidence among Australian women is likely to be at least partly an artefact resulting from changes in testing practice.3 From 2008 to 2013, the number of Australian women being tested for chlamydia and gonorrhoea by NAAT increased, as did the number of gonorrhoea notifications among those tested by NAAT (which has a higher positive rate than culture). The authors contend that the true prevalence rate remained stable over the study period, and this is supported by stable rates within Melbourne Sexual Health Centre data (where diagnosis was by culture only) — especially if the population base for the clinic remained unchanged over time. These data argue against an increase in gonorrhoea prevalence but, because neither NAAT nor culture has optimum accuracy, there is uncertainty as to how many women have the disease.

In any case, even if all notifications (including those based on NAAT alone) are assumed to represent true rates of infection, the prevalence of gonorrhoea among non-Indigenous young Australians appears to be much less than that of chlamydia. Among young Indigenous Australians, however, there is a much higher prevalence of gonorrhoea compared with young non-Indigenous Australians, and this appears to be about equal to that of chlamydia.5 Screening for a condition which has a very low underlying prevalence, using a test with less than 100% specificity, is likely to lead to a large number of false-positive results.

The psychological consequences of false-positive test results are substantial. They include anxiety and depression, feelings of guilt and self-blame, loss of self-esteem and self-confidence, feelings of social isolation, and existential concerns.68 In the case of mammography screening — perhaps the condition in which the impact of false-positive diagnoses has been studied most — the adverse impact has been shown to last up to 3 years.9 Diagnosis of a sexually transmitted infection can also affect long-term sexual relationships, leading to concerns about trust and fidelity, and fear about disclosing results to a partner.8,10 There are physical consequences and adverse effects of treatment,9 and financial costs to the patient and the health care system. As is the case with many tests, the index case is not the only one affected — partners are notified, tested and potentially given inappropriate treatment. Hence it is widely recognised that all screening tests and programs should aim to minimise false-positive diagnoses.11

The most obvious way to minimise false-positive diagnosis of gonorrhoea in Australia is to do as Chow et al (and guidelines) suggest: limit routine screening to higher-risk populations with higher underlying rates of infection. However, many laboratories may be unable to test for chlamydia and gonorrhoea separately, and will continue to test for both irrespective of what GPs request. Chow et al suggest that a possible solution to this is to suppress laboratories from reporting gonorrhoea results when they have not been requested by the clinician.3 This may be considered unacceptable practice by laboratory staff, however, who may prefer to use supplementary testing (or reflex testing) to confirm an initial positive result for gonorrhoea based on a NAAT.12 In such cases, supplementary testing involves an automatic algorithm being applied to initial test results such that a positive result for gonorrhoea based on a NAAT triggers testing with a second NAAT using a different target. Requiring both the initial NAAT and the supplementary NAAT to yield positive results before reporting a positive result would decrease the false-positive rate. This may not be enough in a very low-risk population, and repeat testing may be needed for assurance that the positive result is correct.

There remains the question of whether a NAAT (with supplementary testing) can be used as a stand-alone replacement for culture for diagnosing gonorrhoea infection, or whether it should only be used as part of a diagnostic pathway that includes culture — as a triage test (where culture is only done for NAAT-positive patients) and/or an add-on test (where NAAT is done for high-risk patients who test negative on culture).13 Certainly, restricting NAATs to use as a triage test would decrease the false-positive rate compared with use of NAAT as a stand-alone replacement test without confirmatory culture. An additional argument against using NAAT as a replacement test is that we need to retain culture in the diagnostic pathway so that we can continue to monitor for possible antibiotic resistance.14 But, given the imperfect sensitivity of culture, using NAATs as an add-on test should be considered.15 When laboratory results differ or do not match the clinical picture, repeat testing is an option for deciding whether the patient has gonorrhoea infection.

To sort out these and related questions, we need data from well designed, prospective studies of high-risk populations. One such design is for all participants to have the initial NAAT and culture, with one or more further NAATs (with different targets) done when the results of the first two tests differ. Until these types of studies have been done, we cannot determine the best screening and diagnostic testing pathway for gonorrhoea or estimate the true underlying rates of gonorrhoea infection in Australian populations. In the meantime, the take-home messages to primary care physicians are that (i) false-positive results are likely if a NAAT is used on its own in a low-risk population and (ii) further tests (supplementary NAAT and culture) and repeat tests (eg, in 1 week) may be the best strategy for dealing with an initial positive NAAT result.

AMA scholars boost Indigenous medical workforce

Two AMA scholarship holders are among a large contingent of Aboriginal and Torres Strait Islander people to graduate from medical school this year, delivering a significant boost to the nation’s Indigenous medical workforce.

AMA Indigenous Peoples’ Medical Scholarship holders Murray Haar and Gemma Johnston are set to being their internships after graduating from the University of New South Wales and the University of Western Australia, respectively.

AMA President Associate Professor Brian Owler said the Association was “very proud” of the achievements of both, and hoped that their success would encourage more Indigenous students to apply for the AMA scholarship.

Mr Haar, who is due to start an internship and residency at Albury Base Hospital, said the scholarship had provided valuable support during the last three years of his degree.

“Receiving the AMA’s scholarship from third year onwards made it possible for me to survive financially as a medical student, and to focus 100 per cent on my studies,” he said.

Ms Johnston said the scholarship had been “immensely important”.

“It took the burden off wondering where I was going to get the money for rent, textbooks, or a new stethoscope after I broke mine,” she said.

Applications for the 2015 scholarship are still open. Details can be found at: ama-indigenous-peoples-medical-scholarship-2015

The AMA has backed the training of Indigenous doctors amid strong evidence that having Aboriginal and Torres Strait Islander practitioners boosts health outcomes among Indigenous patients.

The need for improvements in Indigenous health care has been underlined by the results of a landmark Productivity Commission report which showed that although there had been important areas of progress, including a narrowing of life expectancy gap between Indigenous Australians and the rest of the community, there remained significant areas of disadvantage.

In particular, the report found a 48 per cent increase in hospitalisations due to intentional self-harm between 2004-05 and 2012-13, and a deterioration in access to clean water and functioning sewerage services.

Adrian Rollins  

Indigenous doctors double

The number of registered Indigenous doctors has doubled in the past decade, boosting efforts to improve the health of Aboriginal and Torres Strait Islander communities.

The Australian Indigenous Doctors’ Association has reported that 204 Indigenous medical doctors are now registered to practise – up from 90 in 2004 – and there are currently 310 Indigenous students studying medicine.

Training more Indigenous doctors is seen as crucial to improve Aboriginal and Torres Strait Islander health both because they are considered more likely to practise in Indigenous communities, and are better able to provide culturally-appropriate care.

But although the Indigenous medical workforce is expanding, AIDA President and GP Dr Tammy Klimpton said it needed to become much bigger.

Dr Klimpton said that to reach population parity of around three Indigenous doctors for every 100 Aboriginal and Torres Strait Islander people, the Indigenous medical workforce would have to reach 2895.

“It’s great to see our numbers grow, but we need more than 10 times this amount [204],” she said. “An increase in Indigenous doctors, along with a focus on Australia’s Indigenous health workforce, will help address the ill health and burden of disease in our communities, and respond appropriately to the continuing crisis in Indigenous health.”

Following a visit to several Aboriginal and Torres Strait Islander communities in the Northern Territory in August, AMA President Associate Professor Brian Owler said there were encouraging signs of progress in improving Indigenous health, but warned much more needed to be done.

While some communities were achieving success in tackling domestic violence and other problems linked to alcohol abuse, malnutrition – particularly among the very young – remains disturbingly common, which many children suffering anaemia, scabies and other conditions usually associated with poverty.

AIDA Chief Executive Officer Kate Thomann said training more Indigenous doctors was essential to achieving improvement.

“There is a vital need for the Australian health system to be culturally safe, high quality, reflective of need, and one which respects and integrates Aboriginal and Torres Strait Islander cultural values,” Ms Thomann said. “This can only be increased by the employment of more Aboriginal and Torres Strait Islander health professionals, including Indigenous doctors, throughout the health care system.”

One small hurdle has been removed after the Aboriginal and Torres Strait Islander Health Practice Board of Australia announced that Indigenous practitioners are now able to renew their registration online.

The Board said the registration fee had been frozen at $100 for the coming year, and urged all practitioners to renew their registration by the 30 November deadline.

Adrian Rollins

Equivalence of outcomes for rural and metropolitan patients with metastatic colorectal cancer in South Australia

Metastatic colorectal cancer (mCRC) is the fourth most common cause of cancer death in Australia.1 The past 15 years have seen improved outcomes in patients with mCRC, largely due to increased chemotherapeutic and biological treatment options and widespread adoption of liver resection for liver-limited mCRC.2 These improvements have led to an increase in reported median survival from 12 to 24 months since 1995. Despite these advances, patients with unresectable mCRC usually die from the disease, with 5-year overall survival of about 15%.2 Initial treatment for mCRC involves combination chemotherapy or single-agent therapy. Survival is improved in patients who ultimately receive all three active chemotherapy drugs (oxaliplatin, irinotecan and a fluoropyrimidine)3 and have access to biological agents, such as bevacizumab.2

Australia’s geographical challenges (large land area and low population density) contribute to difficulties in service provision and disparity of cancer outcomes.4 Some authors have suggested the observed higher death rate among Australia’s rural population is the result of a double disadvantage: higher exposure to health hazards and poorer access to health services.5,6 There is a complex interplay between remoteness of residence and other known causes of poor cancer outcome, including unequal exposure to environmental risk factors,5 less participation in cancer screening programs,79 delayed diagnosis,10 socioeconomic disadvantage,4,11 and higher proportions of disadvantaged groups such as Indigenous Australians.12 Despite these factors, an Australian study of patients with rectal cancer found that increasing distance between place of residence and a radiotherapy centre was independently associated with inferior survival.6 A recent analysis of cancer outcomes using population mortality data found that reductions in the cancer death rate between 2001 and 2010 were largely confined to the metropolitan population, with an estimated 8878 excess cancer deaths in regional and remote Australia, including 750 CRC deaths.13

Remoteness poses practical difficulties that may lead patients with cancer and their clinicians to make choices based on the need for travel, or because of perceived toxicity risks of different regimens. Population studies have shown that rural patients have reduced rates of radical surgery,9 less adjuvant radiotherapy,14 delays in commencing adjuvant chemotherapy15 and reduced clinical trial participation.16 Rural cancer patients can also face a significant financial and travel burden.17

Rural patients in South Australia have historically had limited access to regional oncology services, as population numbers outside metropolitan Adelaide are insufficient to support onsite oncologists. Until recently, this has meant that most chemotherapy is delivered in Adelaide, reflecting a more centralised service than in Australia’s eastern states. An effort is currently being made to shift to more rural chemotherapy delivery and an expanded visiting oncology service.18

In this study, we used the South Australian Clinical Registry for Metastatic Colorectal Cancer (SA mCRC registry) to investigate disparity in outcomes and treatment delivery for rural patients with mCRC compared with their metropolitan counterparts.

Methods

The SA mCRC registry is a state-wide population-based database of all patients diagnosed with synchronous or metachronous mCRC since February 2006. Previous registry-based analyses have led to the description of important associations of patient subgroups and outcomes.1921 Core data include age, sex, demographics, tumour site, histological type, differentiation and metastatic sites. Treatment data consist of surgical procedures, chemotherapy (including targeted therapy), radiotherapy, radiofrequency ablation, and selective internal radiation therapy. The date and cause of death for each patient in the registry is obtained through medical records review and electronic linkage with state death records. Approval for this study was granted by the SA Health Human Research Ethics Committee.

For this study, we included data collected between 2 February 2006 and 28 May 2012. We compared the oncological and surgical management (primarily metastasectomy) and survival of metropolitan versus rural patients. Based on the accepted registry definitions, patients residing in metropolitan Adelaide (postcodes 5000–5174) were designated the “city” cohort, with all other patients (postcodes 5201–5799) in the “rural” cohort. Patient characteristics, use of chemotherapy across first, second and third lines of treatment, choice of first-line chemotherapy, hepatic resection rates and survival were analysed and compared between the city and rural patient cohorts.

All analyses were undertaken using Stata version 11 (StataCorp). Overall survival (OS) analysis was done using conventional Kaplan–Meier methods. Survival was calculated from the date of diagnosis of stage IV disease to the date of death, with a final censoring date of 28 May 2012. The log-rank test of equality was used for comparisons. OS was used as the end point because this outcome measure was available in the registry data and to avoid misclassification of cause of death in disease-specific survival.

Results

Patient characteristics

Data from 2289 patients, including 624 rural patients (27.3%), were available for analysis (Box 1). There was a higher proportion of male patients in the rural than the city cohort (62.7% v 53.6%; P < 0.001). The colon was the primary site of malignancy in a higher proportion of city than rural patients (75.7% v 71.5%; P = 0.04). Kirsten rat sarcoma viral oncogene homolog (KRAS) mutation testing was performed in around 14% of patients in both cohorts, and the proportion of KRAS exon 2 wild-type tumours was not significantly different between rural and city cohorts (59.8% v 59.7%; P = 0.96). Clinical trial participation did not differ significantly between the cohorts (7.1% v 9.2%; P = 0.10).

Treatment

Chemotherapy

First-line chemotherapy was administered in 58.3% of rural patients, compared with 56.0% of city patients (P = 0.32) (Box 2). As a percentage of patients who received any chemotherapy, rates of second-line (22.5% v 23.3%; P = 0.78) and third-line (9.3% v 10.1%; P = 0.69) chemotherapy administration were also similar between rural and city cohorts. There were differences between the cohorts in the type of first-line treatment: rural patients had less use of combination chemotherapy (59.9% v 67.4%; P = 0.01) and biological agents (16.8% v 23.7%; P = 0.007) than city patients, though numerically these differences were small. When an oxaliplatin combination was prescribed, the oral prodrug of 5-fluorouracil, capecitabine, was used more frequently in rural patients than city patients (22.9% v 8.4%; P < 0.001). Only 21 rural patients (5.8%), and no city patients, received their first dose of first-line chemotherapy in a rural chemotherapy centre.

Non-chemotherapy

Adoption of any of the non-chemotherapy treatment modalities did not differ significantly by place of residence (Box 3). Of note, there was no significant difference in rates of hepatic metastasectomy between city and rural cohorts (13.7% v 11.5%; P = 0.17). Pulmonary metastasectomy rates were higher in city patients (3.2% v 2.1%; P = 0.10), but total numbers were small.

Survival

Among all patients, the median OS was 14.6 months for city patients and 14.9 months for rural patients (P = 0.18) (Box 4, A). Among patients receiving chemotherapy (with or without metastasectomy), the median OS was 21.5 months for city patients and 22.0 months for rural patients (= 0.48) (Box 4, B). For patients undergoing liver metastasectomy, the median OS was 67.3 months for city patients and was not reached in rural patients (P = 0.61) (Box 4, C).

Discussion

Our results demonstrate that rural patients with mCRC in SA receive comparable treatment and have equivalent survival to their metropolitan counterparts. In particular, patients in rural areas are treated with equivalent rates of potentially curative metastasectomy and chemotherapy, two key determinants of length of survival. These are the first Australian data specifically analysing rates of chemotherapy in rural patients with mCRC, and they suggest the excess colon cancer mortality seen in rural patients relates to factors other than access to treatment in the metastatic setting.

While there were no significant differences between the cohorts in rates of patients receiving chemotherapy across all lines of treatment, rural patients received less first-line combination chemotherapy, increased use of capecitabine and reduced use of biological agents in the first line than city patients.

First-line combination chemotherapy with intravenous infusional 5-fluorouracil, folinic acid and oxaliplatin (FOLFOX) has equivalent efficacy to oral capecitabine and oxaliplatin (XELOX).22 The choice between the two regimens is based on differing toxicities and practical considerations. FOLFOX requires a central venous catheter (CVC) and a second visit to a chemotherapy day centre every fortnight for ambulatory pump disconnection. XELOX has the advantages of single 3-weekly clinic visits and no CVC, but compliance with twice-daily chemotherapy tablets and potentially higher rates of symptomatic toxicity (hand–foot syndrome and diarrhoea) are limitations. The higher use of XELOX among rural patients reflects the relative practical benefits of this regimen where travel distances and access to nursing staff trained in CVC management are important considerations. The potential for toxicity of XELOX requires careful patient education and system approaches to enable early recognition and intervention in the event of severe toxicity among rural, often isolated, patients. Early follow-up telephone calls by a nurse practitioner or telemedicine consultations are potential strategies to provide this important aspect of care to rural patients.23,24

We observed a small but significant reduction in the rate of biological agents used in first-line therapy for rural patients, mostly due to reduced bevacizumab prescribing. It is possible clinicians were reluctant to “intensify” therapy in rural patients due to a lack of supervision or access to health care, particularly given risks of haemorrhage. It is also possible this small difference reflects a chance finding. The pattern of bevacizumab prescribing has evolved over the period captured in the registry, and an updated analysis of patients diagnosed since 2010 may provide further insights.

The equivalent rate of attempted curative metastasectomy in rural mCRC patients compared with city patients is reassuring, given this approach provides the only option for long-term survival in mCRC. The survival curves of patients undergoing liver metastasectomy showed a survival plateau at 5 years of 50% or greater for both city and rural patients (Box 4, C). This compares favourably with other modern surgical case series, with reported 5-year survival of 32%–47% after liver resection.25

Delivery of specialised health care services for rural Australians requires policymakers to carefully balance the merits of a centralised versus a decentralised system, with unique consideration for each region. For example, no regional centres in SA have a population sufficient to support a full-time resident medical oncologist and are instead serviced by a visiting (fly-in fly-out) oncologist. Limited infrastructure and staff training have also largely prevented widespread administration of chemotherapy in regional centres. Highlighting this point, we found that only 5.8% of rural patients receiving chemotherapy received their first cycle in a rural treatment centre. The SA Statewide Cancer Control Plan 2011–2015 lists the establishment of regional cancer services and chemotherapy centres as a key future direction to optimise care for rural cancer patients.18 Unfortunately, no publications have assessed outcomes of rural patients with mCRC treated in other regions of Australia, particularly in the eastern states where regional oncology services are common. While our analysis supports equivalent survival outcomes for rural patients treated within SA’s largely centralised service, the practical, social and economic advantages of regional cancer centres remain an important consideration not captured in our study. Given this, we consider that our findings highlight the positive outcomes achieved through high-quality, specialised care, rather than suggest that current regional services in Australia should also adopt a centralised approach.

As our analysis dichotomised patients into city and rural cohorts, it does not provide outcome information based on the degree of remoteness. Despite this limitation, chemotherapy and surgical treatment were almost entirely delivered in Adelaide, and thus our analysis appropriately distinguishes those patients who had to travel to access oncological care. The possibility of inadequate registry ascertainment of rural cases of mCRC also poses a possible limitation. However, we are confident this is not a source of bias, as the registry collects information from all histopathology reports in SA, which are processed centrally in Adelaide. An important limitation of our study is that we report only on mCRC, and stage I–III disease is not included. The impact of treatment differences in early-stage CRC (eg, quality and timeliness of surgery, use of adjuvant chemotherapy) on overall survival of patients with mCRC cannot be determined in this analysis. Reassuringly, however, about two-thirds of mCRC cases in both cohorts were synchronous (ie, no prior early-stage disease), suggesting this is unlikely to limit our conclusions. Further, the equivalent rates of synchronous diagnosis in rural and urban patients may suggest there was no major delay in diagnosis of rural patients.

Although higher cancer incidence and poorer outcomes have been consistently demonstrated for rural cancer patients in Australia, we found equivalent treatment patterns and survival for rural patients diagnosed with mCRC in SA since 2006 compared with their metropolitan counterparts. This confirms optimal treatment of rural patients results in equivalent outcomes to metropolitan patients, irrespective of disadvantage. Further, it suggests previously demonstrated disparate outcomes may be due to factors such as higher incidence of CRC as a result of burden of risk factors and potentially reduced screening participation, rather than treatment factors once mCRC has been diagnosed. Targeting these factors is likely to provide the greatest impact on reducing the excess cancer burden for rural Australians.

1 Patient characteristics, by city versus rural residence (n = 2289)*

Characteristic

City

Rural

P


No. (%) of patients

1665 (72.7%)

624 (27.3%)

Median age (range), years

73 (17–105)

72 (31–100)

0.11

Sex


Male

893 (53.6%)

391 (62.7%)

< 0.001

Female

772 (46.4%)

233 (37.3%)


Primary site


Colon

1260 (75.7%)

446 (71.5%)

0.04

Rectum

405 (24.3%)

178 (28.5%)


Synchronous disease

1070 (64.3%)

407 (65.2%)

0.67

Site of metastasis


Liver only

665 (39.9%)

226 (36.2%)

0.10

Lung only

128 (7.7%)

45 (7.2%)

0.70

Liver and lung only

178 (10.7%)

65 (10.4%)

0.85

All other sites

694 (41.7%)

290 (46.5%)

0.13

> 3 metastatic sites

138 (8.2%)

54 (8.7%)

0.38

KRAS testing

243 (14.6%)

87 (13.9%)

0.77

KRAS wild-type

145 (59.7%)

52 (59.8%)

0.96

Clinical trial participation

154 (9.2%)

44 (7.1%)

0.10


KRAS = Kirsten rat sarcoma viral oncogene homolog. * Data are number (%) of patients unless otherwise indicated. † P values calculated using χ2 tests.

2 Frequency of first-line, second-line and third-line chemotherapy, and regimens, by city versus rural residence


First-line treatment


Second-line treatment


Third-line treatment


Regimen

City

Rural

P

City

Rural

P

City

Rural

P


Total

933 (56.0%)

364 (58.3%)

0.32

217 (23.3%)*

82 (22.5%)*

0.78

94 (10.1%)*

34 (9.3%)*

0.69

Single-agent chemotherapy

271 (29.0%)

118 (32.4%)

0.23

58 (26.7%)

18 (22.0%)

0.40

21 (22.3%)

7 (20.6%)

0.83

Capecitabine

202

82

0.30

24

4


8

0


5-FU

58

31

0.29

3

3


4

1


Irinotecan

11

3


31

11


9

6


Oxaliplatin

0

2


Combination chemotherapy

629 (67.4%)

218 (59.9%)

0.01

115 (53.0%)

44 (53.7%)

0.92

49 (52.1%)

17 (50.0%)

0.83

FOLFOX

491

146

0.001

21

8


14

2


XELOX

53

50

< 0.001

15

4


8

2


FOLFIRI

76

18

0.12

62

26


15

7


XELIRI

1

0


1

2


2

2


MMC–5-FU or capecitabine

8

4


16

4


10

4


Other

33 (3.5%)

28 (7.7%)


44 (20.3%)

20 (24.4%)


24 (25.5%)

10 (29.4%)


Biological agent

221 (23.7%)

61 (16.8%)

0.007

97 (44.7%)

30 (36.6%)

0.21

72 (76.6%)

34 (100%)

0.003

Bevacizumab

185

52


60

22


16

14


EGFR mAb

15

5


26

8


52

19


Other

21

4


11

1


4

1


5-FU = 5-fluorouracil. FOLFOX = folinic acid–5-FU–oxaliplatin. XELOX = capecitabine–oxaliplatin. FOLFIRI = folinic acid–5-FU–irinotecan. XELIRI = capecitabine–irinotecan. MMC = mitomycin C. EGFR mAB = epidermal growth factor receptor monoclonal antibody. * Total rates of second-line and third-line chemotherapy use are expressed as a percentage of patients who received any chemotherapy. † Includes use of raltitrexed and MMC (as single agent and combination).

3 Frequency of non-chemotherapy treatments, by city versus rural residence

Treatment

City (n = 1665)

Rural (n = 624)

P


Lung resection

53 (3.2%)

13 (2.1%)

0.10

Hepatic resection

228 (13.7%)

72 (11.5%)

0.17

Surgery*

858 (51.5%)

345 (55.3%)

0.11

Ablation

12 (0.7%)

3 (0.5%)

0.53

Selective internal radiation therapy

10 (0.6%)

8 (1.3%)

0.10

Radiotherapy

299 (18.0%)

132 (21.2%)

0.08


* Includes resection of colorectal primary cancer.

4 Overall survival (OS) in city versus rural patients

Hepatocellular carcinoma in Australia’s Northern Territory: high incidence and poor outcome

Hepatocellular carcinoma (HCC) is a devastating complication of chronic viral hepatitis. It is the fifth most common incident cancer in the world, and the second most common cause of cancer death.1,2 HCC is among the fastest growing causes of cancer incidence and mortality in Australia,3,4 but its epidemiology in northern Australia has not been comprehensively described, and there are no published analyses from the past decade. Past reports of the incidence of HCC in the Northern Territory have shown it to be higher than the national level and 6–10 times higher among Indigenous Australians than non-Indigenous Australians.5,6 However, previous studies have been based only on registry data and have not described the clinical features and management of HCC in the NT.

The NT has a population of about 230 000 people, of whom 30% are Indigenous. Indigenous Australians have higher rates of chronic hepatitis B virus (HBV) infection than the general Australian population. Recent NT studies have found seroprevalence estimates for hepatitis B surface antigen (HBsAg) in adults of 3%–12%,711 compared with 1.0% for Australia as a whole.12 The NT also presents challenges of remoteness and cultural and linguistic barriers, making HCC surveillance and treatment problematic. A universal program of vaccinating infants against HBV has been in place in the NT since 1990, and although this has resulted in a falling prevalence of HBV infection,7 it is unclear if there has been any impact on the incidence of HCC thus far.

We aimed to determine the incidence of HCC in the NT over the past two decades and to describe the clinical and demographic features, management and outcomes of HCC among patients in the Top End of the NT over the past decade. Since some patients had their management coordinated through a centralised liver clinic, we also aimed to explore the effect of site of care and Indigenous status on management and outcomes.

Methods

The study was approved by the Human Research Ethics Committee of the NT Department of Health and Menzies School of Health Research. We conducted this study in two parts: an NT-wide epidemiology study, and a retrospective cohort study including patients only from the Top End.

NT-wide epidemiology study

Data regarding all cases of HCC diagnosed among NT residents during 1991–2010 were supplied by the NT Cancer Registry, which routinely collects HCC notifications by three methods: histology reports, hospital discharge coding and death certificates. All cases from the NT Cancer Registry were cross-checked against hospital records to confirm the diagnosis. The diagnosis of HCC was defined according to the criteria proposed by the American Association for the Study of Liver Diseases.13 These criteria rely primarily on imaging findings; specifically, tumour size and appearance, and contrast enhancement characteristics.

Population denominator data were derived from the Australian Bureau of Statistics and the NT Government’s Health Gains Planning Branch.14 Age-standardised incidence was calculated using the direct method, with 5-year age brackets and the year 2001 Australian standard population.15 The estimated resident population (ERP) for the midpoint of each time period used in the analysis was used as the denominator when calculating rates (eg, the 2000 ERP for the period 1991–2010, the 1993 ERP for 1991–1995).

Clinical retrospective cohort study

Detailed clinical data were collected on all patients who were resident in the Top End of the NT and were diagnosed with HCC from 1 January 2000 to 30 June 2011. This part of the study was restricted to the Top End (Darwin urban, Darwin rural, East Arnhem and Katherine administrative regions), as it is the referral base for the Royal Darwin Hospital (RDH), where we had access to medical records and hospital databases. The patients were identified by three overlapping methods: a prospective register kept by RDH liver clinic (2007–2011), hospital discharge coding (International Classification of Diseases, 10th revision, codes C22.0 and C22.9) and the NT Cancer Registry. For each patient, clinical and demographic data were collected from paper medical records and hospital pathology and radiology databases. Mortality data were collected from the NT Government’s client master index, which has recorded all deaths of NT residents occurring in the NT since 1995.

In 2006, a public liver clinic began operating at RDH, coordinating the diagnosis and management of HCC patients in the Top End using multidisciplinary input from Flinders Medical Centre in Adelaide. Before this, HCC patients were cared for by general surgery, oncology, general medicine or a private liver clinic. Even after 2006, not all HCC patients were managed through the RDH liver clinic. Hence, for the purposes of analysis of management and outcomes, we divided the study a priori into two periods (2000–2005 and 2006–2011), and within the second period divided patients into those managed through the RDH liver clinic and those managed by other medical practitioners. There is no coordinated program of HCC surveillance in the NT, but patients referred to the RDH liver clinic are offered HCC surveillance comprising a 6-monthly ultrasound scan and test for serum alpha-fetoprotein (AFP) level if they have cirrhosis or if they are high-risk and non-cirrhotic, as per international guidelines.13

Data management and statistical methods

Clinical data were collected on paper case-record forms by a trained data collector, and all forms were checked by a liver clinic specialist before data entry. Data were entered into an Access database (Version 12, Microsoft) and were analysed using Stata version 11 (StataCorp). Normally distributed continuous variables were described using mean and standard deviation, and were compared using the Student t test. Non-normally distributed continuous variables were described using median and interquartile range (IQR) and compared using the Mann–Whitney U test. The χ2 or Fisher exact tests were used when comparing categorical data between two groups. Incidence rates were compared by 5-year blocks and Indigenous status using Poisson regression. Kaplan–Meier survival curves were compared using the log-rank test. A two-sided P of less than 0.05 was considered statistically significant. Among patients with chronic HBV infection, individual annual risk of HCC was estimated by dividing the age-specific crude incidence rate by the seroprevalence of HBsAg and multiplying the result by the proportion of HCC attributable to HBV in the whole cohort. Cox proportional hazards models examining the first 12 months of follow-up were used for multivariate models of survival, with all-cause mortality as the outcome.

Results

Incidence of HCC in the NT, 1991–2010

There were 145 incident cases of HCC in the NT over this 20-year period (Appendix 1), giving an age-adjusted annual incidence of 22.7/100 000 (95% CI, 17.2–26.8 per 100 000) for Indigenous Australians and 4.0/100 000 (95% CI, 2.1–5.8 per 100 000) for non-Indigenous Australians — an incidence rate ratio of 5.9 (95% CI, 4.7–7.4). Appendix 2 shows the age-adjusted incidence for 2006–2010 compared with rates for comparable periods for Australia as a whole and other countries.

Crude incidence rates were steady over the first 15 years, but rose significantly in the last 5 years of the study period, being 3.3/100 000/year for the period 1991–1995, 2.7 for 1996–2000, 3.1 for 2001–2005 and 5.5 for 2006–2010 (crude incident rate ratio for the last 5 years compared with the first 5 years, 1.66 [95% CI, 1.06–2.51]). However, the annual age-adjusted incidence did not significantly increase over the study period (10.4, 6.1, 5.1 and 7.8/100 000, respectively, for the four 5-year blocks as above).

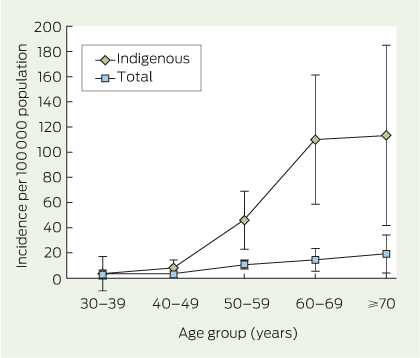
The incidence was lowest among patients aged under 40 years and increased sharply among those aged over 50 years, to a greater extent for Indigenous people than non-Indigenous people (Box 1). Assuming that the seroprevalence of chronic HBV in Indigenous people over 40 years is 8%810 and that 60% of HCC is attributable to HBV, we estimated the individual annual risk of HCC in HBV-infected Indigenous people to be 0.05% for ages 40–49 years, 0.34% for ages 50–59 years, 0.83% for ages 60–69 years and 0.86% for ages 70–79 years.

Demographic and clinical features of HCC in the Top End, 2000–2011

There were 80 new diagnoses of HCC in the Top End during 2000–2011, of which 37 were in Indigenous people, and 64 were in males (Box 2). Most patients were diagnosed with advanced disease; 13 were detected by screening and 21 were candidates for liver transplantation based on tumour size and number (Milan criteria16). The most commonly identified aetiological factors were chronic HBV infection among Indigenous people (current infection in 15/37, and current or past infection in 23/37) and HCV infection among non-Indigenous people (21/43) (Box 2).

Management and outcomes

Just over half the patients (42) were managed with palliative treatment only. Of the remaining 38, 12 patients underwent surgical resection, 10 were treated with oral sorafenib, eight had transarterial chemoembolisation, seven had radiofrequency ablation and three underwent liver transplantation (some patients had more than one type of therapy). All patients who were candidates for curative or local ablation therapies were referred to Flinders Medical Centre in Adelaide.

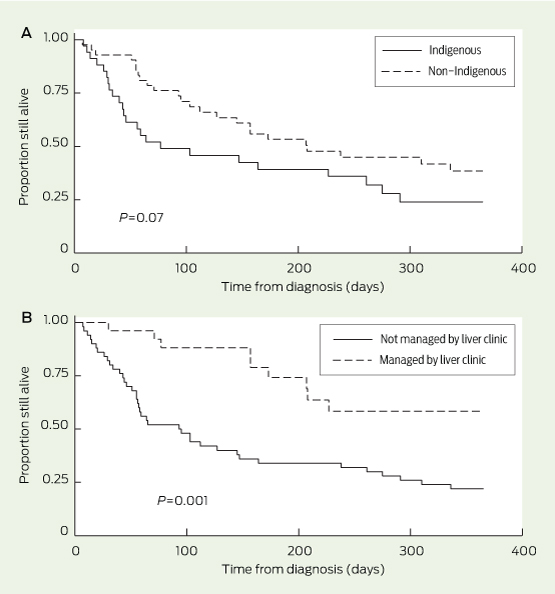
The median time from diagnosis to death was 139 days overall. The median for Indigenous people (64 days) was lower than that for non-Indigenous people (172 days); the difference, although large, did not reach statistical significance (P = 0.07; Box 3, A). Although more patients were diagnosed at a potentially curable stage during the second half of this study, outcomes did not significantly improve (Box 4); however, within the second period, those managed by the liver clinic had better outcomes than those who were not (17/26 v 6/30 alive at 1 year; P = 0.001; hazard ratio for death, 0.32 [95% CI, 0.15–0.70]; Box 4 and Box 3, B). Among the small group of patients diagnosed at a potentially curable stage (ie, within the Milan criteria), curative treatment was received by 6/12 patients in the RDH liver clinic group and 0/7 patients managed in other settings (P = 0.02).

In a multivariate model controlling for age, sex, Indigenous status and cirrhosis, management through the RDH liver clinic remained the only significant predictor of survival at 1 year (adjusted hazard ratio, 0.35 [95% CI, 0.16–0.81]).

Discussion

Despite the rising incidence of HCC in Australia as a whole, it remains about six times more common among Indigenous people than non-Indigenous people in the NT. The incidence rate for Indigenous people is similar to the relatively high population-wide rate in China. Hepatitis B infection is the most important aetiological factor among Indigenous people, and there was no decrease in HCC incidence or in the proportion of HCC attributable to HBV over the 20-year period after the introduction of universal infant HBV vaccination in the NT. We also found an independent association between management of HCC through a centralised service, in close liaison with a referral centre and coordinated care, and improved outcomes that were not explained by differences in the period, patient demographics or comorbidities.

Although the RDH is geographically isolated and is not a liver transplant centre, the outcomes we report are similar to those from comparable urban health care systems, although they are inferior to those from highly-selected case series in quaternary referral centres (Appendix 3).

International guidelines recommend 6-monthly surveillance for HCC17,18 using liver ultrasound in selected high-risk people, and this has been shown to improve outcomes,19 and to be cost-effective if the individual risk of HCC exceeds 0.2% per year.13 However, there are no specific recommendations for screening Indigenous Australians with HBV infection. Our study shows that the incidence of HCC is particularly high among Indigenous people once they pass the age of 50 years. The estimated individual annual risk, which rose from 0.34% for 50–59-year-olds to 0.86% for 70–79-year-olds, justifies a call for HCC surveillance in all Indigenous Australians with HBV infection from the age of 50 years.

The improved outcomes in patients managed through the RDH liver clinic may be partly attributable to earlier diagnosis and, thus, less advanced disease. However, even within the small group of patients diagnosed at a potentially curable stage, more patients received curative treatment in the RDH liver clinic group.

That there has as yet been no observable effect of the HBV vaccination program on HCC incidence does not imply that it is ineffective, but rather, that it has only recently been introduced, since most people diagnosed with HCC are over 50 years of age. HCC incidence in China and Alaska, where vaccination programs have been in place for longer, has already started to decrease.20,21 Since there is a large pool of people born before 1990 who have HBV infection, and a significant proportion of HCC is caused by factors other than HBV, HCC will continue to be an important public health problem in the NT for decades.

Ultrasound scanning is not available in most remote NT communities. Since about 60% of Indigenous patients in this cohort came from remote communities, any HCC surveillance program must include strategies to overcome this barrier. Although there are many competing priorities in Indigenous health care in the NT, we believe the high incidence of and mortality from HCC justify the consideration of an appropriately resourced surveillance program including outreach sonography services. HBV case finding and antiviral treatment have been shown to be cost-effective for preventing HCC in high-risk populations,22 so resources to reduce the impact of HCC should be broadly directed at HBV screening and treatment as well as HCC surveillance.

In conclusion, both incidence of and mortality from HCC remain unacceptably high among Indigenous people in the NT, but outcomes can be improved if tumours are diagnosed at an early and treatable stage and care is coordinated through a centralised service. Furthermore, Indigenous people aged over 50 years should be added to the previously designated groups at higher risk of HCC for whom surveillance is recommended.

1 Annual incidence of hepatocellular carcinoma in the Top End, Northern Territory, by age group and Indigenous status, 2001–2010*


* Error bars represent 95% confidence intervals.

2 Clinical and demographic features of patients in the Top End, Northern Territory, who were diagnosed with hepatocellular carcinoma, 2000–2011


All

Indigenous

Non-Indigenous

P*


Total no.

80

37

43


Age at diagnosis, years (median [IQR])

60.5 (53.4–66.4)

63.9 (52.9–68.6)

57.9 (54.0–64.5)

0.35

Male

64

23

41

< 0.001

Remote dwelling

29

22

7

< 0.001

Born overseas

19

0

19

Symptomatic presentation

52

28

24

0.14

HCC detected by screening

13

5

8

0.45

Within transplant criteria

21

7

14

0.17

Alpha-fetoprotein > 15 IU/mL at diagnosis

42/74

18/36

24/38

0.25

HBV serology positive§

38

23

15

0.05

HBsAg positive§

22

15

7

0.02

HCV antibody positive§

22

1

21

< 0.001

Cirrhosis

58

21

37

0.002

Alcoholic cirrhosis§

36

13

23

0.88

Tumour number at diagnosis (median [IQR])

2 (1–4)

2 (1–4)

2 (1–4)

0.72

Maximum tumour diameter at diagnosis, cm (median [IQR])

6.2 (4.2–8.1)

8.0 (5.0–11)

6.0 (3.7–7.0)

0.002


HBsAg = hepatitis B surface antigen. HBV = hepatitis B virus. HCC = hepatocellular carcinoma. HCV = hepatitis C virus. IQR = interquartile range. * Comparing Indigenous and non-Indigenous groups. † Milan criteria determining suitability for cure by liver transplantation.16 ‡ Includes both core antibody and surface antigen (ie, past or present infection). § Potential aetiological factors (alcohol, HBV and HCV) are not mutually exclusive.

3 Kaplan-Meier survival curves comparing Indigenous and non-Indigenous patients diagnosed with hepatocellular carcinoma, 2000–2011 (A) and patients who did or did not receive centrally coordinated care through the liver clinic during 2006–2011 (B)

4 Tumour characteristics, demographics, management and outcomes of patients with hepatocellular carcinoma according to period of diagnosis


All patients 2000–2005

All patients 2006–2011

P*

Managed by RDH liver clinic 2006–2011

Not managed by RDH liver clinic 2006–2011

P


Total no.

24

56


26

30


Indigenous

13

24

0.35

8

16

0.09

Age at diagnosis, years (median [IQR])

51.5 (40.2–68.3)

58.4 (54.2–66.0)

0.90

57.0 (54.3–64.5)

61.0 (54.0–69.4)

0.17

Cirrhosis

15

43

0.15

23

20

0.08

Diagnosed by screening

0

13

0.01

11

2

0.003

Within transplant criteria

2

19

0.02

12

7

0.07

Maximum tumour diameter at diagnosis, cm (median [IQR])

7.0 (6.0–9.0)

6.0 (3.7–8.1)

0.47

4.75 (2.9–6.8)

7.5 (5.0–8.3)

0.06

HBV serology positive§

9

29

0.24

13

16

0.80

HBsAg positive

5

17

0.38

8

14

0.22

HCV antibody positive

2

20

0.01

11

9

0.39

Received potentially curative therapy

7

12

0.46

9

3

0.03

Alive at 1 year

5

23

0.10

17

6

0.001


HBsAg = hepatitis B surface antigen. HBV = hepatitis B virus. HCV = hepatitis C virus. IQR = interquartile range. RDH = Royal Darwin Hospital. * P for patients diagnosed during the years 2000–2005 compared with 2006–2011. † P for patients whose management was coordinated through the liver clinic compared with those who were not, both within the period 2006–2011. ‡ Milan criteria determining suitability for cure by liver transplantation.16 § Includes both core antibody and surface antigen (ie, past or present infection). ¶ Potentially curative therapy includes liver transplantation, resection of the tumour and radiofrequency ablation of small tumours.

International Indigenous Health Conference 2014

Indigenous health agencies, groups and individuals from around the world are set to converge on northern Australia late this year for the inaugural 2014 International Indigenous Health Conference.

The Conference, which had its genesis in last year’s Australian National Indigenous Health Conference, aims to bring together more than 300 First Nations speakers and participants from across the globe to share experiences and ideas about how the close the health gap between Indigenous peoples and the wider community.

For the event’s organisers, for any such action to be successful it must involve a holistic approach embracing a person’s mind, body, soul and culture.

“This gathering will highlight some of the existing Indigenous health programs currently implemented in Aboriginal communities all over the world and provide a unique opportunity for delegates and speakers to see the power of people networking in one place, at one time, with similar goals,” the organisers said.

Community-based health programs will be a particular focus, with presentations from community groups to account for at least half of the conference’s proceedings.

The conference will be held at the Pullman Cairns International hotel, Cairns, from 15 to 17 December.

For further details, visit: http://www.indigenoushealth.net/submitpaper.htm


Gap closing on Indigenous birthweight as maternal health improves

The number of Aboriginal and Torres Strait Islander babies born with a low birthweight has declined significantly, in a sign that intensive efforts to boost Indigenous maternal health are succeeding.

Figures released by the Australian Institute of Health and Welfare (AIHW) show that the low birthweight rate among babies of Indigenous mothers dropped by almost one tenth (9 per cent) between 2000 and 2011, narrowing in the gap for low birthweight babies between the Indigenous and non-Indigenous populations in Australia.

Nonetheless, Indigenous mothers are still twice as likely as non-Indigenous mothers to have babies of low birthweight (12.6 per cent and 6 per cent respectively).

AIHW spokesman Dr Fadwa Al-Yaman said low birthweight was associated with a range of adverse health outcomes, including newborn death and serious illness and the development of chronic diseases later in life.

Dr Al-Yaman said the drop in the low birthweight rate for Indigenous women had led to a significant narrowing of the gap in the low birthweight rate between Indigenous and non-Indigenous mothers over the decade.

That narrowing contributes to the progress being made in the Commonwealth, State and Territory governments’ Closing the Gap strategy to address the disadvantage faced by Indigenous Australians in the areas of life expectancy, child mortality, education and employment.

Earlier this year, Prime Minister Tony Abbott reported to Parliament that the target to halve the gap in child mortality by 2018 is on track to be met. He said, however, that there had been almost no progress in closing the gap in life expectancy between Indigenous and non-Indigenous Australians, which still sits at about a decade.

The Birthweight of babies born to Indigenous mothers report showed that 11,729 Indigenous mothers gave birth to 11,895 babies in 2011, representing 4 per cent of all babies born in that year.

Nearly all (99 per cent) of births to Indigenous mothers in 2011 were live births, the same proportion as for births to non-Indigenous women.

In 2011, 12. 6 per cent of babies born to Indigenous mothers were of low birthweight (less than 2,500 grams), while 86 per cent were of normal birthweight (between 2,500 grams and 4,499 grams) and 1.4 per cent were of high birthweight (4,500 grams or more).

Dr Al-Yarman said a range of factors were associated with birthweight, including maternal smoking during pregnancy, antenatal care and pre-term births.

“Half of all Indigenous mothers who gave birth in 2011 reported smoking during pregnancy, compared with 12 per cent of non-Indigenous mothers,” he said.

“The smoking rate among Indigenous mothers fell from 54 per cent in 2005 to 50 per cent in 2011, with a greater fall in the rate among non-Indigenous mothers, highlighting considerable scope for further improvements.”

The report also showed that the rate of Indigenous babies being born prematurely fell over the decade.

“In 2011, 12.5 per cent of liveborn babies of Indigenous mothers were born pre-term, compared with 7.5 per cent of babies born to non-Indigenous mothers, but the gap between the two had narrowed over the decade,” Dr Al-Yaman said.

AMA President Associate Professor Brian Owler, who visited a number of Indigenous communities and Aboriginal health services in the Northern Territory last week, said the success in reducing the incidence of low birthweight among Indigenous babies was an encouraging development that showed, with appropriate resources and commitment, governments and communities could achieve real improvements in Aboriginal health.

A/Professor Owler said the result underlined the importance of the nation’s governments “keeping the pedal to the metal” and to continue working together in a consistent and coordinated way to improve Indigenous health.

Debra Vermeer

Realising the potential of the post-2015 development agenda for Indigenous health

To the Editor: The United Nations Millennium Development Goals (MDGs) of 2000 included three health-related goals: reduce child mortality (goal 4), improve maternal health (goal 5) and combat HIV/AIDS, malaria and other diseases (goal 6). Like many other high-income nations, Australia did not consider its national health priorities subject to the MDG framework. In 2005, the then Aboriginal and Torres Strait Islander Social Justice Commissioner Tom Calma observed that the Australian Government had committed to eradicate poverty through the MDGs “in third world countries by 2015, but has no similar plans to do so in relation to the extreme marginalisation experienced by Aboriginal and Torres Strait Islander Australians”.1 In response to the Close the Gap campaign launched in 2007, the government has addressed the health inequalities experienced by Indigenous Australians (with mixed progress reported), and introduced the National Aboriginal and Torres Strait Islander Health Plan 2013–2023.2

Global debate around the new post-2015 development goals, which will replace the MDGs when they expire in December 2015, is presently underway, with the intergovernmental Open Working Group on Sustainable Development Goals providing its initial report on the potential goal framework in July 2014 (http://sustainabledevelopment.un.org/focussdgs.html). Although the new goals are not yet finalised, under proposed goal 3 (to ensure healthy lives and promote wellbeing for all at all ages), 13 subgoals are currently being negotiated. The expectation is that the new goals will be universal and applicable to all countries — including high-income nations like Australia — with differentiated targets to redress inequities both between and within countries. Although it is unlikely that there will be any international legal obligation to comply, Australia, as a “good global citizen”, may face significant normative pressures to implement domestic policy changes to reflect post-2015 targets. This raises the question of the likely implications for Australian domestic health policy — and for Indigenous health in particular — in light of the new health and development goals. Through post-2015 commitment to overcome domestic and global health and related inequities, the Australian Government will be more accountable on the world stage not only for its Indigenous peoples but also for all people.

International Indigenous Health Conference 2014

Indigenous health agencies, groups and individuals from around the world are set to converge on northern Australia late this year for the inaugural 2014 International Indigenous Health Conference.

The Conference, which had its genesis in last year’s Australian National Indigenous Health Conference, aims to bring together more than 300 First Nations speakers and participants from across the globe to share experiences and ideas about how the close the health gap between Indigenous peoples and the wider community.

For the event’s organisers, for any such action to be successful it must involve a holistic approach embracing a person’s mind, body, soul and culture.

“This gathering will highlight some of the existing Indigenous health programs currently implemented in Aboriginal communities all over the world and provide a unique opportunity for delegates and speakers to see the power of people networking in one place, at one time, with similar goals,” the organisers said.

Community-based health programs will be a particular focus, with presentations from community groups to account for at least half of the conference’s proceedings.

The conference will be held at the Pullman Cairns International hotel, Cairns, from 15 to 17 December.

For further details, visit: http://www.indigenoushealth.net/submitpaper.htm


Fears co-payment, Budget cuts could widen Indigenous health gap

Many Indigenous people are putting off seeing their doctor because of cost, contributing to extraordinarily high rates of preventable hospitalisation and premature death among Indigenous Australians, the peak adviser to the nation’s governments has warned.

In a finding that has added fuel to the debate over the Federal Government’s controversial $7 co-payment, the COAG Reform Council’s final report card on Indigenous health showed that 12.2 per cent of Indigenous adults delayed or cancelled a trip to their GP because of cost – an outcome linked by Council Chair John Brumby to higher rates of ill health, preventable hospitalisation and premature death.

“When you avoid going to a primary or community care provider because of cost or other reasons, you often end up in hospital,” Mr Brumby said. “And we’ve found that rates of preventable hospitalisations for Indigenous Australians are three to four times higher than for non-Indigenous Australians.”

AMA President Associate Professor Brian Owler said the finding underlined doctor concerns about the impact of the proposed $7 co-payment.

A/Professor Owler said the fact that a significant proportion of Indigenous people already put off seeing their doctor when the national bulk billing rate was around 82 per cent did not bode well for when the co-payment came into effect and the bulk billing rate dropped.

The AMA President said it showed how important it was to recognise that Indigenous health was not just a matter for targeted programs and services, but was also affected by broader developments in the health system.

Aboriginal and Torres Strait Social Justice Commissioner Mick Gooda said the proposed co-payment was a cause of “great anxiety” about Indigenous health.

“Aboriginal and Torres Strait Islander people access Medicare services at a rate which is almost one third lower than what is required on a needs basis,” Mr Gooda wrote on the ABC’s The Drum blog. “Our people need encouragement to access medical services, not more barriers.”

The Federal Government’s commitment to improving Indigenous health has been called into question following funding cuts to health programs, as well as the introduction of the $7 co-payment.

The Government has rejected such criticisms, and late last month Assistant Heath Minister Senator Fiona Nash announced that work was to begin on implementing the National Aboriginal and Torres Strait Islander Health Plan as part of efforts to raise the health standards of Indigenous Australians and bring them into line with the broader community.

“The Health Plan provides a useful framework to guide policy and program development,” Senator Nash said, adding that it would recognise the links between health, education, employment and community safety. “The Government is committed to closing the gap by ending the cycle of disadvantage which starts with poor child health. Indigenous health will only be improved by concrete action on the ground.”

But a $165.8 million cut to funding for Indigenous health programs in the May Budget has undermined the Government’s message and raised questions about the seriousness of its intent to close the health gap.

In highlighting the size of the task confronting governments, the COAG Reform Council found that while substantial progress had been made in reducing child mortality rates, there remained formidable disparities in health outcomes.

The rate of preventable hospitalisations was three times higher among Indigenous people than the national average, while a shocking 75 per cent of deaths of Indigenous people younger than 75 years could have been avoided through preventive care or early treatment.

Adding to the disturbing picture, the Australian Institute of Health and Welfare has reported that Indigenous adults were twice as likely to die from coronary heart disease as the broader population, and three times as likely to succumb to chronic obstructive pulmonary disease. The rate of COPD in the Indigenous community is more than twice that of the national average.

The stark figures have contributed to the yawning gap in life expectancy – on average, Indigenous men are likely to die 10 years earlier than their non-Indigenous countrymen, while among women the life expectancy gap is greater than nine years, according to the COAG report.

In a disappointing assessment, the COAG Reform Council warned that the goal to close the large life expectancy gap by 2031 was unlikely to be met.

“These things scream out that change is needed,” A/Professor Owler said. “We have got lots of information on what the problems are. We now need to act and make changes.”

A/Professor Owler said there were already many examples of local health services that had achieved significant improvements in Indigenous health in their areas through innovative and targeted programs, and groups like National Aboriginal Community Controlled Health Organisations (NACCHO) were working hard on ways to adapt and apply such successes in other areas.

He said any cuts to program funding in the name of efficiency had to be very carefully considered and evaluated, and should only be made in close consultation with those providing Indigenous health services.

Mr Brumby delivered the findings of the COAG report to the NACCHO annual summit on 26 June.

NACCHO Chair Justin Mohamed said that although there were some signs of improvement in Indigenous health, Federal Budget cuts and health policy changes put further progress at risk.

“We are really worried that the millions of dollars being cut from across Aboriginal affairs at the Federal level, plus the introduction of new arrangements in accessing primary health care and changes to unemployment benefits, could potentially push the closing the gap targets even further from reach,” Mr Mohamed said.

The NACCHO Cahir lamented the abolition of the COAG Reform Council, in whose absence there would be “no independent umpire able to evaluate progress – or the lack of it – and hold governments accountable”.

Adrian Rollins