×

Aboriginal community controlled health services: leading the way in primary care

The disparity in health between Aboriginal and Torres Strait Islander people in Australia and their non-Indigenous peers is core business for the Aboriginal community controlled health service (ACCHS) sector. The Closing the Gap framework commits to reducing this disadvantage, with cross-government-sector initiatives and investment, reflecting the need to improve the social and emotional wellbeing of the Aboriginal community.1 Activity in the primary health care sector, with its focus on prevention, early intervention and coordination of care complements these efforts to build healthier communities. With their model of comprehensive primary health care and community governance, ACCHSs have reduced unintentional racism, barriers to access to health care, and are progressively improving individual health outcomes for Aboriginal people.

So what is known about the performance of ACCHSs and mainstream general practice? Why should support for ACCHSs be both continued and enhanced?

Models of care and program delivery

The models of comprehensive primary health care, developed with government and research partners, that are used in ACCHSs are well described.2,3 Clinical services, health promotion, cultural safety, community engagement all underpinned by research, evaluation and planning activity are the essential components in these models. In addition, particularly for maternal and child health, models of family-centred primary health care35 extend comprehensive team-based care of individuals to members of families or households, often with outreach services. These models complement the resources, time and evidence base needed to manage more problems of greater complexity at each consultation6 than are usually seen in mainstream general practices.

The patient-centred medical home (PCMH) model,7 now suggested as best practice for general practice,8,9 is not dissimilar to the model used by ACCHSs since their inception in the 1970s.10 Leadership in ACCHS involves both ACCHS management and the community, and the care model is more team-based than general practitioner-focused. Nonetheless, the ACCHS and PCMH models have much in common. Care: is patient-focused; may encompass the family; has significant physician input; is integrated with allied health specialists, mental health professionals and community services, preferably delivered in the home; and is underpinned by participation in clinical quality-improvement programs. Importantly, with increasing regionalisation and with government policy supporting more community-driven models of care (with the advent of Medicare Locals and Health and Hospital Networks), the ACCHSs provide prototypes for community-operated health services.

Access

Do Aboriginal people use general practices more than ACCHSs as is sometimes claimed?11 In Queensland, 27 ACCHSs are spread across a diverse, decentralised area of 1.7 million square kilometres. The service data suggest that, in regional areas, the use of ACCHSs by people identifying as Aboriginal may be higher than the 50–50 split with general practice indicated by Medicare Australia data.12 Employing various strategies such as the Practice Incentives Program copayments, social marketing campaigns and targets set in a clinical quality-improvement (CQI) collaborative, ACCHSs in Queensland have been increasing their patient enrolments.

Based on Australian Bureau of Statistics-estimated catchment data for the Queensland services by local government areas or by drive time,13 the number of Aboriginal patients making one visit in 2 years to these regional ACCHSs is higher than the resident Indigenous population (Box 1). For 11 of 17 services, over 60% of Aboriginal people living in their catchments within a 30-minute drive had visited in the 2 years to September 2012; for six of these ACCHSs, all classified Remoteness Area 2 or 3, the data suggest up to 100% of the Aboriginal population living within a 30-minute drive are using their services, with many patients travelling longer than 30 minutes. Coverage is lower in the large metropolitan centres, for example in Brisbane where three ACCHSs serve a population of 40 000.

Access to services is critical and, where ACCHSs exist, the community prefers to and does use them,14 suggesting that patterns of use reflect patchy supply.

Need

There are ongoing drivers of ill health among adult Aboriginal patients who use ACCHSs. In Queensland, 49% of adults remain current tobacco users, over 70% are overweight or obese, 25% have hypertension, and 18% have type 2 diabetes mellitus.15 These problems must be tackled by individuals, families and the community. To effect change, health providers need well resourced allied health teams, preferably operating from their clinics, where people feel respected and are given assistance with transport.4 Sustaining programs run by the Tobacco and Health Life Style teams established in ACCHSs from 201016 will continue to support downward trends, for example, in tobacco use.

Traditional general practice is ill equipped to deal with ongoing problems in Aboriginal health and the necessary complex challenges in behaviour change.

Quality of care, evaluation and performance

The medical literature has many reports of well implemented research programs, often integrated with everyday care in ACCHSs, showing improved health outcomes. Sexual health,17 maternal and child health,18 smoking cessation19 and cardiovascular programs20,21 have been successfully run and monitored in ACCHSs. Recently ACCHSs have been building their capacity to collect and use health service data, enabling review of service delivery, performance tracking and monitoring of the health status of their patient cohorts.

Care delivered in ACCHSs for prevention and chronic disease management appears to be equal to if not better than that delivered by general practices. Queensland Aboriginal and Islander Health Council (QAIHC) data show good performance in risk factor monitoring and the management of hypertension and chronic disease.15 Box 2 shows improving performance in completion of health assessments — a first step in prevention activity— over the past 4 years.22 The Torpedo study, a randomised controlled trial of the use of an electronic decision-support system measuring absolute cardiovascular risk, shows ACCHSs outperforming general practices in managing risk.21 Data collected in late 2011 show that the ACCHSs sites had significantly more patients at high risk being prescribed best-practice medications than the general practice sites at baseline, and this gap was sustained through the intervention period (Box 3).23

Data from the Australian Primary Care Collaboratives (APCC) program, often not published, can examine performance between ACCHSs and general practice clusters. Data for 2012, from Wave 2 of the APCC e-health program, show that ACCHSs in Queensland had more diagnoses coded (as opposed to use of free text) in medical histories and a higher proportion of medications on their current medication lists prescribed within the preceding 6 months than their general practice counterparts (Box 4). This pattern is similar to that reported for cardiac and diabetes care in 20113 and seen in recent years in the QAIHC Closing the Gap Collaborative, where ACCHSs were the higher performers in identification of risk factors and completion of health checks (K Panaretto, unpublished data). These data reflect the commitment to delivering evidenced-based care by clinical teams and the voluntary participation in clinical quality-improvement programs seen in ACCHSs, resulting in these services leading the primary health care sector in monitoring clinical performance.

Workforce and training

ACCHSs are significant employers of Indigenous people. In 2012, the 150 ACCHSs employed nearly 4000 people nationally. Of these, some 95% of health workers, 85% of drivers and 32% of allied health professionals (55% overall) identified as Aboriginal and/or Torres Strait Islander. The proportion of Indigenous doctors and nurses remains low (5% and 10%, respectively).24 The Leaders in Indigenous Medical Education (LIME) Network has recently signed an agreement with the National Aboriginal Community Controlled Health Organisation seeking to increase Aboriginal medical student placements in Indigenous primary health care settings with a view to increasing participation in and enhancing the effectiveness of the medical workforce. Similar initiatives are underway in nursing, including innovative programs that are graduating new cohorts of Indigenous midwives.25 In addition, the ACCHSs have always had a major role in Aboriginal health worker (AHW) training, and the introduction of national AHW registration will standardise the quality of this important component of the health workforce.26 The services’ ability to deal with the impact of social determinants and lower health literacy is due, in part, to ACCHSs being significant providers of Aboriginal employment and training.

The way forward

When challenged to deliver best-practice care, ACCHSs have risen to the task, assuming a rightful place in the broader Australian health system. Based on the evidence available, health care delivered by ACCHSs is of a high standard, compares favourably with mainstream services on key aspects of clinical care and warrants continued funding support. ACCHSs are committed to improving the health of their communities, leading the way with improved governance and use of data to ensure they deliver the best evidence-based services possible today. They are focused on delivering systematic patient-centred care and are embracing innovations in e-health, the personally controlled electronic health record and electronic prescribing, to promote continuity of care and coordination across ACCHSs and mainstream services.

In view of the possible cuts to funding to the ACCHSs sector with the rationalisation of Indigenous programs announced in the recent Budget, the data suggest that to enhance the quality of care and reach national targets requires:

  • policy and funding support to provide additional ACCHSs in both regional and metropolitan areas, where there are currently large populations with poor access to comprehensive primary health care;
  • recurrent funding support for initiatives to sustain clinical and administrative quality-improvement programs; and
  • mainstream primary health care providers continuing to enhance their recognition of their Aboriginal patients through clinical quality-improvement initiatives and by partnering with the community controlled sector to monitor performance and value across both sectors.

In conclusion, ACCHSs are key players in the Indigenous community in exercising self-determination, taking responsibility in action, improving Aboriginal and Torres Strait Islander health, and setting the frameworks to underpin the shift to healthy or well communities. The government must acknowledge and continue to support ACCHSs as leaders in Aboriginal primary health care.

1 Aboriginal and Torres Strait Islander patients with one recorded visit to an Aboriginal community controlled health service in Queensland in the 2 years to September 2012
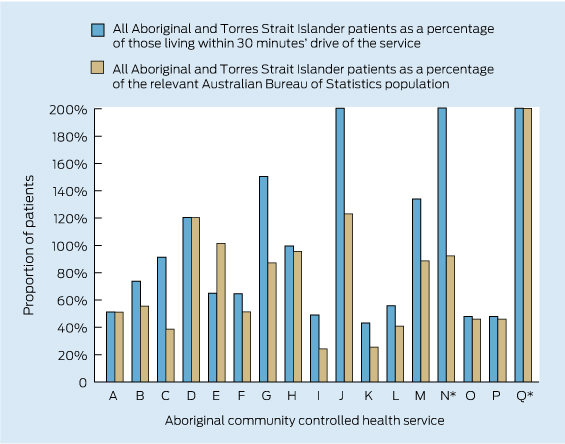

* Services N and Q are shown with the values for all patients as a proportion of those within 30 minutes’ drive truncated (actual values, 211% for N and 479% for Q). Service Q is also shown with the value for all patients as a percentage of the relevant Australian Bureau of Statistics population truncated.

2 Aboriginal and Torres Strait Islander adults who regularly attended participating health services in Queensland between February 2010 and January 2014 and who had a current health assessment*22
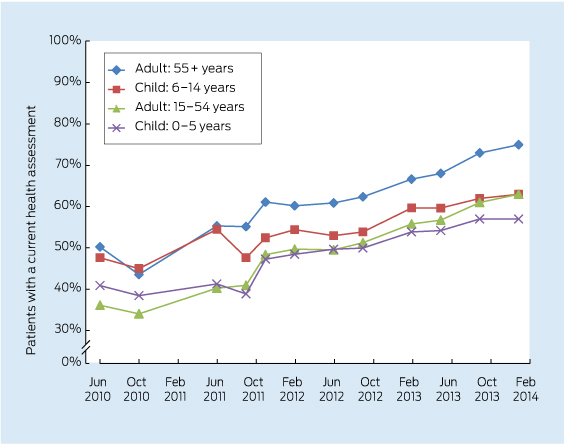

* A comprehensive review of patients’ health (Medicare Item 715) within the past 2 years (formerly the Aboriginal and Torres Strait Islander health check).

3 Baseline data for the Torpedo study23 before random allocation — management of patients with high cardiovascular risk or established cardiovascular disease in 40 general practices and 20 Aboriginal community controlled health services for the 12 months to May 2012
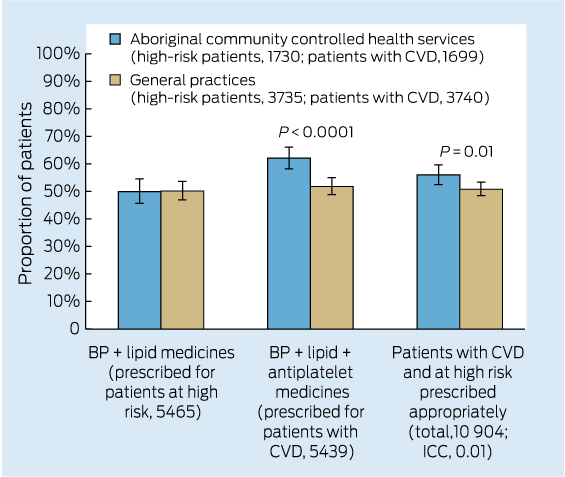

BP = blood pressure. CVD = cardiovascular disease. ICC = intraclass correlation coefficient.

4 Comparison of participating general practices with participating Queensland Aboriginal and Islander Health Council (QAIHC) services for performance in coding of diagnoses and currency of the medication list*
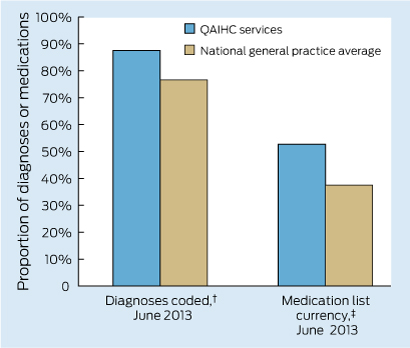

* Unpublished data from Australian Primary Care Collaborative e-health program, Wave 2, 2012–13. † Proportion of total diagnoses in past medical history that are coded. ‡ Proportion of medications on the current medication list that have been prescribed in the past 6 months.

Follow-up of Indigenous-specific health assessments – a socioecological analysis

Preventive health assessments have become a feature of health policies internationally.1 In Australia, Medicare-funded Indigenous-specific health assessments (herein referred to as “health assessment”) and follow-up items have been progressively introduced since 1999 as a means to improve the limited preventive health opportunities and reduce high rates of undetected risk factors among Aboriginal and Torres Strait Islander people (respectfully referred to hereafter as Indigenous people) (Box 1).3,4

A recent systematic review shows that while health assessments may increase new diagnoses, there is a lack of evidence of their effect on morbidity and mortality.1 While the reasons for lack of impact of health assessments are not well understood, it is clear that health assessments have limited potential to impact on health outcomes in the absence of appropriate follow-up care.57 The $805 million Indigenous Chronic Disease Package (ICDP) introduced by the Australian Government in 2010 included program funding and a new workforce to help increase the delivery of health assessments and appropriate follow-up.8

Analysis of Medicare data shows an increase in the uptake of health assessments, but relatively limited billing for Indigenous-specific follow-up items.5,9 The limited use of follow-up items raises questions about the effectiveness of health assessments as a catalyst for enhancing access to preventive care and chronic disease management,10,11 and highlights the need for further research on how to increase follow-up after a health assessment.12

This paper reports on patterns of uptake of health assessments and associated follow-up items, and examines the barriers and enablers to delivery and billing of follow-up care over the first 3 years of implementation of the ICDP.

Methods

The analysis presented here draws on the mixed-methods Sentinel Sites Evaluation (SSE) of the ICDP. SSE methods are detailed elsewhere.5 The SSE was a formative evaluation covering 24 urban, regional and remote locations in all Australian states and territories. Data were collected, analysed and reported in 6-monthly intervals over five evaluation cycles between 2010 and 2012.

Data on uptake of health assessments and follow-up items were derived from administrative billing data provided by the Department of Health from 1 May 2009 to 30 May 2012. The period May 2009 to April 2010 was used as a “baseline” period, as it preceded implementation of the ICDP. Health assessment data include Medicare Benefits Schedule (MBS) items, and are presented as health assessments claimed by services within the site boundaries per 100 Indigenous people aged ≥ 15 years. Similarly, the follow-up data include MBS items for follow-up of health assessments (see Box 1 for health assessment and follow-up items included in this analysis). Population data are based on Australian Bureau of Statistics projections from the 2006 Census according to the statistical boundaries used to define the sites.

Qualitative data on barriers and enablers to delivery of and billing for follow-up were obtained from individual and group interviews with a range of key informants from Aboriginal Health Services (AHSs), which include community controlled and government managed health services, and the general practice sector, which includes employees of Medicare Locals and general practices (Appendix 1). Interviewees were purposively sampled for their knowledge and experience with the ICDP. Interviews and analysis were informed by data on state of implementation of the ICDP at site level, as reflected in Department of Health reports. Repeated 6-monthly cycles of interviews and feedback of data between 1 November 2010 and 30 December 2012 allowed review and refinement of our understanding of delivery and billing of health assessments and follow-up items.

Community focus groups were conducted to explore community perceptions of accessibility and quality of services. Data from community focus groups were related to access to health services in general rather than being specific to follow-up of health assessments.

For the purposes of this paper, we conducted an analysis of SSE data using a socioecological framework.13,14 We reviewed the themes that were identified through the SSE as barriers and enablers to follow-up of health assessments,5 and used an iterative approach to categorise these themes according to various levels of influence: patient, patient–health service relationship, health service or organisation, community and policy environment. Some themes could be interpreted as a barrier or an enabler, and some were relevant to more than one level. We have therefore described each theme according to the predominant direction and most important level(s) of influence.

Ethics approval for the SSE was granted through the Department of Health Human Research Ethics Committee, project 10/2012.

Results

Of the 581 individual interviews done through the SSE, 63 contained specific information about the follow-up of health assessments. Of the 58 group interviews, 31 contained information relevant to this paper. These 31 group interviews included 103 participants. Of the 72 community focus groups, 69 provided data on access to services (Appendix 1).

Uptake of Indigenous-specific health assessments and follow-up Medicare items

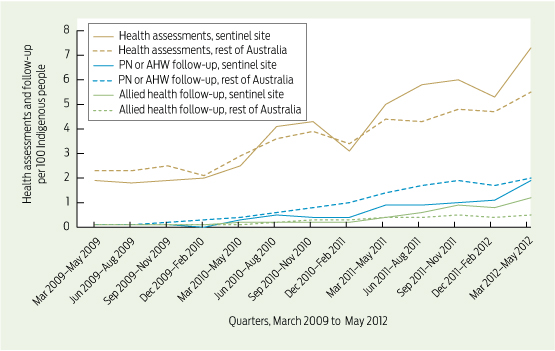
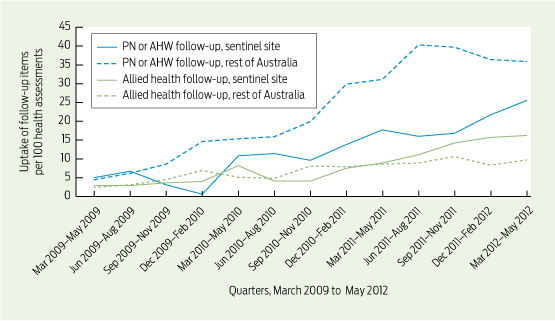
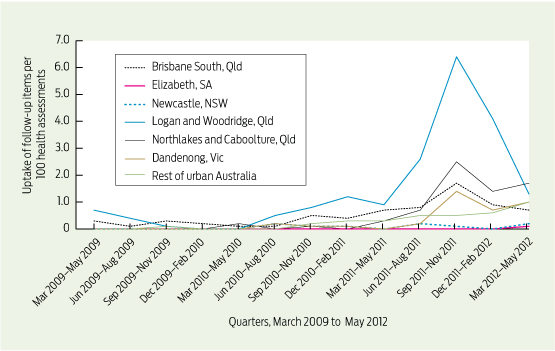
Aggregated data show a general improvement in uptake of health assessments and follow-up items after the baseline period, with some differences in trends between the sentinel sites and the rest of Australia (Box 2 and Box 3). The uptake of follow-up items was disproportionately low compared with health assessments. There were marked differences in trends between individual sites (Box 4) — more marked than differences between sites according to rurality.5

Levels of influence

Barriers and enablers to delivery and billing of follow-up care using a socioecological framework were identified at five levels of influence: patient, interpersonal, health service, community and policy. Findings at each level of influence are summarised below and exemplar quotes illustrating each theme and sub-theme are provided in Appendix 2.

Patient level

Strategies to create community demand and incentives for patients to undergo health assessments were evident at the local level. These strategies did not appear to include attention to increasing follow-up of health assessments, and there was little evidence of patient demand for follow-up after health assessments in the sentinel sites overall. People working in ICDP-funded support roles with responsibility for encouraging patients to attend for follow-up reported that patients frequently appeared to lack information about the reasons for their follow-up referrals.

Interviewees in some sites identified relatively frequent movement of people, with no regular residential address and limited options for contacting patients by phone, as constraining follow-up care. Limited access to transport was consistently identified by community focus groups as a barrier to accessing services. Concerns were expressed about the cost of accessing follow-up services, with out-of-pocket costs to patients for allied health care in particular being unpredictable.

Interpersonal level

Negative past experiences affected patients’ willingness to attend follow-up appointments. Community focus groups and interviewees shared personal stories that reflected perceptions of racist attitudes among health service staff — commonly reception staff.

Outreach workers, funded through the ICDP, played a key role in educating and supporting allied health providers and clinicians to provide culturally appropriate care in isolated pockets, but overall, allied health professionals had relatively limited access to cultural awareness training. General practitioners and practice staff were reluctant to refer patients to allied health professionals who they could not be confident would act in a culturally appropriate way.

Some GPs reported reluctance to refer patients for follow-up unless critical because they believed the patient would not attend, or they provided referrals with no expectation of attendance. Some patients appeared to resist adherence to follow-up referrals and treatment due to what they regarded as the “pushy” nature and communication style of some health professionals, and lack of adequate explanation of their health problem and treatment needs.

External support by regional support organisations including Divisions of General Practice (and subsequently Medicare Locals) helped improve awareness of the Indigenous-specific follow-up item numbers in health services and among allied health providers.

Health service level

Health service providers felt that short consultation times meant they had limited opportunity to explain reasons for referral for follow-up care to patients. This was related in part to shortage of service providers, including GPs, allied health professionals, Aboriginal Health Workers (AHWs) and practice nurses. Limited numbers of allied health professionals in particular constrained referral for allied health services. In some settings, eligibility requirements meant that some AHWs appeared to be ineligible to bill for relevant follow-up services, constraining use of these item numbers.

Organisations tended to have a greater focus on health assessments — partly for financial reasons rather than potential health benefit — with less attention to follow-up. This imbalance was also evident at policy and patient levels. Small numbers of Indigenous patients in many general and allied health professional practices were associated with a reluctance to reorient systems to address the needs of relatively few patients.

A general orientation within some health services to acute rather than chronic illness care limited the availability and interest of many nurses in providing follow-up services. This was particularly the case in remote settings, where acute care skills are an important criterion in recruiting nurses. GP-centric models of care, lack of clarity about roles and lack of confidence in co-workers were associated with limited opportunities for practice nurses and AHWs to manage patient lists and appointments and deliver follow-up consultations.

Another constraint on the uptake of follow-up items was the lack of established systems to organise and bill for follow-up, and a perception that the steps required for completion and correct billing of follow-up services were complex and required highly organised patient records and information flow. The need for changed work patterns, reorientation to preventive health and enhanced staff training and support in the use of clinical information systems presented significant challenges to health services in delivering and claiming these Medicare items. Leadership and management were vital to system change: where leadership lacked commitment, management practices did not support system change to implement this aspect of the ICDP. Where GP-centric models of care were entrenched, it was particularly difficult to reorient systems to enhance uptake of follow-up items.

Lack of capability in using clinical information systems, such as patient recall and reminder systems, also constrained follow-up. Ineffective use of these systems to support patient care was commonly reported in AHSs and general practices, and was also evident in allied health professionals’ practice systems.

Staff turnover and use of locum staff (both nursing and GP) were associated with limited use of follow-up items. GPs were found to have varying knowledge and skills in relation to accessing appropriate Medicare items and working within a multidisciplinary team. Fluctuating staff numbers and variable knowledge among staff of the service operations made it difficult to reorganise systems to enhance follow-up.

Interviewees commonly reported that follow-up consultations were frequently billed as a standard consultation rather than the correct Indigenous-specific Medicare item number.

Lack of private allied health providers, and a tendency — for cost reasons — for clinicians to refer to salaried allied health professionals, where these professionals were available, also limited the use of the Medicare follow-up item numbers. Lack of easy access to information and transparency around gap payments, and entrenched perceptions that services would be expensive and require numerous repeat visits, were a barrier to health service staff referring patients to allied health professionals.

Community level

Barriers related to Indigenous social and economic disadvantage included poor availability of transport to attend follow-up appointments and high or unpredictable cost of allied health services. These were exacerbated in the context of general social and financial disadvantage. ICDP-funded outreach workers played an important role in helping patients overcome transport barriers in some sites.

Policy level

At the policy level, the relatively low value of the MBS reimbursement for follow-up (relative to health assessment), reflected in the large gap payments that patients are faced with, appears to be an important constraint to greater uptake of the financial incentives available for follow-up. Increased and ongoing funding to support preventive care through Medicare encouraged uptake of follow-up care. The impact of this was constrained by relative emphasis on health assessments. There was confusion over eligibility of AHWs to claim the use of the follow-up items. Funding of positions and programs (including through the ICDP) to assist with provision of information to providers and community members and to overcome barriers to access enabled uptake of follow-up items.

Discussion

While there has been a substantial increase in the uptake of health assessments over recent years, delivery of follow-up care and billing for Medicare Indigenous-specific follow-up items was disproportionately low, particularly given the evidence of the high levels of need for follow-up.6,12,15,16 Our study identified multiple influences on uptake of follow-up care at various levels of the system — many related to actual delivery of follow-up care and some related to billing for Medicare items numbers. The influences identified in our analysis are consistent with the research on barriers to implementing health assessments and on access to health services more generally.3,6,7,1719 It appears that people receiving health assessments may be those who use health services more frequently,5 those of higher socioeconomic status, those with lower rates of morbidity and mortality and those with lower risk of chronic disease.1,20 Thus, health assessments may not be reaching those who need them most, reducing potential benefits at a population level. This “inverse care law”21 is likely to also be relevant to follow-up of health assessments, indicated by the access and cost barriers to follow-up identified in this analysis.

Strengths of the analysis in this paper include the mixed-methods approach, numbers and diversity of interviewees, geographic scope and diversity of study sites, and long-term repeated engagement with stakeholders, including feedback and member-checking of data and interpretation by local stakeholders. The socioecological analytical framework highlights that there are a number of factors at different levels of the system that enable or constrain choices made by individuals about access to health care.13,14

Limitations of this study include that sites were selected on the basis of early and relatively intense ICDP investment, and interviewees were selected because of their knowledge and interest in Indigenous health. The data provide a broad perspective of service settings across Australia, but this perspective may not necessarily be representative. Other limitations include that administrative data reflect billing for Medicare items, but do not necessarily accurately reflect the provision of clinical care. There is some evidence that follow-up may be happening, but that it is not being billed accurately. However, many of the identified barriers related to delivery of follow-up care rather than billing for follow-up items. Ecological models require themes to be categorised, and this process may be overly Western-centric.22 In conducting the analysis our team (which included Indigenous members) was sensitive to this risk. The strong links and interrelationships between themes need to be recognised. More general limitations of the SSE have been described elsewhere.5

Overcoming barriers to follow-up and strengthening enablers is vital to achieving health benefits from the large financial and human resource investment in health assessments. Our findings point to the need to support health services in developing systems and organisational capability to undertake follow-up of health assessments, but more importantly to reorient to high-quality, population-based and patient-centred chronic illness care. Drawing on our findings, we propose actions at various levels of the system to enhance both delivery of follow-up care and billing for follow-up items (Box 5). The diversity of contexts in which health services operate, the wide variation in current levels of follow-up between sites and the relevance of different contextual factors to barriers to uptake in different sites mean that strategies will need to be tailored to local circumstances.

1 Medicare Benefits Schedule (MBS)-rebated items for Indigenous-specific health assessments and follow-up2

Item characteristic

Health assessment

Follow-up by a PN or registered AHW

Follow-up by an allied health professional


Description

Available to all Indigenous people and may only be claimed by a general practitioner

After a health assessment, a follow-up item can be claimed by GPs for follow-up services delivered by a PN or registered AHW on behalf of the GP

After a health assessment, if the GP identifies a need for follow-up by an allied health professional, a referral is made and the allied health professional can claim this item

MBS item number

704, 706, 710 to 1 May 2010; thereafter 715

10987

81300–81360

MBS rebate

$208.10

$24.00

$52.95

Notes

Changed to simplify claiming by streamlining MBS item numbers to one item and making all claimable annually. This came into effect from May 2010 and coincided with implementation of the ICDP

Introduced in 2008, this MBS item allowed five follow-up services per patient per calendar year. This was expanded in 2009 to allow 10 follow-up services per patient per calendar year

Introduced in 2008, on referral from a GP, a maximum of five follow-up allied health services per patient per calendar can be claimed


AHW = Aboriginal Health Worker. ICDP = Indigenous Chronic Disease Package. PN = practice nurse.

2 Health assessments provided by a general practitioner, and follow-up services provided by a practice nurse (PN), registered Aboriginal Health Worker (AHW) or allied health professional

3 Follow-up services provided by a practice nurse (PN), registered Aboriginal Health Worker (AHW) or allied health professional in Indigenous people who had a health assessment

4 Uptake of practice nurse (PN), registered Aboriginal Health Worker (AHW) or allied health professional follow-up items in all urban sentinel sites and in the rest of urban Australia


NSW = New South Wales. Qld = Queensland. SA = South Australia. Vic = Victoria.

5 Potential strategies for strengthening follow-up of health assessments

Approaches to enhancing follow-up are presented for each level of the socioecological model. It is important that strategies to enhance follow-up use approaches across the range of levels, with attention to maximising synergies between approaches at different levels.

Patient level

  • develop locally relevant evidence-based approaches to create community demand for follow-up of adult health assessments;
  • address transport and other barriers to access to follow-up care; and
  • strengthen linkages between health services and local communities to enable recall of patients who require follow-up.

Interpersonal level

  • ensure that cultural awareness training reaches relevant providers, including allied health professionals and service support staff, such as receptionists.

Health service level

  • continue efforts to raise awareness of the follow-up Medicare Benefits Schedule (MBS) item numbers among health service staff and allied health professionals, including how item numbers complement each other and why the correct Indigenous-specific item numbers should be used (eg, additional numbers of items available with specific item numbers);
  • strengthen capability of health service staff to make effective and efficient use of clinical information systems, specifically including use of recall and reminder systems. Ongoing training and workforce development is required to address staff turnover and locum staff needs;
  • support service reorientation from models suited to acute care to models suited to patient-centred and long-term care;
  • develop and assess effectiveness and efficiency of alternate models of provision of allied health services and “what works for whom and in what circumstances”; and
  • identify and communicate cost implications of referral for follow-up care, and address cost barriers to follow-up care.

Community level

  • raise awareness of the need for ongoing chronic illness care and the importance of follow-up of issues identified in health assessments; and
  • identify relatively high-need and hard-to-reach groups in local communities, and develop strategies to overcome the barriers to these groups accessing follow-up care.

Policy level

  • clarify the Aboriginal Health Worker role in provision of services, including provider number eligibility;
  • ensure that the policy intent of having an Indigenous-specific MBS item number for follow-up services is clearly understood at different levels in the system; and
  • emphasise the health-relevance of health assessments and the importance of follow-up care, and refine incentives to maximise potential health gain.

Cost of best-practice primary care management of chronic disease in a remote Aboriginal community

The health of Australian Aboriginal and Torres Strait Islander people is very poor, and their access to primary care is inadequate, especially in remote areas.13 Prevalence of and mortality from type 2 diabetes (hereafter diabetes) and chronic kidney disease (CKD) are extremely high in remote Aboriginal communities in the Northern Territory.4 Chronic disease is responsible for 80% of the mortality gap between Indigenous and non-Indigenous Australians, with diabetes accounting for 12%.5 For all Indigenous Australians, the self-reported prevalence of diabetes is more than three times, and the incidence of end-stage CKD six times, the non-Indigenous rates.3 In remote Aboriginal communities in the NT, CKD prevalence is up to 25% of the population,4 or 46% of adults.6 Diabetes prevalence is in the order of 13%7 to 16%4 of the population, or up to 29% of adults.6 Both conditions are major contributors to cardiovascular disease, the greatest single contributor to the mortality gap.5

The origins of the chronic disease epidemic in Indigenous populations and, more broadly, the health gap are complex,3,6 and actions addressing both the social determinants of health3,4,7,8 and systematic primary clinical care6,9 are needed. In this study, we focused on the need for systematic clinical care, which is essential to reduce complications and delay the progression of diabetes and CKD.6,9

The rate of avoidable hospitalisations, a key marker of access to and effectiveness of primary care, is highest in remote communities.10 Australian and international evidence shows strong primary care systems result in better health outcomes, lower rates of avoidable hospitalisations, avoidance of dialysis, and significant cost savings.913 Many hospitalisations for complications of diabetes and CKD can be avoided through systematic primary care treatment, with significant medical cost savings.10,1315 However, there are few estimates of the resources required to sustain primary care management of these conditions.

Particular difficulties for remote primary care include isolation, long distances to services, understaffing and a high turnover of clinical staff.16 Remote health care also requires special skills in chronic disease management, acute care, public health and intercultural communication.13,14,16,17

Our study was initiated by an Aboriginal community controlled remote health service because, despite its own perceptions of competent staff and clinical systems, staff still struggled to satisfy existing clinical protocols within given resources. The service received funding primarily from the then federal Office for Aboriginal and Torres Strait Islander Health and the then NT Department of Health and Families. Other sources included Medicare and a small university research grant. The aim of our study was to estimate the resources required by a remote health service to optimally manage diabetes and CKD — with adherence to the local Central Australian Rural Practitioners Association Standard Treatment Manual (CARPA STM) guidelines15 and with full population coverage.

Methods

The study took place between July 2010 and May 2011 in a remote Central Australian community. The methods were adapted from the models of care health service planning approach18 and an earlier NT cost study.10 Using the models of care approach, Segal and colleagues18 began with local best-practice protocols and estimated the staff time required to complete each of the recommended tasks for a given population. The population health status was assessed and the best-practice health care tasks required for that population were defined for each health profession involved. The time required per patient per year for each task was then determined, and the health care staffing resources then calculated for the population. Zhao and colleagues10 used an analogous approach to estimate the total operating costs of a “reasonably efficient” remote Aboriginal health service. Population needs were defined in terms of the CARPA STM protocols.15 The time estimate given in the definition of each linked Medicare Benefits Schedule item was used in quantifying the population’s staffing needs.10

The target population was resident adults (> 18 years of age) with diabetes or CKD. Best practice was defined in terms of the CARPA STM protocols.15 These protocols are used by all NT primary care providers: government clinics and Aboriginal community controlled health services.19 The tasks recommended by the CARPA STM include history taking, health promotion, education, physical examination, biochemical investigations and prescription of medication.15

First, prevalence of diabetes and CKD was estimated using the health service electronic health record, which represents not only patients presenting for diabetes and CKD management but also those identified in community screening. Prevalence at multiple levels of severity was estimated for both conditions. For CKD, levels of severity were stages 1–5 (estimated glomerular filtration rate range, > 90 [stage 1] to < 15 mL/min/1.73 m2 [stage 5]), with early CKD defined as stages 1–3. For diabetes, early was defined as non-insulin-treated and advanced was defined as insulin-treated. This enabled us to calculate, at the community level, the total annual number of diabetes and CKD care tasks recommended by the clinical protocols.

Second, semistructured interviews informed two aspects of the study. Clinicians were asked to estimate the time required for each protocol task, as well as any unremunerated out-of-hours time essential for the chronic disease management program. Clinicians’ descriptions of their role in chronic disease care helped to structure the final staff-funding model and also to identify other barriers to best-practice care.

Third, the daily work and chronic disease consultations undertaken by a cross-section of clinicians were directly observed in a detailed time-and-motion study. We measured the time taken by each clinician for each task defined by the relevant CARPA STM protocol. We then used a combination of these observations and interview data to estimate an average time for each item (such as measuring blood pressure or discussing diet). Supplies were itemised for each protocol and costed using the clinic’s supply orders or representative prices.

Fourth, financial records provided clinicians’ wage rates and administrative fixed costs. The wage rates, together with the estimates of time-per-task and annual community care requirements, were used to calculate the total cost of clinical staffing for primary care of diabetes and CKD.

We considered costs that, while non-clinical, are part of the overall cost footprint of diabetes and CKD care. Using data from direct observation of clinicians’ workdays, we estimated the proportion of total clinical time spent on diabetes and CKD. This proportion was then applied in a top-down fashion to the health service’s non-clinical costs, so that part of the cost of clerical staff and clinic vehicles was attributed to diabetes and CKD. These data collection and cost estimation methods are summarised in the Appendix.

Finally, we compared the estimated 2009–10 expenditure on diabetes and CKD with the projected annual expenditure using our best-practice model, reflecting full protocol compliance. For this, we assessed the level of clinicians’ adherence to the guidelines using the One21seventy health record audit tool, which is widely accepted in Indigenous health services in Australia and is based on the CARPA STM protocols.20 Per capita figures were calculated as total staff hours required for tasks specific to each group (eg, staff hours per patient per week to manage insulin treatment) divided by the number of patients with CKD or diabetes.

We distinguished between costs met out of the health service budget and expenses met directly by the federal and NT governments and other agencies. Examples of the latter are medications provided free to Indigenous patients under s 100 of the National Health Act 1953 (Cwlth), and visiting allied health services. The increased cost of such items in our model of care was separated from any additional funding needed by the health service to provide that model.

For comparison with the study by Zhao et al we adjusted the 2003–04 NT-wide figures for inflation occurring between financial years 2003–04 and 2009–10 (using the Consumer Price Index for health care in Darwin), and only included comparable aspects of our study (eg, insulin treatment was excluded).10,21

Approval was received from the remote community’s health board and the Central Australian Human Research Ethics Committee (ref: 2010.08.07). Written consent was obtained from all individual participants. Verbal and written feedback was provided to the health board at the conclusion of the study.

Results

In this remote community with a population of 542, 519 (96%) were Aboriginal.22 Of the 297 adults, 74 (25%) had diabetes and 86 (29%) had CKD; 45 (15%) had both conditions. Thirty-one adults (10%) had CKD stages 3–5. Of the 74 adults with diabetes, 13 (18%) were prescribed insulin.

The clinic was staffed by four Aboriginal health workers (AHWs), three remote area nurses (RANs), a general practitioner, a chronic disease educator (CDE) and an exercise physiologist. Twelve staff interviews were completed, and 14 workdays and seven clinical consultations were directly observed.

Quarterly chronic disease checks with an AHW or RAN were recommended for most patients with diabetes or CKD. A GP reviewed clinical findings and investigations, prescribed medication where necessary, and oversaw treatment planning. A full-time CDE educated individual patients and groups and managed insulin treatment. Interviewed staff identified education as crucial for patients’ control of their chronic disease. Locating patients in the community and delivering and explaining their medications were also a significant part of clinicians’ work. According to the medical record audit, 75% of all recommended protocol tasks for diabetes management and 79% for CKD were completed in 2009–10. Based on 2009–10 staffing, our model results in 29% of total clinical hours being used for diabetes and CKD care.

The total projected annual primary care cost of clinical management of diabetes and CKD management with full adherence to the protocols for all patients would be $900 792 (Box 1). On average, the annual cost per patient would be $7856, ranging from $4062 (for people with previously diagnosed early CKD without diabetes and without high cardiovascular risk) to $15 241 (for people with stage 5 CKD and advanced diabetes, with a recent diagnosis of either condition) (Box 2). Including only the costs met through the health service-allocated budget, the projected cost to the centre would be $645 313, or $5628 per patient on average, based on estimated total annual direct clinical staff hours specifically for diabetes and CKD of 4226 hours, or 2.37 full-time equivalents. (The difference between the cost to the centre and the total projected annual cost consists of costs met directly by other sources, including the federal and NT governments, rather than through the health service budget.) Expenditure in 2009–10 by the remote health service for diabetes and CKD care was estimated at $446 585, or $3895 per patient (Box 1). The health service would thus require an additional $198 728 (ie, an additional $1733 per patient) for best-practice management of diabetes and CKD. Overall funding received by the health centre in 2009–10 was $3413 per patient.

Interviews with staff identified a number of other barriers to optimal care. The high turnover of RANs necessitated frequent intensive orientation and teaching for new staff. The clinic was also rarely fully staffed. On-call night work, cross-cultural communication and cultural differences can present difficulties for RANs. AHWs may face a conflict of duties and values between the community and the health centre and a heavy responsibility in the role. A high acute caseload and the reticence of many patients to attend checks, for reasons including low health literacy and long waiting times, also hinder adequate management of chronic disease. There is a perceived need to allow more time for clinicians and patients to build relationships and for community-building work.

Discussion

Our study identified a high prevalence of diabetes and CKD in a remote community. As this is the community’s only clinic and the community health screening coverage is high, the clinic-based prevalence approximates population prevalence and is consistent with other remote community studies.4,13

This service is relatively well funded compared with other NT primary care services. Expenditure in 2009–10 was $3413 per capita per annum. The mean per capita figure for NT Government remote clinics for 2011–12 was $2329. This service has a higher than average compliance with the protocols for CKD and diabetes (77%, compared with the territory-wide figure of 73% for clinics participating in the One21Seventy audit). In response to low health literacy and patient mobility, the clinicians engage in very active outreach, health education and opportunistic screening. Most remote communities do not employ a CDE or exercise physiologist.

Despite these positive factors, 2009–10 expenditure was insufficient to provide optimal management by a margin of 44%, or an average of $1733 per patient with diabetes or CKD. Quantitative data were consistent with clinicians’ perceptions at interview that additional staff members were required to work with the CDE and AHWs to adequately meet community needs. Additional staff could increase the crucial quarantining of AHWs’ and RANs’ chronic disease care time from acute care time, possibly contributing to enhanced retention of staff. It would also allow greater allied health coverage, increasing exposure of patients to consistent health messages, and additional informal staff education.

The costs calculated in our study were higher than the inflation-adjusted (2003–04 to 2009–10) NT remote community estimates produced by Zhao et al.10,21 Possible reasons include the conservative estimates by Zhao et al of clinical time needed in remote health services for chronic disease care and staff training, and the higher administrative and salary costs at the studied remote clinic compared with those used in the earlier study.10

Strong primary care systems result in better health outcomes and significant cost savings.9,1113 There is a strong argument for adequate funding of primary care services like the subject of our study. Our findings also highlight the lack of benchmarks that might indicate appropriate levels of funding to meet community needs and provide cost-effective care.

The strength of this study is its rigour and comprehensiveness, using multiple data sources (qualitative and quantitative). However, the methods are resource intensive and replication at other locations or with other disease groups would be expensive. Other limitations include the fact that costs were kept constant in our modelling. It is likely that unit and, possibly, fixed costs will increase as 100% community coverage and adherence to protocols is approached. It may be that 100% coverage and compliance is uneconomical.

Limitations to generalising these findings to other remote Indigenous health centres are the wide variation in transport costs, the availability of allied health care, and the feasibility of indicated insulin treatment given limited staffing resources. The small sample size also means that caution must be taken in generalising the results.

Nevertheless, this community is not unrepresentative of many remote Indigenous communities, and our study provides the best available evidence about the funding gaps for optimal management of two prevalent chronic diseases in such communities. It documents a significant shortfall even in a relatively well funded and effective primary care service, close to the regional centre. We would expect that the documented shortfall is a conservative estimate. These findings should inform funding bodies in their allocation of health resources for remote Indigenous communities. It may also be of use to this and other remote communities in advocating for their health care needs.

1 Estimated 2009–10 and projected annual costs* for the primary care management of type 2 diabetes and chronic kidney disease in a remote Aboriginal community


Annual costs ($)


Category

2009–10

Projected


Remote health centre costs


Clinical staff

228 906

340 392

Remote area nurses and Aboriginal health workers

62 011

68 592

General practitioners

38 799

74 439

Chronic disease educators and visiting dietitians

128 096

197 362

Administrative staff

76 383

108 507

Medical supplies

4079

5795

Other operating costs

137 217

190 618

Maintenance

1240

1762

Vehicles

27 758

35 123

Other supplies

1635

2322

Other administrative (including computers, power)

106 584

151 411

Total

446 585

645 313

Direct costs to federal and NT governments

234 424

255 479

Grand total

681 008

900 792


NT = Northern Territory. * Full coverage and full adherence to protocol. † Includes dental (NT), and optometry, non-vehicle and vehicle capital costs, and medications provided to Indigenous patients under s 100 of the National Health Act 1953 (federal).

2 Total projected annual costs per patient* for the primary care management of type 2 diabetes and chronic kidney disease (CKD) in a remote Aboriginal community, by stage of disease and comorbidity


Cost, by severity of CKD ($)


Condition and case type

No CKD or stage 1–3

Stage 4

Stage 5


CKD without diabetes


New cases

4345

4547

5200

Existing cases


Without high cardiovascular risk

4062

4175

5042

With high cardiovascular risk

4125

Non-insulin-treated diabetes


New cases

4428

4601

5252

Existing cases


Without high cardiovascular risk

4133

4228

5093

With high cardiovascular risk

4196

Insulin-treated diabetes


New cases

14 417

14 590

15 241

Existing cases


Without high cardiovascular risk

14 122

14 218

15 083

With high cardiovascular risk

14 185


* Full coverage and full adherence to protocol. † Dialysis costs excluded.

The cost-effectiveness of primary care for Indigenous Australians with diabetes living in remote Northern Territory communities

Australia’s Northern Territory has an estimated population of 234 800 people — just 1% of the national total. More than half the population lives in the greater Darwin area or in Alice Springs.1 Of all states and territories, the NT has the highest proportion (30%) of Aboriginal and Torres Strait Islander peoples (Indigenous Australians), many of whom live in small communities in remote and very remote areas (remoteness area categories 3 and 4).2 Indigenous people continue to experience higher rates of unemployment, lower levels of education and more crowded living conditions compared with other Australians. These social determinants contribute to poor health, including higher rates of chronic diseases and hospitalisation, higher mortality and lower life expectancy.3

Primary care is an effective and efficient means of providing a range of basic health services that improve health outcomes.4,5 However, providing high-quality, cost-effective primary care for a small population dispersed over a large remote area poses challenges. Cost-effectiveness refers to value for money, with better health outcomes achieved at less cost for patients as well as the health system.6 Indigenous people in remote settings experience barriers to accessing health services, including poor availability of general practitioners, geographical isolation, costs associated with travel and variable levels of cultural safety.7,8 Rates of potentially avoidable hospitalisations (PAHs) are indicators of access to primary care and include hospitalisations that may have been avoided by preventing illness or managing chronic disease.8

Undiagnosed or poorly controlled diabetes often results in serious complications leading to PAH, disability and premature death. In the NT between 1998–99 and 2005–06, Indigenous people were hospitalised for potentially avoidable causes at four times the rate of non-Indigenous people. This was largely attributable to diabetes complications, and highlights barriers to accessing effective primary care.9 Together with other chronic diseases, diabetes accounts for a large proportion of hospital resources, indirect costs through loss of productivity and impacts on social and family life.10

The NT is disadvantaged with regard to funding, as with fewer GPs in remote areas there is less Medicare and Pharmaceutical Benefits Scheme (PBS) subsidisation of consultations and prescribed medicines. Many health services in remote Indigenous communities are provided by nurses and Aboriginal health workers, whose services are largely not covered by Medicare or the PBS.11 This disadvantage is compounded by the high cost of providing primary care in remote locations compared with equivalent services in metropolitan areas.12 Additional funds are provided by the federal government, but between 2003 and 2012, there was a persistent gap of about $37 million annually between actual Medicare payments for NT residents and expected payments based on the national average. The 2012 rate of use of the PBS was only one-quarter of the national average.13 These comparisons are based on a per capita share and do not take into account the greater health needs of the Indigenous population or the cost of delivering services.14

There appears to be a significant need to improve availability of primary care services in remote communities in the NT. While the costs of providing these services are relatively high because of remoteness and a lack of economies of scale, there is a shortage of cost-effectiveness data showing whether there is a net benefit in terms of health outcomes and costs of investing in primary care. We undertook a population-based retrospective cohort study, from a health service perspective, to evaluate the costs and the health outcomes associated with primary care use by Indigenous people with diabetes in remote communities in the NT, using the incremental costs and benefits among a population of patients with different levels of primary care use.

Methods

We linked two databases at the individual level using patients’ unique hospital registration numbers. Individuals were categorised to one of three groups based on their level of use of primary care services. Data were stratified by disease stage. We compared marginal costs and marginal effects on health outcomes using hospitalisations, PAHs, deaths and years of life lost (YLL). We calculated cost-effectiveness ratios with 95% confidence intervals.15 All costs and monetary benefits are reported in 2006–07 Australian dollars.

Inclusion criteria

Inclusion was restricted to residents of remote and very remote areas of the NT2 who had been diagnosed with diabetes; were aged 15 years and over as of 1 January 2002; identified as Indigenous; and visited a public hospital in the NT or one of the remote clinics managed by the NT Department of Health at least once during the study period. The quality of Indigenous status reporting in NT hospital admission data is estimated to be 98% accurate.16

All primary care visits and hospitalisations of NT Indigenous patients in the catchment localities of the clinics between 1 January 2002 and 31 December 2011 were included for analysis. In the case of multiple residential localities, the locality with the highest frequency of recorded visits or hospitalisations was used. Direct transfers from clinics to hospital were not included in measures of use.

Classifications

Diabetes was defined using the International Classification of Primary Care, 2nd edition (ICPC-2)17 and the Australian Refined Diagnosis Related Groups, Version 4 (AR-DRG)18 (Box 1). PAHs were identified using the International Statistical Classification of Diseases and Related Health Problems, Tenth Revision, Australian Modification (ICD-10-AM).19 The principal diagnosis and procedure codes and up to nine secondary codes were used to identify complications of diabetes and PAHs.20

Data sources

We used two administrative databases: the primary care information system (PCIS) and the Caresys hospital admission data system. Data from 54 remote clinics and all five public hospitals in the NT for the 10 years 2002–2011 were extracted for statistical analysis.

We used the government accounting system to extract financial data for primary care costs. Operational and personnel expenditures were allocated based on activity. These expenditures covered patient travel, property maintenance and cleaning, and salaries for doctors, nurses and Aboriginal health workers. Costing information was derived using a “top-down” approach based on the total remote health expenditure and total clinic visits. The mean cost per visit was derived by dividing the total recurrent expenditure by the total number of clinic visits. Hospitalisation costs were taken from the national hospital costing data collection which excluded capital expenditure and patient travel. Indigenous patients in remote communities are not required to contribute a copayment for their care. We did not include any incidental costs borne by patients.

Statistical analysis

The two variables of interest were disease stage and primary care use. To define disease stage, patients were allocated to one of three groups depending on disease severity. ICD-10-AM and ICPC-2 were used to identify new cases and complicated cases. A new case was identified by checking previous health records. A new diagnosis was assumed if the patient did not have a previous diabetes-related hospital admission or clinic visit. The three groups were:

  • New cases: patients with a new diagnosis and without complications, as identified by applying the formula in Box 2;
  • Established cases: patients who were neither a new nor a complicated case;
  • Complicated cases: patients with one or more disease complications in any field of diagnosis, as defined in Box 1.

Patients were also allocated to one of three groups according to annual number of primary care visits:

  • Low-use group: 0–1
  • Medium-use group: 2–11
  • High-use group: ≥ 12.

Recommended best practice in the CARPA (Central Australian Rural Practitioners Association) Standard Treatment Manual 5th edition was used to develop the range of annual visits for each group.21

Propensity score matching and weighting were used to improve the comparability of the three groups.22 The propensity score was computed using key demographics and numbers of chronic diseases. A χ2 test was used to check comparability of the three groups.

Outcomes were measured in terms of annual hospitalisation rates (mean number of hospitalisations per person); annual PAH rates; deaths per 100 population; and YLL per person for between-group comparison. Deaths were identified using both PCIS and Caresys data. Age at death and Australian age-specific life expectancy were used to estimate YLL. The level of significance was set at P < 0.05. The cost-effectiveness ratio (CER) was calculated as the incremental cost per hospitalisation averted for both medium- and high-use groups, compared with the low-use alternative. If the CER is less than the “willingness-to-pay” threshold (a criterion for determining cost-effectiveness), that level of use is deemed cost-effective.15 The mean hospitalisation cost in the NT in the 2006–07 financial year was used as the threshold for hospitalisation assessment. The net benefit, expressed in monetary terms, was evaluated on the basis of primary care costing, hospitalisations saved or YLLs averted and the willingness-to-pay threshold. To assess the uncertainty relating to the cost-effectiveness of primary care, we calculated a cost-effectiveness acceptability curve,15 which allows estimation of the probability that primary care is cost-effective in reducing hospital admissions or YLLs, against different values placed on a hospital admission or a year of life. The statistical value of a life-year was $120 000 for the YLL assessment threshold.23 SAS 9.3 (SAS Institute Inc) was used for statistical analysis.

Ethics approval for this project was obtained from the Northern Territory Department of Health and Menzies School of Health Research Ethics Committee (Approval Number: 2012-184) and from the Central Australian Human Research Ethics Committee (HREC 12-57).

Results

A total of 14 184 patients were eligible to be included in the study. After propensity score matching, there were no significant differences in age (P = 0.980), sex (P = 0.354) or number of comorbidities (P = 0.348) between the low-, medium- and high-use groups. The mean cost per primary care visit in 2007–08 was estimated at $175. The mean cost per hospitalisation was $2915 (AR-DRG hospital inpatient costing is based on 2007–08 and 2008–09 financial year figures).

Overall, compared with the low-use group, the medium- and high-use groups (patients who used primary care two or more times annually) experienced lower rates of annual hospitalisation, PAH and death and fewer YLL (Box 3). Among complicated cases, the medium-use group had a lower mean annual hospitalisation rate than the low-use group (1.2 v 6.7 hospitalisations per person [P < 0.001]); the mean annual PAH rate was lower (0.72 v 3.64 per person [P < 0.001]); and the death rate and YLL were also lower (1.25 v 3.77 per 100 population [P < 0.001] and 0.29 v 1.14 per person-year [P < 0.001], respectively). Only marginal differences were observed for patients using primary care ≥ 12 times annually. For new cases in the medium-use group compared with the low-use group, the death rate was lower (0.48 v 2.17 per 100 population [P = 0.001]), as were YLL (0.13 v 0.81 per person-year [P < 0.001]). Lower rates were also shown for established cases in the medium-use group compared with the low-use group (deaths, 0.15 v 1.65 per 100 population [P < 0.001]; YLL, 0.05 v 0.57 per person-year [P < 0.001]).

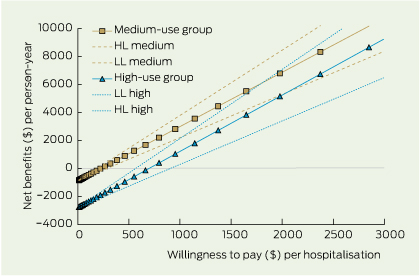
The net health benefits in saved hospitalisations provide a summary measure for the value-for-money of primary care. The net health benefit, as measured by hospitalisations saved per person per year, is achieved at a lower cost when primary care is used between two and 11 times per year. While higher use of primary care achieves slightly greater net benefits, it does so at a greater cost as measured by willingness to pay (Box 4).

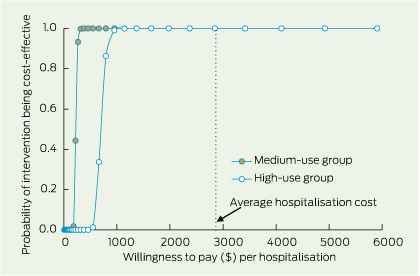
Using 2007–08 and 2008–09 financial year figures, there is an almost 100% probability that both medium and high primary care use are cost-effective in terms of hospitalisations avoided (Box 5).

Investing $1 in medium-level primary care for people with diabetes in remote Indigenous communities could save $12.90 in hospitalisation costs. Investing $1 in high-level primary care use could save $4.20.

The cost of preventing one hospitalisation for diabetes was $248 for those in the medium-use group and $739 for those in the high-use group. In both cases the cost was much less than the mean cost of one hospitalisation, $2915.

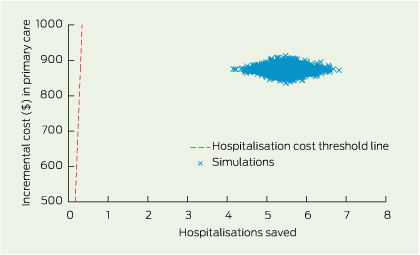
Uncertainty in the cost and effect estimates was assessed by 2000 bootstrapped simulations (Box 6).

Discussion

In the NT, improving the availability of primary care services is the key to improving access.7 The current model of service delivery in the NT results in low rates of primary care use and high rates of hospitalisation, suggesting patients with diabetes are not receiving optimal care aimed at monitoring and preventing complications. Investment in primary care in remote areas in the NT is costly compared with metropolitan settings.12 However, the alternative, hospital-based care, is even more expensive and results in poorer health outcomes. Our study has shown that improving use of primary care would not only yield better health outcomes for patients with diabetes, but would be cost-effective. The savings calculated in this study could be increased by improving the social determinants of health, in which process primary care has an important role through intersectoral action.4

These results are valuable to policymakers and health service planners charged with resource allocation. While there is general agreement in the international literature that improved access to primary health care results in fewer PAHs,24 evidence that this is true for remote communities in Australia and that this is cost-effective is scarce.25 Our study shows that improved access to primary care is both cost-effective and associated with better health outcomes for residents of remote communities. The results may be generalisable for other chronic diseases and to other jurisdictions in Australia. They may also be relevant to other countries where remoteness poses similar challenges.

The results are also of value to primary care managers and service providers who can aim to ensure their patients with diabetes are using services adequately (2–11 times per year). In Indigenous communities, it is particularly important that primary care services are culturally appropriate and reflect community preferences, including connection to culture, family and land, and opportunity for self-determination.26

Our study has limitations. Researchers did not have access to mortality data beyond 2007 and used hospital and PCIS mortality data only, so some deaths may have been missed. We did not have access to data from Aboriginal Community Controlled Health Services, and acknowledge that some patients may have been using primary care elsewhere. Some patients undergoing renal dialysis in hospital may have obtained primary care there rather than in their home community. A sensitivity analysis revealed that eliminating renal dialysis hospitalisations made little difference to the outcome (results are not reported). We did not include costs incurred in transporting patients from remote locations to hospital, so the total costs of hospitalisation are an underestimation. We were not able to eliminate any potential confounding effects of distances from patient’s residence to clinics or to hospital due to lack of data on geocoded localities.

Indigenous people in remote communities in the NT experience high rates of diabetes and poor access to primary care with resultant high mortality, morbidity and hospitalisation rates. This study used reliable, linked data to provide new evidence that there are significant cost savings and better health outcomes for patients with diabetes when access to primary care is improved.

1 Disease groups, definitions of diabetes and complications of diabetes

Coding

Diabetes


Primary care ICPC-2 codes

T87, T89, T90

Hospital AR-DRG codes

F11A, F11B, F13Z, K01Z, K60A, K60B

Hospital ICD-10-AM codes

E10-E14

ICPC-2 complication codes

A07, F83, K01, K02, K74-K76, K86, K89, K90, K91, N94, U88

ICD-10-AM complication codes

R40, R07, I20-I25, I10, G45, G46, I60-I69, H35, H36, G54-G64, N00-N19


ICPC-2 = International Classification of Primary Care, 2nd edition. AR-DRG = Australian Refined Diagnosis Related Groups, version 4. ICD-10-AM = International Classification of Diseases.

2 Criteria used for deciding a new case of diabetes

Data source

Criteria*


Hospital data

(last admission > 3 years AND no diabetes) OR


(last admission > 2 years AND no diabetes in the last two admissions) OR


(last admission > 1 month AND no diabetes in the last three admissions)

Primary care data

(last visit > 1.5 years AND no diabetes) OR


(last visit > 1 year AND no diabetes in the last two visits) OR


(last visit > 1 month AND no diabetes in the last three visits) OR


(last visit ≤ 1 month AND no diabetes in the last four visits)


* A new case must satisfy one of the criteria in both hospital and primary care data.


3 Mean annual hospitalisation, potentially avoidable hospitalisation, death rate and years of life lost for Indigenous people with diabetes in remote communities in the Northern Territory, by primary care use group, 2002–2011


Mean annual rate (95% CI)


No. of patients, and outcomes, by disease stage

Low-use group (0–1 primary care annual visits; n = 1421)

Medium-use group (2–11 primary care annual visits; n = 1892)

High-use group (≥ 12 primary care annual visits; n = 772)


New cases

n = 119

n = 63

n = 18

Established cases

n = 278

n = 393

n = 50

Complicated cases

n = 1024

n = 1436

n = 704

Hospitalisations per person


New cases

0.7 (0.58–0.89)

0.8 (0.59–1.04)

0.9 (0.46–1.36)

Established cases

0.4 (0.36–0.52)

0.7 (0.60–0.77)

0.3 (0.16–0.48)

Complicated cases

6.7 (6.56–6.88)

1.2 (1.18–1.30)

1.0 (0.94–1.09)

Total

5.0 (4.87–5.11)

1.1 (1.06–1.16)

1.0 (0.89–1.04)

Avoidable hospitalisations per person


New cases

0.31 (0.21–0.42)

0.35 (0.20–0.50)

0.38 (0.09–0.67)

Established cases

0.20 (0.14–0.25)

0.38 (0.32–0.44)

0.11 (0.02–0.21)

Complicated cases

3.64 (3.52–3.76)

0.72 (0.68–0.77)

0.57 (0.51–0.63)

Total

2.69 (2.60–2.78)

0.64 (0.60–0.67)

0.54 (0.48–0.59)

Deaths per 100 population


New cases

2.17 (1.32–3.02)

0.48 (0.00–1.03)

0.00 (–)

Established cases

1.65 (1.17–2.14)

0.15 (0.03–0.28)

0.46 (0.00–1.06)

Complicated cases

3.77 (3.39–4.16)

1.25 (1.06–1.43)

0.84 (0.62–1.06)

Total

3.23 (2.92–3.53)

0.99 (0.85–1.14)

0.80 (0.59–1.00)

Years of life lost per person


New cases

0.81 (0.76–0.86)

0.13 (0.10–0.16)

0.00 (–)

Established cases

0.57 (0.54–0.60)

0.05 (0.04–0.06)

0.21 (0.17–0.25)

Complicated cases

1.14 (1.12–1.16)

0.29 (0.28–0.30)

0.20 (0.19–0.21)

Total

1.00 (0.99–1.02)

0.24 (0.23–0.24)

0.20 (0.19–0.21)

4 Net benefits in hospitalisations avoided with 95% confidence intervals, by willingness-to-pay per hospitalisation


HL = high limit. LL = low limit.

5 Cost-effectiveness acceptability curve for patients in the medium-level group for use of primary care for diabetes, compared with the high-level group, in terms of hospitalisations avoided

6 Bootstrap simulations with 2000 replications on the cost-effectiveness plane of primary care, for patients in the medium-level of primary care for diabetes

Copayments for general practice visits

How do general practitioners view this possible change in financial arrangements?

There are reasons why it may be tempting to think that imposing a copayment for visiting a general practitioner is a good idea. It could instantly reduce the number of GP consultations, perhaps conserving funds for a possibly threatened Medicare. As GPs are “gatekeepers”, and therefore a bottleneck to accessing specialist services, fewer GP services might mean fewer downstream services. It might also be one of several means of reducing overdiagnosis.1 But is it really this straightforward?

Copayments are not new to health: we already encounter them between Medicare and specialist services, between the Pharmaceutical Benefits Scheme and medicines, and between health insurance and private hospital charges. On this basis, insisting that GP services should be “free” seems to devalue GPs. Why should GP services be shouldered with a bargain price while nearly all others charge more? Indeed, many GPs already charge their own “copayment” — arguing (in addition to the obvious pecuniary benefits) that patients will consequently value their care more. Moreover, most GPs are aware that some visits from patients are unnecessary, involving something that could easily have been managed at home, such as a self-limiting acute respiratory infection.

In assessing whether a GP copayment would alleviate any of these problems, there are several key questions to consider — what are the disincentives to visiting a GP; how should we define necessary consultations; and how do we continue to ensure equitable access to health care?

Although a meta-analysis of copayments for pharmaceuticals by the RAND Corporation showed that about 2%–6% of system costs are deterred for every 10% increase in copayment,2 some commentators challenge the idea of extrapolating this to copayments for consultations.3 The converse is apparently not true: making GP visits free for people aged over 70 years in Ireland in 2001 did not cause an increase in GP visits in this group.4 There are already many other disincentives to going to a GP — ringing to schedule an appointment, arranging transport to get there, and the seemingly endless waiting. Thus, for many people, especially the financially secure, a $6 copayment would be a relatively minor disincentive in comparison.

Another difficulty lies with defining “necessary” consultations. Many GP consultations can be summarised as “reassuring the patient”. Are these necessary or not? Helping patients understand that their symptoms can be self-managed is certainly something that does require a consultation. In teaching communication skills to medical students, we spend time emphasising the patient-centred approach — with its evidence of health benefits5 — which starts with eliciting the patient’s concerns, fears and expectations. Indeed, without first knowing and addressing these, it can be impossible to stem an ever increasing tide of future consultations and investigations.

Universal access to primary care is one of the essential aspects of our Medicare system and is one of the things that keeps the quality of Australian health care high.6 Among the GP consultations that a copayment would reduce, it is therefore important to consider how many would actually have been necessary. The opportunity for early detection of serious illness may be lost if a person delays or avoids a GP visit because of the copayment. Vulnerable groups, including children, Indigenous people, older people and the financially disadvantaged, may delay seeking treatment for serious illness — or even serious worry — with consequent health compromise. A study in the United States found that doubling primary care copayments from $7 to $14 halved the attendance of people aged 65 years or older, but more than doubled the cost of their inpatient hospital care, from $150 to $330.7

A $6 copayment would undoubtedly deter some people who should visit a GP from doing so, thereby harming them, while others who can afford to pay would be barely inconvenienced. Although a copayment might save a little money in the short term, it would impoverish us all — not just by the downstream increase in specialised health care68 and the harm done by missed serious illness and missed opportunities to properly reassure patients, but morally as well.

Pertussis control: where to now?

Improving protection against pertussis requires sorting the facts from the artefacts

Pertussis is a disease of significant morbidity and, in infants, mortality. Regrettably, even though there is greater than 20-fold reduction in pertussis burden with immunisation,1 it persists globally as a significant public health problem. For more than two decades, Australia has had the highest reported rates of pertussis in the world.2 In the 1990s, this was driven by the introduction of mandatory reporting by laboratories of positive test results for vaccine-preventable diseases to the National Notifiable Diseases Surveillance System and extensive use of serological tests for diagnosis, primarily in adults.3 Unlike many other countries, all positive test results in Australia are included in national data. Also, testing for pertussis by polymerase chain reaction (PCR) has qualified for reimbursement since 2008, after which a sevenfold increase in testing of children in general practice was documented.4 Pertussis epidemics occurred sequentially across Australia from 2008 to 2012 and, unlike previous epidemics, the highest notification rates were for children under 10 years of age. This raises the question of whether Australia’s “pertussis problem” is related to vaccines with poor effectiveness or is an artefact of testing.

Observational methods are used to measure vaccine effectiveness (VE) (also known as “field efficacy”). The screening method enables estimation of VE if the vaccination status of patients with a case of the disease and population vaccine coverage are known — the more effective the vaccine, the lower the likelihood of patients with a case of the disease having been vaccinated compared with the source population.5 The screening method performs best when about 50% of the population is vaccinated. When vaccine coverage is over 90%, estimates of VE change substantially with small changes in population coverage estimates. In this issue of the Journal, Sheridan and colleagues use the screening method to estimate VE for acellular pertussis vaccine in Queensland children during an epidemic in 2009 and 2010.6 They found that VE for three doses in children aged from 1 to < 4 years was over 80%. However, similar to studies in the United States,7,8 VE fell significantly and progressively in children over 5 years of age, whether they had received four or five doses. It was previously reported that among Queensland children born in 1998, those who had received one or more doses of whole-cell pertussis vaccine were significantly better protected than those who had received only acellular vaccine, especially after 6 years of age.9 A national study, which included Queensland data from 2009, took a different approach — cases were individually matched by birth date to children on the Australian Childhood Immunisation Register and were limited to children younger than 4 years.10 Similar VE estimates were obtained for the first 2 years of life, but, in contrast to findings from the Queensland study, there was a significant and progressive fall in VE between ages 2 years and 4 years (the latter being the age at which children were eligible for the fourth dose).

Importantly, Sheridan et al were also able to evaluate testing patterns by age, showing that the overall number of PCR tests increased in the second year of the Queensland epidemic.6 Also, in children aged over 5 years, although PCR tests were less commonly performed, the results were more commonly positive.6 This is probably due to older children with cough being less likely to present to general practice and less likely to be tested, suggesting that notification rates of pertussis would have been even higher if more testing had been done. Disease severity is also an important consideration: assessing the disease burden from pertussis cases in older children is valuable, and VE is expected to be lower for less severe illness.5 Apart from the requirement for hospitalisation, against which VE was high for children younger than 1 year3 and 1–4 years,10 few data on severity are available. In a recent New South Wales study using linked hospitalisation and pertussis notification data, it was found that only 2% of children over 5 years who had pertussis were hospitalised, but 8% had been taken to an emergency department.11

What conclusions can we draw from these studies? First, the current acellular vaccines are highly effective in preventing severe pertussis, especially in the first 2 years of life, but effectiveness progressively wanes from 2 years after the last dose. Such rapid waning was not expected when the decision to forego the 18-month booster in favour of a booster for adolescents was made in 2003. This decision was based on favourable results from modelling this change using the only available data at the time12 — data which suggested that three doses provided protection up to 7 years of age,13 which contrasts with more recent findings. Australian data showing low levels of population antibody to pertussis toxin preceding the recent epidemic support the idea that the schedule change had a negative impact.14 Second, high levels of laboratory testing inflated Australian case numbers disproportionately to other countries, through identifying more ambulatory cases in children and adults. Third, pertussis vaccine coverage has increased dramatically in Australia since the epidemic in the late 1990s, with better acceptance by parents and doctors of the acellular vaccines compared with more reactogenic whole-cell vaccines. Notably, the national epidemic from 2008 to 2012 was associated with fewer deaths than the late 1990s epidemic, despite much higher numbers of cases.

Where does the future lie for pertussis vaccines in terms of improving disease control, especially death and severe morbidity? A vaccine that effectively reduces transmission and disease is an important objective for herd immunity. In this regard, there is promise from research on live attenuated vaccines,15 and the potential for acellular vaccines with improved adjuvants and less reactogenic whole-cell vaccines, but all are some years away. Immunising mothers during the last 8 weeks of pregnancy with adult-formulated acellular pertussis vaccine could prevent early infant mortality and morbidity. Reinstalling the 18-month booster in the National Immunisation Program could improve control in early childhood, if cost-effectiveness criteria can be met. For all vaccines on the National Immunisation Program, ongoing monitoring of VE is crucial and greater use of Australia’s high-quality data systems can support this, as recommended in the National Immunisation Strategy.16

Psychotropic drug use in aged care facilities: a reflection of a systemic problem?

To the Editor: Looi and Macfarlane have raised the important matter of inappropriate psychotropic drug use in residential aged care facilities (RACFs).1 Many other problems affect care in RACFs, including:

  • lack of a comprehensive assessment of new residents, failing to address rationalisation of medications, risk assessment, advance directives and family support;

  • poor availability of medical personnel for crisis situations;

  • overdependence on locum services;

  • inappropriate transfers to acute care;

  • poor on-the-job support for staff;

  • inadequate palliative care for the
    many who die in RACFs.

Finding answers to these problems
is increasingly urgent. We face an increasing population of dependent older citizens, many requiring residential care.

Too commonly, general practitioners are not providing the care in RACFs
that is needed and is possible. We need medical practitioners prepared to specialise in this area, as happens
in the Netherlands. Further training
in psychogeriatrics and in palliative
care will be needed, and a single comprehensive diploma program similar to what is offered by the Royal Australasian College of Physicians in palliative medicine would be ideal. Then, an improved remuneration for their RACF consultations could be considered.

But the key to better care will be basing general practices in the RACFs, offering consistent availability and comprehensive care. The morale of those who work in our RACFs would improve enormously if interested and proactive medical practitioners were incorporated into RACF teams. This would stimulate support from other allied health staff and, by offering their special care within the local community, would create a community aged care hub. That will maintain communication between hospital, home and the RACF, ensure continuity of care, and it will do much towards mending many current problems, including those raised by Looi and Macfarlane.

Finally . . . an evidence-based tool to find primary health care evidence

To the Editor: If primary health care is to maximise its contributions to population-based outcomes, there must be optimal capacity to retrieve the evidence so critical to informing Australian policy and practice.1 We report a tool called the PHC (Primary Health Care) Search Filter, which retrieves the underlying corpus of relevant published literature in MEDLINE. The PHC search filter was developed using established research methods, incorporating a gold standard comparison approach.2 This useful and simple search tool offers a sophisticated mechanism for retrieving relevant documents pending the development of operational machine-based filtering.

A dual independent review of references of 10 systematic reviews commissioned by the Australian Primary Health Care Research Institute and deemed relevant to primary health care by the Expert Advisory Group (EAG) provided a gold standard set of MEDLINE-indexed articles for testing. These citations were randomly divided into three sets: the term identification set (TIS), filter development set (FDS) and filter validation set (FVS). The TIS was used to generate a list of candidate MeSH (Medical Subject Headings) and text word search terms based on frequency analyses. The highest frequency terms were individually and collectively tested for retrieval effectiveness in the FDS. The best performing search string was then tested in the FVS. This search, comprising 12 terms known as the PHC search filter, successfully retrieved 154/200 citations (77.0%) in the FVS and 415/529 citations (78.4%) from the full gold standard set.

The filter was then translated
for use in PubMed through the Primary Health Care Research
and Information Service website
(http://www.phcris.org.au) to facilitate quick, real-time and free access to relevant citations. A post-hoc relevance test of 500 items retrieved by the search filter in PubMed, dual-reviewed by the EAG, demonstrated 88.4% relevance. Testing in a mixed set of known relevant and non-relevant records could provide a further estimate of the filter’s precision and sensitivity. The PubMed version comprises the terms listed in the Box and is articulated in full in an unpublished report available on request. Readers can access the search filter at http://www.phcris.org.au/phcsearchfilter. The filter can be run alone or combined with other useful search topics such as chronic disease management, continuity of care
and heart failure.

This filter was developed to support policy and practice with respect to primary health care in Australia, and builds on earlier work in relation to palliative care as part
of the federally funded CareSearch project (http://www.caresearch. com.au). Collectively these strategies demonstrate how evidence-based approaches to finding the evidence can be implemented into online knowledge networks.

Top 12 performing search terms in the Primary Health Care Search Filter tool

Term type: MeSH

Community mental health services

Family practice

Home care services

Family physicians

Community health services

Community health nursing

Community pharmacy services

Community health workers

Preventive health services

Term type: text word

Primary care

General practi$

Primary health care


$ = truncation: a truncated search finds all terms beginning with that word stem.

Lack of appropriate imaging before breast augmentation can have serious patient consequences

Advice on preoperative imaging for different groups of women is now available

Breast augmentation has become increasingly popular in recent years, with 316 848 procedures reported in the United States in 2011.1 While there is a lack of accessible data about breast augmentation procedures in Australia, the breast surgical oncology community has ongoing concerns about the potential for breast implants to deter women from participating in appropriate symptom assessment or routine screening and to impair early detection of breast cancer.2

The situation is complicated by a lack of high-level evidence about health outcomes for women with implants who subsequently develop breast cancer. In an observational study of 129 women who had undergone breast augmentation and 3953 women who had not, those who had undergone augmentation presented more frequently with palpable lesions, invasive tumours and axillary nodal metastases, and were more likely to have a false-negative mammogram result. However, overall there was no significant difference in stage of disease, tumour size, recurrence rates or survival between the two groups.3 It was postulated that breast implants may facilitate palpation of tumours and make the breast easier to examine, explaining why lesions of the same size were more frequently palpable in patients with implants.3 This explanation fits with our clinical experience, but there are other possible reasons for the higher rates of invasive tumours and axillary nodal metastases in this group. These explanations relate to the higher likelihood of a false-negative mammogram result in women with implants who do have regular screening, and to the lower rate of screening in women with implants because of reluctance to have mammograms for fear of damaging the implants.

The discrepancy between the higher rates of invasive tumours and axillary node metastases among women who have had breast augmentation on the one hand, and a lack of significant differences in cancer staging between women with and without breast implants on the other, may be explained, in part, by methodological limitations. These include use of the χ2 test, which may not have enough power to detect trends, and lack of consideration of confounding factors, such as age. According to a systematic review of observational studies, women with breast implants who develop breast cancer have later-stage tumours at diagnosis, while meta-analysis of these studies suggested that these women may also have an increased risk of non-localised breast tumours and lower rates of breast cancer-specific survival.4 The authors noted the need for further research to clarify the impact of breast augmentation on cancer detection and prognosis.

What is clear is that patients with breast implants present specific challenges for radiologists involved in breast imaging. Breast implants are radio-opaque and restrict the visualisation of breast tissue with mammography.4 Implants can also compress breast tissue, which can limit detection of subtle findings such as architectural distortion and microcalcifications. Twenty-six experts from five countries reviewed the best available evidence and concluded in a consensus statement that preoperative breast imaging, with mammography and/or ultrasound, should be considered essential, except in rare circumstances, before any breast augmentation procedure.5 Appropriate imaging may vary depending on the woman’s age, risk factors for breast cancer, breast density and clinical examination findings, but would usually involve mammography, possibly ultrasound and sometimes magnetic resonance imaging.

Failure to provide appropriate imaging not only has serious implications for the woman herself, but also for the health system, which is left paying for expensive surgery and adjuvant therapies that may have been avoided had the cancer been detected earlier, as a recent case from our practice demonstrates (Box 1). This case highlights the serious consequences of a probable missed opportunity to diagnose breast cancer 6 months earlier, when the disease most likely would have been entirely in situ. There are two implications for clinical practice. First, thorough clinical examination and risk assessment, as well as appropriate imaging, should become a routine component of the preoperative work-up for women who undergo breast augmentation. Second, if a general practitioner is aware of a patient’s intent to undergo breast augmentation, in Australia or overseas (given the increase in medical tourism), he or she should inform the patient of the importance of preoperative screening and arrange the appropriate imaging.

As a result of such cases, Breast Surgeons of Australia and New Zealand has developed a position statement on preoperative assessment of women who undergo breast surgery, which outlines the consensus view of what imaging is appropriate for different categories of women.2 The recommendations are summarised in
Box 2.

1 Case of breast cancer in a patient with breast implants

A 46-year-old woman presented with odd sensations in her right breast 6 months after undergoing bilateral breast augmentation surgery without preoperative breast imaging.
A mammogram and ultrasound revealed a 6.5 cm area of malignant calcifications. Analysis of a core biopsy specimen showed ductal carcinoma in situ (DCIS) and the patient underwent right mastectomy and sentinel node biopsy. The final pathology report described 9 cm of high-grade DCIS with multiple small foci of oestrogen receptor-negative and human epidermal growth factor receptor 2-positive invasive breast cancer. The sentinel nodes were free of disease. After multidisciplinary consultation, we recommended chemotherapy and trastuzumab treatment, which the patient agreed to.

2 Appropriate preoperative investigations for women undergoing breast augmentation or reduction, according to age and risk status*

Clinical
examination

Mammography

Ultrasound

Magnetic resonance imaging


Age < 40 years

Average risk

Yes

Consider

Consider

No

Increased risk§

Yes

Yes

Yes

Consider

Difficult to clinically assess

Yes

Consider

Yes

No

Age ≥ 40 years

Average risk

Yes

Yes

Consider

No

Increased risk§

Yes

Yes

Yes

Consider

Difficult to clinically assess

Yes

Yes

Yes

Consider


* Reproduced with permission from Breast Surgeons of Australia and New Zealand.2 Significant clinical findings, including abnormal results of clinical examination or abnormal symptoms, require full assessment by a breast physician or breast surgeon and may require a biopsy depending on the nature of the problem. Magnetic resonance imaging is specifically indicated only if recommended by a breast specialist. It can only be claimed on Medicare for patients in Cancer Australia’s risk category 3. § Defined as significant family history (Cancer Australia risk category 2 or 3) or previous clinical history that indicates high risk (eg, prior biopsy specimens that show proliferative breast disease such as lobular carcinoma in situ, atypical ductal hyperplasia, atypical lobular hyperplasia or multiple papillomatosis). Defined as suspicious or inconclusive findings, or situations where assessment is difficult due to anatomical features such as dense breasts.

Rural general practice placements: alignment with the Australian Curriculum Framework for Junior Doctors

As part of the strategy to meet growing workforce demands in the Australian medical system, medical student numbers have been increased. In 2014, 3108 students are expected to graduate — up from 1335 in 2006.1 This growth is associated with challenges for education and training systems, including shortfalls in clinical placements and in adequate supervision for students and junior doctors. The growth also presents an opportunity to redress the current workforce maldistribution, but it is unrealistic to rely solely on a “trickle-out effect” that assumes increased numbers will lead to more medical graduates practising in traditionally underserved areas.

Consideration of alternative training settings provides an opportunity to explore socially accountable approaches in learning objectives and curricula,2,3 provision of high-quality clinical experiences in underserved populations46 and expansion of training options in rural areas. To ensure that students and junior doctors currently training are appropriately equipped to practise in a range of underserved areas, a strategic approach among educators and training institutions is required, including expanding training options in areas that are outside the traditional vocational training rotations.710

Offering general practice placements for interns is an important strategy for avoiding the expected shortfall of clinical placements and supervisors in the hospital system. While medical schools and vocational training are already providing training experiences in underserved areas such as rural sites, it is timely to investigate the option of a rural general practice placement during the intern year. Such placements must ensure that experiential learning is aligned with outcomes expected from the Australian Curriculum Framework for Junior Doctors (ACFJD). The ACFJD was designed by an experienced group of clinicians who outlined the knowledge, skills and behaviours required of junior doctors in postgraduate years 1, 2 and above. Areas covered by the framework include clinical management, professionalism, communication, skills and procedures, and clinical symptoms, problems and conditions. All clinical placements for prevocational doctors in Australia must meet the standards outlined in this framework. We have reviewed the available literature regarding skills and competencies gained by junior doctors in rural general practice placements, with particular reference to the ACFJD competencies.

Recommendations from a recent Senate report11 identified the need for a review of current literature to identify and develop a strategy to address gaps in research and knowledge affecting rural health service delivery (Recommendation 2). Although not a systematic review, our work provides a narrative review conducted in a systematic way. A recent publication12 stated that mixed methods reviews are an emerging field of research. The authors suggested that reviews in medicine using both quantitative and qualitative data should be considered within the scope of systematic reviews. Our literature review provides a starting point for documenting evidence related to rural training settings for junior doctors and the clinical skills they learn during a rural placement.

Methods

The review was undertaken in May 2011 using three different strategies. All strategies followed a similar systematic approach using the search criteria outlined in Box 1. Initially, articles published in English that reported rural placements for junior doctors were identified from the OvidSP and Scopus databases. The search terms for rural included definitions that incorporated regional centres as well as more rural and remote locations. Articles were identified by keywords, subject heading, title or abstract using criteria outlined in Box 1. Reviewers systematically worked through all the articles and then collated the relevant content under one or more core competencies outlined in the ACFJD.

A poor initial return rate meant the search was re-evaluated. Using the same criteria, we conducted a hand search of contents pages of relevant journals such as Medical Education, Academic Medicine, the Medical Journal of Australia and Australian Family Physician. Data were also sourced from reports, conference abstracts and grey literature available from government and other organisations (Box 2).

Articles reporting undergraduate and junior doctor outcomes in the same article were included, while articles reporting medical student outcomes were only included if they provided evidence of outcomes that would be transferable to junior doctors undertaking rural clinical placements. Articles were discarded if they focused on: topics outside the scope of this review; education and training needs of qualified general practitioners; general practice workforce or registrar issues, such as recruitment, retention, gender roles and training posts in rural hospitals; or undergraduate curricula or placements exclusively.

Results

The initial search strategy identified 389 articles from OvidSP, of which only two could be classified using the framework competencies, and 216 articles from Scopus, none of which were relevant to the framework. Eighty-nine papers were identified from the journals and 29 of these could be classified according to the framework competencies. Overall, 195 items were identified as potentially relevant. Of these, 36 articles and reports were included.

Publications ranged from 1997 to 2011. The highest number in any year was six in 2005. The countries most often included were Australia (17 articles or reports) and the United Kingdom (13). The most common research design used in the literature was qualitative (14 publications). This was followed by survey (9), retrospective cohort (7) and opinion piece (6). Box 3 outlines these results, and a summary of the relevant literature is shown in Appendix 1.

From these publications, we report learning outcomes for junior doctors training with rural GPs, including only documented skills and procedures. As we used data that were already in the public domain, ethics approval was not required.

Most of the literature initially identified as potentially relevant provided evidence about skills gained by medical students or vocational trainees in rural general practice placements, or the distribution of GPs in Australia, patient characteristics and reasons for encounters across a range of geographical locations. There was little published research covering the range of skills or competencies gained by junior doctors on rural clinical placements, especially non-traditional placements such as rural private general practices. The 36 articles and reports we identified as relevant focused on the advantages of junior doctor rural general practice placements for gaining advanced skills in communication and professionalism, as well as for developing autonomy in clinical management and decision making. Benefits for academic performance were also noted. Less evidence was available regarding exposure to particular clinical conditions, awareness of the impact of continuity of care, the development of specific clinical skills and the impact on later academic performance.

Advantages of rural placements

Academic performance

Academic performance covered formal assessments and supervisor reviews during clinical placements. Two reviews investigated differences in academic performance between undergraduate and postgraduate medical students undertaking rural and remote placements in the UK or United States.13,14 Neither found any difference between the academic performance of those on rural or remote placements compared with their urban colleagues. The UK review14 stated it was a myth that a general practice placement could affect career or academic performance,15 while the US review13 found two studies showing students on rural placements performed no worse than those on urban placements. Their key finding was that students on rural placements did as well as, if not better than, their urban counterparts.

In individual retrospective cohort studies from the US,16,17 Canada18,19 and Australia,20,21 findings were similar. There was no significant difference in performance between students and junior doctors training in urban settings compared with those in rural and remote settings.

Skills and procedures

A survey of ambulatory patients in an outpatient department and general practice in a remote Queensland town found that the types of patients seen in the outpatient department and private general practices were similar.22 It concluded that in remote Queensland, private general practices and outpatient departments could provide complementary placements for junior doctors.

Several studies demonstrated benefits of rural general practice placements for junior doctors. These included the opportunity to follow patients from general practice to hospital and back to general practice to experience the impact of continuity of care; development of a greater degree of autonomy, responsibility and confidence; more opportunities for procedural skills training; development of more discrimination in prescribing and requesting tests; and less tiredness due to the nature of the working day compared with hospital placements.2325 Results from the Prevocational General Practice Placements Program (PGPPP), in which junior doctors participate in a general practice placement for 10–12 weeks (including the option of general practice clinics in rural and remote locations and with Indigenous communities), were similar. Outcomes from this program have shown that junior doctors’ procedural skills, communication skills and experience of continuity of care increase.2628

Disadvantages of rural placements

A number of potential problems with general practice placements were identified. These included a greater sense of isolation from peers; extra costs associated with rural and remote placements, such as travel and cost of living; more on-call weekends than their urban counterparts; limits on the professional and physical capacity of a general practice to provide consulting rooms and supervision;24 ensuring appropriate indemnity cover; provision of suitable housing; and establishment of suitable education and support infrastructure. From an organisational perspective, issues raised included indemnity cover for junior doctors, training doctors and feeder hospitals; provision of housing to include families; and establishing education infrastructure to support junior doctors equivalent to that available for urban junior doctors.23,25

Alignment with the ACFJD competencies

We mapped the clinical skills and procedures that junior doctors are able to practise during a rural general practice placement, identified in the literature, against the five domains within the ACFJD. Results are shown in Appendix 2 and search references in Appendix 1. A number of additional skills were also identified. The findings are summarised below.

Professionalism

Professionalism competencies had the highest number of learning topics and individual items described in the literature.15,2933 All individual learning topics were covered except “Practitioner in difficulty”, and nearly 50% of ACFJD professionalism competency items were mentioned.

Communication

Communication was the next most commonly mentioned domain. A rural placement is often the first opportunity for junior doctors to deal with patients as distinct individuals rather than just focusing on their illnesses.15,2933 It has been shown that junior doctors participating in a rural placement program developed improved communication, self-assertiveness, the ability to practise preventive care and continuity of care with their patients and an increased understanding of Indigenous patients.2628

Clinical management

Compared with urban practice, the range of problems encountered in rural general practice is likely to be broader, and clinical management more comprehensive. The learning topics we identified included systems knowledge; continuity of care and enhanced understanding of the interface between primary and subsequent care; history and examination; public health, problem formulation, investigations, referral and consultation; and discharge planning.22,33

Skills and procedures

Two articles identifying skills and procedures could be mapped to the ACFJD. These covered intramuscular injections,31 endocervical swab or Pap smear, assisting in the operating theatre, surgical knots and simple wound suturing, local anaesthesia, simple skin lesion excision, mental health and ophthalmic procedures.32 A number of articles reported exposure to procedural skills generally but did not provide specific examples that could be mapped directly to the ACFJD.15,26,29,30,33

Clinical problems and conditions

Clinical problems and conditions were usually described only in general terms. Examples included seizure disorders, joint disorders, chest pain and cough,15 sexually transmitted infections,31,32 dermatological conditions, contraception, nutrition and metabolic conditions, depression, infectious diseases, domestic violence32 and addiction.32,33

A number of areas were not specifically covered by the ACFJD but were mentioned in the literature as likely learning topics covered by junior doctors in rural general practice placements. These included assisting with childbirth; providing vaccinations; primary health care in Indigenous communities; deeper understanding of health and illness; otitis media and otitis externa; the lymphatic system and enlarged nodes; men’s health; medication and recognition of side effects and interactions; treating patients in context — both rural and Indigenous; and capacity for personal and professional growth.

Discussion

The available literature highlights the benefits of general practice placements for junior doctors in terms of developing professionalism, building rapport and communication skills with patients, and gaining an understanding of patients in context. The opportunity to develop clinical responsibility and professional identity was reported, and resulted in a strong sense of satisfaction. Some articles reflected opportunities to practise clinical or procedural skills in rural general practice settings and highlighted the importance of these placements in understanding the interface between primary care and secondary or tertiary care systems.

While our review has identified rural general practice placements for junior doctors as excellent training opportunities aligned with many of the ACFJD competencies, there is a lack of credible research evidence identifying and documenting specific clinical skills and procedures. Much of this review relies on professional experience in reports and other non-peer-reviewed documents. It is likely that there is some underreporting of clinical rural general practice experiences, and the results reported may not be generalisable to all rural general practice placements. However, this strengthens the argument for more robust research into the educational value of internship posts in these settings at this point of the medical education continuum, and the barriers to creating them.

While relatively little research has been published confirming the value of non-urban general practice settings for intern and junior doctor learning, particularly against the competencies identified in the ACFJD, there is evidence of high-quality learning experiences and outcomes for placements in community and non-urban locations at the undergraduate medical student level and at vocational training level.21,22 There is also evidence of a wide range of clinical conditions managed, patient demographics and investigations occurring in rural general practices when compared with urban practices.34,35

Rural general practice placements have the potential to be as beneficial for junior doctors as hospital placements, and provide complementary learning experiences.10 As increasing numbers of medical graduates enter the health system, alternative placements to tertiary hospitals are required to provide high-quality clinical training while developing the aptitude, interest and skills of junior doctors for subsequent practice in areas of high unmet need.9

Many of the competencies identified in the ACFJD should be achievable in rural general practice placements, contingent on adequate supervision and mentoring. However, the placement must be of similar quality to more traditional placements, with facilities available for junior doctors to consult, learn, study and seek advice. Building the capacity of a small number of distributed teaching sites as teaching centres of excellence, resourced with adequate preceptor training and support, may be one way of furthering this agenda.35 Implementation of a rural general practice placement during the intern year is an important strategy for ameliorating expected training pressures in the health system while broadening the range of experiences available to junior doctors.

1 Search criteria

Criteria

Search terms


Training level

Junior doctor, intern, post graduate year (PGY) 1,2

Specialty of general practice

General practitioner, family physician, rural doctor/specialist

Location

Australian Standard Geographical Classification-Remoteness Areas 2–5 (inner regional, outer regional, remote, very remote)

Rural, Remote Metropolitan Areas 3–7 (rural classifications, Rural 1–3; remote classifications, Remote 1–2)

United States, United Kingdom, Canada, New Zealand, South Africa

Time period

1997–2011

2 Data sources for search

Source

Organisations


Australian Government

Health Workforce Australia, Australian Institute of Health and Welfare, National Health Workforce Taskforce

State and territory governments

General practice training providers

Peak bodies

Australian College of Rural and Remote Medicine, Royal Australian College of General Practitioners, Rural Doctors Association of Australia, Confederation of Postgraduate Medical Education Councils, Australian General Practice Training program

Non-Australian organisations

United Kingdom General Medical Council, Royal College of Physicians and Surgeons of Canada, World Organisation of Family Doctors (WONCA)

Reference lists

Material discovered when reading articles, reports and other literature

3 Literature summary

Number

Year


1997

1

1999

2

2000

2

2001

3

2002

3

2003

4

2004

3

2005

6

2006

3

2007

2

2008

2

2009

2

2010

1

2011

2

Total

36

Country

Australia

17

Canada

4

Denmark

1

Ireland

2

United Kingdom

13

United States

3

Total

40

Research design

Randomised crossover

1

Retrospective cohort

7

Survey

9

Qualitative

14

Review

3

Descriptive

1

Opinion

6

Total

41*


* Five articles that fitted into two categories (four qualitative/surveys and one opinion/survey) are counted twice.