×

Respiratory tract infections among children younger than 5 years: current management in Australian general practice

Acute respiratory tract infections (RTIs) are managed at more than 6 million general practice visits each year in Australia.1 RTIs such as the common cold (acute upper respiratory tract infection [URTI]), acute bronchitis/bronchiolitis, acute tonsillitis and pneumonia create a severe health and economic burden.1 They are most prevalent among young children, especially when they attend preschools or day care centres. It is estimated that children younger than 5 years have a cold 23% of the time,2 with 70% of the costs attributed to carers’ lost time at work.3

Current guidelines on the treatment and management of RTIs in children include supportive management such as hydration and rest.4 Over-the-counter (OTC) medications such as analgesics and cough medications may reduce the severity of symptoms, but they do not cure or prevent the illness.

As most RTIs are caused by viruses, antibiotics have limited therapeutic value and should only be prescribed if an RTI is suspected to be bacterial in origin. However, overseas studies suggest high rates of antibiotic prescribing for RTIs among young children.5,6 Contributing factors include physicians’ diagnostic uncertainty, parents’ expectation of receiving antibiotics and physicians’ perception of parents’ satisfaction with the visit.7,8

The current management of RTIs among children in Australia, especially in general practice, is unclear. Much of the published data about the management of this cohort originated from the United Kingdom,9 Canada,5 and the United States.10,11 Therefore, we aimed to explore the current management of RTIs in children under the age of 5 years in Australian general practice using data from the Bettering the Evaluation and Care of Health (BEACH) program.

Methods

We analysed BEACH data collected from April 2007 to March 2012 inclusive. BEACH methods are described elsewhere in detail;12 however, in summary, BEACH is a continuous, paper-based, national study of general practitioner activity in Australia. Every year, as part of a rolling random sample of 1000 GPs, each GP provides information on 100 consecutive GP–patient encounters with consenting, unidentified patients. BEACH collects GP characteristics and, for each encounter: patient characteristics, reasons for encounter, number of problems managed and clinical actions initiated.13,14 Clinical actions may include medication, referral, pathology testing, and non-pharmacological treatment (eg, counselling, giving advice, education or minor surgery). The BEACH program is approved by the University of Sydney Human Research Ethics Committee.

BEACH study statistical analyses in SAS 9.3 (SAS Institute) are adjusted for clustering of encounters around each GP. Statistically significant differences are determined by non-overlapping 95% confidence intervals, equivalent to P < 0.006.

For this study, we identified all GP encounters with patients younger than 5 years (60 months) at the date of encounter. We analysed those encounters where at least one of the following four RTIs (by International Classification of Primary Care, second edition [ICPC-2] code) was recorded as problem managed:

  • upper respiratory infection, acute (“URTI”) [R74];
  • bronchitis/bronchiolitis, acute (“bronchitis”) [R78];
  • tonsillitis, acute (“tonsillitis”) [R76]; and
  • pneumonia [R81].

These RTIs were selected on the basis of their frequency and importance in general practice paediatric management.

The management rate of each of these four RTIs per 100 paediatric encounters was compared in terms of: season (summer [December–February] v winter [June–August]); GP sex; and GP age group (≥ 55 years v < 55 years).

We further examined the use and rate (per 100 of each specified RTI) of six management (“clinical action”) options:

  • antibiotic medications;
  • prescribed or supplied non-antibiotic medications;
  • medications advised for OTC purchase;
  • referrals (to specialists and/or allied health professionals);
  • pathology testing; and
  • counselling (including advice/education) at the encounter.

Results

From April 2007 to March 2012, there were 31 295 encounters (involving 4522 GPs) with children younger than 5 years. Of these children, 53.4% were boys, and 31.1% were aged under 1 year. One or more respiratory infections (ICPC-2 codes R71–R83) were managed at 9261 encounters — 29.6% (95% CI, 28.9%–30.3%) of these GP paediatric encounters.

Of these encounters, at least one of URTI, bronchitis or tonsillitis was recorded at 86.0% (results not shown), and at least one of URTI, bronchitis, tonsillitis or pneumonia was recorded at 88.1%. One or more of these four specified RTIs were managed at 8157 encounters, equating to 26.1% (95% CI, 25.4%–26.7%) of all GP paediatric encounters.

Box 1 presents patient demographics of all paediatric encounters and of those involving at least one of these four specified RTIs. For encounters where at least one of the four specified RTIs was recorded, there was a smaller proportion of patients in the < 1 year and a greater proportion in the 1 to < 4 years age groups and fewer patients new to the practice compared with all paediatric encounters. The characteristics of the two groups were otherwise similar.

The management rate (per 100 paediatric encounters) of each of the four specified RTIs (and the combined total) is shown in Box 2. For all four specified RTIs combined, the management rate was higher among older GPs (≥ 55 years) than among younger, higher among male GPs than female, and higher in winter than summer. URTI was the most frequently managed respiratory infection (18.6), followed by bronchitis (4.2), tonsillitis (2.7) and pneumonia (0.6). The problem management rates of URTI, bronchitis and pneumonia were significantly higher in winter than in summer.

The management rate of URTI and bronchitis was significantly higher among male GPs than among female GPs (Box 2). The rate of tonsillitis management was higher among older GPs than younger GPs (Box 2). There was no significant seasonal difference in the rate at which each management option (“clinical action”) was recorded for each of the specified RTI problems (results not shown).

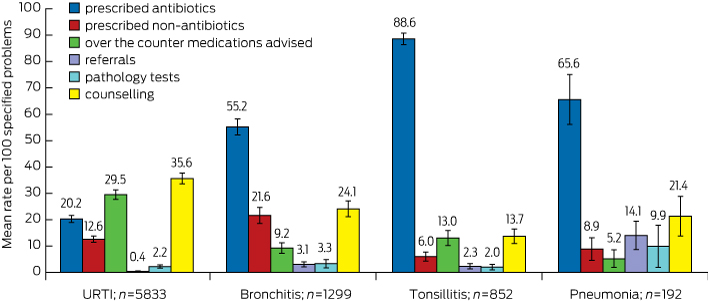
Box 3 illustrates the mean rate of management options recorded per 100 of each of the four specified RTI problems. The antibiotic prescribing rate for the management of tonsillitis (88.6), was statistically significantly higher than that for pneumonia (65.6), bronchitis (55.2) and URTI (20.2). URTI had the highest rate of OTC medications advised (29.5), compared with tonsillitis (13.0), bronchitis (9.2) and pneumonia (5.2). URTI also had the highest rate of counselling/advice/education (35.6), compared with bronchitis (24.1), pneumonia (21.4) and tonsillitis (13.7). The highest rate of prescribing non-antibiotic medications was for bronchitis (21.6). The highest rate of referrals given (14.1) and pathology tests ordered (9.9) were for pneumonia.

The rate of antibiotic prescribing per 100 URTI problems was higher among male GPs (22.5; 95% CI, 20.6–24.3) than female GPs (17.2; 95% CI, 15.3–19.1) and similarly for prescribed non-antibiotic medication per 100 URTI problems (14.0; 95% CI, 12.3–15.7 v 10.7; 95% CI, 9.1–12.3). The rate of pathology tests ordered per 100 tonsillitis problems was significantly higher among female GPs than among male GPs (3.9; 95% CI, 1.6–6.3 v 0.6 95% CI, 0.0–1.3). The rate of counselling/advice/education per 100 bronchitis problems was significantly higher among female GPs than among male GPs (31.2; 95% CI, 25.9–36.5 v 19.1; 95% CI, 15.7–22.5). No other significant differences were found on this GP sex comparison analysis.

The rate of antibiotic prescribing per 100 URTI problems was significantly higher among older GPs (≥ 55 years) than younger GPs (25.4; 95% CI, 22.8–28.0 v 18.0; 95% CI, 16.4–19.5). The rate of counselling/advice/education per 100 URTI problems was significantly higher among younger GPs than older GPs (38.1; 95% CI, 35.5–40.6 v 30.2; 95% CI, 26.4–33.9). The rate of advising OTC medications per 100 tonsillitis problems was significantly higher among younger GPs than among older GPs (16.2; 95% CI, 12.3–20.0 v 8.0; 95% CI, 4.1–12.0). No other significant differences were found on this GP age group comparison analysis.

Discussion

Our study provided insight into the current management of selected respiratory infections in children younger than 5 years by GPs in Australia.

Our study found that URTI was the most common RTI managed by GPs in this age group. This finding is similar to those reported from Australia, Malaysia and the UK.1,15,16 Studies have shown that parental decisions to consult for a young child with the common cold are influenced by the age of the child, type of symptoms, parents’ education level and their perception of the severity of the symptoms.17 Whereas 60% of parents would visit a GP if their child had a cold,11 parents from a lower income group were 1.5 times more likely to seek advice from health services.18

Despite our analyses showing URTI having the lowest antibiotic prescription rate of the four specified RTIs, guidelines suggest this is beyond clinical requirement. Nonetheless, this result compared favourably with overseas studies,6,19,20 where the reported antibiotic prescription rate for URTI was as high as 42%.6 Similarly, those studies reported the antibiotic prescription rate for bronchitis to be as high as 86%.6,19

Several studies have suggested reasons why antibiotics might be prescribed unnecessarily for (non-bacterial) RTIs.7,15,18,19,21 These include diagnostic uncertainty in children,7 possibly poor medical knowledge of respiratory infections,21 physicians’ perception of parental satisfaction,8 and parents’ misconceptions and expectations regarding the treatment of RTIs, especially the perceived benefits of antibiotics.7,10,11,18 Some of these studies have recommended education about RTIs and antibiotics for parents and carers,10,15 and for physicians to aid decision making and optimal management.22

While URTIs had the lowest antibiotic prescription rate of the four RTIs in our study, they have the highest rate of OTC medications advised. Although physicians, researchers and paediatricians agree that common cold treatments and remedies do not reduce illness duration and offer little benefit,23 GPs might still advise OTC medications (rather than prescribe antibiotics) to address some parents’ expectations that medication will cure the common cold.

For each of the four RTIs, we found that the rate of pathology tests ordered was lower than the rate of antibiotic prescribing. Possible reasons for this include the technical difficulty of pathogen identification in RTIs; the invasive nature of throat swabs in young children; the cost; and the likelihood that management would not be altered by the microbiological results, which are often delayed.22,24,25

There were differences in the management of paediatric RTIs by GP age and sex; male GPs prescribed medication (antibiotics and non-antibiotics) for URTI significantly more frequently than female GPs, and were less likely to provide counselling and education for bronchitis than female GPs. Older GPs prescribed antibiotics for URTI more frequently, but were less likely to provide counselling/advice/education for URTI than younger GPs.

In our study, antibiotic prescribing rates for URTI, bronchitis and tonsillitis were higher than recommended by the current Therapeutic guidelines.4 However, our study was limited by a lack of data on patient comorbidities, which could have influenced GPs’ diagnostic and management decisions. Similarly, the practice of “wait and see” before filling antibiotic prescriptions or buying OTC medications was not recorded, leading to possible overreporting of prescribed and OTC medications.

Nevertheless, the rigour of BEACH data has been well established, and this study gives a detailed estimate of the frequency of and management options for specified paediatric RTIs. Our results open several promising avenues for further research into parents’ and health professionals’ attitudes and practices regarding antibiotic prescribing and OTC medications for managing RTIs in young children. Better understanding of these factors will help maintain favourable management practices.

1 Demographics of general practice patients younger than 5 years, overall and with respiratory infections, 2007–2012


All patients (n = 31 295)


Patients with at least one of the four specified respiratory tract infections* (n = 8157)


Demographics

No.

% (95% CI)

No.

% (95% CI)


Sex


Male

16 548

53.4% (52.7%–54.0%)

4319

53.3% (52.2%–54.4%)

Female

14 468

46.6% (46.0%–47.3%)

3782

46.7% (45.6%–47.8%)

Missing data

279


56


Age group in years


< 1

9730

31.1% (30.4%–31.8%)

2056

25.2% (24.2%–26.2%)

1 to < 2

8053

25.7% (25.2%–26.3%)

2233

27.4% (26.4%–28.4%)

2 to < 3

4917

15.7% (15.3%–16.2%)

1559

19.1% (18.2%–20.0%)

3 to < 4

4240

13.5% (13.1%–14.0%)

1251

15.3% (14.5%–16.1%)

4 to < 5

4355

13.9% (13.5%–14.3%)

1058

13.0% (12.2%–13.7%)

Missing data

0


0


Indigenous status


Aboriginal and/or Torres Strait Islander

699

2.5% (2.1%–2.9%)

160

2.2% (1.7%–2.7%)

Non-Indigenous

27 153

97.5% (97.1%–97.9%)

7121

97.8% (97.3%–98.3%)

Missing data

3443


876


HCC status


HCC

7380

25.9% (24.8%–27.0%)

2042

27.4% (25.9%–28.9%)

No HCC

21 116

74.1% (73.0%–75.2%)

5416

72.6% (71.1%–74.1%)

Missing data

2799


699


Practice status


New to practice

4754

15.4% (14.7%–16.0%)

1051

13.0% (12.1%–14.0%)

Seen previously

26 199

84.6% (84.0%–85.3%)

7012

87.0% (86.0%–87.9%)

Missing data

342


94


HCC = Health Care Card. * Acute upper respiratory tract infection, acute bronchitis/bronchiolitis, acute tonsillitis and pneumonia. † Missing data were removed from calculations.


2 Respiratory problems among children younger than 5 years per 100 encounters, by general practitioner age and sex, and by season, for the four specified respiratory tract infections, 2007–2012


No. of encounters with patients < 5 years

Problems managed per 100 encounters (95% CI)


URTI

Bronchitis

Tonsillitis

Pneumonia

Total


Total

31 295

18.64 (18.05–19.23)

4.15 (3.89–4.42)

2.72 (2.51–2.93)

0.61 (0.51–0.71)

26.13 (25.48–26.78)

GP age group in years*

< 55

21 947

18.51 (17.82–19.20)

3.96 (3.65–4.27)

2.42 (2.19–2.66)

0.61 (0.49–0.73)

25.51 (24.76–26.25)

≥ 55

9195

18.99 (17.84–20.14)

4.64 (4.12–5.17)

3.39 (2.96–3.83)

0.62 (0.43–0.81)

27.65 (26.34–28.96)

GP sex


Female

14 410

16.99 (16.18–17.80)

3.71 (3.34–4.09)

2.46 (2.17–2.76)

0.73 (0.56–0.90)

23.89 (22.97–24.81)

Male

16 885

20.05 (19.20–20.90)

4.52 (4.16–4.89)

2.94 (2.65–3.24)

0.52 (0.40–0.63)

28.03 (27.12–28.94)

Season of consultation

Summer

6571

14.35 (13.22–15.48)

2.48 (2.08–2.88)

2.71 (2.24–3.18)

0.41 (0.23–0.59)

19.95 (18.71–21.19)

Winter

8636

21.86 (20.60–23.12)

5.33 (4.72–5.93)

2.84 (2.43–3.25)

0.88 (0.65–1.11)

30.91 (29.47–32.34)


URTI = upper respiratory tract infection. Summer = December–February. Winter = June–August. * Age was missing for 153 GPs; their data were removed from calculations.


3 Mean rate (95% CI) of treatment options recorded per 100 specified respiratory problems treated in general practice among children younger than 5 years, 2007–2012


URTI = upper respiratory tract infection.

A bowel cancer screening plan at last

To the Editor: The National Bowel Cancer Screening Program (NBCSP) sees general practitioners as “critical partners”,1 but has not really involved or supported GPs, who have personal frequent contact with a large proportion of the NBCSP’s target population. GP endorsement increases uptake,2,3 but the NBCSP does not fund GPs to send reminder letters to their patients.

The NBCSP informs GPs about who has used a faecal occult blood test (FOBT) kit and returned samples, but it sends these reports on paper, which creates extra work of scanning results into patients’ electronic clinical records and, more importantly, prevents GPs’ clinical software from automatically generating appropriate reminders. Automated reminders can be displayed onscreen to GPs during consultations, and now can also be given to patients when they arrive for consultations, as printed prevention summaries based on current data in the patient’s electronic clinical record.4,5

Uptake of bowel cancer screening is likely to be greater if general practice is a true partner in the process, as occurs in the cervical screening program. Following this model, the NBCSP would perform a back-up function to notify the person’s usual GP or usual general practice if an FOBT result has not been received within 3 to 6 months of it becoming due. We concur with the statement: “it will become increasingly important to consult closely with the primary care sector and provide support to GPs to facilitate their role in the expanded NBCSP”. General practice must be made more central in the NBCSP for it to succeed.

Better access to mental health care and the failure of the Medicare principle of universality

Australia’s national health insurance scheme, Medicare (introduced in 1975 as Medibank), was envisioned to deliver the “most equitable and efficient means of providing health insurance coverage for all Australians”.1 Questions have been raised as to whether, 40 years after its introduction, Medicare is equitable, particularly in terms of access to mental health services.2,3 Investigations over more than 70 years in various parts of the world, including Australia, have consistently found greater levels of psychiatric disorder in areas with greater socioeconomic disadvantage.46

In November 2006, the Australian Government introduced the Better Access to Mental Health Care initiative (Better Access), consisting of new Medicare Benefits Schedule (MBS) items to improve access to psychiatrists, psychologists and general practitioners.7 Evaluation of the program, supported by Commonwealth government funding, highlighted the success of Better Access in increasing psychological service use. For example, the number of allied mental health services accessed almost doubled in the first year, and most users were new (68% in 2008 and 57% in 2009).8,9 The report by Harris and colleagues also commented: “Uptake rates for Psychological Therapy Services items … decreased as levels of socio-economic disadvantage increased”.8 Findings from Bettering the Evaluation and Care of Health data also suggested possible inequity, with less service provision going to more disadvantaged areas.3

Another concern is whether Better Access is reaching rural and remote communities as well as the metropolitan areas.3,10,11 Here, a primary driver may be provider availability, as the problem of securing specialist health care and other service delivery to non-metropolitan areas of Australia is well recognised.11

We obtained Medicare data on the Better Access program and related mental health care items, following a freedom of information request by one of the authors (R G) on behalf of Transforming Australia’s Mental Health Service Systems.

We aimed to determine whether adult use of mental health services subsidised by Medicare varies by measures of socioeconomic and geographic disadvantage. We hypothesised that services would be particularly inequitable where delivered by mental health professionals with higher gap payments. We conjectured that services provided by GPs, general psychologists and allied health practitioners would be relatively equitable, while services generally provided by psychiatrists and clinical psychologists would be less equitably delivered. We focused separately on item 291 (GP mental health care plan preparation by a psychiatrist), hypothesising that this item might differ in pattern from other psychiatry items.

Methods

We performed a secondary analysis of national Medicare data from 1 July 2007 to 30 June 2011. Data included all mental health services subsidised by Better Access and Medicare. Providers included GPs, psychiatrists, clinical psychologists and allied mental health practitioners.

Main outcome measures were service use rates and equity measures of concentration indexes and curves.

Data and linkage to area characteristics

Data included MBS items with associated postcode data but without other identifying information. The total number of services across all 4 years was 25 146 558. Unique records of data (consisting of unique sets of item number, consumer postcode and financial year) were suppressed to ensure confidentiality if the total of services in an area was less than 20. Based on the number of suppressed records, we estimated that a maximum of 3 084 023 service contacts could have been censored. However, the actual number of suppressed service contacts was likely to be about half this figure, and is unlikely to have caused any significant bias in analyses.

We grouped MBS items into the following categories (specific item numbers are available in Appendix 1 and Box 1):

  • GP mental health services created or significantly altered by Better Access;
  • consultant psychiatry items created or significantly altered by Better Access;
  • psychiatrist services in rooms. (CP+);
  • creation of a shared care plan by a psychiatrist (item 291);
  • psychological therapy services provided by a clinical psychologist; and
  • focused psychological strategies — allied mental health items:
    • general psychologist services;
    • occupational therapist services; and
    • social worker services.

Consumer residential postcodes were linked to area characteristics available from public census information from the Australian Bureau of Statistics. These characteristics were remoteness area category12 and Socio-Economic Indexes for Areas (SEIFA).13 If a postcode had been assigned to more than one remoteness category, then it was allocated to the remoteness category having the greatest proportion of the population in that postcode. The SEIFA measures were the Index of Relative Socio-Economic Advantage and Disadvantage, Index of Relative Socio-Economic Disadvantage, Index of Education and Occupation, and the Index of Economic Resources.

Local implications

Variations within closely located yet differing socioeconomic status regions were examined by looking at four local government areas in major capital cities. We chose two regions ranked in the top decile for socioeconomic advantage (City of Bayside in Melbourne and North Sydney Council in Sydney) and two regions from disadvantaged areas (City of Greater Dandenong in Melbourne and City of Blacktown in Sydney).14 Postcode areas bounded entirely within each catchment were used in the service rate calculations.

Statistical analysis

To measure inequity, we plotted concentration curves and determined concentration indexes.15 Concentration indexes lie between − 1 and + 1. Negative indexes and curves above the 45° equity line represented greater usage in lower socioeconomic regions. Positive concentration indexes corresponded to curves below the equity line, and represented greater usage in higher socioeconomic regions.

We followed a convention of using an index threshold of 0.2 (or − 0.2) as indicating a high level of inequality;16,17 an index of 0.2 would result from the richest half of the population accessing 50% more services than the poorest half. For further details on our statistical methods, see Appendix 2.15,16,18

The equity line, derived from raw population rates, may underestimate need in deprived areas if greater needs are associated with lower socioeconomic status. However, in the absence of accurate and contemporary information on such associations, we did not adjust for this influence. Hence, where the curve was below the line and the index was positive, provision was judged inequitable. Where the curve was above the line and the index was negative, the finding was more suggestive but not conclusive of equitable delivery.

SEIFA

Of the four SEIFA variables, the Index of Relative Socio-Economic Advantage and Disadvantage was preferred for these analyses based on performance in calculating concentration indexes most consistently representative in direction and magnitude of values from the other indexes.

Ethics approval

Monash University Human Research Ethics Committee reviewed the study protocol and granted an exemption from ethics review because the non-identifiable data satisfied the requirements of the National Statement on Ethical Conduct in Human Research.

Results

Data were associated with 98.6% of Australian postcodes. Activity rates by year and postcode characteristics are shown in Box 2 (for absolute numbers, see Appendix 3). Most rates almost doubled across the 4 years, whereas consultant psychiatrist items predating Better Access (CP+) did not increase. Increasing remoteness was consistently associated with lower activity rates. Strong trends indicated higher use rates in less socioeconomically disadvantaged areas for most consultant psychiatry items and for clinical psychologist services; trends for other items were typically less marked.

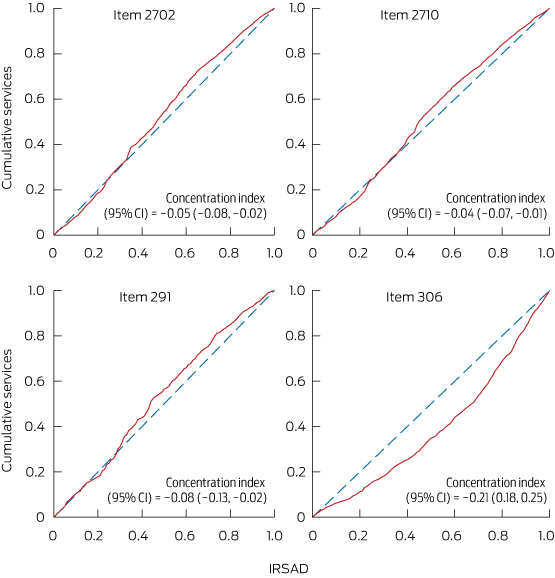
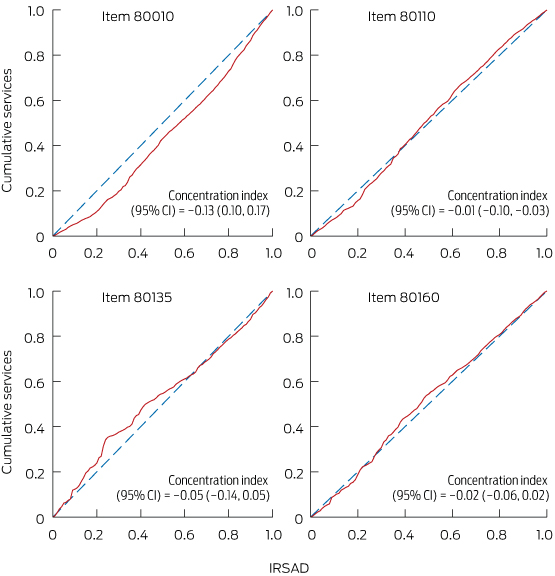
Concentration curves are presented in Box 3 and Box 4; note that the scale (and hence the derived index) represents the population, not postcodes as in Box 2 and Appendix 3, so the pattern of results differs slightly. For key medical items shown in Box 3, the trend could be compatible with equity for items provided by GPs and for item 291. For item 306 (consultant psychiatry, 45–75 minutes), the poorest 20% of the population used about 10% of these services, while the richest 20% used over 30% (ie, more than three times the use rate). Concentration curves for key psychology and allied health items are presented in Box 4, which shows inequity for item 80010 (clinical psychology). The poorest 20% of the population by area characteristics used about 10% of these services, while the richest 20% used over 25% (ie, more than 2.5 times the use rate).

Concentration indexes for individual items are presented in Box 1. Significant negative index values were found for GP and allied health items. For reasons given earlier, related to population need, our findings suggested but do not confirm equity; area-based rates (Box 2) suggested some inequity for GP and allied health items, although less than for longer and widely used items from psychiatrists and clinical psychologists. Also of note, there were a number of index values for consultant psychiatry items with magnitude above 0.2, showing high inequity in favour of more advantaged areas. Negative indexes below − 0.2 were most common for focused psychological strategy items serviced by general psychologists, occupational therapists and social workers. Compared with psychiatrist and clinical psychologist services, these allied health services demonstrated better provision in disadvantaged areas.

Our examination of specific areas illustrates the differences that might be found in local planning exercises. We drew on examples from within the two largest Australian capital cities (Appendix 4). In Melbourne, the Dandenong area has high socioeconomic disadvantage, while the Bayside area is at the opposite extreme. However, it was the Bayside area that had much higher service use rates, with the exception of item 291, even though illness rates are likely to be much higher in Dandenong. In Sydney, there was a similar pattern of higher service activity in the North Sydney Council area compared with the more disadvantaged Blacktown area, although higher activity in Blacktown for GP items was an important exception.

Discussion

Our findings confirm previous findings19 of inequity in services provided by psychiatrists. Better Access activity rates are typically greater in more advantaged areas. There is variability between provider disciplines and items; within Better Access, this association is most strongly observed with high-volume clinical psychology services. Activity rates for Better Access and related mental health care MBS items decline with increasing remoteness across all types, reinforcing findings from previous work.8,9,20

Examination of the latest national survey did not suggest that areas of higher socioeconomic status were characterised by high use rates of Better Access items among people without disorders,7 but this may not be how inequity manifests. Rather, among people with comparable levels of diagnosable mental health problems, it may be easier for the socioeconomically advantaged to pass through the filters to specialist care.21 In other words, the criteria for stepping up a level of care may be different, and the disadvantaged may need higher levels of distress or disturbance to secure entry to care.

These results are consistent with a multitier system, where people living in more disadvantaged and more rural areas will typically receive a service model in response to mental health needs that is characterised by lower volumes of services, provided possibly by less highly trained providers. Item 291 is something of an exception among Better Access items but at a very low absolute rate.

Medicare provision through Better Access does not then conform to the kind of equitable delivery that would merit characterisation as universality. While we are not offering specific solutions to such a complex issue, we note that our key hypotheses were formulated with consideration of the likely influence of copayments as a disincentive and structural deterrence to accessing care. These findings would be compatible with a situation in which higher-paid professionals practise in areas closer to home, and where this spatial distribution aligns with direct considerations of affordability, it reduces access by people from more disadvantaged areas.

Our study has some limitations. The Medicare data do not take into account the Access to Allied Psychological Services initiative or the public mental health services provided by states and territories. Including these would require further data sources and analyses.22 Regarding funding models to public mental health services in Australia’s most populated states, Victorian public mental health services adopted transparent resource distribution processes in the late 1990s,23 including a correction to state funding based on level of private activity. In New South Wales, a special commission of enquiry recommended introducing a resource distribution formula to take into account socioeconomic factors and substitutable private services; however, this has not yet happened.24

Our data span financial years 2007–08 to 2010–11; changes to the scheme from late 201125 may have led to some changes in usage.

Without controlling for area-based need disparities,5,22 it seems most likely that our analyses may have underestimated rather than overestimated inequity.

Our findings, confirming previously demonstrated inequity in private psychiatric service activity, show that the Better Access initiative is not providing universality or consistent equity of delivery in mental health care. We hope that the findings may contribute to debate and discussion around policy incentives and strategies that work towards universal and equitable delivery of mental health care for all Australians.

1 Concentration index calculated using Index of Relative Socio-Economic Advantage and Disadvantage ranking for areas and national Medicare data, 1 July 2007 to 30 June 2011

Provider group

Consultation time (min)

Item no.

No. of patients

Concentration index* (95% CI)


General practitioner

Not timed

2702

317 117

− 0.05 (− 0.08, − 0.02)


Not timed

2710

2 181 945

− 0.04 (− 0.07, − 0.01)


Not timed

2712

930 248

− 0.03 (− 0.06, − 0.001)


> 20

2713

3 019 386

− 0.08 (− 0.11, − 0.05)

Consultant psychiatry

> 45

291

22 258

− 0.08 (− 0.13, − 0.02)


30–45

293

963

− 0.18 (− 0.34, − 0.02)


> 45

296

303 240

0.03 (− 0.01, 0.06)


> 45

297

14 499

0 (− 0.07, 0.07)


> 45

299

285

0.34 (0.01, 0.7)


< 15

300

126 179

− 0.13 (− 0.23, − 0.03)


15–30

302

944 908

− 0.07 (− 0.14, − 0.002)


30–45

304

1 871 116

0.04 (0.002, 0.08)


45–75

306

2 572 228

0.21 (0.18, 0.25)


> 75

308

111 875

0.05 (− 0.01, 0.10)


< 15

310

0

na


15–30

312

210

− 0.20 (− 0.29, − 0.12)


30–45

314

1430

0.10 (− 0.07, 0.26)


45–75

316

62 523

0.22 (0.15, 0.28)


> 75

318

906

0.08 (− 0.04, 0.20)


> 45

319

264 437

0.22 (0.15, 0.28)

Psychological therapy services


Clinical psychologist

30–50

80000

39 262

− 0.07 (− 0.15, 0.01)


30–50

80005

1535

− 0.07 (− 0.31, 0.18)


> 50

80010

3 754 815

0.13 (0.10, 0.17)


> 50

80015

24 882

− 0.08 (− 0.15, 0)


> 60

80020

14 436

− 0.07 (− 0.27, 0.13)

Focused psychological strategies


General psychologist

20–50

80100

108 723

− 0.26 (− 0.33, − 0.18)


20–50

80105

9027

− 0.26 (− 0.42, − 0.10)


> 50

80110

6 325 499

− 0.01 (− 0.04, 0.03)


> 50

80115

194 844

− 0.14 (− 0.20, − 0.08)


> 60

80120

25 819

− 0.02 (− 0.08, 0.04)

Occupational therapist

20–50

80125

4236

− 0.20 (− 0.33, − 0.08)


20–50

80130

849

− 0.08 (− 0.22, 0.06)


> 50

80135

72 607

− 0.05 (− 0.14, 0.05)


> 50

80140

7326

− 0.06 (− 0.16, 0.04)


> 60

80145

422

− 0.11 (− 0.24, 0.03)

Social worker

20–50

80150

3850

− 0.04 (− 0.19, 0.12)


20–50

80155

2228

− 0.14 (− 0.43, 0.15)


> 50

80160

472 353

− 0.02 (− 0.06, 0.02)


> 50

80165

25 211

− 0.15 (− 0.23, − 0.07)


> 60

80170

331

− 0.25 (− 0.44, − 0.07)


* A positive concentration index indicates inequality of service use in favour of advantaged regions. † Concentration curve with significant areas on either side of equity line.

2 Medicare-subsidised mental health and related services: use rates per 1000 population per year, 1 July 2007 to 30 June 2011


FPS


Variable

Population

GP

CP

CP-291

CP+

PTS

Total

FPS-GenP

FPS-OT

FPS-SW


No. of MBS items


6 448 696

341 245

22 258

6 297 057

3 834 930

7 253 325

6 663 912

85 440

503 973

Use rate


Financial year


2007–08

21 249 199

55

4

0.1

74

30

60

56

0.5

3

2008–09

21 691 653

71

4

0.2

72

41

77

72

0.8

5

2009–10

22 031 750

79

4

0.3

71

48

92

84

1.2

7

2010–11

22 340 024

90

4

0.4

71

56

102

93

1.4

8

Region*


Major cities

15 104 517

79

5

0.3

92

52

92

85

1.2

6

Inner regional

3 991 501

76

3

0.3

37

32

81

74

0.6

6

Outer regional

1 897 121

50

1

0.2

13

14

46

42

0.7

4

Remote

267 159

25

0

0.0

4

5

11

10

0.0

1

Very remote

177 561

8

0

0.0

2

2

5

5

0.0

0

Socioeconomic disadvantage*†


Quintile 5

5 900 995

74

6

0.1

117

68

95

86

1.5

7

Quintile 4

4 480 536

74

4

0.3

74

44

88

82

0.7

5

Quintile 3

4 298 715

78

3

0.3

55

40

83

77

0.9

6

Quintile 2

3 508 187

77

3

0.4

44

29

76

70

0.9

5

Quintile 1

3 249 398

69

3

0.3

45

23

69

63

0.7

5


MBS = Medicare Benefits Schedule. GP = general practitioner mental health services created or significantly altered by Better Access to Mental Health Care services. CP = consultant psychiatry items created or significantly altered by Better Access. CP-291 = initial assessment for a GP shared care plan by a psychiatrist (MBS item no. 291). CP+ = all/most psychiatry items. PTS = psychological therapy provided by a clinical psychologist. FPS = focused psychological strategies: allied health items; GenP = general psychological services; OT = occupational therapy services; SW = social worker services. * Mean, 2007–2011. † Ranked by Index of Relative Socio-Economic Advantage and Disadvantage; quintile 1 = most disadvantaged.

3 Concentration curves for key medical items


IRSAD = Index of Relative Socio-Economic Advantage and Disadvantage. Item 2702 = general practitioner creation of a GP mental health treatment plan. Item 2710 = GP review of a GP mental health treatment plan. Item 291 = psychiatrist consultation for creation of a shared care plan, > 45 minutes. Item 306 = psychiatrist consultation in rooms, 45–75 minutes.

4 Concentration curves for key clinical psychology and allied health items


IRSAD = Index of Relative Socio-Economic Advantage and Disadvantage. Item 80010 = clinical psychologist consultation in rooms, > 50 minutes. Item 80110 = general psychologist consultation in rooms, > 50 minutes. Item 80135 = occupational therapist consultation in rooms, > 50 minutes. Item 80160 = social worker consultation in rooms, > 50 minutes.

Deaths from childhood asthma, 2004–2013: what lessons can we learn?

New South Wales data highlight areas for improvement in asthma management

The NSW Child Death Review Team annual report 2013 included an analysis of deaths from asthma during the 10-year period 2004–2013.1 A total of 20 children, aged up to 17 years, died from asthma in New South Wales. While this death rate was low, and therefore the findings need to be interpreted cautiously, lessons from the analysis can be extrapolated to help reduce morbidity and mortality associated with asthma in children. The main findings were:

  • deaths from asthma among children were rare, and more common in older children
  • there has been a recent increase in deaths, the cause of which is not clear
  • risk factors include low socioeconomic status, psychosocial problems, and Asian and Pacific Islander backgrounds
  • all the children who died had been diagnosed with asthma; most had persistent asthma and were atopic; seven had a history of food allergy (five confirmed on skin prick testing); and three had a history of anaphylaxis and had been prescribed or had used an adrenaline autoinjector
  • younger children were more likely to be hospitalised and less likely to die, and older children were less likely to be hospitalised and more likely to die
  • three-quarters of those who died had been hospitalised in the previous 5 years and 11 had been hospitalised in the year before their death, of whom eight did not receive follow-up care
  • all those who died had seen a general practitioner about their asthma, but regular review was uncommon (most just saw a GP when they were unwell) and only eight of those who died had seen a specialist
  • two-thirds of those who died had been given a written asthma action plan and about half had one developed in the year before death
  • written asthma action plans were on the school files of half (seven) of the children who were attending school and five of these were developed in the year before death
  • most of those who died had been prescribed reliever and preventer medication (19); most were using inhaled corticosteroids (ICSs) (17); and 15 of those who were using ICSs were also using a long-acting β-agonist (LABA) and/or an oral corticosteroid (13 and five, respectively)
  • the records of nine children who died indicated that asthma medications were not being used as recommended (intermittent preventer use in eight cases, irregular reliever use in one case)
  • for most of those who died (17), factors that may have increased risk of death were identified; these included: suboptimal asthma control, presentation or admission to hospital in the year before death, poor follow-up care, poor adherence to medication or written asthma action plan, lack of written asthma action plan, and exposure to tobacco smoke.

Possible adverse effects of therapy

One concerning matter that was identified was the large number of children who had been prescribed ICS–LABA combination therapy. While this may have reflected asthma severity, just under half of the children were using their preventer therapy intermittently, which is suboptimal. Concerns about inappropriate prescribing of ICS–LABA combination therapy as first-line preventer therapy (also often used intermittently) prompted the recent Pharmaceutical Benefits Advisory Committee Post-market Review of Pharmaceutical Benefits Scheme Medicines Used to Treat Asthma in Children (http://www.pbs.gov.au/info/reviews/asthma-children-reviews). This review confirmed the ongoing inappropriate use of ICS–LABA combination therapy as well as the lack of evidence of efficacy and potential adverse effects (increased exacerbation risk,2,3 loss of bronchoprotection against exercise-induced asthma and loss of efficacy of short-acting β-agonists [SABAs]4) of LABAs in children.

A recent study has also highlighted the possibility that a particular polymorphism in the β receptor gene (homozygous for arginine at codon 16) may predispose patients to these adverse effects.5 Thus, LABA use in the children who died from asthma may have, theoretically, put these children at risk of severe exacerbation and reduced the efficacy of SABAs during acute episodes of wheezing. It might, therefore, explain the increase in asthma deaths seen in recent years. It might also be responsible for increases in exacerbations and episodes of exercise-induced asthma in children who are taking LABAs, particularly those who may be genetically predisposed to adverse effects.

Recommendations

The recently revised National Asthma Council Australia Australian asthma handbook highlights the importance of a stepwise approach to asthma management in children and emphasises that ICS–LABA combination therapy should not be used as first-line preventer therapy in children. Instead, LABA add-on therapy should be reserved as one of the three possible options for step-up treatment in children with persistent asthma who continue to have poor asthma control despite low-dose ICS treatment. The other two possible options for step-up treatment are montelukast add-on therapy and increased ICS dose. Each of these step-up options may be a potential optimal approach in different patients.6

The handbook also recommends that because of lack of evidence of efficacy and safety in preschool children, LABAs should not be used in children 5 years or younger.6 This recommendation is also included in the recently revised Global Initiative for Asthma guidelines.7

Another recommendation in the Australian asthma handbook is to consider specialist review for children requiring step-up treatment, particularly those with ongoing poor asthma control.6 Although the children who died from asthma met this criterion, fewer than half had seen a specialist for review of their asthma. In addition, regular asthma reviews and follow-up care after hospital admission for asthma were uncommon. This probably reflects general non-adherence to asthma management guidelines for children, which could result in unnecessary morbidity.

It is pertinent to also highlight that the risk factors identified in the children who died from asthma (namely suboptimal asthma control, presentation or admission to hospital in the year before death, poor adherence to medication or written asthma action plan and lack of written asthma action plan) predict future asthma risk and therefore ongoing asthma morbidity. The three most common reasons for poor asthma control are misdiagnosis, poor adherence to medication and poor inhaler technique.6 While inhaler technique could not be checked in the review of asthma deaths, poor adherence to medication or written asthma action plan and lack of written asthma action plan were identified as risk factors in the children who died from asthma.

The Australian asthma handbook also recommends education about asthma medication, inhaler technique, preventing symptoms, managing acute episodes, self-monitoring and asthma control, as well as regular reviews and a written asthma action plan to help the patient and/or caregiver recognise and manage acute asthma episodes.6 There is also evidence to support the benefit of providing a written asthma action plan in paediatric emergency settings.8

Innovative strategies

Innovative educational strategies aimed at primary health care have been shown to improve asthma outcomes in children. A randomised controlled trial of the Practitioner Asthma Communication and Education (PACE) Australia program showed increased use of written asthma action plans by GPs, more appropriate evidence-based management of childhood asthma, and a higher rate of spacer prescription.9 The National Asthma Council Australia now has funding for wider dissemination of the PACE Australia program through GP networks.

Giving Asthma Support to Patients (GASP) is an online tool that was developed in New Zealand to provide asthma education at point of care and to provide primary health care professionals with the skills and knowledge they need to undertake a structured asthma assessment.10 For a retrospective cohort of patients aged 5–64 years, use of GASP resulted in decreased risk of exacerbation, hospital admission and emergency department presentation, decreased requirement for oral corticosteroids and less reliance on bronchodilators.10 Asthma Foundation NSW is in the process of producing an Australian version of GASP, consistent with Australian recommendations, which will be piloted in general practices.

Conclusion

Findings from the review of asthma deaths in NSW can help optimise management of childhood asthma and therefore improve outcomes. Guidelines for asthma management are not being adhered to and inappropriate prescribing of ICS–LABA combination therapy may be putting children at unnecessary risk of adverse effects. Innovative educational strategies such as PACE Australia and GASP are important for promoting asthma management guidelines and reducing asthma morbidity and mortality in children.

Factors affecting general practitioner charges and Medicare bulk-billing: results of a survey of Australians

Data from Medicare Australia show that 76.9% of all Medicare Benefits Schedule (MBS) services were bulk billed (charged directly to the Commonwealth without a patient copayment) in the December quarter of 2013.1 The proportion was 81.9% for general practitioner services.1 These historically high rates of direct-to-government charges have in part led to calls for the introduction of minimum patient copayments for GP services. While much has been written in the media about the potential impact of such copayments, perhaps less is understood about the factors affecting decisions to bulk bill or to charge patient copayments, and how these factors are linked to patient-reported characteristics of general practices.

Studies of bulk-billing have largely focused on GP-specific factors, using data from surveys or large administrative datasets to explore bulk-billing behaviour. Studies of the impact of GP density (number of GPs in a given area) on bulk-billing behaviour have shown that the greater the number of GPs, the greater the propensity to bulk bill.2,3 Some surveys of GPs have specifically explored factors determining bulk-billing. One study identified that among a sample of GPs practising in New South Wales, the odds of bulk-billing were higher for those in major cities compared with those in rural areas, for overseas-trained doctors compared with locally trained doctors, and for those with a higher caseload.4 Patient income level has also been cited as a factor influencing GPs’ bulk-billing decisions.3,5

Surveys of patients’ experiences of making an appointment with and being treated by a GP have also been done.68 However, to our knowledge, no Australian survey has captured general practice service-related factors together with detailed information about the personal and health characteristics of patients to enable analysis of associations between GP charging behaviour and the characteristics of patients, visits and practices.

We surveyed Australians on recent experiences when visiting a GP to investigate the extent to which bulk-billing is explained by patient characteristics, visit characteristics and practice characteristics. The ability to combine information about respondents with information on the types of primary care services they use (albeit as recalled by patients) offers a new source of data on patient–GP interactions.

Methods

Our survey was administered to the Pureprofile online panel (http://www.pureprofile.com/au) in July 2013 using the Qualtrics platform (http://www.qualtrics.com). Australians aged 16 years or older were invited to participate via an invitation on their member’s home page.

Members of this panel are reimbursed for survey completion according to the time required to complete the survey. The invitation to complete our survey stated that the survey would take up to 15 minutes to complete and that those who completed the survey would be reimbursed $4.00.

Respondents were asked about their most recent visit to a GP. The questions focused on: their perceptions of the general practice structure; whether they were bulk billed for the visit, and the fee paid if not bulk billed; their use of primary health care services; and demographic details.

Data were analysed using STATA version 12 (StataCorp LP) and conducted using the robust standard errors command to account for the survey nature of the data.

Where a respondent reported paying a fee for their most recent visit, this was compared with the MBS fee for that visit type (for the reported visit duration) to derive a net out-of-pocket cost.

Initial analyses considered frequencies of and correlations between variables thought to be associated with bulk-billing. Associations between these factors and the dependent variable (whether or not the respondent was bulk billed at their most recent GP visit) were first tested using univariate analyses.

Factors for which there was a significant odds ratio (OR) (ie, the 95% CI excluded the value 1) were included in a multivariate logistic regression analysis. This type of analysis produces results that can be interpreted as the odds of respondents with a given characteristic, or respondents visiting practices with a certain characteristic, being bulk billed compared with those for whom the characteristic is absent. For parsimony, only results of the multivariate logistic regression analysis are presented in this article.

The respondent factors tested for association were: presence of chronic disease (yes or no); annual household income (low, $0–$39 999; medium, $40 000–$79 999; high, $80 000–$149 999; very high, > $150 000; or unknown); use of any form of government concession card other than a Medicare card (yes or no); having private health insurance (yes, no or unknown); age; region of residence (major city, inner regional, outer regional, remote, or unknown); sex (female or male); and duration of visit (< 5 min, 5–19 min, 20–39 min or > 40 min).

The practice characteristics tested for association were: the number of GPs in the practice (one or two, more than two, or unknown); and whether the respondent had an appointment for the GP visit (yes or no).

As the survey was anonymous, it was not possible to retrospectively collect information from respondents who did not provide it at the time of survey completion. Missing responses were therefore categorised as “unknown”.

The study was part of a research program approved by the University of Technology Sydney Human Research Ethics Committee.

Results

The survey was completed by 2477 individuals. Their characteristics are shown in Box 1 together with those for the Australian adult population. The respondents were comparable to the Australian population with respect to sex and income (median weekly household income for Australia is $12349, and the median weekly household income category reported by respondents was $1150–$1529). The youngest and oldest age groups were underrepresented in the survey compared with the Australian population and the proportion of respondents living in major cities was higher compared with that for Australian Health Survey participants.6

Respondents were in poorer health compared with those in the Patient Experience Survey8 in terms of the proportion who reported having a chronic disease and reported numbers of GP visits in the past year. Nearly two-thirds of respondents (1579/2477; 63.75%) reported going to the GP three or fewer times in the past year.

Most visits (1888/2477; 76.22%) lasted 5–19 minutes (consistent with a level B consultation). A lower proportion of respondents reported having private health insurance cover compared with those in the Patient Experience Survey.8

Most respondents reported that they had a usual general practice (2222/2477; 89.71%) and that they usually saw the same GP in the practice that they went to most often (1989/2477; 80.30%).

The survey question on bulk-billing referred to the most recent GP visit, regardless of whether that visit was with the respondent’s usual GP. Most respondents (2064/2477; 83.33%) reported that the practice they went to for their most recent visit bulk billed some or all patients. A majority of respondents (1763/2477; 71.17%) reported that their most recent GP visit was bulk billed, and the remaining 714 provided information about fees paid at their most recent visit.

Of those who were not bulk billed, the mean fee charged was $64.04. Taking into account durations of visits and corresponding MBS rebates, the mean out-of-pocket cost was estimated to be $34.09. These values exclude 189 respondents who reported being charged a fee less than the MBS fee associated with their visit duration (ie, those for whom an out-of-pocket cost estimate could not be calculated).

Of those who were not bulk billed, 39.92% (285/714) had an annual household income of less than $80 000. Of those who were bulk billed, 53.37% (941/1763) had an annual household income of less than $80 000.

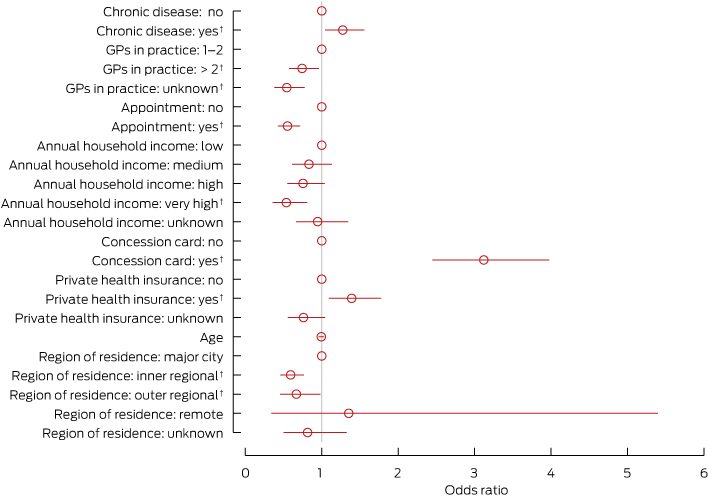
The univariate analyses showed that all factors other than sex and duration of visit were associated with bulk-billing. Results of the multivariate logistic regression analysis, containing the remaining factors, are shown in Box 2. An OR of 1 or close to it indicates no association between a given factor and the odds of bulk-billing. Factors for which the 95% CI does not include the value 1 are statistically significant (P < 0.05).

These results show that there are higher odds of being bulk billed among patients with chronic diseases (OR, 1.28; 95% CI, 1.04–1.56), those with a concession card (OR, 3.12; 95% CI, 2.45–3.98) and those with private health insurance (OR, 1.39; 95% CI, 1.09–1.78). However, the odds of being bulk billed are lower for those on very high incomes compared with those on low incomes (OR, 0.54; 95% CI, 0.36–0.81) and for those living in inner and outer regional areas compared with major cities (OR, 0.59; 95% CI, 0.46–0.77 and OR, 0.67; 95% CI, 0.45–0.98, respectively).

Service-related characteristics were also important in explaining bulk-billing behaviour. Respondents with an appointment for their last visit had a lower odds of being bulk billed compared with those without an appointment (OR, 0.55; 95% CI, 0.43–0.72). Similarly, respondents who visited practices that had more than two GPs and those who reported not knowing how many practitioners were in a practice, had a lower odds of being bulk billed than those who attended a practice with one or two GPs (OR, 0.74; 95% CI, 0.57–0.96 and OR, 0.54; 95% CI, 0.38–0.78, respectively). The results of separate regressions including sex and duration of visit showed that neither of these factors was significant and did not add to the explanatory power of the analysis (data not shown).

Discussion

Our results indicate that while a high proportion of GP visits are bulk billed, nearly one-third of respondents paid a fee at their most recent visit. For some respondents, introduction of additional copayments would therefore not be a significant departure from the status quo. However, additional copayments would be novel for many patients and our analysis suggests that these could cause difficulties for a substantial proportion of those individuals.

We found a higher propensity to bulk bill individuals with lower income levels, those with chronic diseases and those with concession cards. These are the groups who would be the most disadvantaged by the introduction of additional copayments for GP visits.

Perhaps more surprising was the finding that having private health insurance was positively linked with being bulk billed, after adjusting for income and presence of a chronic disease. In a recent study, it was observed that Australian holders of private health insurance were more likely to be healthier than those without insurance.10

We speculate that healthier individuals might be more willing to discriminate between GPs on the basis of bulk-billing and better able to find bulk-billing practices. A more direct relationship between private insurance and bulk-billing is expected to emerge if a pilot program currently underway by IPN (Independent Practitioner Network) and Medibank Private to guarantee bulk-billing of GP appointments for Medibank members proves to be successful.11

Respondent region of residence was also associated with bulk-billing, with lower rates among residents of inner and outer regional areas despite higher bulk-billing incentive payments for GPs in regional, rural and remote areas. This is consistent with the results of a previous study in which an almost sevenfold higher odds of bulk-billing among GPs in metropolitan areas was observed compared with rural areas.4 This could reflect GP density rather than respondent-related factors; GP concentrations in major cities lead to greater price competition between practices for respondents, which results in an increased likelihood of bulk-billing.2,3 This diminishes as the concentration of practices reduces in less densely populated areas.

As well as respondent-specific factors, we analysed factors relating to visits and practices. Having an appointment was found to halve the odds of being bulk billed compared with not having an appointment. This might indicate that practices which are able to accept non-urgent “walk-ins” (owing to flexible schedules or availability of practitioners) have spare capacity hence are more likely to bulk bill to encourage demand. Alternatively, practices might discriminate and select patients who are prepared to pay by offering reduced waiting times. This requires further investigation at the general practice level.

Similarly, the impact of practice size on bulk-billing behaviour warrants closer investigation. Our results indicate that smaller practices (one or two practitioners) had a higher odds of bulk-billing than those with more practitioners and those in which the number of practitioners was not known by respondents (assuming that most respondents would be able to recall if a practice had one or two practitioners only, the latter category could be grouped with the “two or more” group). In practices with one or two practitioners, there may be less capacity to compete on the basis of service offerings (eg, multiple practitioners, co-located pathology services) and amenities, resulting in greater price competition. For these practices, increased rates of bulk-billing might be a key point of differentiation from other practices. This would reinforce the notion that practice structure, even allowing for the potential effects of flexible arrangements, is a determinant of billing practices.

A limitation of our study is that the sample differed in terms of chronic diseases, numbers of GP visits in the past year, age, region of residence and private health insurance status. The sample was representative in terms of income and sex distributions, but it is possible that there were other unmeasured differences related to self-selection into the online panel. Despite the differences, the large sample size meant that there were sufficient numbers within the relevant subgroups to provide the power to detect differences in the likelihood of being bulk billed, while controlling for effects of the remaining population characteristics.

We combined respondent-specific factors with respondent-reported practice characteristics to investigate demand and supply influences on bulk-billing. Both are important since changes in patient factors (eg, ability to pay for care) and GP factors (supply of care) influence the use of primary health care services.12 As expected, people with chronic diseases and those with low household incomes were less likely to be charged. We also found several interesting associations that warrant further research, such as that between health insurance status and bulk-billing, and that between general practice structure and bulk-billing. Nonetheless, our findings are relevant when considering potential changes to Medicare funding that might affect bulk-billing by GPs, which will affect individuals’ capacity to access services.

1 Characteristics of a sample of patients who completed a survey on their most recent visit to a general practitioner and of the Australian adult population (n = 2477)


Sample, number (%)

Australian adult population, %*


Chronic disease

1488 (60.07%)

45%

GP visits in past year


0 or 1

557 (22.49%)

32%

2 or 3

1022 (41.26%)

31%

4–11

748 (30.20%)

27%

12 or more

150 (6.06%)

10%

Female

1291 (52.12%)

51%

Age, years


16–24

134 (5.41%)

17%

25–34

540 (21.80%)

17%

35–44

520 (20.99%)

18%

45–54

509 (20.55%)

17%

55–64

421 (17.00%)

14%

65–74

296 (11.95%)

9%

75 or more

51 (2.06%)

8%

Unknown

6 (0.24%)


Region of residence


Major city

1824 (73.64%)

63%

Inner regional

365 (14.74%)

20%

Outer regional or remote

168 (6.78%)

17%

Unknown

120 (4.84%)


Private health insurance


Yes

525 (21.19%)

55%

No

1732 (69.92%)


Unknown

220 (8.88%)


* Data on chronic diseases, GP visits and private health insurance were obtained from the Patient Experience Survey;8 data on sex and age were obtained from the Census;9 and data on region of residence were obtained from the Australian Health Survey.6

2 Odds ratios for factors associated with bulk-billing (n = 2467)


* Multivariate regression statistic Wald χ2 = 222.68 (< 0.001). Bars represent 95% CIs. For each category except age, the base factor appears without a 95% CI and straddles the line at 1. The number of respondents included was reduced by 10 due to six missing observations for age and four missing observations for concession card status. † P < 0.05 compared with base factor.

Comparing non-sterile to sterile gloves for minor surgery: a prospective randomised controlled non-inferiority trial

Minor surgery is an important aspect of general practice. This is particularly the case in Australia, where the incidence of skin cancer is reported to be the highest in the world,1 and where general practitioners perform most surgical excisions for skin cancer.2

When the use of gloves for surgery was first implemented by William Stewart Halsted in 1890, it was in an attempt to protect his surgical scrub nurse from dermatitis as a result of contact with mercuric chloride — which was used for sterilisation processes — rather than to prevent infection.3 Nowadays, several guidelines exist in Australia and internationally, which recommend that GPs use sterile gloves for small procedures such as minor surgery in general practice.46 However, these guidelines are based on expert opinion rather than on medical evidence.

Before our study, about half of the participating GPs used non-sterile clean boxed gloves when conducting minor skin excisions in general practice, while the other half used sterile gloves. A comprehensive Medline search found few studies relating to the use of sterile versus non-sterile gloves (Appendix). Randomised trials looking at lacerations in an emergency department,7 wisdom tooth extraction in an outpatient setting8 and Mohs micrographic surgery9 all showed no significant difference between infection rates. However, these studies looked for superiority of the sterile gloves rather than non-inferiority of the non-sterile gloves, resulting in negative trials, and the latter two studies were statistically underpowered. An observational study in a private dermatology setting showed no difference in infection rate for minor procedures; however, sterile gloves were shown to result in a significantly lower infection rate than non-sterile gloves for a subgroup of more complicated reconstructive procedures, which comprised flaps and skin grafts.10 Another observational study of Mohs surgery showed no statistical difference in infection rates.11 The only study conducted in a general practice setting was an audit of 126 patients where non-sterile gloves had been used for minor surgery, which showed an infection rate of 2.4%.12

Prior studies of wound infection after minor surgery involving GPs in Mackay, Queensland, showed overall incidences of wound infection of 8.6% and 8.9%.1316 This incidence was higher than expected based on published results of a similar Australian general practice cohort (1.9%),17 a skin cancer clinic cohort (1.5%)18 and a European dermatology clinic cohort (2%).19 A suggested acceptable rate of infection after clean minor surgery is less than 5%.20 The reason for our high infection rate is unclear, but may be related to the hot, humid environment, or to patient behaviour in our rural setting. A low risk of infection after clean surgery means that studies of more than 1000 procedures (sometimes many more) are required, under normal circumstances, to detect a clinically relevant difference in infection from an intervention with statistical confidence.21 Because of the high incidence of infection in our patient cohort, and the high minor surgery workload,22 we decided to use this capacity to investigate the effect of gloves on infection rates. Our trial sought to establish whether non-sterile clean boxed gloves were non-inferior to sterile gloves with regard to surgical site infection after minor skin excisions.

Methods

Study design

We carried out a randomised controlled single-centre trial with patients presenting for minor skin excisions. The study was approved by the James Cook University Human Research Ethics Committee (approval number H4572). The trial was registered in the Australian New Zealand Clinical Trials Registry ACTRN12612000698875.

Setting and participants

The study was conducted in a single private general practice in Mackay, Queensland between 30 June 2012 and 28 March 2013. Six doctors recruited between one and 100 patients. The GPs and practice were purposively selected as they had previously successfully participated in wound management projects.12,15 Consecutive patients presenting for minor skin excisions were invited to take part in the trial. Practice nurses were responsible for recruiting patients and collecting data. Demographic information was collected from all patients, as well as clinical information about diabetes or any other important pre-existing medical conditions. A body site map was used to define excision site. At the end of the study, practice nurses were asked to re-examine computer records in order to fill in any missing data. Two of us (C H and S S) visited participating GPs and practice nurses to provide training and ensure that recording was standardised.

Eligibility criteria

All patients presenting to a participating GP for “minor skin excision” from any body site were eligible to participate in the study. Two-layer procedures were recorded and included. Patients who were already taking oral antibiotics or immunosuppressive drugs were excluded from the study. Other exclusion criteria were skin flaps, excision of a sebaceous cyst and history of allergy to latex.

Surgical wound management protocol

We conducted a workshop for participating GPs to develop guidelines that would ensure that excisions were managed in a standardised manner. The following excision protocol was agreed on:

  • skin preparation with chlorhexidine solution;
  • usual sterile technique (standard precautions);
  • World Health Organization Hand Hygiene Technique with Soap and Water;23
  • local anaesthesia — subcutaneous injection of excision with 1% lignocaine;
  • excision closure with nylon sutures using simple interrupted sutures;
  • dressing application — application of non-woven polyester fabric with acrylic adhesive and non-woven absorptive pads;
  • no application of antibiotics, either topical or oral. No topical antiseptics such as betadine or alcohol. No antiseptic washes or medicated soaps;
  • patient wound advice — provision of written and verbal advice about wound care and time of return for suture removal; and
  • removal of sutures according to body site: head and neck, 7–10 days; torso, 12–14 days; upper limb, 14 days; lower limbs, 12–16 days.

Recruitment, randomisation and blinding

All patients provided written informed consent before enrolling in the study. After agreeing to participate, patients were randomly allocated to the intervention or control groups using computer-generated random numbers. Allocation information was placed in opaque sealed envelopes. The practice nurse enrolled patients and assigned participants to their groups. Patients were not blinded to their group allocation. The assessing practice nurses and doctors were blinded to the allocation of intervention and control groups. All participating patients received written instructions on postoperative wound care. Both groups were asked to take their dressing off after 24 hours and avoid using antiseptics.

Clinical outcomes

Incidence of wound infection was our primary outcome measure, and incidence of other adverse effects was our secondary outcome measure. Wounds were assessed for infection by the practice nurse or the GP on the agreed day of removal of sutures or sooner if the patient re-presented with a perceived infection. Our definition of wound infection was adapted from standardised surveillance criteria for defining superficial surgical site infections developed by the United States Centers for Disease Control and Prevention’s National Nosocomial Infection Surveillance System (Box 1).24 All participating doctors and nurses were briefed regarding the definition of infection and were also given written information. Practice nurses were asked to swab any discharging infections to investigate any pattern of antimicrobial resistance.

Sample size

Sample size was calculated on the basis of our previous study, which showed an infection rate of 8.6%.14 Based on a projected infection rate of 8%, we decided that an absolute increase in incidence of infection of 7% would be clinically significant. Thus differences in infection rates between non-sterile and sterile gloves of up to 7% were considered clinically unimportant, and based on our anticipated infection rate of 8% for sterile gloves, an infection rate of up to 15% for non-sterile gloves was considered non-inferior. This margin was decided by the investigating GPs, based on what they felt would be relevant to their clinical practice, and this margin was prespecified. To detect this non-inferiority margin of 7% with a power in excess of 80%, and a two-sided 95% confidence interval, a total of 186 patients were required in the intervention group and 186 patients in the control group. Based on our previous results in a similar setting, the design effect of investigating GPs, who were the primary sampling unit and were considered to form “clusters”, was estimated to be 1.21, and the required sample size was adjusted to at least 225 patients per group.16

Statistical analysis

All analyses were based on the intention-to-treat principle. Per-protocol analyses were conducted to cross-validate the intention-to-treat results.25,26 Depending on the distribution, numerical data were described as mean, SD; or median, interquartile range (IQR). Percentages were presented with 95% confidence intervals. A two-sided 95% CI for the difference in infection rate was used to assess non-inferiority. In addition, a per-protocol analysis was conducted, which excluded patients with protocol violations. Further, a sensitivity analysis was performed, including patients lost to follow-up: once as treatment successes (no wound infection) and once as treatment failures (with wound infection). Results were adjusted for their cluster effects. P less than 0.05 were considered statistically significant. Data were analysed using IBM SPSS version 21, Stata version 12.1 (StataCorp) and Power Analysis and Sample Size Software (NCSS).

Results

Practice and study characteristics

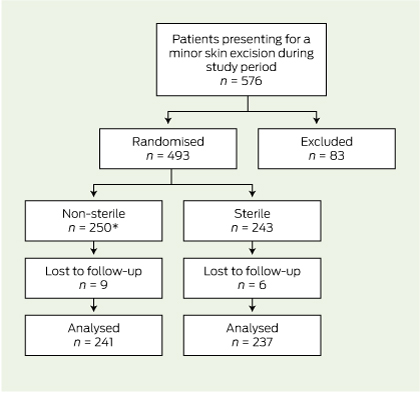
Of the 576 patients who attended for skin excisions during the collection period, 83 were excluded (Box 2).

Of the remaining 493 patients, 250 were randomly assigned to the intervention group (non-sterile gloves) and 243 to the normal treatment control group (sterile gloves). Fifteen patients were eventually lost to follow-up because they had their sutures removed elsewhere (13 patients) or they were not assessed for infection at the time of removal of sutures (two patients). There was one protocol violation where a patient in the intervention group was given an antibiotic for another infection in the follow-up period. This patient did not have a wound infection and was analysed in the intervention group on an intention-to-treat basis. Follow-up was completed in 478 (97.0%) of randomised patients (Box 3).

Comparisons at baseline

There were no large differences at baseline between the intervention and control groups (Box 4).

Incidence of infection

Infection occurred in 43 of the 478 excisions (9.0%). The incidence of infection in the non-sterile gloves group (8.7%; 95% CI, 4.9%–12.6%) was significantly non-inferior compared with the incidence in the control group (9.3%; 95% CI, 7.4%–11.1%). The two-sided 95% CI for the difference in infection rate (− 0.6%) was − 4.0% to 2.9%, and did not reach the predetermined margin of 7%, which was required for non-inferiority.

A further sensitivity analysis was performed on the 15 patients lost to follow-up. If all of these patients were assumed to have an infection, or if all patients were assumed not to have an infection, the results were still significantly non-inferior (Box 5). There were no adverse events.

Discussion

The results of our study suggest that the use of non-sterile clean boxed gloves was not inferior to that of sterile gloves in relation to the incidence of infection. This was both clinically and statistically significant, as the difference in the incidence of infection did not reach our predetermined margin of 7%, considered significant for non-inferiority. The upper limit of our 95% CI was 2.9%, which was well below our predetermined non-inferiority margin of 7.0%.

Comparison with other studies

Our study produced a similar outcome to existing studies.79 This was an adequately powered, positive randomised controlled trial that tested for non-inferiority of the non-sterile gloves rather than for a significant difference in infection rates. We believe this was the first study of its type to be conducted in a general practice setting.

Limitations of study

Our study did have some limitations. Various characteristics influence infections, and although information on as many variables as possible was recorded, it proved difficult to ensure that baseline data were comparable. For example, there were inadequate data recorded on suture size and patient occupation, and consequently, these factors could not be compared. In addition, the prevalence of diabetes and other medically important conditions was probably underrecorded, and power to analyse these subgroups was limited. Surgical training and technique of the GPs involved is a potential confounder that would be difficult to quantify and was not recorded; however, the procedures performed by individual GPs were equally balanced in the baseline data. Our predetermined margin of 7% for non-inferiority may be considered high, and some clinicians may consider a smaller margin to be clinically meaningful. Although our actual difference in infection was − 0.6%, a larger sample size would be required for the study to be adequately powered to detect smaller differences in infection rate.

Although the diagnosis of infection followed guidelines, it is still subjective and there may be inter- and intraobserver variation.27 The definition we used is the most widely implemented standard definition of wound infection.24,27 We have no evidence to support intra- and interpractice reproducibility of measurement and recording procedures.27

Our sterile gloves were powdered, while our non-sterile gloves were non-powdered. However, we have no reason to believe that powder would affect infection rates.

Generalisability

There are some limits to generalising these findings. The population of Mackay is slightly older and has a lower median household income than the general Australian population.28 Mackay is a provincial town in tropical north Queensland. The climate is hot and humid, with the mean daily maximum temperature ranging between 24.2°C and 30°C during the summer months, and a relative humidity of 75% to 79%.29 We have already discussed that our incidence of wound infection is high compared with similar cohorts of patients in temperate climates; however, we have no reason to believe that the effect of sterile gloves would be less non-inferior, that is, any worse, in similar cohorts of patients with lower incidence of surgical site infection.

We did not include skin flaps in our trial, and previous evidence has shown sterile gloves to be superior for more reconstructive dermatological procedures;10 therefore, we do not recommend extrapolating our findings to more complicated procedures such as skin flaps. However, the findings could be extrapolated to less complicated procedures in primary care, such as contraceptive implant insertion and minor procedures involving class 2 wounds such as suturing of lacerations.

Choice of gloves

There are other considerations that might affect doctors’ choice of gloves. Sterile gloves come in several different sizes, while non-sterile gloves are generally only available in small, medium and large. Latex and powder allergy, as well as preference for and availability of powdered or non-powdered gloves, may also affect choice. A recent study showed high bacterial counts on boxed gloves left open for longer than 3 days,30 although the clinical significance of these bacterial counts is unclear. Another study showed no bacterial growth on clean examination gloves after opening a new box.31

Cost saving

There is some cost benefit in the use of non-sterile versus sterile gloves, with about $1 saved per pair of gloves used. We calculated that a single pair of non-sterile gloves costs $0.153 compared with $1.203 for sterile gloves, saving $1.050 per pair of gloves used for each procedure. The cost saving benefit of using non-sterile gloves — without increasing infection rates — may be of particular relevance to developing countries with limited health care resources.

1 Definition of surgical site infection (SSI)

  • infection must be within 30 days of excision;
  • the infection involves ONLY skin or subcutaneous tissue of the incision, AND at least one of the following:
    • purulent discharge;
    • pain or tenderness;
    • localised swelling;
    • redness or heat at site;
    • diagnosis of SSI by general practitioner; and
  • stitch abscess must not be counted as an infection.

2 Reasons for exclusion from study

Reasons for exclusion from study

Patients (n = 83)


Patient declined to participate

38

Patient was taking oral antibiotics

23

Excision of sebaceous cyst

15

Shave biopsy conducted

3

Patient did not plan to return for removal of sutures

2

No sutures required

1

Flap required

1

3 Flowchart of enrolment, randomisation and follow-up of patients


* There was one protocol violation where a patient in the intervention group was given an antibiotic for another infection in the follow-up period. This patient did not have a wound infection and was analysed on an intention-to-treat basis.

4 Baseline comparison of intervention group (non-sterile gloves) and control group (sterile gloves)

Patient characteristics

Intervention group (non-sterile gloves) (n = 241)

Control group (sterile gloves) (n = 237)


Mean age (SD), years

64.9 (15.8)

65.7 (15.3)

Male

58.9%

60.30%

Smoking status


Never smoked

57.7%

52.7%

Ex-smoker

30.7%

35.9%

Current smoker

11.6%

11.4%

Diabetes mellitus

10.0%

12.7%

Other medical conditions*

38.1%

35.9%

Medications


Warfarin

4.1%

5.1%

Clopidogrel or aspirin

28.6%

27.0%

Steroids, oral or inhaled

6.3%

8.1%

Lesion characteristics


Body site


Neck and face

35.3%

31.2%

Upper extremities

26.9%

30.4%

Trunk

19.1%

19.8%

Lower limb above knee

4.6%

1.6%

Lower limb below knee

14.5%

16.9%

Histology


Naevus or seborrhoeic keratosis

15.3%

13.0%

Skin cancer and precursor

66.4%

70.5%

Other

18.3%

16.5%

Skin integrity


Normal

75.9%

74.7%

Ulcerated

19.1%

19.0%

Procedure characteristics


Mean length of excision (SD), mm

20.0 (14.0–27.0)

20.0 (13.5–27.0)

Median number of days until removal of sutures (IQR)

8 (7–10)

9 (7–10)

Two-level procedure

0

0.8%


IQR = interquartile range. * Medical conditions recorded were: chronic obstructive pulmonary disease (n = 18; 3.8%), hypertension (n = 119; 24.9%), ischaemic heart disease (n = 38; 7.9%), peripheral vascular disease (0) and current cancer (n = 7; 1.5%). † Skin cancers were: melanoma, squamous cell carcinoma and basal cell carcinoma. Precursors were: solar keratosis and intra-epithelial carcinoma. ‡ “Other” included: re-excisions of melanoma and basal cell carcinoma, sebaceous cyst, epidermal cyst, wart and dermatitis.

5 Comparisons as intention-to-treat and per-protocol and sensitivity analyses*

Analysis

Intervention group

Control group

Difference
(95% CI)


Intention-to-treat

21/241 (8.7%)

22/237 (9.3%)

− 0.6%
(− 4.0% to 2.9%)

Per-protocol

21/240 (8.8%)

22/237 (9.3%)

− 0.5%
(− 4.0% to 2.9%)

Sensitivity analysis: lost to follow-up; assumed without infection

21/250 (8.4%)

22/243 (9.1%)

− 0.7%
(− 4.0% to 2.7%)

Sensitivity analysis: lost to follow-up; assumed with infection

30/250 (12.0%)

28/243 (11.5%)

0.5%
(− 3.7% to 4.6%)


* Differences between control and intervention groups are presented with two-sided 95% confidence intervals. Results were adjusted for the clustering effects of treating doctors.

Full medical program fees and medical student career intention

Admission to Australian medical schools is highly competitive, despite an increase in capacity from about 1200 places in 1999 to 3500 places in 2013.1 Most of these places are Commonwealth supported; in 2013, students paid A$9450 for each of the 4–6 years of medical tuition via the HECS-HELP scheme (Higher Education Contribution Scheme, Higher Education Loan Program).2

Tuition fees can be paid in advance or deferred until an annual income threshold is reached (A$51 309 in the 2013–14 financial year); deferred payments are interest-free but adjusted according to the consumer price index.3 In 2011, 56% of medical school entrants had a prior degree that may have also generated HECS-HELP debt.4

Medical students enrolled in a Commonwealth-supported place (CSP) may accrue a debt of A$36 000 to A$63 000, depending on course structure and prior degrees (4–7 years of fees), plus living expenses (about A$15 000 per year if away from home2). Concerns have been raised about the potential inequity of pricing medical education beyond the range that is practical for students from lower socioeconomic backgrounds.5,6

Subsidies for tuition fees are available through Bonded Medical Places (18.8% of students), Medical Rural Bonded Scholarships (3.0%), Australian Defence Force (ADF) scholarships (0.2%),4 and state-based rural scholarships, all of which require return of service in areas of need (usually non-metropolitan communities or the ADF). CSP students can also reduce HECS-HELP debts by one year’s fees for each year of work in an area of need.

Between 2005 and 2009, some universities introduced additional places that required payment of the full cost of medical education.7 Bond University commenced a full-fee paying (FFP) undergraduate medical course7 and some other medical schools offered small numbers of domestic FFP places to cater for surplus student demand.

Most medical schools also offer FFP courses for international students, providing a valuable source of income and contributing to export of higher education.8 About 700 international places were available annually until recent competition for intern places reduced this to about 550 places.

While fees for international FFP students vary (A$30 000 to A$60 000 per year), the financial investment by graduation by these students is much higher than that for domestic FFP students. Domestic FFP students may access partial loans under the FEE-HELP loan scheme (a lifetime maximum of A$116 507 in 2013)9 and may apply for ADF scholarships and state-based rural scholarships. International FFP students do not have these options.

FFP students (domestic and international) can therefore graduate with substantial debts, raising concerns about workforce outcomes. The debts can be comparable to those in the United States, where a private education system is well established.1012 In 2012, 86% of US medical graduates reported substantial debts, 30% as high as US$200 000.11 Follow-up studies show a clear association between debt, anticipated income, personal value placed on money and choice of higher paid specialties.11,13,14

Choice of specialty is a complex decision, influenced by extrinsic and intrinsic factors.15 Extrinsic factors include work culture, postgraduate work experience, opportunities for flexible hours and perceived prestige of certain specialties.15 Prestige is characterised by longer and more intensive training periods, more competitive selection, higher income, and perceived greater societal status.16 These perceptions remain constant from undergraduate training through to early postgraduate training, although they may be challenged by clinical experiences during clerkships and residency.16

Intrinsic factors include student demographics, personal attributes and preferences, and the clinical work environment. Student demographic profiles have significant influences on specialty choice.17 Socioeconomic status and background appear to be important; students from less wealthy families place greater weight on debt and pursuing higher incomes. Students from a rural background are more likely to pursue a rural career.12,18 Sex is associated with differences in motivation for particular career choices, with women more likely to pursue general practice careers because of shorter, more flexible training and better working conditions.15 Men who place added value on personal lifestyle factors also prefer general practice.19

The three most influential personal determinants of specialty choice appear to be “appraisal of own skills and aptitudes”, “intellectual content of the specialty”, and “interest in helping people”.15 Lifestyle and finances are increasingly reported as major considerations by graduates.1012,18 While debt load may influence students towards a preference for higher-paying careers, this may be more significant only for students who place greater importance on socioeconomic status as overall career preferences between FFP students and their publicly subsidised counterparts are similar.12

Although privately funded medical education continues to grow overseas, the influence of financial burden on career choice in Australia (where the geographic and specialty distribution of graduates is of greater concern than total numbers) has not been studied in depth. We compared the geographic and specialty career intentions of CSP and FFP medical students, domestic and international.

Methods

Data were accessed from the Medical Schools Outcomes Database and Longitudinal Tracking (MSOD) Project, a project of Medical Deans Australia and New Zealand that is funded by Health Workforce Australia as a means of evaluating rural medical education initiatives.19 Questionnaires are administered to all medical students on entry to and graduation from Australian medical schools. We collected data from these questionnaires for the period 2008 (when the MSOD Project commenced, with four participating medical schools) to 2011 (when 18 medical schools participated).

Dependent variables

Work location preference data were collected in five categories: small community; smaller town; regional city or large town; major urban centre; and capital city. The first three and last two categories were collapsed to create a binary variable for preference for rural practice versus urban practice.

Preferences for future medical specialty were analysed according to:

  • first choice selection of one of the five highest paid specialties in Australia — identified by the 2010 Medicine in Australia: Balancing Employment and Life study20 of specialty income (emergency medicine; surgery; radiology; obstetrics and gynaecology; intensive care medicine)21
  • selection of any of the top six in-need specialties — those predicted by Health Workforce Australia to be in short supply in 2025 (general practice; psychiatry; obstetrics and gynaecology; pathology; ophthalmology; radiology)22
  • first choice selection of any of the top six in-need specialties
  • first, second or third choice selection of any of the top six in-need specialties.

Independent variables

A binary variable was created to represent whether each student was a domestic FFP student or a CSP student (the latter was defined as a student receiving Commonwealth, state or university support). This variable excluded international FFP students, and a second binary variable was created to contrast international FFP students with CSP students. Additional binary variables were created for sex, marital status (single versus married or living with a partner) and rural background. Age at entry to medical school, in whole years, was also included.

Statistical analysis

Logistic regression models were run initially to analyse (i) rural future practice intentions, (ii) preferences for the top five income specialties and (iii) preferences for the top six in-need specialties. Two models were run for each: for domestic FFP students versus CSP students, and for international FFP students versus CSP students. Another six logistic regression models were then run to further analyse preferences for the top six in-need specialties, for domestic FFP students versus CSP students only.

Sex, age, marital status and rural background were initially included in all regression models together with the independent variable of whether students were domestic FFP or international FFP. Two-way interaction terms were included for interactions between the control variables and the independent variable of interest, and then removed using a backwards stepwise approach until the model contained only statistically significant interaction effects (those contributing a significant improvement in the model [a 2 log likelihood]).

Results

Data were available for 5688 students who graduated from 2008 to 2011: 262 in 2008; 894 in 2009; 1978 in 2010; and 2554 in 2011. The overall response rate was 83% (4704/5688) for those who completed the entrance questionnaire and 80% (4461/5568) for those who completed both entrance and exit questionnaires, although there were missing data for each of the variables, in particular specialty preferences.

A summary of the data collected from the exit questionnaires is shown in Box 1. A majority of students were young (mean age, 22 years), female, single and from urban backgrounds, and a minority were domestic FFP students (9.1%) and international FFP students (14.7%).

Preference for rural versus urban future practice

Domestic FFP students were significantly more likely than CSP students to prefer an urban future practice location (OR, 5.58; 95% CI, 2.04–15.26; P < 0.001). However, there was a significant domestic FFP student by marital status interaction effect, such that domestic FFP students who were married or partnered on exit from medical school were more likely to prefer a rural location (OR, 0.64; 95% CI, 0.44–0.95; P < 0.05).

Having a rural background had a strong effect on preference for a rural future practice (OR, 0.18), as did being older on entry to medical school (OR, 0.96). International FFP students were more likely to state a preference for urban practice (OR, 1.79). These data are shown in Box 2.

Preferences for medical specialty

Students who were married or partnered were less likely to select one of the top five income specialties as their first preference (OR, 0.77) and domestic FFP students were more likely to select one of the top five income specialties as their first preference (OR, 1.37). International FFP students were not more likely to select one of the top five income specialties as their first preference (OR, 1.18). These data are summarised in Box 3.

Domestic FFP students, but not international FFP students, were less likely than CSP students to have a first preference for an in-need specialty (OR, 0.72; 95% CI, 0.52–1.00; P < 0.05). All of the control variables were significant in the models as main effects: men were less likely to select an in-need specialty (OR, 0.44; 95% CI, 0.37–0.53; P < 0.001), while older (OR, 1.03; 95% CI, 1.01–1.04; P < 0.01), married or partnered (OR, 1.23; 95% CI, 1.14–1.34; P < 0.001) and rural background (OR, 1.28; 95% CI, 1.04–1.57; P < 0.05) graduates were more likely to select one of the in-need specialties.

Analyses of each of the predicted top six in-need specialities for 2025 were performed separately and focused on first preferences. Domestic FFP students were less likely than CSP students to select general practice (OR, 0.71), but domestic FFP students were no more or less likely than CSP students to select the remaining five in-need specialties. The results of the analysis of preference for general practice are shown in Box 4.

However, there was no significant difference between domestic FFP students and CSP students in terms of including any of the top six in-need specialties in their first three preferences (OR, 0.89; 95% CI, 0.71–1.11).

Discussion

We found that Australian domestic FFP students as a whole were more likely to state a preference for higher-paid specialties in urban locations, and were less likely to state a first choice preference for one of the six specialties predicted to be in need in 2025. However, the only specialty that was less popular was general practice; other associations were not uniform throughout the cohort.

Domestic FFP students who were married or partnered were notably different in that they were more likely to prefer rural practice settings. Further, when students’ first three specialisation preferences were analysed, there were no significant differences between domestic FFP and CSP students in preference for a top six in-need specialty.

These differences might be partly explained by student demographics and medical school locations. A higher proportion of FFP students, both domestic and international, are from urban backgrounds and most medical schools are in metropolitan areas or large urban centres. The outcomes may, therefore, be similar to those for other urban background students in urban medical schools.

On the other hand, rural clinical school experience in one metropolitan medical school program has been shown to be at least as influential as rural background,23 suggesting that rural initiatives may be effective for FFP students.

The implications of our findings for Australia’s medical workforce planning could be relatively minor. Domestic FFP students currently comprise a small minority of Australia’s medical students. For international students, a majority of whom want to stay in Australia for at least some postgraduate experience and training, encouragement can be drawn from the finding that specialty choice is similar to that for CSP students. If the number of FFP student places is increased through changes in government policy or establishment of more private medical schools, strategies to increase the focus on rural and other underserved populations might be needed. Unless rural initiatives are extended across public and private medical schools, FFP student places (domestic or international) are unlikely to address the current rural and regional medical workforce shortages or affect the intention to further develop primary care medicine.

The possibility of increased fees for CSP students, and therefore increased debt levels, begs consideration of the potential impact on career preferences. Higher fees might drive interest towards higher-paid, metropolitan specialties. Such an effect might, however, be mitigated by continuing the apparently successful rural medical education initiatives that, although costly, are effective in promoting rural recruitment.23,24

Our study has some limitations. Several initiatives may influence choice of rural locations in the early graduate period. For example, CSP students with rural scholarships are required to work at least initially in non-metropolitan communities, and may also reduce HECS-HELP debt by working in a defined area of need, usually non-metropolitan. Hence it is difficult to be confident that any changes in career preference relate to fee levels or to the existence of fewer rural medical education initiatives for FFP students. Also, we were not able to collect data on debt, and it is possible that students paying high fees could graduate with no debt. Finally, career preference takes several years to become final, so longer follow-up (at least 10 years) is required to produce a more robust analysis based on final career outcomes.

Our data show differences in specialty and location preferences between domestic FFP and CSP students. Consideration should be given to extending rural medical education initiatives across public and private medical school places to ensure that all medical students are exposed to rural and more generalist career attractions.

1 Descriptive statistics for study variables for students who completed the Medical Schools Outcomes Database and Longitudinal Tracking Project exit questionnaire, 2008–2011*


Domestic FFP students (n = 408)

International FFP students (n = 655)

CSP students (n = 3398)


Age in years at entry to medical school, mean (range; SD)

22 (16–53; 4.6)

21 (15–36; 3.0)

22 (15–68; 5.0)

Women

219/408 (53.7%)

371/654 (56.7%)

1924/3398 (56.6%)

Marital status single

318/408 (77.9%)

527/655 (80.5%)

2325/3229 (72.0%)

Urban background

371/408 (90.9%)

596/655 (91.0%)

2650/3398 (78.0%)

Preference for urban future practice

364/390 (93.3%)

481/521 (92.3%)

2686/3258 (82.4%)

First preference for any of the top five income specialties

153/322 (47.5%)

235/552 (42.6%)

1115/2929 (38.1%)

First preference for any of the top six in-need specialties

54/322 (16.8%)

129/552 (23.4%)

737/2929 (25.2%)

First to third preference for any of the top six in-need specialties

151/322 (46.9%)

243/552 (44.0%)

1377/2929 (47.0%)


* Data are number/denominator (%) unless otherwise indicated. † Top six specialties predicted to be in need in 2025.

2 Logistic regression analysis of preference on exit from medical school for rural versus urban future practice (n = 3314)*


Odds ratio (95% CI)

P


Age at entry to medical school

0.96 (0.95–0.98)

< 0.001

Sex

1.24 (1.01–1.53)

< 0.05

Marital status

1.91 (0.70–5.23)

Not significant

Rural background

0.18 (0.15–0.22)

< 0.001

Domestic FFP student by marital status interaction

0.35 (0.14–0.90)

< 0.05

Domestic FFP student

3.36 (1.75–6.46)

< 0.001

International FFP student

1.79 (1.19–2.72)

< 0.01


CSP = Commonwealth-supported place. FFP = full fee-paying. * Independent variable: CSP students versus domestic FFP students (CSP = 0, FFP = 1). Control variables: age at entry to medical school, sex (female = 1, male = 2), marital status (unmarried = 0, married = 1) and rural background of the student (no = 0, yes = 1). † Higher odds ratio indicates preference for urban future practice. ‡ International students were entered into a separate model with the control variables.


3 Logistic regression analysis of first preference on exit from medical school for any of top five income specialties (n = 2945)*


Odds ratio (95% CI)

P


Age at entry to medical school

1.00 (0.98–1.02)

Not significant

Sex

1.55 (1.33–1.80)

< 0.001

Marital status

0.77 (0.64–0.92)

< 0.01

Rural background

0.93 (0.77–1.12)

Not significant

Domestic FFP student

1.37 (1.07–1.75)

< 0.05

International FFP student

1.18 (0.96–1.47)

Not significant


CSP = Commonwealth-supported place. FFP = full fee-paying. * Independent variable: CSP students versus domestic FFP students (CSP = 0, FFP = 1). Control variables: age at entry to medical school, sex (female = 1, male = 2), marital status (unmarried = 0, married = 1) and rural background of the student (no = 0, yes = 1). † Higher odds ratio indicates greater likelihood of choosing high-income specialty. ‡ International students were entered into a separate model with the control variables.


4 Logistic regression analysis of first preference on exit from medical school for working in general practice (n = 2945)*


Odds ratio (95% CI)

P


Age at entry to medical school

1.03 (1.01–1.05)

< 0.01

Sex

0.44 (0.37–0.53)

< 0.001

Marital status

1.55 (1.28–1.89)

< 0.001

Rural background

1.28 (1.04–1.57)

< 0.05

Domestic FFP student

0.71 (0.52–0.99)

< 0.05

International FFP student

0.99 (0.76–1.26)

Not significant


CSP = Commonwealth-supported place. FFP = full fee-paying. * Independent variable: CSP students versus domestic FFP students (CSP = 0, FFP = 1). Control variables: age at entry to medical school, sex (female = 1, male = 2), marital status (unmarried = 0, married = 1) and rural background of the student (no = 0, yes = 1). † Higher odds ratio indicates greater likelihood of choosing general practice. ‡ International students were entered into a separate model with the control variables.


Missing malaria? Potential obstacles to diagnosis and hypnozoite eradication

Poor specimen collection and limited availability of primaquine may be putting patients at risk

Recently, one of us experienced an episode of probable malaria on returning from fieldwork in the Solomon Islands. Although a clinical diagnosis of malaria was made, and the illness responded to empirical therapy with artemether–lumefantrine (Riamet, Novartis), a laboratory diagnosis was not achieved.

Suspected malaria in travellers who have returned to Australia from overseas will present without notice and, owing to the often severe nature of this illness, will require immediate attention. This may occur in localities where personal consultation with an infectious diseases physician is not possible. Primaquine for the eradication of malarial hypnozoites from the liver may not be readily available. In this article, we aim to provide brief expert guidance on the diagnosis of malaria, the use of primaquine for eradication therapy and the implications of the limited availability of this treatment in Australia.

Patients presenting with fever should be questioned about their travel history. Clinicians should be mindful that malarial relapse (Plasmodium vivax and P. ovale) or recrudescence (P. malariae) may occur months, or even years, after primary infection. Further, relapse may be the first symptomatic presentation.1 Therefore, any patient with pyrexia and a history of travel to an endemic area in the past 3 years might be considered as potentially having malaria.2

Initial investigation

Clinical suspicion should be raised in patients who demonstrate specific symptoms associated with the disease, such as relapsing fever, rigors or chills. Note that immune-naive people may not always present with the typical cyclical fevers of malaria.2,3 Unless a separate, simultaneous, pathological process is present (such as concurrent dengue fever, other infections or a non-infectious cause), the presence of localised symptoms, a rash, or the onset of symptoms within the prepatent period (7 days) after initial travel to an endemic area may assist in excluding a diagnosis of malaria.3

Laboratory investigation of patients who potentially have malaria requires blood collected in EDTA anticoagulant tubes immediately on presentation. Both thick and thin film microscopy should be requested. As morphological changes in parasites will develop within hours, blood should be delivered to the laboratory within an hour of collection. Immunodiffusion-based rapid diagnostic antigen tests should also be performed if available, but these tests do not supplant microscopy.4 Currently, there is no consensus regarding the correct timing and number of specimens required to exclude a diagnosis of malaria. It appears that a single collection is often sufficient for diagnosis.3 However, further specimen collections taken shortly after the onset of febrile paroxysms may be necessary for the detection of P. falciparum malaria, as this species is sequestered in the deeper microvasculature at other times during its life cycle.2,3

Returned travellers who have used malaria prophylaxis may occasionally still acquire malaria, even when they strictly adhere to the dosage regimen.1 In such cases, the parasitaemia is often very low, requiring multiple blood collections for diagnosis, but individuals with little or no prior exposure will still be significantly unwell. Very rarely, malaria may be acquired during short stays in endemic areas; for example, during airport stopovers.5

The role of PCR

Polymerase chain reaction (PCR) testing represents a more recent and highly efficacious method for the detection and speciation of malaria in febrile patients. Nevertheless, specimen collection during an afebrile period may lead to a false-negative PCR test result. Due to its expense and limited availability, PCR testing is currently restricted to confirmation and speciation, or cases where a malaria diagnosis is strongly suspected but microscopy and antigen testing are negative.

Primaquine

Infection with relapsing species of malaria (P. vivax and P. ovale) requires eradication of hypnozoites from the patient’s liver using primaquine. P. ovale malaria requires half the dose of primaquine used in cases of P. vivax. Some strains of P. vivax acquired in the South Pacific and South-East Asia may need higher doses of primaquine for eradication.6 Tests for glucose-6-phosphate dehydrogenase deficiency should be performed on all patients before primaquine therapy, in order to avoid potentially life-threatening oxidative events in enzyme-deficient individuals. Currently, primaquine is erratically available in hospital pharmacies and may not be stocked at all in smaller, regional facilities. Also, it cannot be accessed under the Pharmaceutical Benefits Scheme, despite being indicated in Australian therapeutic guidelines.6 These factors limit its availability to hospitals and community pharmacies. For example, when malaria presents and is treated in general practice, the limited availability of primaquine could result in this important therapy not being administered, especially in regional, rural and isolated areas.

In summary, given increasing rates of travel to endemic areas by Australians, clinicians may be faced with a case of malaria at any time. Hence, it is important that they have the correct specimen-collection and treatment protocols at hand. Primaquine should be available through the Pharmaceutical Benefits Scheme to patients treated in a community setting.

Enabling the success of academic health science centres in Australia: where is the leadership?

Lack of policy development hinders the effective integration of research, education and health care delivery

The expanding health care demands of our community require that our health system have an expanding knowledge base, enhanced capability, greater process efficiency and more targeted application of clinical interventions. The search for new groundbreaking discoveries should continue unabated (for example, in replicating the success of statins in ameliorating coronary heart disease or antiretroviral therapy in controlling HIV infection). However, there is an equally important, immediate and ongoing daily need for all patients to receive better, safer and more efficient care from highly competent health professionals using existing knowledge and resources. This responsibility must be shared between health administrators, front-line health professionals, and academic teachers and researchers.

In recognition of this shared responsibility, at least four academic health science centres (AHSCs) have been established in Australia in the past 5 years. They comprise partnerships or collaborations between universities and their affiliated research institutes and health service organisations.

There is no universally agreed definition of an AHSC, but most are alliances of geographically co-located entities, with varying descriptions of what they actually do or hope to achieve. However, all AHSCs are committed to a tripartite mission of advancing research, education, and patient care. This mission presents challenges for AHSCs worldwide in responding to demands for high-value, patient-centred care and improved population health. Historically, the research stakeholders within AHSCs have attracted funding primarily to conduct basic research and biomedical studies aimed at new diagnostic and therapeutic discoveries, with less emphasis on education, patient care (especially primary care and preventive medicine), and health services research.1 However, this is likely to change as AHSCs realise they must match their pre-eminence in the science of discoveries with equal commitment to translational and implementation science focused on health system improvement.2 Can AHSCs truly claim to excel in scientific discovery if they are not researching ways of making clinical services more reliably excellent? Can they truly claim to teach high-quality medicine without consistently providing high-quality care? The AHSC needs to be defined as a centre of learning committed to improving health and health care by advancing, applying and disseminating knowledge through a learning health system.

Defining stakeholder roles and functions

Putting this ubiquitous aim of high-quality care for all into operation is the prime responsibility of health departments and health services, and is exacted by multiple key performance indicators (KPIs) and contractual obligations applied to their staff. Universities and research institutes are also subject to a regulatory system, but one that involves different performance measures centred on research output and academic excellence. These different objectives constrain the development of integrated health, education and research partnerships, which need to share a set of common objectives, incentivised by funding arrangements that all parties in the alliance can sign up to.

Such convergence is possible and necessary. In exploring new and better models of care, managers are seeking front-line clinician–researchers with leadership skills who can assist in the process. Engaging practising health professionals in the science of health service innovation presents a challenge. Specialty colleges and other professional bodies need to view and endorse AHSCs as one means of engaging their clinician constituency in health system improvement and the acquisition of requisite skills.3 Front-line consumers of health care must also be involved in determining priorities for research and service delivery.

In turn, senior government representatives and policymakers must show leadership in endorsing and resourcing ASHCs as vehicles for drawing together, with appropriate balance, all of the endeavours directed towards improving health care for, and the health of, the community. Health service managers need to make their services more research-friendly by actively facilitating research governance, ethics approvals, participant access and recruitment, and data collection systems.

The success of AHSCs as vehicles underpinning learning health systems requires structural alignment and functional integration of research, education and clinical service delivery. Accountability for each of these three elements, which are currently held by different agencies (traditionally universities and research institutes for research, teaching hospitals for education, and hospitals and health services, including primary care, for clinical services), must be brought together under one integrated learning health framework. This will not be easy. It requires both bottom-up leadership by local academic and clinical leaders and top-down leadership from government departments, statutory bodies and health service administrations. The boards of AHSCs must overcome the current physical, financial, administrative, professional, legal and historical factors that currently constrain research, education and service excellence within the individual partnering organisations. The operations of these new partnerships must be aligned so that new and better ideas and technologies that solve priority population health problems can be introduced more quickly, efficiently and effectively.

Encouragingly, there is evidence that the need for such alignment is recognised and is beginning to happen within AHSCs in the United States,4 United Kingdom5 and Canada,6 driven in no small measure by government policies, such as the Affordable Care Act 2010 in the US, and the Health and Social Act 2012 in the UK. In particular, AHSCs in the UK are now being surrounded by academic health science networks to ensure broader implementation of knowledge into patient care.5 In Australia, calls for recognition of the value of university teaching hospitals7 have drawn attention to our nation lagging behind international developments in integrating science and clinical service delivery,8 and have advocated for government action in developing AHSCs.

The research community perspective

In late 2010, the National Health and Medical Research Council (NHMRC) released a discussion paper that proposed to “invite consortia of universities, hospitals and medical research institutes to apply for recognition for excellence in research and research translation”.9 The NHMRC proposed that such centres be designated “Advanced Health Research Centres”. This descriptor was criticised by deans from the Group of Eight Universities8 for its eschewing of academia. The apparent tight alignment of “excellence” with basic science research, disproportionately rewarded by the NHMRC project grants system,1 also constrained any significant shift of academic mindsets towards applied clinical research and implementation of knowledge. This shortcoming was further profiled in the McKeon Review of health and medical research (HMR) in Australia,10 commissioned by the federal government. That review involved a wide diversity of stakeholders, and it proposed “an overarching message . . . [about the] lack of a sufficiently strong connection between HMR and the delivery of healthcare services”.10 It highlighted the need for an academic leadership body, as well as financial commitment and closer integration of research centres, if research was to be better embedded in the health care system. It also recognised the need for more commercialisation of research in parallel with translating evidence into practice. The review was released in February 2013, but the federal government is yet to formulate a policy and a structure for meeting these identified needs.

This shift towards closer integration between those who generate and those who use research has continued with the establishment of an NHMRC research translation faculty and, more recently, calls for submissions from academic and health care precincts to be recognised as Advanced Health Research and Translation Centres (AHRTCs).11 This new concept places yet more emphasis on how the scientific output of AHRTCs directly influences clinical practice and teaching, health care policies, and population health outcomes, both locally and more broadly.

Uniting for a common cause

We acknowledge that the prevailing uncertainties in the absence of a national plan for AHSCs may make whole-hearted commitment to comprehensive integration of academic and service organisations more difficult. Universities and biomedical research institutes are concerned that some of their research funding may be diverted to health service delivery, while health services have concerns that the reverse could occur, especially given the potentially large scope of clinical and health services research that will be required to drive evidence implementation and innovation across the entire health care system.

This uncertainty impedes a concerted effort to bring applied clinical and health services research into both mainstream academia and service delivery, as evidenced by the relatively few centres of clinical effectiveness or health service evaluation in this country. Although the science of implementation is receiving increasing attention internationally,12 maximal benefit from clinical research, knowledge translation and service innovation will only be realised by collaborative academic–service partnerships that cover the whole spectrum, from basic science to front-line patient care. Within such partnerships, the mindsets of all agencies and individuals involved, including those of practising clinicians, must converge on creating learning health care systems that aspire to deliver the best possible health care within declared financial constraints. Strategies for facilitating such convergence in our AHSC13 are provided in the Appendix.

The mission for AHSCs and AHRTCs is to serve as vehicles for integrating academia and service delivery for the benefits of the community. Whether they succeed will depend on whether the partnering organisations within them, government departments, the NHMRC and the health professions believe in their worth and are prepared to openly support them with the required resources and governance frameworks. We challenge government and all key stakeholders to step forward and develop policies for ensuring their creativity, relevance, and sustainability.

Leading the rebirth of the rural obstetrician

In 2002, 30% of all Australian births occurred in non-metropolitan hospitals, and 57% of these hospitals did not provide specialist obstetric cover.1 Antenatal care led by general practitioner obstetricians is offered in 50% of South Australian and Victorian public hospitals and is the only public sector model in most non-metropolitan hospitals.2 GP obstetric care has been shown to provide safe care for pregnant women at low risk of complications, and access to such services in rural Australia is essential.38

A looming crisis in the provision of rural obstetric services in Australia was identified in 2007.9 An important study of survey data from 2003 reported that Victorian GPs were becoming less likely to provide obstetric management and that half of the existing GP obstetricians intended to cease practising in the next 5–7 years. In addition, they found that 71% of GPs who completed a Diploma of the Royal Australian and New Zealand College of Obstetricians and Gynaecologists (DRANZCOG) did not then go on to practise independent procedural general practice obstetrics.9

Factors contributing to the forecast deficit in GP obstetric services included a rise in specialisation, centralisation of services, concerns regarding indemnity and litigation, rural workload and difficulty maintaining competence.9,1013 The problem of maintaining competence in rural environments has been compounded by reported difficulties in accessing appropriate locum coverage to allow attendance at upskilling courses, in addition to the time and travel required to participate.10

The impending shortage of GP obstetricians and the need for strategies to train, retrain and retain GP obstetricians in rural practice have been the integral considerations in developing a comprehensive training and support program offered in the Gippsland region of rural Victoria. The Gippsland region lies east of Melbourne, covering a land mass of 41 524 square kilometres, and has a population of around 240 000.14 The program by Southern GP Training (SGPT) combines training for registrars and upskilling of GP obstetricians with strategies aimed at overcoming the professional isolation confronting rural GP obstetricians. The program (outlined in the Appendix) expanded registrar training at the larger regional (specialist-led) units to include a 3-month rotation on secondment to a metropolitan hospital. Further training was extended to include a state government-funded 6- or 12-month placement in a GP-led obstetric practice (bridging post) with secondments to larger centres; provision of a clear, individualised postdiploma pathway with supported placement in a GP-led, community-based obstetric practice; continued professional development; upskilling of existing GP obstetricians through the DRANZCOG Advanced qualification, which includes competence in performing caesarean sections; regular GP obstetrician meeting days attended by both registrars and practising GP obstetricians; specialist-led support and mentoring through a regular email forum; and specialist involvement in subregional GP perinatal education and morbidity meetings. In this way, the model provides a supported transition from specialist-led hospital obstetric units to GP-led, community-based obstetric services and integrates this with support for practising GP obstetricians.

The program is continuing to evolve, with new developments such as rotations to the Northern Territory and Pacific islands,15 to enrich the experience of the trainees. The implementation of this program has been matched by a period of recovery for Gippsland maternity services with an increase from 31 GP obstetricians in 2007 to 39 in 2013, including an increase from 10 to 23 conducting caesarean sections. This represents a reversal of the pre-existing trend in service closures.9,16 Of the 39 currently practising GP obstetricians, 18 received their training in the SGPT Gippsland obstetric training program.17 Another three trainees went on to practise GP obstetrics elsewhere, meaning that 21/33 program graduands were active in procedural practice.17

Recent government initiatives have supported GP obstetricians through funding professional development, incentive payments for upskilling, annual incentives for continuing GP obstetric practice and indemnity insurance support. These developments have removed some of the structural disincentives identified as barriers to procedural obstetric practice.

The aims of our study were to understand the factors influencing the decisions of rural GPs and GP registrars to practise obstetrics, and to understand the impact of this innovative GP obstetric training and support program on these decisions.

Methods

Our research was conducted in Gippsland in July and August 2013. Within the region, there are three specialist regional centres that offer a GP-led model of obstetrics, and five hospitals with GP-led services only, all with the facilities for caesarean sections.

Participants were identified from training records and the GP database of the past 5 years for the SGPT GP obstetrician and registrar training and support program. Letters of invitation, explanatory statements and consent forms were sent to potential participants.

We adopted a qualitative approach using semistructured face-to-face interviews.1820 The research questions examined were:

  • What challenges face rural GPs in practising obstetrics?
  • What impact has the Gippsland GP obstetric program had on GP obstetric career decisions?

A three-stage framework method of data analysis (data display, data reduction and data interpretation) was applied,21 and measures were employed to augment the validity and reliability of this research. To ensure correct and detailed collection of participants’ experience and views, all interviews were audiotaped, and copies of the transcripts were provided to participants to check for accuracy. Recorded interviews were analysed by two researchers for credibility and validation of the analysis. Analysis of the transcripts, once uploaded into NVivo 10 (QSR International), was conducted independently by two researchers to check interrater reliability of the emerging themes.

Ethics approval was obtained from the Monash University Human Research Ethics Committee for this research.

Results

Of the 60 potential participants contacted, 22 agreed to take part. The sample included registrars, GPs who were upskilling and established GP obstetricians who supported registrars in training. Interviews ranged from 40 to 90 minutes in duration.

Six major themes emerged: isolation, work–life balance, safety, professional support, structured training pathway and effective leadership.

The first three themes relate particularly to the first research question.

The theme of isolation included the subthemes of distance from specialist services, access to assistance, and access to professional development. The challenge of isolation came with the awareness that it was critical to have the confidence and competence to handle difficult situations and that access to assistance and advice was important. When experienced GPs talked about the impact of isolation, their comments were focused on managing a situation, often in the context of access to assistance from a local team.

Neonatal Emergency Transfer Service (NETS) can come down, [but due to] the weather, it may be several hours before they can … the GPs rally around and can keep working on the babies, intubate them, and keep breathing for them. It is not ideal, but it works well most times. (Participant t)

Comments about isolation from registrars and GPs who were at an earlier career stage focused on how access to assistance with the guidance and information available through the SGPT program ameliorated this isolation.

I’ve got someone to call on at the drop of a hat if I am out of my depth at any point, even if it’s just for advice over the phone. (Participant e)

The theme of work–life balance included the subthemes of impact of after-hours call out, the demands of emergency situations, dealing with scheduled patients at the clinic after being at deliveries during the night, and family commitments.

Obstetrics interrupts the rest of life, both clinical, family life, and sleep. You know to be woken up in the middle of the night … isn’t a particularly pleasant thing, and try getting back to sleep after all the excitement. (Participant g)

Being part of a team of GP obstetricians assisted in achieving an acceptable work–life balance.

The theme of safety was mentioned more often by doctors who were at an early point on their career trajectory. This theme included the subthemes of patient safety and practitioner safety. Patient safety was related to backup and competence, while practitioner safety was about feeling supported and having confidence in dealing with the unknown. The SGPT Gippsland program was seen to contribute to improving safety.

Because (obstetrics) is a high-risk area and people burn out. They [SGPT] don’t want us having disastrous situations when we are junior. (Participant a)

The second three themes —professional support, structured training pathway and effective leadership — relate particularly to the second research question. Professional support was mentioned by all 22 participants. Participants from all groups within the cohort commented on the quality and availability of professional support within the Gippsland program. This theme included the subthemes of professional backup, professional networks and a respectful learning culture. With regard to professional backup, the availability of backup from specialists was described as timely and appropriate, as nominated mentors assisted with advice on practice in the clinic, and teams were built to support the training experience. Doctors in training and doctors in independent practice perceived they were well supported professionally.

When you are training you are always first on call, which is fantastic because you have to deal with everything that walks in the door. But you are paired with a consultant on the day. You basically run your assessment with them and see if they are happy with your plan, and for any instrumental deliveries or complicated issues you contact them to come in. So, it is very well supported. (Participant d)

Involvement in the Gippsland program made available both formal and informal professional networks to participants. The professional networks provided an environment where people at all stages of their career received support and timely, up-to-date information. Regular professional development opportunities were a valuable component, strengthening these networks and providing opportunities to reflect on best practice.

Ongoing professional development offered is fantastic, as it keeps you abreast of new developments as well as provides an opportunity for professional networking. (Participant v)

A respectful learning culture with an emphasis on empowering and enabling participants was an important component of professional support.

Respect is a huge factor; the leaders in the program lead by example and are very inclusive and respectful of individuals’ experience and needs. (Participant u)

The structured training pathway theme emerged as an important component of the Gippsland GP obstetric program. This included the subthemes of community-based bridging posts for registrars; secondment for additional experience; and continuous professional development. Registrars rated the bridging posts as critical to offering a safe transition.

I think it is about fostering supported practice and this is a particular time of vulnerability in terms of support … the movement from hospital-based practice to being a new person in community-based practice. (Participant g)

The theme of effective leadership was apparent across all interviews. There was clearly the perception of supportive, knowledgeable and respectful leadership within the program, and this was highly valued.

They are definitely good mentors and good role models and that is part of the reason … to want to keep going with this pathway. (Participant f)

Discussion

The themes of isolation, work–life balance and safety for the practitioners and patients emerged in our study as substantial challenges for rural GPs in practising obstetrics. These findings are consistent with the findings of other researchers who have studied the challenges of rural and remote medical practice more broadly.22,23 Work–life balance is particularly important for sustainable practice24 and is vulnerable to the demands of isolated obstetric practice. Our study indicates that the Gippsland GP obstetric program has contributed to a recovery and retention of maternity units in Gippsland founded on its success in helping doctors deal with these challenges.

Participants found the obstetric program to be professionally supportive, with meaningful backup, advice and support of professional development. The program has also been instrumental in building and supporting professional networks. Reliable, relevant backup and advice ameliorates isolation and enhances patient and practitioner safety. Professional networks remove isolation and enable cooperative rostering, which is a means to improving work–life balance. In this way, the SGPT Gippsland GP obstetric program would seem to have become fundamental for sustaining GP obstetric practice in Gippsland.

Our study suggests that the structure of the Gippsland GP obstetric training enables its trainees to continue into active, independent procedural obstetric practice. The bridging post after the primary training was highly valued. A large decrease in use of procedural skills 1 year after their primary procedural training has been reported previously.9,25 Supported transition after completion of hospital-based training has been found to be an important factor influencing recently qualified GPs to continue into independent procedural practice.25 Structured, respectful clinical supervision by senior role models is vital to effective postgraduate medical education,26 with the supervision relationship being shown to be more important than the supervision method.27

Leadership was clearly a major factor in the impact and success of the SGPT Gippsland GP obstetric program. This leadership was provided by committed specialist obstetricians and active GP obstetricians.

There was a notable absence in the data of mention of financial disincentives to practising GP obstetrics. This suggests that disincentives identified previously1 have been largely removed by recent government initiatives in this area.

This study was conducted in a particular geographic area, so transferability of the results cannot be assumed. In particular, this program was introduced where a shortage of GP obstetricians was forecast but not yet apparent. The participation of GP obstetricians was key to the success of the program. Therefore, this program design may not be as effective where GP obstetrician shortages already exist. However, themes such as isolation, safety and leadership are likely to be relevant in most rural settings, and the strength of these themes across the different practitioner groupings and towns suggests that the findings are generalisable. The stratified sampling method used was a strength of the study.

Our study also suggests that the Gippsland GP obstetric program has had a substantial impact on trainees continuing into active obstetric practice and on GP obstetricians continuing in their obstetric practice. This innovative program was made possible by state and federal government funding, the support of local and metropolitan hospitals, and ownership by both specialist and GP obstetricians. Leadership, organisational support and administrative support by SGPT have provided the scaffolding for the program. Key features of this training include a supported transition into community-based GP obstetrics; adequate clinical exposure through secondments; a culture supportive of GP obstetrics; building and sustaining professional support networks; and inspirational leadership. The increase in numbers of practising GP obstetricians has enabled more acceptable rosters and greater flexibility in accommodating personal commitments. These key features should be foundational considerations in replicating this successful model elsewhere.