×

AMA in the News

Your AMA has been active on policy and in the media on a range of issues crucial to making our health system better. Below is a snapshot of recent media coverage.

 Print/Online

Baby shaking on par with road toll, The Australian, 10 September 2015

New research shows shaking kills as many Australian babies and toddlers as car crashes. AMA President Professor Brian Owler said The Children’s Hospital at Westmead in Sydney was treating a case every month.

AMA urges surgeons to cut bullying, The Age, 11 September 2015

A Sydney senior surgeon whose comments on sexual harassment helped draw attention to widespread bullying in the profession has warned that it will be difficult to fix the problem. AMA President Professor Owler said it would be up to the current generation of surgeons to ‘‘break the cycle’’ of bullying, harassment, and discrimination in the profession.

Calling for review of health fund crisis, The Daily Telegraph, 12 September 2015

Health bodies are demanding a radical review of the private health system as health fund premiums skyrocket, hospital price gouge, and funds slash benefits. AMA President Professor Brian Owler demanded Federal Government intervention as he revealed NIB had removed more than 225 items from its schedule of medical benefits.

Boxer dies after title fight at RSL club, Sydney Morning Herald, 16 September 2015

A 28-year-old Australian boxer has died in a Sydney hospital after being knocked out in an IBF regional title fight. The AMA has released a position statement calling on boxing to be banned from the Olympic Games and the Commonwealth Games.

Medicare review placates AMA by agreeing to stagger changes, The Australian, 17 September 2015

The powerful AMA has won an early concession out of much-anticipated Medicare reforms, with the head of a review taskforce agreeing that recommend changes should be staggered to protect doctor and practice incomes.

‘Junk policies’: the private health cover ripoff, Sydney Morning Herald, 24 September 2015

Fewer than half of all private health insurance policies offer adequate cover for private hospital care, and many patients have no idea what their insurance includes, new figures show. AMA President Professor Brian Owler said policies that insured private patients in only public hospitals were junk policies and should not be allowed.

$20bn addiction to Medicare, Adelaide Advertiser, 28 September 2015

The cost of procedures covered by the Medicare Benefits Schedule has more than doubled to $20 billion a year over the past decade despite much smaller increases to Australia’s population. AMA President Professor Brian Owler said he agreed that Medicare needed to be modernised.

Authorisation to sedate ice addicts welcomed by the AMA, The Age, 28 September 2015

The AMA has welcomed new powers for emergency doctors and nurses to subdue violent ice addicts. AMA president Professor Brian Owler said doctors had already called for all hospitals to have appropriate security to deal with the increasing number of patients affected by ice.

BUPA, nib, Medibank back health review, Australian Financial Review, 29 September 2015

Health Minister Sussan Ley has dismissed the doctors’ lobby’s objections to a review of Medicare, saying the health care system is plagued by ineffective and unnecessary medical procedures and desperately needs reform. AMA President Professor Brian Owler accused Ms Ley of using the review to “cut health funding and health services” and “publicly attack the medical profession”.

Playing doctors and curses, Courier Mail, 29 September 2015

The Turnbull Government has cautioned patients against diagnosing themselves on “Dr Google” and then demanding unnecessary and costly treatments from medicos. AMA president Professor Brian Owler said it was wrong to attack doctors to try to justify cuts to Medicare.

Fees for all finished as uni plan gets the third degree, Adelaide Advertiser, 2 October 2015

Tony Abbott and Christopher Pyne’s controversial plan to allow universities to set their own fees has been dumped, in one of the first major policy shifts of the new Turnball Government. AMA president Professor Brian Owler welcomed the decision, and called on the Government to give students more certainty that degrees will not be priced out of reach.

Backing for RCH doctors, The Herald Sun, 12 October 2015

Victoria’s Health Minister Jill Hennessy has led a resounding show of support for the Royal Children’s Hospital’s demands that children be removed from immigration detention centres. AMA President, Professor Brian Owler, urged Mr Turnbull and Immigration Minister Peter Dutton to intervene.

Surgeon’s road safety plea, The Daily Telegraph, 17 October 2015

AMA President Professor Brian Owler said every new car should by law have autonomous emergency braking to stop rear-end car crashes.

Brain-injury teen stranded by beds deficit, Canberra Times, 23 October 2015

A teenage boy with a critical brain injury was blocked access to the Sydney Children’s Hospital for four days because there were not enough beds, his family was told. AMA President Professor Brian Owler said the incident highlighted that there was an issue with capacity in paediatric hospitals, both at Westmead and the Sydney Children’s Hospital.

Doctors resist camp return of asylum pair, The Age, 12 October 2015

Doctors at Melbourne’s Royal Children’s Hospital refused to discharge an asylum seeker and her child because the immigration department would have sent them back to detention at the expense of their health. AMA Vice President Dr Stephen Parnis said the association had a fundamental problem with keeping children in detention, and had been urging governments to look for any alternative to it for years.

Codeine medicines to be prescription-only next year, The Age, 2 October 2015

Common painkillers such as Nurofen Plus and Panadeine could soon require a doctor’s prescription after a shock decision by Australia’s drug regulator. AMA Vice President Dr Stephen Parnis backed the TGA’s judgement.

Radio

Professor Brian Owler, 2UE Sydney, 10 September 2015

AMA President Professor Brian Owler discussed new research which indicated that shaking kills as many Australian babies and toddlers as car crashes. Professor Owler said the Westmead Children’s’ Hospital treated a case every month.

Professor Brian Owler, 2UE Sydney, 28 September 2015

AMA President Professor Brian Owler talked through his concerns about the upcoming Medicare review and the approach that the Government was taking. Professor Owler believed it would lead to a cut to the number of services patients can access.

Professor Brian Owler, Radio National, 1 October 2015

AMA President Professor Brian Owler talked about the Turnbull Government shaking up the Medicare Benefits Schedule, with Health Minister Sussan Ley launching consultations on a review of nearly 6000 taxpayer-subsidised items on the schedule

Dr Stephen Parnis, 774 ABC Melbourne, 2 October 2015

AMA Vice President Dr Stephen Parnis talked about the rules changing around getting codeine from the chemists. Dr Parnis said the TGA, which determines what things need to put on prescription, has had an inquiry about over-the-counter medications which contain codeine.

Dr Brian Morton, ABC Gippsland, 7 October

AMA Chair of General Practice Dr Brian Morton talked about Mental Health Day and said that all employees were allowed to have ten sick days per year. Dr Morton said but it will still depend on the reason and what you will do with the sick days you will take.

Dr Stephen Parnis, 612 ABC Brisbane, 9 October 2015

AMA Vice President Dr Stephen Parnis discussed calls from health academics to ban energy drinks for people younger than 18 years of age. Dr Parnis said stimulants in the products could cause heart rates to reach dangerously high levels, arrhythmias, problems to blood vessels, difficulties sleeping or anxiety.

Dr Stephen Parnis, 3AW Melbourne, 11 October 2015

AMA Vice President Dr Stephen Parnis talked about Royal Children’s Hospital doctors protesting the detention of children in Australian detention centre. Dr Parnis said the AMA is very supportive of getting all children out of immigration detention and says they can’t see any good coming out of the situation.

Dr Brian Morton, Radio National. 21 October 2015

AMA Chair of General Practice Dr Brian Morton talked about the idea of shared doctor appointments. Dr Morton said privacy could be an issue in shared appointments.

Professor Brian Owler, ABC NewsRadio, 23 October 2015

AMA President Professor Brian Owler talked about a new domestic violence campaign being launched by the AMA. Professor Owler said doctors are being encouraged to report domestic violence.

Professor Brian Owler, 2UE Sydney, 23 October 2015

AMA President Professor Brian Owler discussed the Sydney Children’s Hospital turning away a teenage boy with a brain injury because there were not enough beds.

Television

Professor Brian Owler, Sky News Sydney, 27 September 2015

AMA President Professor Brian Owler talked about the Federal Government reviewing the Medicare system. Dr Owler said the AMA were willing to engage with the Federal Government, but says their discussion paper does not allow new procedures to be added.

Professor Brian Owler, Channel 9, 12 October 2015

AMA President Professor Brian Owler speaks to the Today Show about the Royal Children’s Hospital in Melbourne remaining locked in a bitter dispute with the Federal Government over their refusal to discharge asylum seeker children.

Professor Brian Owler, ABC News 24, 23 October 2015

AMA President Professor Brian Owler talked about the AMA launching a new domestic violence campaign, including a video encouraging patients to confide in their GPs. Professor Owler said there were “far too many” cases of domestic violence, affecting both women and children. 

Dr Stephen Parnis, ABC News 24, 28 September 2015

AMA Vice President Dr Stephen Parnis discussed a Four Corners investigation that claimed the medical profession was over-servicing patients and ordering wasteful and potentially dangerous scans. Dr Parnis denied that doctors were over-servicing, but said there was a lot the AMA agrees with when it comes to more judicious care.


Continuous quality improvement and metabolic screening during pregnancy at primary health centres attended by Aboriginal and Torres Strait Islander women

Attending to perinatal risk factors, such as diabetes and hypertension during pregnancy, obesity and excess gestational weight gain,15 is important for optimising maternal and infant health outcomes. Pregnancy is also a key period for implementing strategies that prevent long-term adverse health outcomes, as excess gestational weight gain and gestational diabetes mellitus (GDM) are respectively predictors of long-term obesity6 and the development of type 2 diabetes.7

Screening for and follow-up of metabolic risk factors are components of recommended pregnancy care in Australia.8 Ensuring that Aboriginal and Torres Strait Islander (respectfully referred to in this article as Indigenous) women receive such care is expected to contribute to giving babies a healthy start to life and to improving the health of their mothers. In Australia, low birth weight, premature birth and perinatal death are substantially more frequent in Indigenous than in non-Indigenous pregnancies.9 Obesity, pre-existing diabetes and GDM are some of the risk factors that are more common in Indigenous women.3,4,10 Later in life, cardiovascular disease and diabetes are major contributors to the difference in life expectancy between Indigenous and non-Indigenous Australians.11

As care can differ between health centres with different characteristics, such as urban and rural or remote locations,8 effective long-term strategies are needed across a range of settings to facilitate the provision of all components of recommended pregnancy care.12 The Audit and Best Practice for Chronic Disease (ABCD) National Research Partnership13,14 aims to improve the provision of care by primary health care centres (PHCs) serving mainly Indigenous populations. It uses a continuous quality improvement (CQI) framework to increase the efficiency and effectiveness of organisational systems. Previous ABCD Partnership research indicates that increases in self-ratings of organisational systems are associated with improvements in the delivery of health care for those with type 2 diabetes.15

We investigated screening for metabolic risk factors during pregnancy and follow-up actions by PHCs participating in the ABCD partnership. We also investigated associations between self-ratings by organisational systems and the proportion of women who undergo metabolic screening.

Methods

The study was approved by human research ethics committees in the relevant states and territories, and by Indigenous subcommittees where required.16 The analyses were approved by the Monash University Human Research Ethics Committee (CF12/3434-2012001670).

Study design and setting

The ABCD National Research Partnership study protocol has been described in detail elsewhere.13,16 This partnership links multiple PHCs and stakeholders across the health system in collaborative CQI research.14 One21seventy, the National Centre for Quality Improvement in Indigenous Primary Health Care, supports CQI in PHCs by providing evidence-based practical tools and training.14 The ABCD Partnership has access to One21seventy data from PHCs that have volunteered to participate in research.13,14 This article reports longitudinal analysis of data from 76 PHCs (2592 health records) involved in the ABCD Partnership across five Australian states and territories. The PHCs conducted up to four CQI cycles, comprising 58.5% (168 of 287) of the One21seventy maternal health audits conducted between 2007 and 2012. Twenty-one of the 76 PHCs began maternal health auditing in 2007; 13 commenced in 2008, 13 in 2009, 11 in 2010, 10 in 2011, and 8 in 2012. Depending on their needs, PHCs may focus in some years on CQI activities in other clinical areas; of 50 PHCs that had completed two or more maternal health audits, 11 (22.0%) conducted audits in non-consecutive years.

Intervention: continuous quality improvement cycles

At baseline, systems assessments and audits of health records were conducted and the results provided to PHCs in real-time by an automated CQI reporting system. PHCs use the reports for participatory interpretation and goal setting, and this is followed by the initiation of relevant actions. Data collection was repeated in subsequent years to assess success in improving care (end of cycle 1), and to identify new priorities for improvement (start of cycle 2). PHCs are encouraged to complete one cycle each year.

Maternal health audit tool

Recorded pregnancy care was assessed by auditing the health records of women with a recent pregnancy (mothers with an infant aged 2–14 months, who resided in the community during their pregnancy and attended for pregnancy care at least once).13,16 Audits were conducted by trained auditors (local PHC staff, staff from other PHCs, or CQI facilitators) supported by a standard protocol and regional CQI facilitators. The audit tool and parameters of the outcome measures were based on best practice guidelines, policy and research reports, and stakeholder consultations.16 At each PHC, the auditor used a standard sampling protocol to select a random sample of at least 30 records to audit (if fewer than 30 eligible records were available, all were audited).13

The Systems Assessment Tool

Structured assessments of PHC system strengths and weaknesses were conducted by PHC staff together with a trained external CQI facilitator using the Systems Assessment Tool (SAT).13,15 This consensus process produces a self-reported overall mean score (range, 0–11) for the state of development of PHC organisational systems, and five subscale scores (delivery system design, information systems and decision support, self-management support, external links, and organisational influence and integration).

Key outcome measures

The audit tool collected information on documentation of the following items in each health record:16

  • body weight, body mass index (BMI) and blood pressure (BP) screening in women attending at earlier than 13 weeks’ gestation;

  • BP checks at any point during the pregnancy;

  • a 50 or 75 gram glucose challenge test (GCT) and, if indicated, an oral glucose tolerance test (OGTT) at 20–30 weeks’ gestation;

  • for women with a BMI under 20 or over 30 kg/m2: development of a BMI management plan;

  • for women with high BP (≥ 140/90 mmHg): repeated BP measurements, urine tests for protein, examination by or referral to a general practitioner or obstetrician, or prescription of anti-hypertensive medication;

  • an OGTT for those with an abnormal GCT result (plasma glucose concentration ≥ 7.8 mmol/L 1 hour after a 50 g glucose load (morning, non-fasting), or ≥ 8.0 mmol/L after a 75 g glucose load).

“Follow-up” in this article refers to taking the next appropriate action after an abnormal screening result.

Statistical methods

Analyses were conducted using Stata version 12.1 (StataCorp). P < 0.05 (2-sided) was defined as statistically significant. Differences in screening proportions at baseline and at the final audit were assessed with respect to PHC governance, location, population size (t tests or Mann–Whitney U tests) and state or territory (one-way analysis of variance or Kruskal–Wallis tests). Paired t tests assessed differences between the first and last SAT scores. Using each health record as the unit of analysis, random effects logistic regression analysis (generating odds ratios) assessed any associations between metabolic screening and CQI cycle number (Stata xtlogit command). Random effects logistic regression allowed for repeated measures of each outcome (eg, did a patient receive a BP check: yes or no) at each cycle per PHC. This method also allowed for adjustment for similarities in women within each PHC. The reference group comprised audit data from the PHCs before they had conducted a CQI cycle (ie, cycle 0 or baseline). We also tested for a trend to increased metabolic screening with each additional CQI cycle (Stata nptrend command).

For each PHC, the proportion of women receiving screening after each CQI cycle was calculated. Treating each PHC as the unit of analysis, univariable linear regression (generating β coefficients) assessed associations between:

  • the average proportion of women who underwent screening across all cycles, and average overall or subscale SAT scores;

  • the total change (from first to final cycle) in the proportion of women who underwent screening, and the total change in overall or subscale SAT scores.

Results

A range of PHC settings were included in the study. Most women who attended these PHCs for pregnancy care were Indigenous Australians (87.9%) (Box 1).

While most women who attended during the first trimester were weighed, the BMI was calculated for less than a third; but women attending after the PHC had conducted at least one CQI cycle were more likely to have had their BMI assessed than women attending PHCs that had not done so. Similar patterns were observed for BP checks at any point during the pregnancy and diabetes screening. Improvements in screening appeared to be sustained over sequential CQI cycles, and there were trends for additional improvements with each additional cycle (Box 2).

At baseline, the only significant differences in screening were those between states and territories for first trimester BP checks (P = 0.04), BP checks at any stage of the pregnancy (P = 0.02) and diabetes screening (P = 0.002). These differences were not significant at the PHCs’ final audits (all P > 0.05).

There were also indications of sustained improvements in the provision of follow-up actions after CQI participation, but the sample sizes were too small for statistical analysis. Follow-up actions for high BP included repeated BP assessment (pre-26 weeks, 88.1%; post-26 weeks, 91.9%), urine tests (pre-26 weeks, 88.1%, post-26 weeks, 83.9%), referral (pre-26 weeks, 85.7% post-26 weeks, 94.3%) and antihypertensive medication (pre-26 weeks, 42.9%, post-26 weeks, 26.4%). Follow-up OGTTs were reported for most women who received an abnormal GCT result. Few women with an abnormal BMI, however, had a documented BMI management plan (Box 3).

Systems assessment data were available for 35 PHCs (46.1%); data were available for more than one time point for 21. The mean overall SAT score at the final cycle (7.36) was statistically significantly higher than at the first cycle (6.23; P = 0.009), but there were no significant differences in SAT subscale scores between the first and final cycles (data not shown). Higher average self-ratings of some organisational systems were associated with greater provision of metabolic screening (Box 4). For example, the average provision of first trimester BP screening was 3.7 percentage points higher for each additional point scored on the SAT information systems and decision support domain. Diabetes screening was associated with higher overall self-ratings, as well as with higher ratings of self-management support systems, and of organisational influence and integration.

In addition, there was a statistically significant association between a one-point increase from first to final assessment in information systems and decision support scores and an increase of 5.7 percentage points in the proportion of women receiving diabetes screening between the first and final audits (β = 5.7; 95% CI, 0.6–10.9; P = 0.03). However, no other significant associations between changes in SAT scores and screening were detected (data not shown).

Discussion

This large longitudinal study of PHCs found substantial improvements in routine metabolic screening in pregnancy associated with participation in a CQI initiative. Improvements were sustained over multiple cycles, with evidence for additional improvements with each consecutive CQI cycle. Initiation of follow-up actions also improved after CQI participation. Higher self-ratings of some organisational systems were significantly associated with greater metabolic screening.

Screening at baseline was incomplete for all the metabolic risk factors investigated, consistent with reports from other Indigenous communities.17 It is unclear whether metabolic screening coverage in other maternity care settings is incomplete, as this information is not reported in other routine perinatal data collections. However, improvements associated with CQI participation were observed with respect to BMI and BP assessment and screening for diabetes during pregnancy. Measurement of BMI early in pregnancy is important because maternal and neonatal morbidity increases with maternal BMI,3 and the recommended gestational weight gain depends on the BMI category.1 Measurement of BMI may be influenced by both the mothers’ and health professionals’ understanding of the importance of healthy gestational weight gain and awareness of weight gain guidelines, and by the confidence of health professionals that they can discuss weight with women without causing undue concern.18 It is encouraging that we encountered no instances of women who declined to be weighed. Similarly, first trimester BP assessment and universal second trimester GDM screening are also recommended in Australia, and these remain areas for improvement. It is important to explore potential barriers to GDM screening, both because the prevalence of diabetes during pregnancy is higher among Indigenous women than in non-Indigenous women4 and because of the importance of diabetes management during pregnancy.4

Pregnancy is an opportune time for health practitioners to discuss weight management with women.19 However, few women in this study with an abnormal BMI had a management plan, which may reflect suboptimal action taken, a lack of documentation of the actions taken, or both. Excess weight gain increases pregnancy risks, such as macrosomia, preterm birth and the need for caesarean delivery,1 as well as the long-term risk of obesity,6 making active management vital for the wellbeing of mother and child. Potential barriers to developing weight management plans include limited resources for referral, food security concerns, and inadequate staff time, especially in remote communities. Development of resources or programs for gestational weight management tailored to the needs of Indigenous women may assist.

Most women with an abnormal GCT result subsequently underwent a diagnostic OGTT. Recent controversy about diabetes screening20 may have created barriers to screening and follow-up. While large-scale implementation of the International Association of Diabetes in Pregnancy Study Group guidelines, starting in 2015,21 may partially resolve these problems, the number of women diagnosed with GDM will also increase,22 with potential resource implications for PHCs.

The positive associations between self-ratings of organisational systems and first trimester BP and diabetes screening in our study support targeting of organisational systems as a strategy for improving the provision of metabolic screening during pregnancy. However, further large-scale improvements in systems and processes that support health professionals in conducting metabolic screening and management are vital if the long-term consequences of these complications in pregnancy are to be reduced. We hope that our findings encourage further discussion about how pregnancy care for Indigenous women might be improved. All levels of the health system have roles to play, and systems-based research networks, such as the ABCD Partnership, are ideally placed to develop appropriate strategies.

Our study was limited by the fact that SAT data were available for only some PHCs (35 of 76, 46.1%), reducing the statistical power of our analysis to detect associations. Selection bias was also possible, as this study included only the One21seventy PHCs that volunteered their data for research (58.5% of the audits conducted overall). Our data may not be representative of PHCs not participating in the One21seventy initiative, but this extensive network includes a large population, and there are currently no other comparable data sources in Australia. Bias caused by the possibility that PHCs with lesser improvement would be less likely to remain in the CQI initiative is difficult to gauge, as commencement years varied and PHCs may have conducted maternal health audits in non-consecutive years. However, the generalisability of our results may have been enhanced by the fact that PHCs used the audit tool according to their needs, rather than as a research requirement. As we performed multiple statistical tests, there was a risk of finding significant associations by chance. This possibility was reduced by not undertaking statistical tests for follow-up actions, as the small numbers involved were inadequate for meaningful comparisons.

The CQI initiative continues, and further assessment of its effects on service delivery and health outcomes is planned as the sample size increases. Future directions include investigating the effects on service provision of the audit year, the year of commencement, and the duration of CQI participation. A cluster randomised controlled trial is an alternative study design that could be used to test hypotheses arising from the current findings.

Despite the limitations, our study has significant strengths that increase the generalisability of its findings. Most previous CQI research in pregnancy care has been hospital-based, implemented in a single service, not focused on metabolic screening, or not conducted in Australia.2325 Our research applied a unique system-wide participatory approach to assess systemic issues commonly affecting provision of care.14 It used a detailed, longitudinal dataset to investigate long-term sustainability, and included many PHCs across several settings.

Our study shows the potential of a CQI initiative supported by a systems-based research network to improve the provision of recommended pregnancy care at PHCs attended by Indigenous women. These findings are encouraging, and suggest a successful approach for achieving further improvement in pregnancy care provision.

Box 1 –
Characteristics of the 76 primary health care centres included in the study, and of the 2592 women whose records were audited

Characteristics of the primary health care centres


Governance structure

Government-operated

49 (64.5%)

Community-controlled

27 (35.5%)

Location

Remote

56 (73.7%)

Urban or regional

20 (26.3)

Service population size

≥ 1000 people

39 (51.3%)

< 1000 people

37 (48.7%)

State or territory

Northern Territory

28 (36.8%)

Queensland

27 (35.5%)

Western Australia

11 (14.5%)

New South Wales

6 (7.9%)

South Australia

4 (5.3%)

Characteristics of the women

Indigenous status

2141 (87.9%)

Aboriginal

2028 (83.3%)

Torres Strait Islander

57 (2.3%)

Aboriginal and Torres Strait Islander

56 (2.3%)

Age

Median, years

24.4 (IQR, 20.6–29.6)

< 20 years

545 (21.1%)

20–34 years

1807 (69.9%)

≥ 35 years

233 (9.0%)

First attendance for pregnancy care occurred before 13 weeks’ gestation

1321 (51.0%)

Median number of pregnancy care visits

7 (IQR, 5–10)


IQR = interquartile range. ∗n = 2435 (data missing for 157 women). †n = 2585 (data missing for 7 women). ‡n = 2591 (data missing for 1 woman).

Box 2 –
Documented metabolic screening during pregnancy after completion of each continuous quality improvement (CQI) cycle, and associations between metabolic screening and primary health care centre (PHC) participation in each CQI cycle

Metabolic screening

CQI cycle


P (for trend)

076 PHCs

150 PHCs

228 PHCs

38 PHCs

46 PHCs


Weight measured in first trimester (1321 women)

440/562 (78.3%)

344/418 (82.3%)

153/202 (75.7%)

49/65 (75.4%)

56/74 (75.7%)

Odds ratio (95% CI)

1.0

1.4 (0.9–2.0) P = 0.10

1.0 (0.6–1.6) P = 0.89

1.2 (0.6–2.4) P = 0.59

1.4 (0.7–2.8) P = 0.34

0.38

BMI calculated in first trimester (1321 women)

132/562 (23.5%)

126/418 (30.1%)

63/202 (31.2%)

25/65 (38.5%)

31/74 (41.9%)

Odds ratio (95% CI)

1.0

2.4 (1.6–3.5) P < 0.001

3.4 (2.0–5.6) P < 0.001

5.1 (2.4–10.7) P < 0.001

9.4 (4.6–19.4) P < 0.001

< 0.001

Blood pressure check in first trimester (1321 women)

485/562 (86.3%)

370/418 (88.5%)

180/202 (89.1%)

56/65 (86.2%)

59/74 (79.7%)

Odds ratio (95% CI)

1.0

1.3 (0.8–1.9) P = 0.27

1.5 (0.9–2.7) P = 0.15

1.6 (0.7–3.7) P = 0.24

1.1 (0.5–2.3) P = 0.78

0.51

Blood pressure check at any point during the pregnancy (2592 women)

1123/1201 (93.5%)

745/758 (98.3%)

383/388 (98.7%)

131/135 (97.0%)

110/110 (100.0%)

Odds ratio (95% CI)

1.0

3.7 (1.9–7.3) P < 0.001

7.0 (2.5–19.4) P < 0.001

2.0 (0.6–6.5) P = 0.25

< 0.001

Diabetes screening (2541 women)

669/1192 (56.1%)

469/736 (63.7%)

234/380 (61.6%)

86/135 (63.7%)

74/98 (75.5%)

Odds ratio (95% CI)

1.0

1.3 (1.0–1.6) P = 0.04

1.2 (0.9–1.7) P = 0.15

1.7 (1.1–2.6) P = 0.02

3.4 (1.9–5.9) P < 0.001

< 0.001


BMI = body mass index. ∗In 2010, the audit tool was refined to include “not applicable” if women had already been diagnosed with diabetes, or were offered but declined BMI or blood pressure assessment or diabetes screening. Since 2010, 26 women were recorded as having pre-existing diabetes, and 25 women declined diabetes screening. This reduced the denominator for diabetes screening to 2541. There were no recorded instances of women declining BMI or blood pressure checks.

Box 3 –
Recorded metabolic abnormalities during pregnancy and subsequent follow-up after each continuous quality improvement (CQI) cycle

Metabolic risk factors and follow-up

CQI cycle


0

1

2

3

4

76 PHCs

50 PHCs

28 PHCs

8 PHCs

6 PHCs


Abnormal BMI in first trimester (377 women)

39/132 (29.6%)

34/126 (27.0%)

17/63 (27.0%)

5/25 (20.0%)

8/31 (25.8%)

BMI management plan (103 women)

6/39 (15.4%)

10/34 (29.4%)

6/17 (35.3%)

4/5 (80.0%)

4/8 (50.0%)

High blood pressure in first trimester (1150 women)

11/485 (2.3%)

12/370 (3.2%)

5/180 (2.8%)

1/56 (1.8%)

0/59

Blood pressure follow-up < 26 weeks (73 women)

13/32 (40.6%)

17/27 (63.0%)

7/9 (77.8%)

2/2 (100.0%)

3/3 (100.0%)

High blood pressure at any time during pregnancy (2492 women)

72/1123 (6.4%)

51/745 (6.8%)

25/383 (6.5%)

2/131 (1.5%)

8/110 (7.3%)

Blood pressure follow-up ≥ 26 weeks (110 women)

34/49 (69.4%)

30/35 (85.7%)

17/20 (85.0%)

no cases

6/6 (100.0%)

Abnormal GCT result (1530 women)

120/667 (18.0%)

92/469 (19.6%)

41/234 (17.5%)

15/86 (17.4%)

9/74 (12.2%)

Follow-up OGTT (277 women)

104/120 (86.7%)

81/92 (88.0%)

40/41 (97.6%)

14/15 (93.3%)

7/9 (77.8%)


PHC = primary health care centre; BMI = body mass index; GCT = glucose challenge test; OGTT = oral glucose tolerance test.

Box 4 –
Associations between the average proportions of women undergoing metabolic screening and average Systems Assessment Tool scores (across all cycles) for 35 primary health care centres (β-coefficient, 95% CI)

Overall score

Delivery system design

Information systems and decision support

Self-management support

External links

Organisational influence and integration


BMI calculated in first trimester

4.2 (−3.5 to 11.9)

2.7 (−4.8 to 10.2)

5.5 (−1.3 to 12.2)

3.5 (−1.6 to 8.6)

1.9 (−4.5 to 8.4)

1.2 (−5.1 to 7.4)

Blood pressure check in first trimester

2.6 (−0.6 to 5.8)

1.9 (−1.3 to 5.0)

3.7 (0.9 to 6.4)

1.5 (−0.6 to 3.7)

−0.6 (−3.4 to 2.1)

2.5 (−0.0 to 5.1)

Blood pressure check at any point during pregnancy

0.9 (−0.9 to 2.6)

0.5 (−1.2 to 2.2)

1.3 (−0.2 to 2.9)

0.3 (−0.9 to 1.5)

0.3 (−1.2 to 1.8)

0.7 (−0.8 to 2.1)

Diabetes screening

5.3 (0.6 to 10.1)

4.6 (−0.1 to 9.3)

3.8 (−0.6 to 8.2)

3.4 (0.2 to 6.7)

1.2 (−3.1 to 5.4)

4.9 (1.1 to 8.6)


BMI = body mass index. ∗P < 0.05.

Testing times! Choosing Wisely when it comes to monitoring type 2 diabetes

Harnessing the value of self-monitoring of blood glucose among people with non-insulin-treated type 2 diabetes

Affecting over one million Australians, type 2 diabetes (T2D) costs our country an unsustainable $15 billion annually,1 and is predicted to be the nation’s leading cause of disease burden by 2017.2 It is therefore essential to engage people with this condition in cost-effective therapy to reduce these costs, which arise mostly from treating the long-term complications (eg, blindness, stroke, amputation).

Self-monitoring of blood glucose levels (by means of a finger-prick blood sample analysed with an ambulatory blood glucose meter) is an essential part of managing type 1 diabetes and insulin-treated T2D; however, the clinical benefit for people with T2D who are not using insulin is, and we believe remains, a matter of debate.

The Government decides …

On 29 May 2015, the Australian federal government announced that access to testing strips for self-monitoring of blood glucose (SMBG) would be limited for most people with T2D. This announcement followed a much anticipated 2-year review process and extensive consultation. The Pharmaceutical Benefits Scheme (PBS) now stipulates that:

  • unrestricted access to SMBG strips will continue for people with T2D who are using insulin or other medicines (eg, corticosteroids, sulfonylureas) to detect asymptomatic hypoglycaemia, or during illness that may cause fluctuations in blood glucose level;3 and

  • access will now be restricted for those with T2D “who are not using insulin and who have their blood glucose level under control. The PBAC [Pharmaceutical Benefits Advisory Committee] recommended that these patients be limited to a six month supply [100 strips] following changes to their diabetes management, with a further six months’ supply available at the prescriber’s discretion.”3

This second stipulation is more specific but consistent with another recommendation released just a month earlier.

Choosing Wisely Australia recommends …

Among its 25 recommendations published on 29 April 2015, Choosing Wisely Australia (an initiative of NPS MedicineWise), in collaboration with the Royal Australian College of General Practitioners, made only one about diabetes. This was: “Don’t advocate routine self-monitoring of blood glucose for people with type 2 diabetes who are on oral medication only.”4

Originating in the United States, Choosing Wisely is a laudable global movement encouraging clinicians and consumers to question the use of unnecessary medical tests, treatments and procedures.

In the US and Canada, Choosing Wisely recommendations for diabetes have focused similarly on restricting SMBG strips for people with non-insulin-treated T2D; in the United Kingdom, recommendations are expected in late 2015.

Despite nuances of language in these international recommendations, SMBG among people with non-insulin-treated T2D is clearly a “hot topic”.

The evidence base indicates …

In 2012, two highly influential systematic reviews — a Cochrane review and a meta-analysis — were published.5,6 Based largely on the same set of randomised controlled trials (RCTs), their conclusions were comparable: “clinical benefit is limited” for SMBG in people with non-insulin-treated T2D.

The Cochrane review5 included 12 RCTs (3249 participants). Among these, nine trials of 6 months’ duration found that glycated haemoglobin (HbA1c) levels were reduced on average by 0.3% (a statistically, but not clinically, significant improvement).5 There was no significant reduction in HbA1c levels in trials with 12 months of follow-up. Overall, no benefit was shown for patient satisfaction, emotional wellbeing or health-related quality of life, and SMBG was considered unlikely to be cost-effective.5

Challenging the evidence and assumptions

Our own critical appraisal revealed too much variation in trial methods and populations to draw firm conclusions about the value of SMBG overall.7 In particular, in some trials, participants were not given instructions about when or how often to check their blood glucose level (or this was not reported). Among trials where frequency was reported, it varied enormously — from four times per month to six times per day, 7 days per week. In most cases, the SMBG conducted was insufficient to provide interpretable blood glucose patterns that could inform diabetes self-management and lifestyle choices (eg, food intake or physical activity). Some studies incorporated feedback and education about self-management, but others did not.

We refer to this random, low frequency, routine SMBG as “unstructured”, and suggest it is ineffective because it does not enable people with T2D or health professionals to detect blood glucose level patterns or act upon them. Indeed, people with non-insulin-treated T2D reported that their GPs rarely refer to their glucose diary data, and perceive this to mean that SMBG is worthless.7 They experience SMBG as “frustrating”, “painful”, “inconvenient” and “expensive”, they lack motivation for it, and report “feelings of failure or anxiety in response to high blood glucose readings”.7

However, in studies where the protocol for a “structured” approach to SMBG was clearer, the findings were more positive — reduced HbA1c levels, less glycaemic variability overall, less time spent in hyperglycaemia.5,7

Structured monitoring is effective, economical and engaging

After the systematic reviews were concluded, an RCT of structured SMBG was published.8 In the STeP study, structured SMBG was defined as seven checks per day over 3 consecutive days in the week before their consultation with a doctor about their diabetes.8 STeP showed that structured SMBG was associated with a statistically significant reduction in HbA1c level (− 0.3%; P < 0.001; intention-to-treat analysis), and a per protocol analysis (focused on those who conducted structured SMBG as intended) showed a clinically significant reduction in HbA1c level (− 0.5%).8

Notably, trials of structured SMBG have also shown important psychological benefits — increased satisfaction with treatment, reduced diabetes-related distress, improved general emotional wellbeing and greater confidence in, and motivation for, diabetes self-care.79

The findings of the STeP study suggest that SMBG does not have, as such, a dose-related response, and needs to be viewed, rather, in terms of quality rather than quantity of monitoring.8 The protocol suggests that a person with non-insulin-treated T2D using structured SMBG could use as few as 84 test strips per year (ie, 21 in the week before each quarterly general practitioner visit). This, in fact, compares very favourably with the current Australian average of 300 strips per annum per person with non-insulin-treated T2D, and suggests great potential for the federal government’s restricted access policy (100 strips over 6 months) to be applied sensibly.

Our recent observational study, STeP-IT-UP, (involving 98 people with non-insulin-treated T2D attending 22 general practices across our eastern seaboard), showed that structured SMBG is feasible in Australia.10 Furthermore, our findings support US and European evidence showing significant reductions in HbA1c levels (without increasing hypoglycaemia) and diabetes-related distress.

What is structured SMBG?

Structured SMBG is more than just 21 finger pricks. It involves meaningful (rather than random) glucose checks at set times (eg, pre-meal and 2 hours post-meal, and before bedtime) to generate a pattern over at least 3 consecutive days. The person with T2D also notes their meal sizes and energy levels to provide context for the readings. While most trials have evaluated SMBG as though it were an active agent, it is actually just one aspect of a complex intervention, requiring:

  • agreement between the person with T2D and their health professional on glucose targets and the timing and frequency of SMBG;

  • a supportive and enthusiastic health professional trained in the interpretation of SMBG data;

  • appropriate feedback to, and education for, the person with T2D;

  • collaborative review of the SMBG pattern to determine areas for improvement and to discuss what contributed to low, high or within-target glucose levels;

  • a plan for how to change diet, activity levels or medication to improve glucose levels;

  • action (ie, actual change in diet, activity levels or medication); and

  • motivation on the part of the person with T2D, which is likely to be contingent on much of the above being in place.

A closer look at the Choosing Wisely Australia recommendation

We take issue with Choosing Wisely’s initial statement, that there “is no evidence that self-monitoring of blood glucose (SMBG) affects patient satisfaction, general well-being or general health-related quality of life.”4 There is compelling evidence on both sides of this debate, depending on whether SMBG is structured or unstructured.7

Choosing Wisely claimed that Australian Government spending on glucose monitoring strips was $143 million in 2012.4 This is true, but misleading. Only 35% of this spending was for people with non-insulin-treated T2D.3 Most of this funding was for SMBG essential for informing insulin dosing and detecting hypoglycaemia in people with type 1 diabetes and those with T2D using insulin or sulphonylureas. Substantial cost savings therefore seem unlikely.

The most positive aspects of the Choosing Wisely recommendation are the exceptions, in particular the usefulness of SMBG for “short-term education about diet influencing blood sugar”, although we would expand this to include physical activity.

Choosing more Wisely Australia

We appreciate absolutely the need for evidence-based medicine — and have described the complexity of this evidence base. Nevertheless, we remain concerned that restricting access to glucose monitoring strips conveys the wrong message philosophically. At face value, it implies that some forms of diabetes require less monitoring and are, therefore, less serious than others. Yet all diabetes is serious and all diabetes leads to complications if not monitored and managed appropriately: conveying any other message is confusing, inaccurate and potentially dangerous.

As with most behaviour, if individuals do not value it, or perceive more costs than benefits, they are unlikely to instigate or maintain the behaviour. This applies not only to people with non-insulin-treated T2D, but also to health professionals. While the government is undoubtedly interested in potential costs savings, the PBS final report also recognises the need to emphasise to clinicians and people with T2D that “changes are being implemented to encourage better practice and direct more attention to appropriate use of test strips”.3

Far from recommending against routine SMBG, which may unintentionally deter any SMBG in people with non-insulin-treated T2D, we believe Choosing Wisely Australia should positively advocate structured SMBG for all people with T2D not using insulin or other hypoglycaemia-inducing medications. This would be more consistent with its mission not only to reduce unnecessary medical tests, but also to promote evidence-based clinical practice. Structured SMBG offers an evidence-based model for effective blood glucose monitoring and engagement in diabetes self-management.

[Comment] Handwashing and community management of infections

Influenza has a strong potential to transfer from individual to individual, and encounters in everyday life play an important part in its diffusion in the population. Wherever people meet—at work, in shops, on public transport—there is the risk of transmission, suggesting that the community is the context in which protection against further spread has to be orchestrated. Vaccination, personal hygiene (including handwashing), and measures against crowding are recommended measures.1 Primary care is important in influenza vaccination because it can reach large numbers of people at high risk of influenza complications and provide them with effective protection against the virus.

Good for the economy while good for your health

Prominent among the proposals for the future from Mr Turnbull as he assumes the prime ministership are ones that relate to economic growth. He seeks a more agile economy, one in which innovation is promoted and prized and where the negative forces of debt and deficit are dealt with by increasing productivity and growth. These aspirations are supported by stronger recognition in the new Cabinet of science and innovation.

Recently I have had cause to reflect on the place of health care in one piece of the Australian economy.  Specifically, I was considering how much health care for the million citizens in western Sydney actually contributes to the economy. The answer is a lot. So, rather than portraying health care as a terrible drain on the national economy and incessantly saying we should cut our costs, we might express it differently.

We’re an investment, not a cost!
Our health care is based strongly on science and innovation. The revolution that has occurred in diagnostic and therapeutics due to new technology is profound. Procedures that once took days now take minutes. New drugs work wonders. CT and MRI have completely replaced the ghastly contrast-medium angiograms and pneumoencephalograms. The productivity of surgeons and other proceduralists has multiplied many times over.

So, if you are looking to grow an ‘industry’ through science and innovation, you could do no better than to look at health. It leads the way. Great efficiencies and immense amounts of suffering due to dreadful procedures have been banished by science and innovation.

In western Sydney, the health services provide care to nearly a million people. Public hospital and associated community services operate with a recurrent budget of nearly $1.4 billion per annum. That’s a lot of money pumped into the local economy. General practice likewise generates local expenditure in the millions.

Whether all this money is wisely or optimally spent is a separate and (I agree) an important question.  But overlaying this concern is the fact that health care is a big contributor to the Australian economy.  

What is the goal of the economy, we may ask?  Surely it is to support the Australian community and enable us to compete in the world to maintain our prosperity and assist, as we see fit, to bring less-developed nations up to speed. Given that the segment of the global economy in which we compete is highly innovative and science-based, then we need to place emphasis on those attributes here Down Under. 

As our future prosperity is unlikely to depend as heavily as it has in recent decades on ripping stuff out of the ground and selling it to China, inventing nothing, doing no innovation, making no scientific progress and then buying in all the creature comforts that we need from the US and Japan (and increasingly form China), we need to achieve self-sufficiency in innovation. That requires investment – in science, technology and education. 

While it is hard to see these opportunities through the clouds of day-to-day slog in our hospitals and surgeries, investment in medical technological innovation, the education of smart scientists to develop even more and better equipment and drugs, the support of health research of all sorts – these things make an economy grow. These are the ways in which we develop economic agility and the nimbleness necessary to be able to adapt to change.

Health as a superior good

There is another important fact that tends to get in the way of clear perception of where health fits in the economy, and that is the complex notion that health is a superior good, something that we spend on almost without limit, constrained only by the extent of our discretionary income.

That is what makes trying to keep health costs under control so difficult. As affluence increases, ordinary goods such as food do not attract all that much additional expenditure. But health? We feel we can never get enough of it, and we are prepared as individuals and as a nation to keep on paying!

We have emerged from a period of economic discussion in Australia dominated by what many experts see to be an exaggerated concern for a relatively small deficit. The real economic challenge is the changing base of our revenue, away from minerals and coal toward service industries such as finance, education and health care. We need to be agile; we need to look for ways to increase our productivity through innovation and invention.

Health can help achieve those economic goals for the nation. Rather neatly, this can occur as a secondary outcome of our continued concentration on providing the best possible care for all Australians.

Signs workforce planning getting back on track

It’s been a chequered time for medical workforce planning in recent years.

Health Workforce Australia (HWA) was a Commonwealth statutory authority established in 2009 to deliver a national and co-ordinated approach to health workforce planning, and had started to make substantial progress toward improving medical workforce planning and coordination. It had delivered two national medical workforce reports and formed the National Medical Training Advisory Network (NMTAN) to enable a nationally coordinated medical training system.

Regrettably, before it could realise its full potential, the Government axed HWA in the 2014-15 Budget, and its functions were moved to the Health Department. This was a short-sighted decision, and it is taking time to rebuild the workforce planning capacity that was lost.

NMTAN is now the Commonwealth’s main medical workforce training advisory body, and is focusing on planning and coordination.

It includes representatives from the main stakeholder groups in medical education, training and employment. Dr Danika Thiemt, Chair of the AMA Council of Doctors in Training, sits with me as the AMA representatives on the network.

Our most recent meeting was late last month, and the discussions there make us hopeful that NMTAN is finally in a position where it can significantly lift its output, contribution and value to medical workforce planning.

In its final report, Australia’s Future Health Workforce, HWA confirmed that Australia has enough medical school places.

Instead, it recommended the focus turn to improving the capacity and distribution of the medical workforce − and encouraging future medical graduates to train in the specialties and locations where they will be needed to meet future community demands for health care.

The AMA supports this approach, but it will require robust modelling.

NMTAN is currently updating HWA modelling on the psychiatry, anaesthetic and general practice workforces. We understand that the psychiatry workforce report will be released soon. This will be an important milestone given what has gone before.

Nonetheless, it will be important to lift the number of specialties modelled significantly now that we have the basic approach in place, so that we will have timely data on imbalances across the full spectrum of specialties.

The AMA Medical Workforce Committee recently considered what NMTAN’s modelling priorities should be for 2016.

Based on its first-hand knowledge of the specialities at risk of workforce shortage and oversupply, the committee identified the following specialty areas as priorities: emergency medicine; intensive care medicine; general medicine; obstetrics and gynaecology; paediatrics; pathology and general surgery.

NMTAN is also developing some factsheets on supply and demand in each of the specialities – some of which now available from the Department of Health’s website (http://www.health.gov.au/internet/main/publishing.nsf/Content/nmtan_subc…). I encourage you to take a look.

These have the potential to give future medical graduates some of the career information they will need to choose a specialty with some assurance that there will be positions for them when they finish their training.

Australia needs to get its medical workforce planning back on track.

Let’s hope that NMTAN and the Department of Health are up to the task.

Cardiac troponin testing for diagnosis of acute coronary syndromes in primary care

Acute coronary syndromes (ACS) are a leading cause of illness and death in Australia. Around 75 000 Australians are hospitalised for ACS each year, with $8 billion spent annually on related inpatient care.1 While mortality caused by ACS is declining because of better control of coronary risk factors and the introduction of new treatments,2 at least 10 000 Australians still die each year as the result of ACS.1

The spectrum of ACS includes unstable angina, where atherosclerotic plaque rupture leads to arterial occlusion and myocardial ischaemia, and myocardial infarction, where ischaemia progresses to myocardial cell necrosis. Further classification into ST elevation myocardial infarction (STEMI) and non-ST elevation myocardial infarction (NSTEMI) is based on electrocardiographic (ECG) findings. Overall, the rate of inhospital major adverse cardiac events caused by ACS (death, cardiac arrest, recurrent myocardial infarction, worsening heart failure, major bleeding or stroke) approaches 30% for STEMI and 20% for NSTEMI.3 Patients with unstable angina are also at increased risk of death and subsequent myocardial infarction, even in the absence of myonecrosis.4

Diagnosing ACS is challenging in primary care as well as in the tertiary setting; 15% of patients who experience an ACS initially contact their general practitioner.5 The diagnosis of ACS in primary care is not always straightforward; signs and symptoms alone are neither sensitive nor specific in the prehospital population,6 and the validity of clinical prediction rules for ACS in primary care populations is limited.7

Given these limitations, there are potential benefits to using cardiac biomarkers in primary care. Cardiac troponin (cTn) is the main biomarker in patients who present with possible ACS. A change in cTn levels signifies myocardial necrosis with high sensitivity and specificity, and allows differentiation of myocardial infarction from unstable angina.8 Examples of the benefits of cTn as a biomarker in primary care include the diagnosis of myocardial infarction where it was not suspected initially because of atypical presenting features; the exclusion of myocardial infarction in low-risk patients; and the conservation of resources by avoiding hospital referral.9

However, there are pitfalls and practical considerations associated with cTn as a biomarker in primary care. Compared with those presenting directly to hospital, patients with ACS who first consult a community physician have longer prehospital delay10 and decreased survival.11 Several authors have expressed concern that GP cTn requests contributes to these outcomes,12,13 and there is also evidence of over-interpretation of positive results12 and over-reliance on negative results.14 There can also be problems with follow-up if the test results are notified after normal practice hours.

In this study, we examined a population of patients with possible symptoms of ACS who underwent GP-initiated cTn testing. We compared the incidence of ACS and associated adverse outcomes with those in patients who had presented to hospital for cTn testing. We also explored GPs’ knowledge of the limitations of the usefulness of cTn testing, and the influence of cTn test results on their diagnosis and hospital referral practices.

Methods

Study design, setting and participants

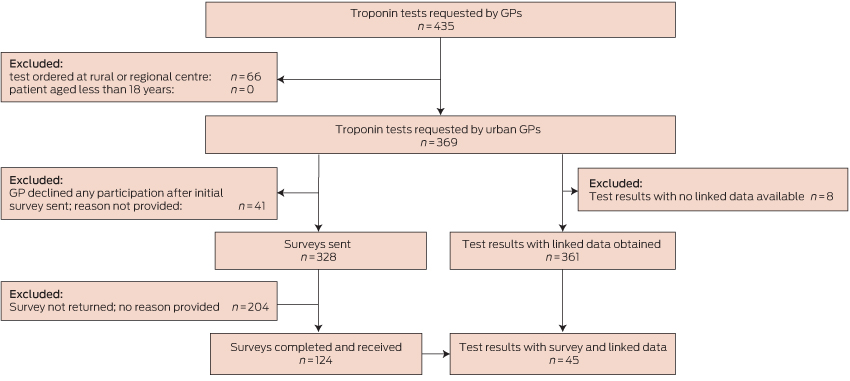
This study employed a prospective cohort design. We recruited patients who had cTn blood tests ordered by a GP in a non-hospital setting, and who had their sample collected at the community collection centres of two of five pathology laboratories in urban Perth, Western Australia. The period of recruitment was 24 September 2009 – 3 September 2010. Patients with samples collected at rural and regional centres were excluded because it was considered likely that GPs in those areas would employ cTn testing differently to urban GPs. Additional exclusion criteria were: patients less than 18 years of age, cTn tests ordered by non-GP doctors, tests ordered for emergency department (ED) patients, and tests ordered by GPs who declined to participate in the study (Box 1).

Data sources and measurement

GP cohort: laboratory data

A research assistant at each laboratory obtained consecutive cTn test results requested by GPs, using the practice address to establish GP status.

GP cohort: survey data

Laboratory research assistants approached requesting GPs for de-identified details about the clinical scenario leading to the cTn test request and the clinical course after notification of the result. GPs were contacted within 1 week of testing, with telephone follow-up to non-responders 1 week after the initial contact. Information was collected on a one-page survey sent and returned by fax, with an information sheet and consent form concurrently sent to the doctor. Risk stratification was undertaken using elements of the National Heart Foundation/Cardiac Society of Australia and New Zealand (NHF/CSANZ) criteria that could be readily assessed during a general practice consultation.15

GP cohort: linked data

Linked data were obtained from the Department of Health Western Australia Data Linkage System (WADLS) for all patients for a minimum 12-month period after the date of their test, irrespective of whether their GP had responded to the survey. The final cTn test included in our study was performed in September 2010, and follow-up continued until October 2011. Outcomes were defined according to standardised definitions recommended for Australasian ACS research.16 Specific diagnosis and procedure codes were selected from the International Classification of Diseases, 10th revision, Australian modification (ICD-10 AM)17 and the Australian Classification of Health Interventions.18 Linkage and extraction were performed in November 2013 to compensate for delay in updating of Department of Health records. Records were excluded from analysis if no principal diagnosis was stated, or if the presenting symptom or principal diagnosis was insufficiently specific to allow classification. Duplicate records with more than one hospital admission for the same patient on the same day were treated as one admission for the purposes of statistical analysis.

ED cohort

Clinical presentations and outcomes in the GP survey cohort were compared with an ED cohort using the Multiple Infarct Markers in Chest Pain (MIMIC) study dataset.19 This prospective cohort study was conducted between September 2008 and June 2009 in two tertiary and three general hospitals in urban Perth. The urban catchment areas of the hospitals were similar to those of the collection centres in the GP survey cohort. Participants were a representative sample of patients undergoing evaluation for possible ACS with serial cTn testing. Patients were excluded if they were less than 18 years of age or pregnant, and where ECG criteria had indicated urgent reperfusion therapy.

Statistical methods

All statistical analyses were performed with SAS version 9.4. Differences between group characteristics were assessed by two-sample t test for continuous variables and by χ2 and Fisher exact tests where appropriate, based on expected frequencies for dichotomous variables. Statistical significance was defined as P < 0.05.

Ethics approval

Ethics approval to conduct the survey was obtained from Human Research Ethics Committees of the University of Western Australia (RA/4/1/2275; 13 July 2009), St John of God Hospital (370; 7 May 2009), the Department of Health Western Australia (2013.04.02; 9 April 2013) and the South Metropolitan Health Services Board (08.136; 28 August 2014). The medical directors of the participating laboratories gave consent for the provision of laboratory data, and ethics approval was obtained from their institutional ethics committees (details available on request).

Results

Participants

Box 1 depicts participant flow through the study. There were no significant differences between included and excluded patients with respect to age or sex (each P > 0.10).

Descriptive data

Box 2 presents the characteristics of the 124 patients in the GP cohort for whom survey data were available. The most common presentation was pain typical of cardiac ischaemia (55.6%).

Data on coronary risk factors were available for 104 GP cohort patients. Six patients (5.7%) were at high risk of ACS according to the NHF/CSANZ risk stratification framework,15 with a combination of typical symptoms and diabetes. A further 65 patients (62.5%) were at intermediate risk of ACS, including 40 (38.5%) over 65 years of age, 16 (15.4%) with various combinations of hyperlipidaemia, a family history of coronary heart disease (CHD), smoking history and hypertension, and nine patients (8.7%) with diabetes and atypical symptoms of ACS.

The median time from specimen collection to sample registration at the processing laboratory was 31 minutes (range, 0 min–1465 min). This interval depended on the location of the collection centre; centres co-located with laboratories had the shortest intervals. Overall, the median time between specimen collection and availability of the test result was 128 minutes (range, 23min –1466 min).

Before receiving the test results, most GPs (80/124, 64.5%) rated the likelihood of ACS in their patient as low (less than 5%). This proportion increased after the results were received (to 110/124, 88.7%). A significant proportion of GPs (34/124, 27.5%) changed their assessment of the likelihood of ACS after a negative test result (χ2 test, P < 0.001).

Most GPs (85/124, 68.5%) intended to manage the patient themselves before receiving the test result, rather than referring them to a hospital or cardiology. This increased to 95/124 GPs (76.6%) after the results were known. Despite the test result having a significant effect on the estimated likelihood of ACS, it did not significantly influence the intended management of the patient (χ2 test, P = 0.23).

The prevalence of smoking (P = 0.01), hypertension (P = 0.02), dyslipidaemia (P = 0.03) and a personal or family history of CHD (P < 0.001) were all significantly greater in the GP survey group than in the MIMIC dataset cohort (Box 2).

Outcome data

GP cohort: linked data

Linked data were available for 361 tests performed for 355 patients; data for eight patients could not be linked because of insufficient identifying information.

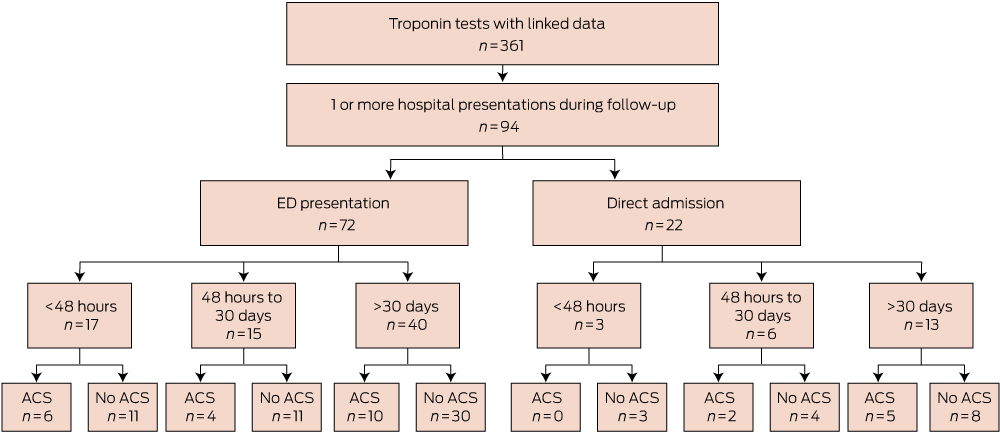
There were 176 presentations to hospital with a cardiovascular symptom or diagnosis during follow-up, whether by presentation to an ED (112 presentations) or by direct admission (64 presentations). Of the 112 presentations to an ED in the GP cohort, 87 were assigned a triage category of 1 or 2, indicating that they required medical review immediately or within 10 minutes.

In total, 94 of 355 of the GP cohort (26.5%) presented at least once to a hospital during follow-up with cardiovascular diagnoses (Box 3 and Box 4). Twenty-one of these 94 patients (22.3%) presented to a hospital within 48 hours of testing. The median time from testing to first presentation was 33 days (range, 0 days–551 days).

Within 48 hours of testing, six of the GP cohort (1.7%) had been diagnosed with an ACS; the median time from specimen collection to hospital presentation for these patients was 382 minutes (range, 80 min–1312 min). Box 5 lists the components of delay for this group.

Within 30 days of cTn testing, 13 of 355 patients in the GP cohort (3.7%) had at least one ACS. Complications included one death from a cardiovascular cause (occurring outside of hospital within 1 week of the test, in a 55-year-old patient), one cardiac arrest in a patient with known CHD, and one episode of cardiogenic shock. During the follow-up period, 27 of 355 patients (7.6%) had at least one ACS. The median time to presentation with the first ACS was 42 days (range, 0 days–498 days).

GP cohort: survey and linked data

For the 124 patients with both linked and survey data, there were 45 presentations to hospital, including 18 ACSs in 11 patients. Six occurred within 1 month of the cTn test, and in each case symptoms had commenced at least 48 hours before the test.

ED cohort

Three hundred and sixty-eight patients of the 1758 in the MIMIC dataset (20.9%) received a discharge diagnosis of ACS, significantly more than the 13 patients (3.7%) with an ACS in the GP cohort (P < 0.001). Most (242/368, 65.8%) were at high risk of ACS according to NHF/CSANZ criteria, with 114 (31.0%) at intermediate risk and 12 (3.3%) at low risk.

Discussion

This study found that most patients who underwent GP-initiated cTn testing had presented typical symptoms of coronary ischaemia and had clinical risk factors indicating intermediate or high risk of an ACS and associated adverse outcomes.15 While most results of GP-initiated cTn tests were negative, such a result did not rule out the possibility of an ACS, as 3.7% of patients (13/355) were admitted to hospital with an ACS within 30 days of receiving a negative result. This approximates the 30-day event rate for patients presenting to an ED and classified as being of intermediate risk.15 In an ED, such patients would not be considered safe for discharge home until further investigations and monitoring had determined a lower risk level.15 The patients in our study, in contrast, would have been largely unmonitored in the community for some hours while awaiting their test results, as well as during the days following a negative result.

The finding that patients undergoing GP-initiated cTn testing were not low-risk was unexpected, and there may have been other factors not detected by the survey that reduced the risk status of patients. Obtaining comprehensive data on individual risk factors may have helped to resolve this question, including ECGs, quantitative blood pressure and lipid profiles, and the results of earlier invasive investigations for CHD. This information would also allow application of additional cardiovascular risk scoring tools and improve the generalisability of our study, although this would risk patient identification and reduced participation because of the longer survey duration.

Turnaround times in this study indicated that there was a substantial delay between presentation to a GP and cTn results becoming available. Particularly concerning was the median delay of more than 5 hours in those patients who were subsequently confirmed to have an ACS and who had presented within 48 hours of symptom onset, when the risk of complications is greatest.8 While the Royal Australian College of General Practitioners Standards20 require evidence of systems that ensure timely response to pathology results, there is evidence from the Threats to Australian Patient Safety (TAPS) study21 and elsewhere9 which suggests that this does not always occur.

GPs may not fully understand the limitations of cTn testing, as 23.4% of tests were ordered within 12 hours of symptom onset (Box 2), at which point the test may be insufficiently sensitive. While all major guidelines groups recommend serial testing to exclude ACS in this context,4,8,22 no serial testing was performed by GPs in our study.

In many cases, the test result did not alter patient management. Some tests were clearly ordered in response to a patient request, and one GP commented that “the test was mainly arranged to satisfy the patient that this was unlikely cardiac”. It is worth noting that a negative cTn test in this context may not have resolved patient anxiety, as many patients presented to a hospital within hours of receiving a negative test.

GPs are in a difficult situation. The consequences of missing an ACS diagnosis can be grave, yet there are no reliable clinical predictors of ACS, and primary care investigations have their limitations. At the same time, GPs have an important role as gatekeepers of the health system.23 Failure to accept any uncertainty may lead to unnecessary investigations and referrals, themselves potential causes of patient harm and unnecessary system costs. However, based on the results of our study, we concur with previous authors in this journal7,9 who have suggested that GPs should maintain a high threshold for requesting cTn testing and refer patients promptly to hospital for assessment when clinical features suggest a diagnosis of ACS. Possible ACS is one setting in which GPs can justifiably advise patients to present to a hospital, rather than undertaking investigations in primary care.

Box 1 –
Flow chart for inclusion of participants in the study (the GP cohort)

Box 2 –
Characteristics of the patients in the GP and ED (MIMIC dataset)19 cohorts

Characteristic

GP cohort (n = 124)

ED cohort (n = 1758)

P


Median age, years (interquartile range)

61 (45–73)

62 (50–74)

0.38

Sex (male)

55 (44.4%)

984 (56.0%)

< 0.01

Cardiac troponin (cTn) test result

Positive

2 (1.6%)

168 (10.7%)

< 0.01

Negative

122 (98.4%)

1408 (89.4%)

< 0.01

Risk factors

Smoker

15 (12.1%)

425 (24.2%)

0.01

Hypertension

51 (41.1%)

923 (52.5%)

0.02

Dyslipidaemia

47 (37.9%)

842 (47.9%)

0.03

Diabetes

15 (12.1%)

327 (18.6%)

0.07

Past history of CHD or equivalent

8 (6.5%)

621 (35.3%)

< 0.01

Family history of CHD§

24 (19.4%)

879 (50.0%)

< 0.01

Presenting symptoms

Typical pain

69 (55.6%)

Atypical pain

27 (21.8%)

Non-pain symptoms

24 (19.4%)

No symptoms

3 (2.4%)

Not recorded

1 (0.8%)

Symptom duration at time of presentation to GP

Less than 12 h

29 (23.4%)

12 h–48 h

33 (26.6%)

More than 48 h

57 (46.0%)

Not recorded

5 (4.0%)

Estimated glomerular filtration rate (mL/min/1.73 m2)

Less than 30

3 (2.4%)

30–60

19 (15.3%)

More than 60

63 (50.8%)

Not recorded

39 (31.5%)


ED = emergency department; CHD = coronary heart disease. ∗ED cohort: 1576 patients with 8 h–12 h cTn level data. †GP cohort: 104 patients with complete risk factor data. ‡Current smoker or previous smoker of > 10 pack-years. §First or second degree relative < 60 years of age. ¶Reasons for cTn: to investigate elevated creatine kinase levels; for monitoring of cardiac status while on statin; psychiatry patient at risk of cardiac complications of treatment.

Box 3 –
Flow chart of the outcomes for the GP cohort

Box 4 –
Details of 94 hospital presentations by members of the GP cohort during follow-up


Acute coronary syndrome

27

Death outside hospital due to cardiovascular cause (1); cardiac arrest (1); cardiogenic shock (1); ST elevation myocardial infarction (1); non-ST elevation myocardial infarction (5); acute myocardial infarction (9); unstable angina (9)

Coronary heart disease, not otherwise specified

8

Cardiomyopathy

1

Heart failure

5

Arrhythmia

6

Supraventricular tachycardia (1); ventricular tachycardia (1); atrial fibrillation (1); atrioventricular block, 2nd degree (1); bradycardia (1); cardiac arrhythmia, other (1)

Other cardiovascular diagnosis

47

Aortic valve stenosis (1); hypertensive (6); chest pain, anterior chest wall (3); chest pain on breathing (26); chest pain unspecified (4); syncope (1); dizziness (3); palpitations (2); dyspnoea (1)


∗No hospital admission data were collected for four patients with unstable angina.

Box 5 –
Delay components in six patients presenting with acute coronary syndrome within 48 hours of a cardiac troponin (cTn) test

Age (years)

Collection to registration (min)

Registration to result (min)

Collection to result (min)

Result

eGFR

Result to hospital presentation (min)

Diagnosis


55

41

164

205

1.16

NR

398

AMI

67

6

107

113

< 0.10

70

80

UA

69

6

149

155

1.16

66

251

AMI

70

163

86

249

3.66

49

357

NSTEMI

85

12

101

113

< 0.10

43

1108

UA

87

1188

66

1254

0.14

66

1312

NSTEMI


eGFR = estimated glomerular filtration rate (mL/min/1.73 m2); NR = not recorded; AMI = acute myocardial infarction; UA = unstable angina; NSTEMI = non-ST elevation myocardial infarction.

“What should happen before asymptomatic men decide whether or not to have a PSA test?” A report on three community juries

Prostate-specific antigen (PSA) testing of asymptomatic men remains controversial.1 Testing may improve prostate cancer survival rates,2 but can also lead to harms, such as repeated investigations and the unwanted effects of treatments, including incontinence and impotence.35 Evidence regarding benefits and harms alone has not resolved tensions over PSA testing.6 Disagreement among experts and in guidelines has confused public communication in Australia and internationally.7,8

In December 2014, the Prostate Cancer Foundation of Australia (PCFA) and the Cancer Council Australia (CCA) released clinical consensus guidelines for general practitioners for public comment,9 after the National Health and Medical Research Council (NHMRC) had published information on the topic for health practitioners.10 These documents established criteria for identifying men more likely to benefit than to be harmed by PSA testing. However, it remains unclear if and when GPs should introduce the subject of PSA testing in consultations with individual men. The Royal Australian College of General Practitioners (RACGP) advises GPs not to broach the subject of PSA testing, but to provide full information regarding the benefits, risks and uncertainties of testing and treatment if patients specifically ask about it.11

In this article, we report the outcomes of three community juries convened in 2014 to consider the dilemmas associated with PSA testing. A community jury is a group of citizens brought together to receive detailed evidence about a specific problem and to then deliberate on this problem.12 Our aim was not to capture the opinions of the broader community, but to ascertain what a well informed citizenry would accept as legitimate PSA testing policy and practice, and the reasons for their views. Community juries are an established, appropriate method for investigating such questions.12 Community juries have been used in Australia and elsewhere to consider questions related to cancer screening.13,14 Unlike surveys and focus groups, they involve extensive provision of information, constructive and structured dialogue between ordinary members of the public and experts, and adequate time for consideration of the problem. The process is similar to a legal proceeding, but the outputs are not legally binding; they instead provide evidence for policy making.

We consulted major stakeholders (consumer organisations, GPs, epidemiologists, urologists, the CCA) to design the questions that the juries would consider. All agreed that the key issues to be explored were:

  • whether GPs should initiate discussions with asymptomatic men about the PSA test;

  • when men should be given information about the potential benefits and harms of testing, biopsy and treatment.

Valid consent for interventions is integral to an ethical health care system, and providing adequate and timely information is fundamental to valid consent. While this has been noted in relation to PSA testing,15,16 it is not yet clear what should happen before men decide for or against taking a PSA test. Noting the work currently being undertaken by the NHMRC, CCA and PCFA, we sought information on what selected groups of members of the public consider to be the obligations of GPs regarding informing men about PSA testing, and what else might be required before a man could validly consent to a PSA test.

Methods

Community jury research is a deliberative method, with the following general characteristics:

  • a group of citizens is convened for 1 to 3 days;

  • they are asked to consider a specific problem;

  • they hear evidence from (often opposed) experts, and ask the experts questions;

  • they are given time for deliberation and to come to a documented conclusion.

There are two main approaches in community jury research: participants draft open recommendations as a group, or vote on options specified by the researchers.17 We used both approaches in our investigation: Jury 1 tested an open approach, while Juries 2 and 3 were asked to vote on specific options (Box 1).

Recruitment and selection

We recruited three community juries in 2014 — two of mixed gender and ages (Juries 1 and 2), and one of men of PSA screening age (Jury 3) — by placing advertisements and articles in the mass and social media in Sydney. Of 119 respondents, 42 were unavailable on the days scheduled for the juries; 37 with recent personal or close family member experience of prostate cancer treatment, biopsy or active PSA monitoring were also excluded. We sought socioeconomic and cultural diversity for our juries. Juries 1 and 2 were socioculturally diverse but of above-average educational attainment; the all-male Jury 3 was also socioculturally diverse, but its educational attainments broadly matched those of the general Australian population. Forty participants were thus recruited according to their eligibility, sociodemographic characteristics and availability (Box 2).

Each jury commenced with an evening orientation session (Day 0), during which the questions and the jury process were introduced and consent was obtained. Jury Day 1 focused on interrogating the evidence and understanding the ethical, legal and practical aspects of the problem. Testimony on the following themes was prerecorded by selected experts and shown to jurors in a video presentation:

  • basic biology, diagnosis, treatment and prognosis of prostate cancer;

  • qualitative empirical evidence on how Australian GPs manage PSA testing in their practices;

  • ethical and legal aspects of patient consent (in general, and with regard to screening);

  • potential harms of screening asymptomatic men for prostate cancer; and

  • potential benefits of screening asymptomatic men for prostate cancer.

Each presentation lasted about an hour. Prerecording ensured that the evidence presented was standardised, although some experts slightly modified their presentations for Juries 2 and 3 according to the more specific options considered by these juries. The biographical sketches of the experts and the video presentations shown to Juries 2 and 3 are available online.18 Immediately after each video, the relevant expert was available for questions through a conference calling system. Facilitated by a researcher, these question-and-answer sessions allowed jurors to clarify or challenge the arguments presented. Facilitation focused on promoting constructive dialogue and fair interaction between jurors. Our observations of unstructured deliberations and the transcripts indicated that this inclusivity was maintained during non-facilitated periods.

For the first hour of Jury Day 2, jurors reflected on, discussed and debated the evidence, aided by a researcher acting as facilitator. Juries then deliberated for an hour without the researchers, and either reached a set of recommendations (Jury 1) or majority verdicts on the questions posed (Juries 2 and 3). The recommendations or verdicts, the underlying reasoning, and dissenting views were reported to the research team in a final, facilitated feedback session.

Data collection and analysis

The three deliberative groups (juries) were the units of analysis in this study. All jury deliberations (facilitated and non-facilitated) and expert question-and-answer sessions were audio-recorded and transcribed. During the final session, the verdicts and reasons were recorded by a researcher on a flipchart. Each point was reviewed by the jury to ensure accuracy. Transcripts were subsequently reviewed to identify key reasons why jurors supported or rejected the presented options.

Ethics approval

Our study was approved by the Cancer Institute NSW Population and Health Services Research Ethics Committee (HREC/12/CIPHS/46).

Results

Jury 1

In response to the question, “What should happen before men decide whether or not to be tested?”, Jury 1 recommended that:

  • GPs should initiate discussions about PSA testing with 50–70-year-old asymptomatic men, and provide information about the limitations of the test and the potential benefits and harms of biopsy and treatment;

  • these discussions should be encouraged but not mandatory;

  • discussions should inform a man’s decision making rather than be constrained by formal procedures (eg, signing a form);

  • GPs should consider a cooling-off period, so that men need to wait 1 to 2 days after the discussion before being tested; and

  • the community should be informed about expert uncertainty regarding the PSA test, to stimulate discussion between men and their GPs.

Problems discussed by Jury 1 without reaching a consensus were:

  • the appropriate content for a patient information sheet;

  • how to communicate to men that they can opt out of PSA testing; and

  • whether to discourage PSA testing by charging a fee.

Juries 2 and 3, part A

Similar to Jury 1, the majority view of both Juries 2 and 3 was that GPs should introduce the topic of PSA testing to asymptomatic men aged 50–70 years (Box 3). Prostate cancer was seen as a legitimate health concern for older men, so that PSA testing was an appropriate topic for general health discussions. Jury 3 (all males) also argued that GPs were best placed to inform men about PSA testing, as GPs were a more reliable point of access to medical advice; relying on other information sources would be “leaving it to chance”. All men, they said, should have equal access to the same information.

A minority in both Juries 2 and 3 voted that GPs should not raise the topic of PSA testing with asymptomatic men because other, more important health issues should receive priority, and because men might be more inclined to have a PSA test if GPs raised the topic. They were particularly concerned about the unreliability of the test and the risks of unnecessary treatment ensuing.

Juries 2 and 3, part B

Like Jury 1, the majority of Jury 2 (mixed gender) voted that detailed benefit–harm information about PSA testing and prostate biopsy and treatment should be provided in advance to support informed decision making. This was a minority position in the all-male Jury 3 (Box 3).

The reasons given by members of Juries 2 and 3 for their views included:

  • men have a right to know relevant information before making a decision; and

  • after an elevated PSA test result, it might be difficult to refuse subsequent biopsy and treatment, and men may not obtain the information needed to decide about the next steps.

Similar to Jury 1, Juries 2 and 3 supported a cooling-off period so that men could reconsider their decision before testing.

The majority of Jury 2 (13 of 15) supported providing all information before PSA testing. However, 10 of the 13 objected that our wording (especially “should” and “all”) was too prescriptive. They wanted GPs to be free to provide information tailored to an individual’s level of interest and personal requirements.

Two-thirds of the all-male Jury 3 voted that information about the benefits and harms of biopsy and treatment should be provided only after an elevated PSA test result had been received. These jurors argued that the PSA test alone was not intrinsically harmful, and favoured staggering the delivery of information, with written information available to those who wanted it at any particular point. Jury 3 members, in particular, were concerned about “information overload”. They felt that most men would not want to understand the harms and benefits of prostate biopsy and treatment until it was directly relevant to them. They trusted GPs to tell them what they needed to know in a timely manner, avoiding unnecessary anxiety. Notably, some participants argued that details about the risks of biopsies and treatment options should be provided to men by urologists because of their specialist expertise.

Discussion

After two days of deliberation, all three community juries recommended that GPs should discuss the PSA test with asymptomatic men over 50 years of age as part of routine care. Jurors felt GPs were best placed to consistently inform men about PSA testing, rather than relying on their being informed (or not) by other sources. All three juries wanted GPs, if prompted, to provide information about the limitations, benefits and risks of testing, biopsy and treatment, and to offer to provide more details if desired by the patient. The concept of a cooling-off period to allow men to think about whether or not they wanted a PSA test was also highly valued.

All Jury 3 members were men, and many were having, and appeared committed to, routine annual PSA tests. They also reached different conclusions to the other juries about when information should be provided. While Juries 1 and 2 focused on what would be good for men generally, members of Jury 3 often focused on their own personal experiences and preferences, including a shared inclination to rely on a doctor’s assessment of the particular information that was required to inform a patient’s decisions. This suggests that, although an informed public prefers GPs to take an active role in educating men about the PSA test, some men of screening age may not wish to be burdened with uncertain and detailed information about the consequences unless they have received an elevated PSA test result.

There are valid reasons why GPs might resist raising awareness of the PSA test. Simply mentioning it may encourage men to favour being tested; patients differ in their information needs;19 and communicating the potential harms of PSA screening is difficult.20,21 The new consensus recommendations and NHMRC-developed information resources promise to support GPs in the challenging task of discussing the topic. Models for communicating information about screening in a balanced and patient-centred way have also been described in the literature. The “consider an offer” model,19 for example, suggests that GPs help men consider and evaluate recommendations or offers of screening, while explicitly acknowledging that the offer might reasonably be refused. Rather than encouraging screening or expecting people to analyse detailed evidence, whether they felt ready to do so or not, such patient-centred approaches could help individuals decide how much information they wish to receive, and to reflect on their values and preferences regarding benefits and harms when deciding whether or not to be screened.

A limitation to this study is that community juries are comprised of small groups of engaged citizens whose views may not represent those of the general public. However, as all three juries came to similar conclusions, it is likely that our findings are replicable. Our unit of analysis was the deliberative group, but we note that the findings from the all-male jury differed from those of the mixed-gender juries, and that the men in the mixed juries endorsed the final recommendations of the juries in which they participated. This suggests that gender-related factors may influence jury processes.

The juries were clear: GPs should raise the topic of PSA testing and explain the benefits and harms, but tailor their information to the individual patient. Timing of information provision was less clear. PSA testing, the juries concluded, is a health issue that matters to men, and GPs are a reliable, trustworthy source of advice on health issues. These jury outcomes invite critical reflection by professional bodies about how GPs should actively support individual men making decisions about PSA testing.

Box 1 –
The questions addressed to the three juries, and the options available for their verdicts

Jury 1 deliberated and drafted recommendations on the open question:

  • Consent and PSA testing for prostate cancer: “What should happen before men decide whether or not to be tested?”

Juries 2 and 3 were asked to vote on two questions:

  • Part A. Select 1 or 2:
    1. Should GPs introduce the topic of PSA testing during appointments with male patients who have no symptoms?
    2. OR

    3. Should they wait until men ask about it?
  • Part B. Which of these options do you endorse? (Please give your reasons):
    1. Men without symptoms should get all the information about the possible benefits and harms of testing, and biopsy and treatment, before they decide whether or not to have a PSA test.
    2. OR

    3. Men should not get information about possible benefits and harms of biopsy and treatment before PSA testing. Instead, the doctor should wait until they know the test result. If the test result is raised, then the doctor should give information.

      Jurors were asked to endorse either B1 or B2, and to give reasons for their decisions. The juries were repeatedly reminded that the questions were specifically about PSA testing for asymptomatic men.

Box 2 –
Characteristics of the jury participants

Jury 1

Jury 2

Jury 3


Number

13

15

12

Age

< 40 years

2

5

1

40–70 years

10

8

9

> 70 years

1

2

2

Range, years

28–70

19–75

37–74

Median, years

52

49

57

Gender

Male

9

9

12

Female

4

6

0

Highest educational attainment

High school

2

3

1

Trade or diploma

0

1

7

Bachelor degree

4

7

3

Postgraduate degree

7

4

1

Cultural background/ethnicity*

Australian

11

11

7

Southern/eastern European

0

1

0

Southeast Asian

1

0

1

Northeast Asian

1

2

2

Southern/central Asian

0

1

1

Northwest European

0

0

1

Socioeconomic status of suburb

Low

1

1

2

Middle

1

4

4

High

11

10

6


∗Based on the Australian Standard Classification of Cultural and Ethnic Groups (ASCCEG).22 †Based on Socio-Economic Indexes for Areas (SEIFA).23

Box 3 –
The outcomes of the deliberations of the three juries

Jury 1 recommendations

  • GPs should:
    • initiate discussions with 50–70-year-old asymptomatic men about PSA testing;
    • be prepared to provide men with information about all the potential harms and benefits;
    • consider instituting a cooling-off period so that men need to wait before taking the test.

Juries 2 and 3 verdicts

  • Part A
    1. Should GPs introduce the topic of PSA testing during appointments with male patients who have no symptoms?
    2. OR

    3. Should they wait until men ask about it?
    4. Jury 2 (mixed gender, n = 15) voted 12–3 for option 1;

      Jury 3 (all men, n = 12) voted 10–2 for option 1.

  • Part B
    1. Men without symptoms should get all the information about the possible benefits and harms of testing, and biopsy and treatment, before they decide whether or not to have a PSA test.
    2. OR

    3. Men should not get information about possible benefits and harms of biopsy and treatment before PSA testing. Instead, the doctor should wait until they know the test result. If the test result is raised, then the doctor should give information.
  • Jury 2 (mixed gender, n = 15) voted 13–2 for option 1;

    Jury 3 (all men, n = 12) voted 8–4 for option 2.

Scrapping the Healthy Kids Check: a lost opportunity

Maintaining child preventive health and developmental assessments will challenge general practice from 1 November

In May, the federal government announced in the 2015–16 Budget that the Healthy Kids Check (HKC) Medicare items will be discontinued from 1 November 2015,1 citing underperformance, cost blowouts and duplication of state and territory programs.

The HKC was introduced into general practice in 2008, policy that reflected advances in neuroscience (eg, the evolution of brain architecture, critical time points for development and the benefits of early intervention) and significant health shifts towards prevention. Uptake of the health assessment was slow (16% of eligible children in its first year2) and beset by argument about a lack of evidence for some of its mandatory components3 and by scaremongering about labelling 3-year-olds with mental health diagnoses.4 In the ensuing negative debate, it was easy to forget major barriers to preventive health care before the HKC: sick child consultations, poor remuneration, lack of time, resources and training,5 and the ever-increasing demands of chronic disease management in an ageing population. Nevertheless, over the next 7 years, uptake of the HKC climbed to 50%,2 as practice nurses were upskilled and parents were incentivised by tax benefits.6 Our research with practitioners, 3 years after its introduction, indicated that in some circumstances, the HKC had acted as a catalyst for general practitioner and practice nurse (PN) role development, and in some cases promoted an entire practice shift towards preventive health care for young children.7 The important contribution made by PNs, in particular, has been overlooked by the government in its statement that GPs can continue to provide health assessments as part of Medicare-funded general GP attendance items,8 because PNs are excluded from those services.

The government also contends that no evidence had been provided to show that HKCs deliver superior benefits to children. The findings of an evaluation of the “expanded HKC”, which underwent trialled in eight Medicare Locals in 2013, have not been made public, but one published study considered the outcomes from HKCs and found that a fifth of HKCs uncovered some sort of health or developmental problem, and between 3% and 11% of HKCs changed the health management of the children concerned.9 Despite lower than expected prevalence estimates for some childhood conditions reported in this study (eg, overweight and oral health problems), the findings still showed that significant numbers of children could benefit from an HKC.

Duplication of state-funded child and family health nurse (CFHN) services was put forward as justification for the removal of HKCs. However, CFHN service delivery varies widely between the states. Even in Victoria, where comprehensive services are provided, only two-thirds of families attend the 3.5 year health assessment.10 Our research with parents revealed that although some parents were willing to visit CFHNs with their infants, not all parents presented with their toddlers.11 For a variety of reasons, parents “get busy”, so that attendance rates drop off after the first year of a child’s life and with successive children.11 We do not know if CFHN non-attendees are the families receiving HKCs from the GP, but GPs are used to working with families and young children. Within this setting of established relationships, some parents choose to have their children vaccinated by their GP, rather than attend local council services or CFHN clinics. Providing parents with a choice of immunisation providers improves access and thus contributes to overall high coverage of child immunisation coverage.

Without a similar comprehensive approach to child developmental assessment, children will miss opportunities for early intervention. In 2012, for example, the average age of children being diagnosed with an autism spectrum disorder was 4 years 1 month despite diagnosis being possible in the second year.12 This suggests that many children are not being diagnosed before school.

The HKC also provides the context to address rates of childhood overweight that already affect more than 20% of preschoolers13 and rates of dental caries that affect one in two children aged 5 years.14 Without protected opportunities to engage parents regarding child preventive health and without the signal that the HKC gives to parents that GPs are interested in such issues, children will continue to miss out on preventive health activities routinely delivered to other sectors of the population.

By scrapping the HKC, not only are we reducing the chances of identifying problems earlier but we are effectively reducing the capacity of general practice to promote the health and development of young children, the most vulnerable in our population, who stand to gain the most over the course of their lifetime. This is a retrograde step for Australia’s future.

NPS Medicine Wise: Managing Iron Deficiency

The latest news from NPS MedicineWise provides information for GPs on identifying and correcting iron deficiency before surgery to help patients avoid a blood transfusion.

Patients with anaemia are significantly more likely to receive a blood transfusion compared with patients who were not anaemic prior to surgery. Blood transfusion is itself associated with morbidity and mortality in the postoperative period. In addition to risk of transfusion, it has been demonstrated that anaemia is associated with increased morbidity and mortality following orthopaedic surgery as well as impacts on postoperative recovery and quality of life.

NPS MedicineWise and the National Blood Authority have collaborated to develop a suite of resources to help GPs manage patients who are on a surgical waiting list and may require treatment for iron deficiency and anaemia.

Two decision algorithms, one for patients with inflammatory markers and one for patients without inflammatory markers, are available to help with the decision process. A sample referral letter is available to facilitate communication with the acute care teams. For more information visit the NPS MedicineWise website.

AMA members can also access this information via the GP Desktop here on doctorportal. GP Desktop brings together in one place all the forms, guidelines, practice tools, information and resources used by general practitioners in their daily work. It is free to members and has links to around 400 administrative and diagnostic tools, making it a great time saver.

This post was published in GP Network News.