×

Your postcode shouldn’t determine your health – or whether you’re admitted to hospital

People ending up in hospital for diabetes, tooth decay, or other conditions that should be treatable or manageable out of hospital is a warning sign of system failure. And Australia’s health system is consistently failing some communities.

A Grattan Institute report, Perils of place: identifying hotspots of health inequalities, released today, identifies a number of geographical areas where high rates of potentially preventable hospital admissions have persisted for a decade. This is unacceptable place‑based inequality.

Using data from Queensland and Victoria, the report identifies 38 places in Queensland and 25 in Victoria that have had potentially preventable hospitalisation rates at least 50% higher than the state average in every year for a decade. There is no evidence to suggest the pattern is any different in other states and territories.

Reducing potentially preventable hospitalisations in these places to average levels would save at least A$10 million a year for the Queensland and Victorian health systems. Indirect savings, such as improving the productivity of the people affected, should be significantly larger.

Different places, different problems

Some of the areas identified as having high rates of potentially preventable admissions were in remote areas such as Mt Isa in Queensland. Others were in suburban centres such as Broadmeadows in Melbourne.

In some places, the high rates of admissions were driven by high rates of re-admissions – a small number of people each having a large number of admissions each year. In these places, better targeting care to high-risk individuals may help to reduce rates.

Yet in other places, re-admissions did not contribute to the problem at all.

Areas that have a low socioeconomic status, are regional, and/or have a high proportion of Indigenous people are more likely to experience health inequalities.

But even in Australia’s most disadvantaged areas, persistently high rates of potentially preventable hospitalisations are rare. Because many such areas have low rates of potentially preventable hospitalisations, examining why some have a problem while others do not may help to understand what needs to improve.

What can governments do about it?

The Grattan Institute’s report has three clear messages for governments and local health agencies such as Primary Health Networks.

First, make sure prevention efforts are focused in places where high rates of potentially preventable hospitalisations have existed for a while. These are the places where health inequalities are already entrenched and, without intervention, are most likely to endure.

On average, about half of areas which had a high rate of potentially preventable hospitalisations in one year had dropped back to closer to the state average the next year (55% in Victoria, 45% in Queensland). This means that if governments or Primary Health Networks make their intervention decisions based on just one year of data, they will have a false sense of reassurance that their interventions are working when in fact their success might just be the result of random chance.

Second, think local. Australia is not a uniform country and a one-size-fits-all approach will not work. Some areas may have excellent local primary health care services but, in the face of very severe disease burdens, the area ends up with a high rate of potentially preventable hospitalisations. Other areas might have poor access to primary care services.

There is no uniform pattern for the causes of high rates of potentially preventable hospitalisations. Tailored policy responses are required.

Primary Health Networks have been given responsibility to identify and address health needs in their regions. They must identify the areas with high rates of potentially preventable hospitalisations and distil why these rates are occurring. They then need to design locally tailored responses, in partnership with local health authorities and communities.

Unfortunately, there is as yet only limited evidence of what works in reducing potentially preventable hospitalisations. Governments should therefore invest in trials to reduce potentially preventable hospitalisations in places identified as having high rates.

The cost-effectiveness of interventions must be established on a small scale before they are rolled out to further areas.

This leads to the third message: interventions must be rigorously evaluated so they expand the evidence about what works. As Primary Health Networks become more sophisticated at identifying the people most in need and as the evidence from trials builds, efforts to reduce health inequalities should be strengthened and expanded beyond the priority places identified here.

The role of place in shaping people’s health and opportunity is well-established. Governments and Primary Health Networks must ensure all communities get a fair go.

Improving the health of people in these places with high rates of potentially preventable hospitalisations will, in the long-run, reduce health costs. Even more importantly, it will increase social cohesion and inclusion, workforce participation and productivity, by making many more people healthy and able to make the most of their lives.

Stephen Duckett, Director, Health Program, Grattan InstituteThe ConversationThis article was originally published on The Conversation. Read the original article

Other doctorportal blogs

What to tell your patients who are travelling to Brazil

With the Olympic Games in Brazil starting in less than a month, Australia’s retiring Chief Medical Officer, Professor Chris Baggoley has released some important health messages for spectators travelling to the Games.

Brazil is experiencing a Zika virus outbreak and there is also the presence of other mosquito-borne diseases including yellow fever, dengue and chikungunya.

The vaccine for yellow fever should be given at least 10 days before travellers arrive in Brazil. Travellers should be aware that many countries, including Australia, need proof of yellow fever vaccination before they allow entry so they should ensure they have their yellow fever certificate when they travel.

GPs are being urged to ensure patients are made aware of the risks involved in visiting Brazil, particularly women who are pregnant or seeking to become pregnancy as Zika virus can cause severe birth defects, including microcephaly.

Women who are pregnant or seeking to become pregnant should defer travel to Zika affected areas including Brazil.

Related: Protection of Olympian proportions

For those who aren’t pregnant or seeking pregnancy, they should take these precautions to avoid mosquito bites:

  • Use insect repellent containing DEET or picaridin.
  • Wear light-coloured clothing that covers as much skin as possible.
  • Ensure there are fly screens or air conditioning at accommodation.
  •  If the accommodation doesn’t have those options, sleep under a mosquito net.

Regarding the sexual transmission of Zika virus, travellers should be advised:

  • Men who travel to Brazil and who have a pregnant partner should abstain from sex or use condoms for the duration of the pregnancy.
  • For couples planning pregnancy and travelling to the Games, it’s recommended women wait at least 8 weeks for attempting pregnancy. If the woman’s partner travelled with her and contracts Zika, they might have to wait 6 months before trying for pregnancy.
  • Men travelling to a Zika affected area should avoid unprotected sex for 8 weeks after returning.

GPs are encouraged to display this poster in their practice and give this brochure to patients travelling to the Games. This information is designed to inform travellers on how they can reduce the risks of contracting Zika virus, get travellers thinking about yellow fever vaccination, and instruct travellers on how they can protect themselves from mosquito-borne illness.

To obtain hard copies of either the brochure or the poster, please email humanquarantine@health.gov.au with your details and quantity needed and they will be mailed out. More information is available on the Department’s website at health.gov.au/rio2016 or email humanquarantine@health.gov.au.

Latest news:

Health policy in play as Coalition licks wounds

AMA President Dr Michael Gannon has intensified his calls on the Government to dump its Medicare rebate freeze policy and reverse other health cuts amid mounting pressure within the Coalition for changes to health policy following the narrow Federal election result.

Seizing on admissions from Prime Minister Malcolm Turnbull that health policy concerns swayed many voters away from his party, Dr Gannon has called on the Coalition to change course and treat health as an investment, rather than a cost.

“The Prime Minister, the Coalition, have had the scare of their life,” Dr Gannon said. “It’s very clear that Australians value their health, and many of them voted on the grounds that they were worried about their health care.”

Last week the Coalition secured the 76 seats needed to form Government in its own right after suffering a national swing of 3.4 per cent against it. The narrow victory (the ABC predicts Labor will hold 68 seats, the Greens and Xenophon Team one each, and three independents) prompted a wave of finger-pointing and recriminations within conservative party ranks, including calls to revisit health cuts made in the 2014 and 2016 budgets.

Rancour over the close election result extended to include speculation that Health Minister Sussan Ley would be dumped amid complaints she had not done enough to counter Labor’s attack lines on the Government over Medicare. Her supporters, though, revealed that she had been muzzled from speaking out during the campaign by Liberal strategists, and Dr Gannon said that, from afar, it seemed “that the Coalition didn’t want to talk about health in the campaign, and that they had silenced Minister Ley”.

Dr Gannon said the big lesson for the Government from the election was that the public valued the health system highly, and in post-election talks with the Prime Minister he had reinforced the need to invest in general practice, increase public hospital funding and reverse cuts to bulk billing incentives for pathology and diagnostic imaging services.

The AMA President said Mr Turnbull understood the AMA’s concerns.

“I think that in an ideal world he would unravel the freeze tomorrow,” he told ABC radio. “What we have seen in the past, going back to the 2014 Budget, was a desire by the Coalition to introduce a co-payment to try and work out ways that those who can afford it can contribute more to the cost of their health care.

“Now, the reason that proposal failed so badly is because it didn’t give the opportunity for individual GPs to make a judgement, knowing their patients well, who can and can’t afford even a modest amount of money.”

Asked if he would re-visit the idea of a patient co-payment, Dr Gannon said he was not seeking “a re-energisation” of the co-payment debate, but instead wanted a serious discussion about the future funding of Medicare.

“My comments…are about being able to have conversations about why those two [co-payment] proposals from two years ago were not good policy, being able to have a conversation about how we fund Medicare, 15, 20 years in advance,” he said on radio station 2GB.

“We’re not far off the balance in Australia, it just needs some tinkering around the edges. And I’m really keen to, in this next Parliament, with a knife-edge result in the Lower House and a very interesting Senate…I’m just hopeful we can have these conversations that make sure that Medicare is there to protect people in 20 years’ time, and have more than that two- or three-year view of it.”

The Government appears receptive to calls to re-visit its health policies.

As the Coalition took stock of the extremely tight Federal election result, Mr Turnbull said it was clear that Labor’s message that the Coalition posed a threat to Medicare had fallen on “some fertile ground”.

“What we have to recognise is that many Australians were troubled by it. They believed it, or at least had anxieties raised with it. It is very clear – it is very, very clear – that [Deputy Prime Minister] Barnaby [Joyce] and I and our colleagues have to work harder to rebuild or strengthen the trust of the Australian people in our side of politics when it comes to health. There is no question about that,” Mr Turnbull said.

“We have to recognise that there is a real issue for us if people voted Labor because they genuinely believed or they feared that we were not committed to Medicare, because that is not the case. So that is why Barnaby and I, as we reflect on this and our colleagues reflect on this, that is something that is an issue we have to address,” Mr Turnbull said.

Dr Gannon told ABC radio the election result had shown just how important health policy was for voters, and it was clear that the Medicare rebate freeze, combined with earlier polices such as the GP co-payment, meant Labor’s scare campaign on Medicare had resonated with voters.

“If we go back to the first co-payment model in 2014, which came out of the much-maligned Budget that year, if we look at Co-payment Mark II which came out later that year, it possibly showed that health policy was being run out of Treasury,” Dr Gannon said. “The Coalition has realised maybe too late…that people do worry about their health, they do vote on it, they do regard it as one of the major issues when they decide how to vote.”

Adrian Rollins


More funding needed for Health Care Homes trial

GPs are still waiting for clarity on whether appropriate funding will be offered for services to patients under the Government’s $21 million Health Care Homes trial.

Under the model, also known as the Medical Home, patients suffering from complex and chronic health problems will be able to voluntarily enrol with a preferred general practice, with a particular GP to coordinate all care delivered.

The Government announced the model in March, with $21 million to allow about 65,000 Australians to participate in initial two-year trials in up to 200 medical practices from 1 July 2017.

The trial was one of the recommendations of the report of the 2015 Primary Health Care Advisory Group, headed by former AMA President Dr Steve Hambleton.

It was hailed as a step in the right direction for chronic disease management, with the Labor Opposition announcing plans for a similar trial.

However, the Labor proposal came with $100 million of funding, while under the Government model, the funding is not directed at services for patients, but rather on clinical need.

Professor Jane Gunn, the head of the General Practice Department at the University of Melbourne’s medical school, said the outcomes of similar trials, such as the 1994 coordinated care trials and the more recent diabetes care project, highlighted the difficulty in driving health delivery reform.

“The coordinated care trials showed some promise but were costly to implement and too costly to scale up,” Professor Gunn wrote on The Conversation website.

“They were difficult to replicate and few were sustained outside the trial environment.

“The impact of the diabetes care project was also disappointing. The diabetes care project included many of the elements of [the advisory group’s] report, such as bundled payments, yet only small gains were made in health outcomes and the cost-effectiveness of the model was not proven.

“The bundled payment used in the diabetes care project was viewed as inadequate.”

Making improvements in chronic disease management would require strong buy-in from all stakeholders, but it would be a challenge to get eligible practices and patients to sign on for the trial, she said.

“One of the biggest challenges will be to work out exactly how much the Government should pay a practice for providing a person with all their chronic disease care in a year,” Professor Gunn said.

“Working out how an individual GP will get their fair share of the chronic disease payment is likely to make for interesting negotiations and new ways of working for practice managers.

“Female GPs will be vulnerable to further pay inequities as they are less likely to be practice owners and more likely to work part-time.

“It is also not clear whether the recommended ‘bundled payment’ would include more radical models where the practice has to fund payment for pathology, imaging and medications from the ‘bundled payment’.”

AMA President, Dr Michael Gannon, said the AMA was keen to work with the Government to make the trial a success, but appropriate funding would be a critical test.

“The Medical Home is fundamental to the concept of the family doctor who can provide holistic and longitudinal care and, in leading the multidisciplinary care team, safeguard the appropriateness and continuity of care,” Dr Gannon said.

“BEACH data shows that GPs are managing more chronic disease. But they are under substantial financial pressure due to the Medicare freeze and a range of other funding cuts.

“GPs cannot afford to deliver enhanced care to patients with no extra support. If the funding model is not right, GPs will not engage with the trial and the model will struggle to succeed.”

With the right support, GPs can provide more preventive care services and greater management and coordination of care, keeping patients healthier and out of hospital, he said.

“Health played a major part in the Federal Election and the Government must now demonstrate that it has heard the people’s concern regarding the ongoing affordability of their health care,” Dr Gannon said.

“The Medical Home must be appropriately funded to succeed.”

Maria Hawthorne


The 3 cancers most challenging to diagnose in general practice

A study has found that certain cancers often take up to three or more general practice visits before a patient is referred to a specialist.

The research, published in this week’s Medical Journal of Australia, found pancreatic, prostate and multiple myeloma were the most likely to have non-specific symptoms and controversial timing of testing which made them harder to diagnose.

Professor Jon Emery together with Ms Karen Lacey and colleagues wrote: “With the exception of jaundice, which is a presenting symptom in only very few cases, the positive predictive value of other common symptoms of pancreatic cancer is very low.”

Related: Pancreatic cancer treatment needs consistency

Other cancers such as breast cancer have more specific symptoms and higher community awareness.

34% of the patients included in the final analyses had visited the GP at least three times before referral to a specialist.

The study also examined the time between when symptoms were noticed and when the patient saw a specialist.

Patients with pancreatic and brain cancers were more likely to consult a GP several times before being referred, however it was generally less than three months between symptoms being noticed and specialist referral.

“This may be because of clearer and more rapid referral pathways for patients with these cancer types,” the authors wrote.

Related: MJA – Pancreatic cancer: gradual rise, increasing relevance

For a third of people with colon and prostate cancer, it took at least 3 months before they saw a hospital doctor, “possibly because patients or GPs erroneously attribute symptoms to more common, benign conditions; alternatively, limited access to gastroenterologists or urologists may be important.”

The authors say the research suggests that GPs may need to raise their level of suspicion for symptoms suggestive of certain cancers.

“Earlier diagnosis of these cancers may require different approaches to those that have been successful for breast cancer. Strategies should be investigated that reduce missed opportunities for diagnosing cancer earlier in general practice, including decision support tools, fast track referral pathways, and significant event audit,” they wrote.

Latest news:

Family doctors: invaluable to health

As the new Chair of the AMA Council of General Practice, I am honoured to follow on from my predecessor, Dr Brian Morton, and wish to acknowledge him for his six years of leadership and service to the Council and to general practitioners.

It is certain that as a profession we will have some interesting times ahead of us as the dust from the Federal Election settles. If there is one thing we know for sure from the last few weeks, it is that putting health on the backburner is risky business. The Government must be in no doubt now that health is a priority, and that it will have to do more than it has to date to ensure vulnerable patients do not have to worry about whether or not they can afford to see their GP when required, and to have pathology and radiology investigations when requested.

Next week we will be celebrating general practice and the primary role played by Australia’s GPs, our family doctors, as frontline and holistic health care providers. Throughout Family Doctor Week (24-30 July), the AMA will be highlighting how invaluable the family doctor is to patient health, and to the health system more broadly.

We know from international comparisons that countries with a strong GP-led primary care system have lower rates of ill health, better access to care, reduced rates of hospital admissions, fewer referrals to other specialists, less use of emergency services, and better detection of adverse effects of medication.

The comprehensive care provided by our nation’s family doctors needs to be seen by Government as an investment rather than as an expense. With only 6 per cent of Australia’s total health expenditure on general practice, our family doctors have proven the value of their care. Ending the freeze on Medicare rebates, raising the rebates and lifting rates of indexation to cover the true costs of care must be at the top of the Government’s to-do list.

For most patients, our general practices are their medical home. If appropriately funded, rather than struggling for viability, we know we can do more to help our patients live the healthiest life they can. We can do this though appropriate health screening and life-stage assessments, through structured care that is patient-centred and planned, through greater use of innovative technology that not only empowers patients in managing their conditions, but enables us to monitor their progress, through better use of medicines, and through care that is streamlined and coordinated within our multidisciplinary health care team.

Family Doctor Week will highlight that, properly funded, the medical home has the potential to both improve the care patients receive, and to save on more costly downstream health costs.

Supporting general practices to bring non-dispensing pharmacists into the health care team is but one way Government can invest to deliver better patient outcomes and minimise avoidable hospital admissions. The AMA’s Pharmacist in General Practice Program would deliver $1.56 in savings for every $1 invested by ensuring the quality use of medicines, medication optimisation and increased medication compliance, reducing adverse drug events and hospitalisations as a result.

In rural and remote areas, Government needs to assist general practices with appropriately designed and implemented infrastructure grants to expand their facilities to better meet the complex health needs of people in these communities.

You can support us in supporting you by visiting the website family-doctor-week-2016 and downloading and displaying the poster and your Family Doctor Logo, and by using #amafdw16 if tweeting or sharing FDW content on social media.

The opportunities of the new Australian Parliament

The composition of the new Federal Parliament provides excellent opportunities for the development of a health policy for Australia. 

This is because the many points of view that need to be reconciled to achieve a comprehensive and inclusive policy will be represented in the new parliamentary configuration. While this may at first sight seem clumsy and inefficient, it is a process critical to developing a policy that will guide health service provision and financing on behalf of the community.  As the Canadian commentator John Ralston Saul has written, the price of democracy is inefficient conversations – lots of them – that allow for all voices to be heard.

There is a further reason to be pleased that in the new arrangements a more cautious, inclusive and conversational approach will be applied to the development of a national health policy. It is that all too often, insufficient consideration is given to the unintended side effects of what appear to be bright new policy initiatives. 

Amartya Sen, a Nobel Prize winning Indian philosopher and economist, refers to this omission as one of the more common cardinal errors of social policy makers.  If asked, all the players may be able to provide more insights than one thinking alone. 

Simply having many players at the policy table does not, of course, guarantee freedom from this error.  As the Chilcot Report on the United Kingdom’s involvement in the recent Iraq war points out, a ‘coalition of the willing’ failed to question in depth what the consequences of war would be in the longer term. It was as though the policy stopped halfway.

The unintended side effects of the (good) policy to fund clinical psychologists to assist with the management of patients with mental health problems via general practice – workforce redistribution and budget over-runs – are examples of side effects that may have  been anticipated if more ‘thought experiments’ – thinking through what might follow – had been conducted prior to implementation.

By what process might this policy be developed? 

First, parliamentary leadership is required. A policy development oversight group that is genuinely multi-partisan should be established. This is not a matter of setting up yet another expert committee or commission of advice. The politicians need to lead. How the group wishes to proceed is, of course, entirely up to them.

Second, it is critical that high on the group’s agenda be a discussion about what Australia may reasonably expect from its health services, private and public, hospital and community, curative and preventive. There must be limits: what are they? How far do we wish to go in ensuring equity of access? How far in privatising the costs of health care? This is a special problem for patients who have serious and continuing complex problems, as my colleagues and I and many others have documented. Chronic illness is a fast track to poverty at present.

There are many topics to be discussed – which underlines my argument in favour of an inclusive conversation, auspiced by the Parliament, to begin. Attitudes vary in relation to prevention, and in the last Parliament a national agency for prevention was abolished. Is that what we want to do, or the best we can do?

And what are our expectations of research as a society? We know what experts and academics expect, but there are other voices as well that need to be heard, including those of some who have values espoused by science (and some who don’t).

Finally, there are ways of doing policy development well. From my personal perspective, I place a high premium on the contribution that solid data can make to the process. But my experience with policy development leaves me in no doubt that the ‘voice’ of data is but one voice. For a policy to work, data elegance is not enough. There must be buy-in from those whose lives and livelihoods are affected by it.

The new parliamentary structure requires a more humble and inclusive approach to policy formation.  Nowhere is this of more value than in working out where we as a nation are going with health and health care.

Appropriate use of serum troponin testing in general practice: a narrative review

In this article, we review the evidence regarding troponin testing in a community setting, particularly relating to new information on the utility of high sensitivity assays and within the context of contemporary guidelines for the management of chest pain and the acute coronary syndrome. For this review, we synthesised relevant evidence from PubMed-listed articles published between 1996 and 2016 and our own experience to formulate an evidence-based overview of the appropriate use of cardiac troponin assays in clinical practice. We included original research studies, focusing on high quality randomised controlled trials and prospective studies where possible, systematic and other review articles, meta-analyses, expert consensus documents and specialist society guidelines, such as those from the National Heart Foundation of Australia and Cardiac Society of Australia and New Zealand. This article reflects our understanding of current state-of-the-art knowledge in this area.

What is the purpose of the serum troponin assay?

The troponin assay was designed to assist in diagnosis and improve risk stratification for people presenting in the emergency setting with symptoms suggestive of an acute coronary syndrome.1,2 These symptoms include:

  • chest, jaw, arm, upper back or epigastric pain or pressure

  • nausea

  • vomiting

  • dyspnoea

  • diaphoresis

  • sudden unexplained fatigue.

As the troponin assay was not designed for use in clinical contexts outside that of a possible acute coronary syndrome, an elevated troponin level in a patient without this history, although of prognostic value, is not likely to be due to myocardial infarction unless it was caused by a clinically silent event. The troponin test result should always be interpreted with reference to symptoms, comorbidities, physical examination findings and the electrocardiogram (ECG). The degree of troponin elevation is also used for quantifying the size of myocardial infarction, although it is not well validated for this purpose.3,4

What are the causes of serum troponin elevation?

Unlike the earlier creatine kinase assay, which was not specific to cardiac muscle, troponins are structural proteins unique to cardiac myocytes, and any elevation represents cardiac muscle injury or necrosis. Most cardiac troponin is attached to the myofilaments, but about 5% is free in the cytosol. In acute myocardial infarction or following cardiac trauma, there is disruption of the sarcolemmal membrane of the cardiomyocyte and release of the troponin in the cytoplasmic pool. There is a delay in the appearance of troponin in serum of between 90 and 180 minutes,57 which means there is a requirement for serial testing of troponin levels in hospital emergency departments. Later, there is a prolonged release of troponin from the degradation of myofilaments over 10–14 days.

It is now clear that troponin may also be released under conditions of myocardial stress without cellular necrosis (including tachyarrhythmia, prolonged exercise, sepsis, hypotension or hypertensive crisis and pulmonary embolism)8,9 (Box 1), probably through the mechanism of stress-induced myocyte bleb formation10 and release of a small portion of the cytoplasmic troponin pool. Elevations of troponin seen in this context are sometimes erroneously referred to as “false positives”; this is incorrect because any troponin elevation is truly abnormal and is prognostic in many clinical states outside of the acute coronary syndrome.11

The serum troponin assay was designed to screen patients for spontaneous, usually atherothrombotic, myocardial infarction, but under the new classification of myocardial infarction (Box 2),12 troponin elevations associated with demand–supply imbalance have led to the new diagnostic category of type 2 myocardial infarction (which is more likely to be associated with reversible or minimal myocardial injury, rather than permanent myocardial necrosis). The prevalence of all types of myocardial infarction, particularly type 2, has been amplified by the new high sensitivity troponin assays. A rise and fall in serum troponin level is required to confirm an acute myocardial infarction, irrespective of the type of troponin assay used. Chronic stable elevations are seen in some conditions (eg, chronic heart failure) where the lack of change over time indicates that an acute process is not present. True instances of false-positive troponin elevation due to calibration errors, heterophile antibodies or interfering substances have been greatly reduced by improved analytical techniques, blocking reagents and the use of antibody fragments.

What is different about the new high sensitivity troponin assays?

The newly developed high sensitivity assays provide reliable detection of very low concentrations of troponin and therefore offer earlier risk stratification of patients with possible acute coronary syndrome (3 hours after an episode of chest pain).7 The high sensitivity assays are also presented in different units (ng/L, rather than the previous μg/L), enabling the reporting of whole numbers (eg, 40 ng/L is equivalent to the earlier assay report of 0.04 μg/L).

By expert consensus, the assay must have a coefficient of variance of < 10% at the 99th percentile value of a reference population,13 which is the cut-off used for elevation. The benefit of the improved precision of the new high sensitivity assays is that even small elevations above this cut-off can be considered a true elevation, rather than an artefact of the assay. Examples of cut-off for elevation (> 99th percentile of a reference population) include a high sensitivity troponin T (hsTnT; Roche Elecsys) level of 14 ng/L, and a high sensitivity troponin I (hsTnI; Abbott Architect) level of 26 ng/L (these values may differ between pathology laboratories). It has been suggested that sex-specific cut-off values should be provided,12 and, in Australia, laboratories reporting the hsTnI assay often use these differing cut-offs (female, 16 ng/L; male, 26 ng/L).

A study in an Australian hospital found that use of the high sensitivity assays was associated with significantly earlier diagnosis and less time spent in the emergency department, but did not change the revascularisation rate or reduce mortality.14 A recent meta-analysis demonstrated that about 5% of an asymptomatic community population had an elevated serum troponin level when tested using a high sensitivity assay,11 clearly different to the reference population (screened to exclude comorbidities) that was used to derive the assay cut-off. Even in this asymptomatic cohort, an elevated troponin level had prognostic significance and was associated with a threefold greater risk of adverse cardiac outcomes compared with people with normal troponin levels. This reflects a greater hazard than identified previously for those with elevated cholesterol (risk ratio [RR], 1.9) or diabetes, (RR, 1.7) or even from smoking (RR, 1.68).15

As older patients (aged ≥ 65 years) have a high prevalence of elevated troponin levels, a higher troponin cut-off has been proposed for this group.16,17 More than 50% of patients with heart failure have elevated high sensitivity troponin levels, and the level is correlated with prognosis.18 It has also been shown in a large cohort of patients with chronic atrial fibrillation who were taking anticoagulant therapy19 that troponin elevation was independently related to the long term risk of cardiovascular events and cardiac death.

When should a general practitioner measure serum troponin and what should be done if a high serum troponin level is found?

Patients who present with a history of a possible acute coronary syndrome, but have been symptom-free for between 24 hours and 14 days previously, and who have no high risk features (ongoing or recurrent pain, syncope, heart failure, abnormal ECG) could be assessed with a single serum troponin test. If patients have had ongoing symptoms within the preceding 24 hours, they should be referred immediately to an emergency department for assessment.20 For patients in whom a single troponin test is appropriate, the test should be labelled as urgent and, as the result has prognostic implications and may require an urgent action plan, a system must be in place to ensure medical notification of the result at any hour of the day or night. In this clinical context, even a small elevation in serum troponin level may indicate an acute coronary syndrome during the preceding 2 weeks, warranting urgent cardiac assessment and hospital referral.20 However, a negative serum troponin result in the absence of high risk features does not exclude a diagnosis of unstable angina, and urgent cardiac assessment would still be appropriate if the presenting symptoms are severe or repetitive.

When should a general practitioner not measure serum troponin?

Patients presenting with a possible acute coronary syndrome with symptoms occurring within the preceding 24 hours, or with possible acute coronary syndrome more than 24 hours previously and with high risk features such as heart failure, syncope or an abnormal ECG, require further investigations.20 These may include urgent angiography, serial troponin testing and further ECGs in a monitored environment where emergency reperfusion treatments are available. These patients should be referred and transported to a hospital emergency department by ambulance, as it is not appropriate to perform serial troponin testing of high risk patients in a community setting.20 High risk ECG abnormalities include tachyarrhythmia or bradyarrhythmia, any ST deviation, deep T wave inversion or left bundle branch block. Serial troponin testing is required to confirm a diagnosis of myocardial infarction, and these patients may require fibrinolysis or urgent angiography and revascularisation.

Measurement of troponin in asymptomatic people is not currently recommended as the result may be problematic, with multiple possible causes and no clearly effective investigative strategies or therapies, and has to be interpreted with respect to the entire clinical context.

Case reports of appropriate and inappropriate use of troponin testing

Patient 1

A 72-year-old woman with type 2 diabetes tells you that she had 2 hours of chest tightness 4 days ago, but has been feeling well since then. Her physical examination is unremarkable, and you think her ECG is normal. You arrange for her to have an urgent serum troponin test, and the result is significantly elevated (hsTnI, 460 ng/L; female reference interval [RI], < 16 ng/L). You call a cardiologist, who arranges her immediate admission to hospital. Echocardiography shows hypokinesis of the anterior wall and apex and a left ventricular ejection fraction of 48%. Angiography shows a severe proximal left anterior descending artery lesion, which is treated with coronary stenting, and minor disease of the other arteries. She is discharged and has a good outcome.

Comment

In this setting, measurement of troponin is reasonable, as her symptoms occurred 4 days previously and she has had no further symptoms and has no high risk features.

Patient 2

A 68-year-old man presents to your surgery with a history of severe chest tightness lasting for 2 hours that morning. It has now resolved and he is pain-free 5 hours later. He has no major cardiovascular risk factors and his physical examination and ECG are normal. You do not order any other tests and arrange ambulance transport to a hospital emergency department. Testing at the hospital shows that his hsTnI level is elevated (84 ng/L; male RI, < 26 ng/L), and angiography shows severe left main coronary artery disease. He undergoes coronary revascularisation and has a good outcome.

Comment

This patient has had possible acute ischaemic symptoms within the past 24 hours. Troponin testing in a general practice setting should therefore not be performed, and the actions taken in sending this patient for urgent assessment are appropriate.

Patient 3

A 62-year-old man with no relevant past medical history presents with a history of several episodes in the past week of dull central chest pain lasting 5–10 minutes; the latest episode was 3 days ago. His physical examination and ECG are considered normal. An urgent serum troponin assay is performed and the result is normal (hsTnI, 3 ng/L; male RI, < 26 ng/L). You are worried that his clinical presentation may still be consistent with unstable angina. You contact a cardiologist, who arranges a stress echocardiogram the following day, which is strongly positive. The patient is admitted and is found to have severe three-vessel coronary artery disease. He undergoes revascularisation, with a good outcome.

Comment

This patient presents with symptoms suggestive of unstable angina. In this setting, irrespective of any troponin values, further urgent assessment is required.

Patient 4

A 52-year-old obese man with controlled hypertension has had multiple episodes in the past 12 months of prolonged retrosternal burning pain. These have often lasted several hours and are particularly worse after meals and when recumbent. He has had no symptoms for the past 4 days. His physical examination and ECG are normal. A serum troponin test result is normal. You arrange a stress echocardiogram, which is normal, and an upper gastrointestinal endoscopy, which shows severe reflux oesophagitis. He commences taking proton pump inhibitors and has good control of his symptoms.

Comment

The symptoms of cardiac ischaemia are often atypical. In the absence of recent symptoms, consideration of a cardiac cause of this patient’s presentation is essential and, in the context of this case, a single troponin test is appropriate.

Patient 5

A 58-year-old formerly well woman presents to you immediately after a 1-hour episode of burning central chest discomfort, which resolved spontaneously. She has experienced minor chest pain episodically for the past 3 days. Her physical examination and ECG are normal. It is 7 pm; you order a serum troponin test and give her a referral for an upper gastrointestinal endoscopy. As you leave the surgery, you turn off your mobile phone so that you will not be interrupted, as you are going to the cinema. When you turn your phone on later that evening, you have two messages. The first message tells you that the troponin test result showed an elevated level (hsTnI, 43 ng/L; female RI, < 16 ng/L). The second message is from your patient’s husband, who says your patient developed severe chest pain at home and they were uncertain what to do. Upon calling her husband, he tearfully says that she had a cardiac arrest at home and did not survive.

Comment

A number of concerns arise in this case. First, the troponin test should not have been ordered as there was a significant clinical suspicion of an acute coronary syndrome and, with symptoms within the past 24 hours, the patient is considered potentially at high risk and should have been urgently referred to hospital, where serial ECGs, troponin testing and risk stratification could be performed in the safety of a fully equipped emergency department. Second, whenever troponin testing is used, systems must be in place for the result to be conveyed urgently to the medical practitioner21 and appropriate action taken.

Conclusions

Acute coronary syndrome remains a major cause of death and long term morbidity. For patients presenting to a general practice with possible acute coronary syndrome within the preceding 24 hours, including symptoms consistent with either unstable angina or high risk clinical features, a serum troponin test should not be ordered. Instead, these patients should be referred to an emergency department for evaluation in a monitored environment capable of offering defibrillation, urgent fibrinolysis or revascularisation. However, patients presenting with ischaemic symptoms that occurred more than 24 hours previously, who are now symptom-free and have no high risk features, may be assessed with a single troponin assay and referred urgently to hospital if the result is elevated. If the troponin result is negative, unstable angina is not excluded and urgent or semi-urgent cardiac referral may still be appropriate, depending on the timing and severity of symptoms. When troponin assays are used, systems must be in place for the result to be conveyed urgently to a medical practitioner so that appropriate action may be taken.

Future directions

Further refinement of strategies that use high sensitivity troponin assays may improve upon the current 3-hour rule-out time for acute myocardial infarction. Other methods of early risk stratification, including imaging techniques, are currently being evaluated. In the future, troponin levels may also prove to be useful in many clinical contexts, including gauging cardiotoxicity with chemotherapeutic agents, identifying cardiac allograft rejection or monitoring patients with heart failure. In addition, there is potential for troponin testing to be included in newer models of general cardiovascular risk stratification, but until further evaluation in prospective trials demonstrates a clinical benefit, troponin should not be measured in asymptomatic individuals.

Box 1 –
Causes of serum troponin level elevation

  • Acute myocardial infarction (see )
  • Coronary artery spasm (eg, due to cocaine or methamphetamine use)
  • Takotsubo cardiomyopathy
  • Coronary vasculitis (eg, systemic lupus erythematosus, Kawasaki disease)
  • Acute or chronic heart failure
  • Tachyarrhythmia or bradyarrhythmia
  • Frequent defibrillator shocks
  • Cardiac contusion or surgery
  • Rhabdomyolysis with cardiac involvement
  • Myocarditis or infiltrative diseases (eg, amyloidosis, sarcoidosis, haemochromatosis)
  • Cardiac allograft rejection
  • Hypertrophic cardiomyopathy
  • Cardiotoxic agents (eg, anthracyclines, trastuzumab, carbon monoxide poisoning)
  • Aortic dissection or severe aortic valve disease
  • Severe hypotension or hypertension (eg, haemorrhagic shock, hypertensive emergency)
  • Severe pulmonary embolism, pulmonary hypertension or respiratory failure
  • Dialysis-dependent renal failure
  • Severe burns affecting > 30% of the body surface
  • Severe acute neurological conditions (eg, stroke, cerebral bleeding or trauma)
  • Sepsis
  • Prolonged exercise or extreme exertion (eg, marathon running)

Box 2 –
The new classification of myocardial infarction (MI)12

Type

Clinical situation

Definition


1

Spontaneous

MI related to ischaemia from primary coronary event such as plaque rupture, erosion, fissuring or dissection

2

Demand–supply imbalance

MI related to secondary ischaemia due to myocardial oxygen supply–demand imbalance such as spasm, anaemia, hypotension or arrhythmia

3

Sudden death

Unexpected cardiac death, perhaps suggestive of MI, but occurring before blood samples can be obtained

4a

PCI

MI associated with PCI procedure

4b

Stent thrombosis

MI associated with stent thrombosis, as seen on angiography or autopsy

5

CABG

MI associated with CABG


CABG = coronary artery bypass grafting. PCI = percutaneous coronary intervention.

Estimating non-billable time in Australian general practice

The known General practitioners spend time on patient care not claimable through Medicare (ie, not face-to-face consultations), but the extent of this non-billable time has not been quantified.

The new 12.1% of consultations were associated with non-billable time (average, 10.1 minutes per occasion) since the previous GP consultation with the patient. If claimable through Medicare this would equate to $10 000–$23 000 per annum per GP.

The implications GPs spend significant unpaid time on patient care between consultations. This is likely to increase as the population ages, with implications for planning changes to our current fee-for-service funding model.

Australian general practice is largely funded through the national health insurance scheme, Medicare, on a fee-for-service basis. General practitioners can claim payment from Medicare only for patient care that occurs during face-to-face consultations or for chronic disease management (eg, team care arrangements).

Generalisations about GP behaviour are occasionally expressed without supporting evidence. GPs are alleged to routinely provide “6-minute medicine”, in which patients are filtered through the consultation process, assessed, diagnosed and managed within this timeframe. Some GP consultations are of short duration; this is quite reasonable when otherwise well patients, for example, are renewing a prescription or receiving a seasonal influenza vaccination. However, the average duration of GP–patient consultations in Australia increased significantly between 2004–05 and 2013–14, and has been between 13.8 and 14.8 minutes for the past decade.1 Analyses of data from the national Bettering the Evaluation and Care of Health (BEACH) program have identified factors that influence the length of a consultation,2 and also that GPs were more likely to claim a level B consultation (standard consultation under 20 minutes’ duration; rebate = $37.05) when a level C (professional attendance, lasting at least 20 minutes; rebate = $71.70) was more appropriate, given the actual time involved and the complexity of the consultation.3

The payment structure of Medicare, and the benefits and disadvantages of a fee-for-service system, rather than blended payments, salaried services or capitation systems,46 were widely debated by clinicians, economists and policy makers even before Medicare was introduced (as Medibank) in 1975.7 Anecdotal evidence suggests that most GPs spend time on patient care outside consultations, although they cannot claim payment for this care from the national health insurer.

At the request of the professional organisations associated with Australian general practice (the Royal Australian College of General Practitioners [RACGP] and the Australian Medical Association), a BEACH substudy investigated the time spent on patient care between consultations, for which GPs cannot claim financial compensation from Medicare (“non-billable time”). The aims of our study were to quantify the proportion of patients for whom GPs have spent non-billable time on patient care between consultations; to estimate the average amount of time GPs spent on patient care outside consultations; to estimate the monetary value of this time were it claimable; to determine the reasons or activities that require this time; and to determine which variables were independently associated with non-billable time for patient care.

Methods

The study was a Supplementary Analysis of Nominated Data (SAND) substudy of the BEACH program. BEACH is a continuous, national, cross-sectional survey of Australian general practice activity; its methods have been described in detail elsewhere.8 In brief, about 1000 randomly sampled, currently active recognised GPs are recruited each year. Participants record the details for 100 encounters with consenting, unidentified patients on structured paper forms. Information is collected about which problems were managed for each patient during each visit.

Throughout the program, a series of SAND substudies record aspects of patient health outside the content of the encounter. Between 1 April 2012 and 31 March 2014, recording kits were posted to 2500 GPs, and they were asked to record any non-billable time since their last consultation for 40 of their 100 surveyed patients. GPs were asked to record whether they had spent non-billable time on the management of any of the patient’s problems since the last time they saw the patient. The questions and instructions are shown in the Appendix. Multiple responses were allowed. The responses were recorded in free text, and subsequently classified according to chapters of the International Classification of Primary Care Version 2 (ICPC-2).10

To estimate the monetary costs of non-billable management, we applied the definitions of level A and level B Medicare items11 to occasions of non-billable time, as these would reflect the minimum and maximum amount that would be charged were the work claimable. Assuming the 40 recorded encounters were typical for the usual caseload of the GP, a monetary value was estimated based on the following:

  • the mean activity level of Australian GPs during 2013–14, measured as the number of Medical Benefits Scheme (MBS) GP service items claimed = 5132.3 claims per GP;9

  • the proportion of patient encounters associated with prior non-billable time;

  • the standard (level A) rebate: $16.95;

  • the standard (level B) rebate: $37.05.

Proportions and robust 95% confidence intervals (CIs) were calculated in SAS 9.3 (SAS Institute) using survey procedures that adjusted for the cluster design of the study. Non-overlapping 95% CIs were deemed to indicate statistically significant differences, a criterion equivalent to P < 0.006.12 Univariate and multivariate logistic regression analyses (to calculate odds ratios, adjusted for clustering) identified characteristics independently associated with any non-billable time (v no non-billable time).

Interim results from this study were presented in 2013 at the RACGP conference GP13,13 and were the subject of an article in Australian Doctor in October 2013.14

Ethics approval

The BEACH program and all substudies have ethics approval and oversight from the Human Research Ethics Committee of the University of Sydney (reference, 2012/130).

Results

Recording pads were returned by 1935 GPs (77.4% of 2500 recruited; response rates reported in detail elsewhere).9,15 Demographic data for the GP respondents are shown in Box 1. Questionnaires were completed for 66 458 patients. The age distribution of patients in the non-billable time subsample (SAND), the Medicare claims data (all Australian GPs), and all BEACH encounters for the same time period were similar, but the non-billable subsample had marginally fewer patients under 15 years of age and more patients aged 75 years old or more than the other two samples (data not shown). Department of Veterans’ Affairs (DVA) patients were included in the BEACH and SAND samples, but not the Medicare claims sample. There were no significant sex distribution differences (data not shown).

At 8019 of the 66 458 patient encounters (12.1%), GPs had undertaken non-billable care of at least one health problem since the patient’s previous visit. Of these 8019, the number of non-billable minutes was not recorded for 479 (6.0%), and the GP was uncertain of the time spent for a further 657 (8.2%). At least one minute of non-billable time was recorded for the remaining 6883 patients (85.8%). The mean length of time spent on patient care between the current and the previous consultation was 10.1 minutes (range, 1–240 min; median, 6 min; interquartile range [IQR], 1–5 min).

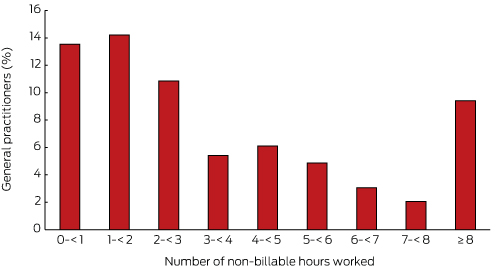
The distribution of non-billable time for patient care was skewed. Of the 1935 GPs surveyed, 30.5% did not record any non-billable time for any of their 40 patient encounters, 56.0% recorded at least one hour, 19.4% at least 5 hours, and nearly 10% recorded 8 or more hours (Box 2).

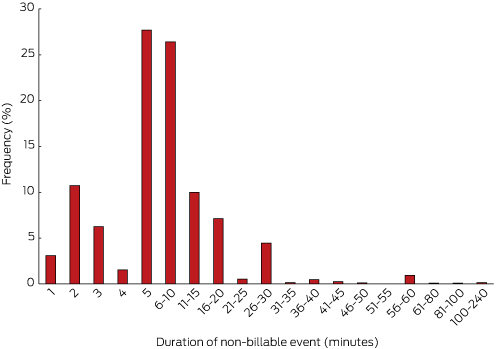
Box 3 summarises the frequency of non-billable time events for the 6883 occasions of at least one minute of non-billable time. Most of these events were of relatively short duration, with 75% lasting 10 minutes or less.

The mean non-billable time was 10.1 minutes per occasion (consistent with a level B Medicare item), and the median was 6.0 minutes (implying straightforward cases, and therefore a level A Medicare item). However, the complexity of these occasions was impossible to determine, so cost estimates were based on both level A and level B item rebates.

As Australian GPs claimed an average of 5132.3 general practice service items in 2013–14, and we found that GPs had undertaken non-billable care for 12.1% of patient encounters, we estimate that there were 5132.3 × 12.1% = 621.0 occasions of non-billable time per GP. The cost estimate for this time at the level A rebate would be: 621.0 × $16.95 = $10 525.95; at the level B rebate: 621.0 × $37.05 = $23 008.05.

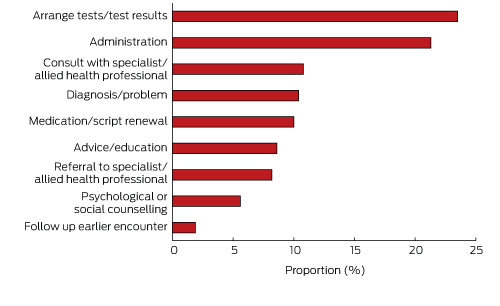
GPs recorded 8044 reasons for non-billable care between visits. Box 4 shows that nearly one-quarter related to arranging tests or delivering test results, 21.3% were for unspecified administrative tasks (eg, review report, insurance, phone call), and a similar proportion were for either consulting with or referring to specialists or allied health professionals. Medication or prescription renewals were common, as was advising or educating the patient about specific questions (eg, medication use, diet, care plan).

The specific problems dealt with were drawn from across the entire ICPC-2. The majority (86.4%) were coded to the “General and unspecified” chapter, 5.6% to the “Psychological” and “Social” chapters, and the remaining 8.0% were distributed across the other 14 chapters (data not shown). The psychological and social problems treated included depression, schizophrenia, dementia, anxiety, acute stress reaction, attempted suicide, counselling the terminally ill, their family members and the bereaved, physical abuse, family problems, anger management, and alcohol and other drug misuse (data not shown).

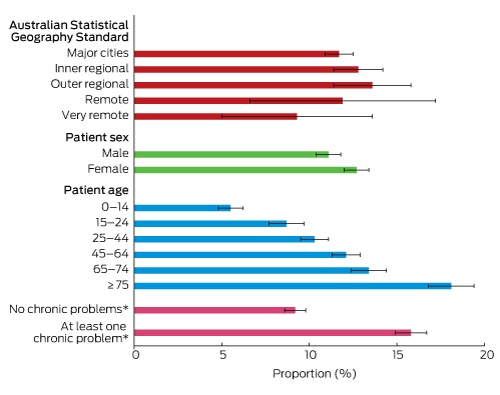
The mean number of non-billable minutes spent on patient care did not differ significantly with respect to patient age or sex, geographic location of the encounter (practice postcode), or whether at least one chronic problem was managed at the recorded encounter (data not shown). However, the descriptive analysis found that the likelihood that the GP spent any non-billable time on patient care since the last visit increased significantly with patient age, and was also significantly higher for female patients and for patients with at least one chronic problem managed at the recorded encounter (Box 5).

Variables included in the multivariate logistic regression analyses (corrected for the cluster survey design) were GP age and sex, patient age and sex, geographic location of the encounter, and whether or not any chronic conditions were managed at the recorded encounter. Non-billable time was independently associated with female GPs, younger GPs (under 55 years of age), female patients, patients aged 65 years or more, and patients having one or more chronic problems managed at the recorded encounter (Box 6).

Discussion

This study found that, on average, a GP will have more than 620 occasions each year in which they spend around 10 minutes outside consultations on various aspects of patient care; were this care claimable through Medicare, this time would return between $10 000 and $23 000. For some GPs, the amount foregone would be much higher than this average. The extra time is more likely to be provided by younger and female GPs, and for older patients, female patients, or patients with at least one chronic problem managed at a subsequent encounter. GPs are clearly spending a great deal of time on patient care for which they do not receive monetary compensation. Our study was undertaken during a period when Medicare rebate rates were frozen; further, 2014–15 was reported to be the year with the highest level of bulk-billing on record.16

Despite the high bulk-billing rate, Medicare is not the only source of income for GPs in Australia. Many doctors charge additional fees or claim incentive payments, and there are other factors that affect GP incomes.17 However, our study investigated care undertaken between consultations as lost opportunities for claimable income, regardless of whether extra charges were applied to normal consultations.

Australia has an ageing population, and Medicare and DVA data show that the frequency of GP visits increases exponentially with patient age.18 According to BEACH data, managing at least one chronic problem at GP–patient encounters has steadily increased over the past decade;1 90% of older people (65 years or over) have at least one chronic condition,19 and people from this age group increasingly present with several diagnosed chronic problems. In light of these factors, our findings suggest that occasions of non-billable time are likely to increase in number further. This is an inherent problem of the fee-for-service system, which largely restricts payments to face-to-face consultations. We have assumed that non-billable time could be reimbursed within the current fee-for-service model, but alternative payment structures might prove more equitable and efficient.

The RACGP medical homes model,20 one proposed pathway for improving health care and sustainability, involves enrolling or registering patients. There is evidence that informal patient registration already occurs; 96% of patients (and 98.6% of patients aged 65 years or more) have a practice that they visit regularly, allowing the practice to better manage their care.21 Knowing the patient and their problems is important in an ageing population with increasing multimorbidities to avoid treating individual problems in isolation, as can happen with fragmented care from multiple providers.

The Medicine in Australia: Balancing Employment and Life (MABEL) study found that GPs were generally more likely than other physicians (specialists, hospital non-specialists, specialists-in-training) to report that they did not undertake non-clinical work, such as education (teaching, research, continuing medical education) and management and administration.22 However, our results show that many GPs spend a considerable amount of time on administrative processes related to patients’ problems (21.3% of reasons for non-billable care). Many of these administrative procedures involved workers’ compensation, aged care, or disability assessments, and care and management plans for a variety of chronic conditions. These administrative procedures, as well as arranging tests, discussing test results, and communicating with specialists and allied health professionals, contributed more than half of the reasons for non-billable time. This clearly indicates that GPs are already very involved in integrating the care of their patients.

Further evidence that GPs provide holistic care was the non-billable time spent on advising and educating patients about various problems and counselling them for psychological or social problems (14.2% of all reasons). Not only was the time providing this care not claimable, it is likely to have been quite complex and, in some cases, stressful and confronting for the GP.

Our estimates and extrapolations are likely to be conservative. There is a possible element of recall error, as some time may have elapsed between visits by some of the recorded patients. Further, the raw data for Box 3 suggested an element of rounding bias with retrospective estimations (doctors tended to estimate non-billable time of greater than 45 minutes in multiples of 5 minutes), with no way to determine whether this reflected over- or underestimation.

The main limitation of the study was the design of the questionnaire form. The low number of responses about very young patients was unexpected, and we suspected that the placement of this question on the BEACH form — following the section on smoking and alcohol use by adult patients — led many GPs to assume that responses were to be recorded only for patients aged 18 years or more. However, there is no reason to believe the data collected for adult patients were unreliable.

Bias in the BEACH GP sample itself has been suggested, because “busy GPs” have no time to participate in the survey. Such bias would have particular implications for our study, as it is about GP time for clinical care. However, the activity levels of BEACH participants are compared annually with those of the Australian sample frame, and the numbers of service items claimed are similar.8

Our study has quantified the significant amount of unpaid time GPs spend on patient care between consultations, a situation likely to increase as the population ages and chronic multimorbidity becomes more prevalent. This unpaid time is an inherent problem of the fee-for-service system, which is almost exclusively restricted to paying for face-to-face consultations. Our findings should inform discussions about future funding models.

Box 1 –
Demographic data for the BEACH participant GPs and for all active recognised general practitioners in Australia (the sample frame), 2013–14

Variable

BEACH participant GPs, 2012–14*

All active Australian GPs, 2013–14

P


Total number

1935

22 598

Sex

0.07

Men

1102 (57.0%)

13 353 (59.1%)

Women

833 (43.0%)

9245 (40.9%)

Age, years

0.002

< 35

141 (7.3%)

1873 (8.3%)

35–44

336 (17.5%)

4653 (20.6%)

45–54s

592 (30.8%)

6406 (28.3%)

≥ 55

853 (44.4%)

9666 (42.8%)

Missing

13

Place of graduation

< 0.001

Australia

1321 (68.5%)

14 132 (62.5%)

Overseas

607 (31.5%)

8466 (37.5%)

Missing

7

State or territory

0.20

New South Wales

679 (35.2%)

7384 (32.7%)

Victoria

440 (22.8%)

5587 (24.7%)

Queensland

399 (20.7%)

4557 (20.2%)

South Australia

136 (7.0%)

1825 (8.1%)

Western Australia

175 (9.1%)

2108 (9.3%)

Tasmania

54 (2.8%)

601 (2.7%)

Australian Capital Territory

33 (1.7%)

355 (1.6%)

Northern Territory

13 (0.6%)

181 (0.8%)

Missing

6

Australian Standard Geographical Classification§

0.02

Major cities of Australia

1329 (68.9%)

15 970 (70.7%)

Inner regional Australia

392 (20.3%)

4301 (19.0%)

Outer regional Australia

183 (9.5%)

1869 (8.3%)

Remote Australia

19 (1.0%)

275 (1.2%)

Very remote Australia

6 (0.3%)

180 (0.8%)

Missing

6

3


BEACH = Bettering the Evaluation and Care of Health study. * Data drawn from the BEACH GP profile completed by each participating GP; missing data removed. † All GPs who claimed at least 375 Medical Benefits Scheme GP consultation services during the most recent 3-month Medicare Australia data period (data provided by the Australian Government Department of Health); missing data removed. ‡ χ2 test. § Australian Bureau of Statistics. Australian Standard Geographical Classification (ABS Cat. No. 1216.0). Canberra: ABS, 2011.

Box 2 –
Distribution of non-billable time for patient care, as reported by 1935 BEACH participant general practitioners


BEACH = Bettering the Evaluation and Care of Health study.

Box 3 –
Frequency of 6883 non-billable time events by BEACH participant general practitioners, by duration (minimum duration: one minute)

Box 4 –
Reasons nominated by 1935 BEACH participant general practitioners for providing non-billable care


BEACH = Bettering the Evaluation and Care of Health study.

Box 5 –
The proportion of patient encounters associated with non-billable care since the previous consultation: characteristic-specific likelihood


* Managed at the recorded encounter.

Box 6 –
Demographic characteristics associated with any non-billable time between consultations

Characteristic

Adjusted odds ratio*

P


Female GP (v male)

1.43 (1.25–1.62)

< 0.001

GP aged 55 years or more (v under 55 years)

0.87 (0.76–0.99)

0.03

Female patient (v male patient)

1.08 (1.02–1.15)

0.01

Patient aged 65 years or more (v under 65 years)

1.42 (1.32–1.54)

< 0.001

At least one chronic problem managed at the recorded encounter (v no chronic problem)

1.70 (1.58–1.82)

< 0.001

Patient in major cities (v non-major cities)

1.08 (0.95–1.23)

0.23


* Multivariate logistic regression model, corrected for cluster survey design.

Presentations to general practice before a cancer diagnosis in Victoria: a cross-sectional survey

The known Most patients diagnosed with cancer had initially consulted a general practitioner about their symptoms. Delayed diagnosis is associated with poorer patient experience and possibly worse clinical outcomes.

The new The number of GP visits and the time from symptom onset to seeing a hospital specialist were strongly influenced by cancer type. For example, patients with pancreatic cancer or multiple myeloma were more likely to have visited a GP several times; breast cancer patients were least likely to have done so.

The implications Strategies for reducing missed opportunities for diagnosing cancer earlier in general practice are needed.

Cancer is the leading cause of disease burden in Australia;1 by 2020 about 150 000 new cases will be diagnosed each year.2 Most patients diagnosed with cancer had initially consulted a general practitioner about their symptoms;36 GPs are therefore pivotal in the timely diagnosis of cancer. A systematic review found evidence that longer time to diagnosis is associated with poorer clinical outcomes.7 Delays before cancer diagnosis may be caused by various factors at the patient, general practice and health system levels.8

Patients place great value in having their cancer symptoms recognised early, a priority highlighted by a number of medico-legal claims against GPs about perceived delays.9,10 Multiple pre-diagnostic consultations with a GP are associated with a more negative patient experience of subsequent cancer-related care.11

The 2010 English Cancer Patient Experience Survey (CPES) examined GP visits preceding a cancer diagnosis, and found large variations between cancer types.12 International research has found that patient characteristics associated with primary care delays include younger age, female sex, belonging to an ethnic minority, and living in a rural area.5 However, there are few data about GP consultations and factors associated with the amount of time preceding a cancer diagnosis in Australia.

Our primary aim was to therefore assess the socio-demographic and clinical factors associated with multiple GP visits by patients subsequently diagnosed with cancer in Victoria. Our secondary aim was to investigate factors associated with the length of the interval between patients first recognising a symptom and their seeing a hospital doctor.

Methods

Study design and setting

We undertook a cross-sectional survey in 2013 of patients treated for cancer in five of the member hospitals of the Victorian Comprehensive Cancer Centre (VCCC) that cover the inner city and western suburbs of Melbourne (Peter MacCallum Cancer, Melbourne Health, Royal Women’s Hospital, St Vincent’s Hospital and Western Health).

Data collection

The study design was based on the English CPES.12,13 The CPES survey instrument was selected as it was cognitively validated and field-tested, and provided opportunities for international comparisons. The postal survey, provided in English, included 76 items, of which 65 assessed patient experience of diagnosis and subsequent care. Responses were closed, with most based on ordinal scales. In this article we report the results for two items about experiences prior to hospital referral (Box 1). A data management error at one of the health services meant that patients who had declined to participate or had died could not be tracked. The expert committee therefore decided to not send reminder letters from that health service, so that only 25% of all non-responders were sent a reminder.

Eligibility

Patients were eligible to participate if they were aged 18 years or more, were discharged between 1 October 2012 and 30 April 2013 from one of the five VCCC hospitals, and had a confirmed diagnosis of cancer in the primary diagnosis field of their hospital record (International Classification of Diseases, revision 10 [ICD-10] codes C00–C99, excluding C44 [non-melanoma skin cancer]; Appendix 1). Our analysis included patients who had had at least one GP consultation about symptoms related to their subsequent cancer diagnosis. Patients were excluded if they had been diagnosed by a national screening program, had presented to a hospital emergency department, or had been admitted to hospital for an unrelated medical condition.12,13

Outcomes

The primary outcome was the proportion of patients who had had three or more GP consultations before referral to a hospital specialist for suspected cancer (Box 1, question 1). The secondary outcome was the length of the interval (≥ 3 months v < 3 months) between patients suspecting a problem until the time they first saw a hospital doctor, whether a specialist in a private facility or at a VCCC hospital (Box 1, question 2).

Explanatory variables

Analysis was restricted to the cancer types defined by ICD-10 codes used for the analysis of CPES survey data in England.12 Non-Hodgkin and Hodgkin lymphoma diagnoses were pooled, as were stomach and oesophageal cancer diagnoses, because of the small numbers of the individual cancer types in our sample.

Age was categorised as 18–34, 35–44, 45–54, 55–64, 65–74, and ≥ 75 years. The age groups 18–24 and 25–34 years and 75–84 and ≥ 85 years were each aggregated because of the small number of participants in these categories. Sex was determined from hospital records.

Socio-economic status was assessed according to the Australian Bureau of Statistics’ Index of Relative Socio-economic Disadvantage (IRSD) data for the patient’s residential postcode.14

Statistical analysis

The number of GP visits prior to hospital referral about cancer and the time to hospital referral, according to the participant’s age group, sex, postcode IRSD, preferred language at home, and type of cancer, were summarised as counts and percentages. Logistic regression with robust standard errors was used to estimate odds ratios (ORs) with 95% confidence intervals for the primary and secondary outcomes with respect to each explanatory variable. Adjusted ORs (aORs) were estimated using a multivariable logistic model with robust standard errors. Sample sizes for the multivariable analyses were reduced because of missing responses for language spoken at home and postcode IRSD. Rectal cancer was used as the reference category to enable comparisons with the English CPES; it had been used as the reference in the English study because it was common in both sexes. We did not examine interactions between socio-demographic variables and cancer type because the sample size was too small. Stata 13.1 (StataCorp) was used for all analyses.

Ethics approval

Human research ethics committees at the Peter MacCallum Cancer Centre (reference, 13/11L), Melbourne Health (QA2013016), Royal Women’s Hospital (approved as Quality Assurance), St Vincent’s Hospital (QA 014/13) and Western Health (QA2013016) approved the study.

Results

A total of 5772 potentially eligible patients were identified from hospital records of the participating hospitals, of whom 4995 had a confirmed ICD-10 code for an eligible cancer diagnosis; 1885 of these patients (37.7%) returned a survey, of which five with a mismatch for age, sex or diagnosis code were excluded. Of the remaining 1880 patients, 1552 had one of the 19 cancer types included in our analysis; the patients ranged in age from 20 to 95 years.

Forty-nine of the 1552 patients (3.2%) did not respond to the question about the number of visits to a GP before referral to hospital about cancer; 1256 (83.6%) stated that they had seen a GP at least once before they were referred to a hospital doctor. Five patients with testicular cancer and three patients with mesothelioma had visited a GP at least once before referral, but were excluded from further analysis because of the small numbers for these cancer types. About one-third of the remaining patients (426 of 1248; 34.1%) had visited a GP at least three times before being referred to a hospital doctor.

Of the 1248 respondents who had seen a GP at least once before a hospital referral, 37 (3%) did not respond to the question about the length of time before seeing a hospital doctor, and were therefore excluded from this particular analysis. Of the 1211 patients who responded to this question, 260 (21.5%) stated that at least 3 months had elapsed between first noticing that something was wrong and seeing a hospital doctor.

Number of GP visits

There were large variations in the proportions of patients with particular cancer types who visited their GP at least three times before referral (Box 2; Appendix 2, Figure 1). In the adjusted analysis, the odds of at least three GP visits before referral were significantly influenced by tumour type. In the adjusted analysis, patients with breast cancer (aOR, 0.4; 95% CI, 0.2–0.8) were least likely to have had three or more GP visits before referral to hospital; patients with pancreatic cancer (aOR, 3.2; 95% CI, 1.02–9.9) or multiple myeloma (aOR, 2.4; 95% CI, 1.1–5.5) were most likely to have visited their GP at least three times before referral. In the unadjusted analyses, the odds of at least three GP visits before referral were significantly influenced by sex, age group, and language spoken at home, but the association with sex was lost after adjusting for age group, language spoken at home, socio-economic disadvantage index score of patient residence, and type of cancer (Box 2).

Time to assessment by hospital doctor

Box 3 and Appendix 2, Figure 2 summarise the odds of an interval of at least 3 months elapsing between the patient first suspecting a problem and their first seeing a hospital doctor, according to tumour type and patient characteristics. In the unadjusted analysis, tumour type and sex were the only factors that significantly influenced the odds for this outcome. After adjustment for age, language spoken at home, socio-economic disadvantage index score of patient residence, and tumour type, the association with sex was no longer significant. Consistent with our data on multiple GP visits, intervals of 3 months or more were least likely for patients with breast cancer. In contrast, more than one-third of patients with prostate or colon cancer first saw a hospital doctor after 3 months or more.

Discussion

This is the first study to report Australian CPES-based data on patient experiences prior to referral to hospital about cancer. Cancer type was a strong predictor of the number of GP visits and the time from symptom onset (as judged by the patient) to first seeing a hospital specialist. Patients with myeloma or pancreatic cancer were more likely to visit a GP several times before being referred to a hospital specialist, and the interval between symptom onset and seeing a hospital specialist was more likely to be at least 3 months for people with colon or prostate cancer. Women with breast cancer were less likely to visit a GP three times before referral or to have an interval of at least 3 months between symptom onset and seeing a hospital specialist. Our findings, particularly those related to GP visits, are consistent with data from the English CPES.12

Major findings

Our data on multiple GP visits by patients with specific cancer types suggest that certain cancers are inherently more difficult to detect in primary care, in line with earlier research and data from the English CPES.9,12,15 Pancreatic cancer and multiple myeloma present diagnostic challenges in primary care because of their non-specific symptoms and the limited availability of easy-to-use tests for early detection.16,17 With the exception of jaundice, which is a presenting symptom in only very few cases, the positive predictive value of other common symptoms of pancreatic cancer is very low.18 In contrast, symptoms of and diagnostic tests for breast cancer are more specific, so that it is less likely that multiple GP visits occur before referral.

Compared with the data from the English CPES,12 a higher proportion of Australian patients had three or more GP consultations before they were referred to a hospital specialist (34% v 23%). This may reflect differences between Australian and English GPs in thresholds for referring patients suspected to have cancer, especially given the significant and sustained focus on early cancer diagnosis in England over the past decade. Alternatively, differential access to diagnostic tests may underlie this finding. Direct access to key diagnostic tests is restricted for GPs in England, whereas Australian GPs have good access to various types of investigation, particularly radiology and pathology.4 Investigations in primary care are associated with later referrals to a specialist,19 as communicating the results and organising the referral may require additional consultations.

For about one-fifth of patients, more than 3 months elapsed between feeling that something was wrong and seeing a hospital doctor. This interval can be affected by several patient-, GP- and health system-related factors.8 Patients may take longer to present with certain symptoms; it may take several visits for a GP to recognise a potential cancer diagnosis and to refer the patient to a specialist; waiting times can be longer for some hospital specialists. In Australia, the mixture of public and private health care providers is complex, and we could not identify whether the period before seeing a specialist was longer for patients referred to public hospitals.

Although pancreatic and brain cancers were more likely than many cancer types to be associated with several GP consultations before referral to hospital, the overall process to seeing a specialist was less likely to take 3 months or more. This may be because of clearer and more rapid referral pathways for patients with these cancer types. The period before seeing a hospital specialist was more likely to be at least 3 months for individuals with prostate or colon cancer, possibly because patients or GPs erroneously attribute symptoms to more common, benign conditions;8 alternatively, limited access to gastroenterologists or urologists may be important.20,21

Our data indicate that breast cancer patients were less likely to have made three or more GP visits or for 3 months to have elapsed before seeing a hospital doctor. At the patient level, this probably represents greater community awareness of breast cancer symptoms. In general practice, breast cancer symptoms are more specific and more likely to be recognised, so that patients are referred more promptly. There are also clearer diagnostic pathways for women with suspected breast cancer.

Limitations

There are limitations to this study related to the challenges of conducting large scale surveys of patients recently diagnosed with cancer. The response rate to the invitation to participate in the CPES was only 38%. The VCCC had expected a response rate of 35%, in line with other Australian patient experience surveys, including the Australia CANnet Consumer Survey Questionnaire (29%) and the Victoria PROSPECT Cancer Critical Care Events survey (46%). Response may have also been affected by the low rate (25%) of reminder letters. The VCCC CPES was only provided to patients by mail-out (ie, no electronic version), and the survey was available only in English. Further, our sample was smaller than the sample size for the English CPES, so that the confidence intervals for our data were broader.

There was a delay of a few months between hospital discharge and the invitation to participate in the study, potentially introducing both recall and survival bias, as patients who died soon after diagnosis were not surveyed. Although we profiled the pre-hospital experiences of patients with 19 different cancer type diagnoses, sample limitations precluded the examination of other, rarer cancers.15

Non-response bias could not be assessed, and non-responders may have had different pre-hospital experiences, although this is of greater concern for overall mean estimates than for patterns of variation. Our study only assessed variations in patterns of care for people with a known cancer diagnosis. We do not have comparative data on referrals where a GP suspected cancer in someone who eventually received an alternative diagnosis. It is possible that some patients referred by the GP for suspected cancer may have initially visited a private facility, where their cancer was diagnosed before they underwent treatment in a VCCC hospital. Participants were asked in this survey about the length of time before first seeing a hospital doctor as a key part of their pre-diagnostic pathway and an important potential contributor to diagnostic delay. We could not identify which patients were diagnosed in a VCCC hospital or a private specialist setting, or whether different cancer diagnostic pathways affected the time between noting initial symptoms and seeing a hospital specialist. The VCCC hospitals are all metropolitan, but treat patients from across Victoria. Further investigations of the potentially complex paths of patients between public and private systems are required, and also of differences in the experiences of metropolitan and rural patients.

Conclusion

Our study provides an initial overview of the patterns of consultation prior to referral to hospital for cancer in Victoria. It shows that certain cancers are more likely to be associated with multiple visits to a GP before the GP refers the patient to hospital. While GPs must balance the risks of later diagnosis against overinvestigation of patients who are unlikely to have cancer, GPs may need to raise their level of suspicion for symptoms suggestive of certain cancers.6 Our data suggest that certain cancers may be more difficult to diagnose because their symptom signature is more complex.22 Earlier diagnosis of these cancers may require different approaches to those that have been successful for breast cancer. Strategies should be investigated that reduce missed opportunities for diagnosing cancer earlier in general practice, including decision support tools, fast track referral pathways, and significant event audit.

Box 1 –
Outcome questions and response options in the 2013 Victorian Comprehensive Cancer Centre (VCCC) Cancer Patient Experience Survey of patients with discharge dates, October 2012 – April 2013*


Question 1: Before you were told you needed to go to hospital about cancer, how many times did you see your GP (family doctor) about the health problem caused by cancer?

  1. None — I did not see my GP before going to hospital
  2. I saw my GP once
  3. I saw my GP twice
  4. I saw my GP 3 or 4 times
  5. I saw my GP 5 or more times
  6. Don’t know/can’t say

Question 2: How long was it from the time you first thought something might be wrong with you until you first saw a hospital doctor?

  1. Less than 3 months
  2. 3–6 months
  3. 6–12 months
  4. More than 12 months
  5. Don’t know/can’t remember

* These questions are identical to those used in the National Health Service (UK) Cancer Patient Experience Survey.13

Box 2 –
Odds ratios (with 95% confidence intervals) for patients (n = 1248) seeing a general practitioner about cancer-related health problems three or more times (v fewer than three times) before being advised to visit a hospital

Total number

≥ 3 GP visits

Crude odds ratio

95% CI

P*

Adjusted odds ratio

95% CI

P*


Sex

< 0.001

0.97

Men

654

261 (39.9%)

1

1

Women

594

165 (27.8%)

0.58

0.46–0.73

0.99

0.71–1.39

Age (years)

0.01

0.23

18–34

41

12 (29.3%)

0.85

0.42–1.71

0.98

0.46–2.09

35–44

91

32 (35.2%)

1.11

0.69–1.79

1.56

0.90–2.69

45–54

185

50 (27.0%)

0.76

0.52–1.11

1.25

0.81–1.92

55–64

321

117 (36.4%)

1.17

0.86–1.60

1.35

0.96–1.88

65–74

399

131 (32.8%)

1

1

≥ 75

211

84 (39.8%)

1.35

0.96–1.91

1.51

1.03–2.22

Language spoken at home (missing responses: 51)

0.01

0.08

English

1042

335 (32.1%)

1

1

Other

155

66 (42.6%)

1.57

1.11–2.21

1.42

0.96–2.10

Index of Relative Socio-economic Disadvantage, by quartiles (missing responses: 7)

0.15

0.45

4 (least disadvantaged)

389

117 (30.1%)

1

1

3

374

133 (35.6%)

1.28

0.95–1.74

1.20

0.86–1.66

2

294

102 (34.7%)

1.24

0.89–1.71

1.23

0.87–1.73

1 (most disadvantaged)

184

72 (39.1%)

1.49

1.04–2.16

1.36

0.90–2.06

Type of cancer

0.06

< 0.001

Pancreatic

18

11 (61%)

3.98

1.30–12.2

3.17

1.02–9.90

Thyroid

31

15 (48%)

2.38

0.94–5.98

2.48

0.94–6.57

Vulval

12

6 (50%)

2.53

0.70–9.11

2.47

0.70–8.71

Multiple myeloma

59

29 (49%)

2.45

1.12–5.38

2.41

1.06–5.47

Brain

14

8 (57%)

3.38

1.00–11.4

2.32

0.62–8.64

Prostate

159

73 (46%)

2.15

1.10–4.22

2.15

1.05–4.39

Lymphoma

128

54 (42%)

1.85

0.92–3.70

1.76

0.85–3.65

Leukaemia

82

32 (39%)

1.62

0.77–3.41

1.59

0.73–3.47

Lung

107

42 (39%)

1.64

0.80–3.34

1.56

0.74–3.30

Colon

47

20 (43%)

1.88

0.82–4.31

1.45

0.61–3.46

Oesophageal/stomach

23

10 (43%)

1.95

0.70–5.40

1.34

0.46–3.97

Renal/bladder

64

25 (39%)

1.62

0.74–3.55

1.31

0.58–2.96

Ovarian

23

8 (35%)

1.35

0.47–3.85

1.28

0.42–3.88

Rectal (reference)

53

15 (28%)

1

1

Laryngeal

16

4 (25%)

0.84

0.23–3.04

0.90

0.24–3.41

Melanoma

129

29 (23%)

0.73

0.36–1.52

0.69

0.32–1.47

Endometrial

53

10 (19%)

0.59

0.24–1.47

0.54

0.21–1.40

Cervical

15

3 (20%)

0.63

0.16–2.57

0.45

0.10–2.06

Breast

215

32 (15%)

0.44

0.22–0.90

0.39

0.18–0.84


* Calculated using the Wald test for categorical variables. † Adjusted odds ratio estimated by multivariable logistic regression, adjusted for all other variable categories; 58 patient records were excluded because of missing responses for language spoken at home and socio-economic disadvantage index.

Box 3 –
Odds ratios (with 95% confidence intervals) for an interval of at least 3 months (v less than 3 months) elapsing between patients suspecting a problem and their seeing a hospital doctor

Total number

≥ 3 months

Crude odds ratio

95% CI

P*

Adjusted odds ratio

95% CI

P*


Sex

< 0.001

0.19

Men

635

165 (26.0%)

1

1

Women

576

95 (16.5%)

0.56

0.42–0.75

0.77

0.51–1.14

Age, years

0.83

0.76

18–34

41

10 (24%)

1.12

0.53–2.38

1.37

0.60–3.13

35–44

88

15 (17%)

0.71

0.39–1.31

1.22

0.62–2.40

45–54

182

35 (19%)

0.83

0.53–1.28

1.44

0.88–2.34

55–64

307

67 (22%)

0.97

0.68–1.39

1.03

0.70–1.52

65–74

389

87 (22%)

1

1

≥ 75

204

46 (23%)

1.01

0.67–1.52

1.08

0.71–1.66

Language spoken at home (missing responses: 48)

0.50

0.73

English

1013

212 (20.9%)

1

1

Other

150

35 (23.3%)

1.15

0.76–1.73

1.08

0.70–1.68

Index of Relative Socio-economic Disadvantage, by quartiles (missing responses: 7)

0.91

0.98

4 (least disadvantaged)

379

82 (22%)

1

1

3

361

75 (21%)

0.95

0.67–1.35

0.97

0.67–1.42

2

287

59 (21%)

0.94

0.64–1.37

1.00

0.67–1.48

1 (most disadvantaged)

177

41 (23%)

1.09

0.71–1.67

1.08

0.68–1.73

Type of cancer

< 0.001

0.001

Colon

46

16 (35%)

1.45

0.61–3.43

1.55

0.64–3.78

Prostate

152

53 (35%)

1.45

0.72–2.92

1.52

0.73–3.16

Vulval

11

3 (27%)

1.02

0.24–4.39

1.30

0.29–5.77

Endometrial

52

13 (25%)

0.90

0.38–2.18

1.15

0.45–2.93

Lymphoma

126

36 (29%)

1.09

0.53–2.24

1.11

0.52–2.39

Laryngeal

16

4 (25%)

0.90

0.25–3.28

1.01

0.27–3.78

Renal/Bladder

63

17 (27%)

1.00

0.44–2.30

1.01

0.42–2.38

Rectal

52

14 (27%)

1

1

Cervical

15

3 (20%)

0.68

0.17–2.77

0.93

0.20–4.22

Multiple myeloma

57

13 (23%)

0.80

0.34–1.92

0.89

0.36–2.17

Ovarian

22

4 (18%)

0.60

0.17–2.10

0.74

0.20–2.72

Melanoma

127

23 (18%)

0.60

0.28–1.29

0.61

0.28–1.35

Pancreatic

18

3 (17%)

0.54

0.14–2.17

0.59

0.15–2.34

Brain

13

2 (15%)

0.49

0.10–2.51

0.53

0.11–2.67

Leukaemia

76

12 (16%)

0.51

0.21–1.21

0.49

0.20–1.21

Oesophageal/stomach

22

5 (23%)

0.80

0.25–2.57

0.48

0.12–1.91

Lung

106

16 (15%)

0.48

0.21–1.09

0.45

0.19–1.07

Thyroid

28

3 (11%)

0.33

0.08–1.25

0.35

0.09–1.36

Breast

209

20 (10%)

0.29

0.13–0.62

0.33

0.14–0.76


* Calculated using the Wald test for categorical variables. † Adjusted odds ratio estimated by multivariable logistic regression, adjusted for all the variables shown in the box; 55 patient records were excluded because of missing responses for language spoken at home and socio-economic disadvantage index.