×

HIV testing rates and co-infection among patients with tuberculosis in south-eastern Sydney, 2008–2013

The association between HIV infection and tuberculosis (TB) is well recognised, and the rationale for offering a routine HIV test to all people with TB has been presented previously.1 Recent clinical trials found that commencing antiretroviral therapy for HIV infection before the completion of TB therapy is associated with improved survival, and treatment should be commenced simultaneously for HIV and TB in people with co-infection and a CD4 T-cell count less than 50 cells/mm3.2,3 These recent clinical end point data reinforce the patient benefit of being tested for HIV infection when diagnosed with TB.

In Australia, HIV testing was undertaken in 76%–81% of patients with TB between 2008 and 2010.4,5 In 2010, 3.4% of patients with TB with a known HIV test outcome were reported as testing positive for HIV.5

South Eastern Sydney Local Health District (SESLHD) is a NSW Health district with a population of more than 800 000 people, and is an area of relatively high HIV prevalence and incidence in Australia.6 The district has four publicly funded chest clinics for the management of TB. At 53%, the rate of HIV testing among patients with TB managed in SESLHD in 2008 was statistically significantly lower than the national rate in 2008.

We evaluated changes in the HIV testing practices across the health district after a simple intervention and examined the rate of HIV co-infection in this population.

Methods

Clinicians managing publicly funded chest clinics had regular clinical meetings between 2008 and 2012. These meetings involved discussion of diagnosis and management of TB, and included senior respiratory physicians, senior nursing staff, a microbiologist and an infectious diseases physician. Publications about HIV and TB co-infection were made available to the clinicians managing TB in the health district from 2008, and HIV testing data were fed back and discussed at clinician meetings.13,7,8 Cases of TB in SESLHD residents and others treated at SESLHD clinics were notified to the SESLHD Public Health Unit; these included microbiologically confirmed cases and cases that were treated for TB without microbiological confirmation. Data about patients’ HIV testing status were collected routinely by chest clinic staff.

TB notification data for 2008–2013 were extracted from the NSW Notifiable Conditions Information Management System, accessed through the Secure Analytics for Population Health Research and Intelligence.

Variables extracted for analysis were date of notification for TB, name of treating chest clinic, local health district of residence, HIV test offered and HIV test result, including CD4 T-cell count for new diagnoses. For the analysis, HIV status was categorised as known (tested for HIV antibody and found to be positive, including known before the diagnosis of TB, or negative), or unknown (not tested or declined an offer of testing).

The χ2 test was used to test for differences in the proportions of HIV testing and co-infection between clinics and over the study period. Statistical analyses were conducted using SPSS, version 22 (IBM Corporation) and SAS Enterprise Guide 6.1 (SAS Institute).

Ethics approval was not sought, as the data were aggregated and de-identified in a form suitable for feedback to clinical services as part of quality activities.

Results

During the 6-year study period, 539 cases of TB were notified, and 506 of these were managed in SESLHD chest clinics (Box). Thirty-three SESLHD residents were managed at other chest clinics and were excluded from this analysis. Of the 506 patients treated at SESLHD chest clinics, 107 were not residents of SESLHD.

The proportion of patients tested for HIV co-infection varied between clinics from 62% to 85% (χ2 = 25.5; df = 3; P < 0.001), and the proportion of people with known HIV status increased over time from 53% in 2008 to 87% in 2013 (χ2 = 27.1; df = 5; P < 0.001).

Of patients for whom HIV status was known, the proportion of cases with HIV co-infection varied between clinics, ranging from 1.5% to 9.7% (χ2 = 10.0; df = 3; P = 0.02). Only seven people offered an HIV test declined this intervention in the 6-year period. The overall rate of HIV co-infection among people managed for TB in SESLHD was 5.4% of those in whom the HIV status was established. Based on these data, the lowest possible rate of co-infection is 4.0% if it is assumed that the 27.1% not tested were not infected.

Eleven of the 20 patients who were HIV positive were diagnosed with HIV infection at or after the time of their TB diagnosis. The median CD4 T-cell count at the time of HIV diagnosis for these people was 30 cells/mm3 (range, 10–250 cells/mm3).

Discussion

Between 2008 and 2013, there was an increase in the proportion of patients treated for TB for whom HIV status was known. Of these patients, 20 were HIV positive (5.4%), and 11 of these were diagnosed with HIV at the time of, or after, their TB diagnosis.

Although Australia has a low prevalence of both HIV and TB, the two conditions coexist worldwide, and the early diagnosis and treatment of both conditions is of benefit to the individual and the population as a whole. Recent data have confirmed the reduction of HIV transmission risk to sexual partners of people with HIV when antiretroviral therapy is used.9

The proportion of people diagnosed with advanced HIV infection (CD4 T-cell count less than 200 cells/mm3) has not declined over time in Australia, and HIV testing at the time of TB diagnosis may enable earlier HIV diagnosis in a population who may not be perceived to be at risk for HIV infection otherwise.10 It is notable, however, that most of the newly diagnosed cases of HIV infection in SESLHD had severe immunodeficiency at the time of diagnosis. Treatment at this level of immunodeficiency is still associated with a survival benefit, and the potential to trace contacts of sexual partners and reduce further HIV transmission.

The increase in known HIV status over the study period may be associated with the clinician-led intervention described here or to other secular trends. Clinicians may have independently determined that HIV testing was of benefit to their patients, or they may have been responding to the 2009 NSW Health policy directive recommending assessment of HIV antibody status at the time of TB diagnosis.11 Due to the retrospective nature of our study, causes for this increase could not be ascertained.

The proportion of TB cases with HIV co-infection in SESLHD is numerically, but not statistically significantly, higher than that reported in national data. The identified co-infection rates among people treated for TB in SESLHD reinforces the recommendation that the routine offer of HIV testing to all patients with TB is cost-effective, and may increase early detection and reduce the consequences of untreated HIV infection in this population.1 It is possible, however, that referral bias may have influenced the co-infection rate in this population.

There is an ongoing need to aim for universal testing for HIV infection early after the diagnosis of TB in SESLHD and nationally.

Cases of tuberculosis managed in South Eastern Sydney Local Health District, 2008–2013, by patient HIV status and clinic or year of notification


TB cases managed

HIV status known

HIV positive (of known HIV status)

HIV not tested

HIV test offered but declined


Clinic


A

143

113 (79.0%)

11 (9.7%)

27 (18.9%)

3


B

213

131 (61.5%)

2 (1.5%)

79 (37.1%)

3


C

89

76 (85.4%)

6 (7.9%)

12 (13.5%)

1


D

61

49 (80.3%)

1 (2.0%)

12 (19.7%)

0


Year


2008

85

45 (52.9%)

4 (8.9%)

39 (45.9%)

1


2009

80

56 (70.0%)

3 (5.4%)

20 (25.0%)

4


2010

100

79 (79.0%)

5 (6.3%)

21 (21.0%)

0


2011

98

72 (73.5%)

4 (5.6%)

24 (24.5%)

2


2012

73

56 (76.7%)

1 (1.8%)

17(23.3%)

0


2013

70

61 (87.1%)

3 (4.9%)

9 (12.9%)

0


Total

506

369 (72.9%)

20 (5.4%)

130 (25.7%)

7 (1.4%)


A bowel cancer screening plan at last

To the Editor: The National Bowel Cancer Screening Program (NBCSP) sees general practitioners as “critical partners”,1 but has not really involved or supported GPs, who have personal frequent contact with a large proportion of the NBCSP’s target population. GP endorsement increases uptake,2,3 but the NBCSP does not fund GPs to send reminder letters to their patients.

The NBCSP informs GPs about who has used a faecal occult blood test (FOBT) kit and returned samples, but it sends these reports on paper, which creates extra work of scanning results into patients’ electronic clinical records and, more importantly, prevents GPs’ clinical software from automatically generating appropriate reminders. Automated reminders can be displayed onscreen to GPs during consultations, and now can also be given to patients when they arrive for consultations, as printed prevention summaries based on current data in the patient’s electronic clinical record.4,5

Uptake of bowel cancer screening is likely to be greater if general practice is a true partner in the process, as occurs in the cervical screening program. Following this model, the NBCSP would perform a back-up function to notify the person’s usual GP or usual general practice if an FOBT result has not been received within 3 to 6 months of it becoming due. We concur with the statement: “it will become increasingly important to consult closely with the primary care sector and provide support to GPs to facilitate their role in the expanded NBCSP”. General practice must be made more central in the NBCSP for it to succeed.

Deaths from childhood asthma, 2004–2013: what lessons can we learn?

New South Wales data highlight areas for improvement in asthma management

The NSW Child Death Review Team annual report 2013 included an analysis of deaths from asthma during the 10-year period 2004–2013.1 A total of 20 children, aged up to 17 years, died from asthma in New South Wales. While this death rate was low, and therefore the findings need to be interpreted cautiously, lessons from the analysis can be extrapolated to help reduce morbidity and mortality associated with asthma in children. The main findings were:

  • deaths from asthma among children were rare, and more common in older children
  • there has been a recent increase in deaths, the cause of which is not clear
  • risk factors include low socioeconomic status, psychosocial problems, and Asian and Pacific Islander backgrounds
  • all the children who died had been diagnosed with asthma; most had persistent asthma and were atopic; seven had a history of food allergy (five confirmed on skin prick testing); and three had a history of anaphylaxis and had been prescribed or had used an adrenaline autoinjector
  • younger children were more likely to be hospitalised and less likely to die, and older children were less likely to be hospitalised and more likely to die
  • three-quarters of those who died had been hospitalised in the previous 5 years and 11 had been hospitalised in the year before their death, of whom eight did not receive follow-up care
  • all those who died had seen a general practitioner about their asthma, but regular review was uncommon (most just saw a GP when they were unwell) and only eight of those who died had seen a specialist
  • two-thirds of those who died had been given a written asthma action plan and about half had one developed in the year before death
  • written asthma action plans were on the school files of half (seven) of the children who were attending school and five of these were developed in the year before death
  • most of those who died had been prescribed reliever and preventer medication (19); most were using inhaled corticosteroids (ICSs) (17); and 15 of those who were using ICSs were also using a long-acting β-agonist (LABA) and/or an oral corticosteroid (13 and five, respectively)
  • the records of nine children who died indicated that asthma medications were not being used as recommended (intermittent preventer use in eight cases, irregular reliever use in one case)
  • for most of those who died (17), factors that may have increased risk of death were identified; these included: suboptimal asthma control, presentation or admission to hospital in the year before death, poor follow-up care, poor adherence to medication or written asthma action plan, lack of written asthma action plan, and exposure to tobacco smoke.

Possible adverse effects of therapy

One concerning matter that was identified was the large number of children who had been prescribed ICS–LABA combination therapy. While this may have reflected asthma severity, just under half of the children were using their preventer therapy intermittently, which is suboptimal. Concerns about inappropriate prescribing of ICS–LABA combination therapy as first-line preventer therapy (also often used intermittently) prompted the recent Pharmaceutical Benefits Advisory Committee Post-market Review of Pharmaceutical Benefits Scheme Medicines Used to Treat Asthma in Children (http://www.pbs.gov.au/info/reviews/asthma-children-reviews). This review confirmed the ongoing inappropriate use of ICS–LABA combination therapy as well as the lack of evidence of efficacy and potential adverse effects (increased exacerbation risk,2,3 loss of bronchoprotection against exercise-induced asthma and loss of efficacy of short-acting β-agonists [SABAs]4) of LABAs in children.

A recent study has also highlighted the possibility that a particular polymorphism in the β receptor gene (homozygous for arginine at codon 16) may predispose patients to these adverse effects.5 Thus, LABA use in the children who died from asthma may have, theoretically, put these children at risk of severe exacerbation and reduced the efficacy of SABAs during acute episodes of wheezing. It might, therefore, explain the increase in asthma deaths seen in recent years. It might also be responsible for increases in exacerbations and episodes of exercise-induced asthma in children who are taking LABAs, particularly those who may be genetically predisposed to adverse effects.

Recommendations

The recently revised National Asthma Council Australia Australian asthma handbook highlights the importance of a stepwise approach to asthma management in children and emphasises that ICS–LABA combination therapy should not be used as first-line preventer therapy in children. Instead, LABA add-on therapy should be reserved as one of the three possible options for step-up treatment in children with persistent asthma who continue to have poor asthma control despite low-dose ICS treatment. The other two possible options for step-up treatment are montelukast add-on therapy and increased ICS dose. Each of these step-up options may be a potential optimal approach in different patients.6

The handbook also recommends that because of lack of evidence of efficacy and safety in preschool children, LABAs should not be used in children 5 years or younger.6 This recommendation is also included in the recently revised Global Initiative for Asthma guidelines.7

Another recommendation in the Australian asthma handbook is to consider specialist review for children requiring step-up treatment, particularly those with ongoing poor asthma control.6 Although the children who died from asthma met this criterion, fewer than half had seen a specialist for review of their asthma. In addition, regular asthma reviews and follow-up care after hospital admission for asthma were uncommon. This probably reflects general non-adherence to asthma management guidelines for children, which could result in unnecessary morbidity.

It is pertinent to also highlight that the risk factors identified in the children who died from asthma (namely suboptimal asthma control, presentation or admission to hospital in the year before death, poor adherence to medication or written asthma action plan and lack of written asthma action plan) predict future asthma risk and therefore ongoing asthma morbidity. The three most common reasons for poor asthma control are misdiagnosis, poor adherence to medication and poor inhaler technique.6 While inhaler technique could not be checked in the review of asthma deaths, poor adherence to medication or written asthma action plan and lack of written asthma action plan were identified as risk factors in the children who died from asthma.

The Australian asthma handbook also recommends education about asthma medication, inhaler technique, preventing symptoms, managing acute episodes, self-monitoring and asthma control, as well as regular reviews and a written asthma action plan to help the patient and/or caregiver recognise and manage acute asthma episodes.6 There is also evidence to support the benefit of providing a written asthma action plan in paediatric emergency settings.8

Innovative strategies

Innovative educational strategies aimed at primary health care have been shown to improve asthma outcomes in children. A randomised controlled trial of the Practitioner Asthma Communication and Education (PACE) Australia program showed increased use of written asthma action plans by GPs, more appropriate evidence-based management of childhood asthma, and a higher rate of spacer prescription.9 The National Asthma Council Australia now has funding for wider dissemination of the PACE Australia program through GP networks.

Giving Asthma Support to Patients (GASP) is an online tool that was developed in New Zealand to provide asthma education at point of care and to provide primary health care professionals with the skills and knowledge they need to undertake a structured asthma assessment.10 For a retrospective cohort of patients aged 5–64 years, use of GASP resulted in decreased risk of exacerbation, hospital admission and emergency department presentation, decreased requirement for oral corticosteroids and less reliance on bronchodilators.10 Asthma Foundation NSW is in the process of producing an Australian version of GASP, consistent with Australian recommendations, which will be piloted in general practices.

Conclusion

Findings from the review of asthma deaths in NSW can help optimise management of childhood asthma and therefore improve outcomes. Guidelines for asthma management are not being adhered to and inappropriate prescribing of ICS–LABA combination therapy may be putting children at unnecessary risk of adverse effects. Innovative educational strategies such as PACE Australia and GASP are important for promoting asthma management guidelines and reducing asthma morbidity and mortality in children.

Pharmaceutical sales strategies and sponsorship

To the Editor: It is with dismay that we read in MJA InSight Morton’s dismissal of the international “No Advertising Please” campaign, citing Australian Medical Association (AMA) policy.1

Drug company sales representatives and their sales techniques influence doctors. Morton dismisses the 2010 systematic review2 through selective quoting of the editorial position. In fact, the editors supported the conclusion of the systematic review that there is no evidence of improvement and some evidence of adverse consequences from marketing. There is an abundance of evidence in the behavioural science literature on the impact of marketing,35 and there is evidence that marketers may not make doctors aware of the risks of their products.6

The influence of doctors who are paid by pharmaceutical companies to present research at conferences and workshops is also cause for concern. If we, as a medical community, decline to see sales representatives, will we see an increase in the funding for doctors to present to other doctors on behalf of the pharmaceutical industry?

Many, including AMA leaders, suggest we should continue in the current fashion. We dispute this.

We have the following practical suggestions:

  • front-line clinical doctors, including busy general practitioners, should use the up-to-date, evidence-based information provided by the National Prescribing Service;
  • doctors should obtain further information from authoritative evidence-based clinical guidelines available online, such as “Therapeutic Guidelines”;
  • for future research funding, we advocate structures that more clearly separate the financially vested company from the researchers;
  • conflict of interest statements should be provided beside the authors’ names in conference abstract lists; and
  • workshops should provide written disclosure to participants of the presenting doctors’ current and previous funding sources.

We support the “No Advertising Please” campaign. We also support further consideration of the insidious influence of pharmaceutical companies at conferences and workshops through their sponsorship of doctors.

Reassessment of the new diagnostic thresholds for gestational diabetes mellitus: an opportunity for improvement

To the Editor: A recent article by d’Emden focused on concerns about the new diagnostic criteria for gestational diabetes mellitus (GDM).1 In his article, he states that “women may be charged higher life insurance premiums because of a prior diagnosis of GDM”.1 A similar unreferenced concern was also expressed in 2013.2

We specifically examined this aspect in an Australian context.3 Twelve life insurance companies, responsible for more than an estimated 90% of the Australian retail life insurance market, were surveyed with a request from a hypothetical applicant. This applicant was a 40-year-old woman, with no current health problems, who had an episode of GDM 10 years earlier and a subsequent normal result on an oral glucose tolerance test. Ten of the twelve companies (83%) responded, and were unanimous that no additional insurance premium would be required.

The new Australasian Diabetes in Pregnancy Society criteria are likely to result in an increased prevalence of GDM.4 Logically, this may lead to an increase in the cost of initial treatment, but this cost may effectively be recovered by better obstetric outcomes.5 Local data are required.

It is inevitable that any change will be accompanied by differences of opinion. Whenever possible, these opinions should not be alarmist.

Improving access and equity in reducing cardiovascular risk: the Queensland Health model

Almost one-third of all deaths in the Australian population in 2011 were attributable to cardiovascular disease (CVD),1 and around 80% of these were preventable.2 People who attend cardiac rehabilitation programs have reduced mortality rates and improved health knowledge, health behaviours and quality of life compared with patients who do not attend rehabilitation.3,4 Attendance rates are around 30% or less and have not improved in the past 20 years57 despite major attempts by advisory bodies to increase uptake.8,9 As a result, alternative methods of delivering cardiac rehabilitation and secondary prevention have been sought.10 These include home-based cardiac rehabilitation, case management and, more recently, telephone coaching programs that are flexible, multifaceted and integrated with the patient’s primary health care provider.1113 Achieving optimal and sustainable delivery of these interventions to rural and remote communities presents a huge challenge.

Australia’s rural population is one-third of the total population and has higher mortality rates, lower life expectancy and higher rehospitalisation rates than its metropolitan counterpart.14 Attendance at cardiac rehabilitation is lower in rural and remote communities.15 Aboriginal and Torres Strait Islander Australians face an even greater burden of disease because of their increased predisposition for acquiring diabetes (up to 10-fold higher prevalence)16,17 and associated cardiovascular risk factors throughout life and at an earlier age than the non-Indigenous population.16,18 Targeted outreach programs aimed at increasing equity of access to health services are likely to have the greatest potential to improve population health.

Queensland is Australia’s most decentralised state, with more than half of its population living outside of the capital city.19 Accordingly, Queensland Health is exploring evidence-based, simple and accessible, integrated and sustainable, cost-effective health care innovations.20

In 2009, Queensland Health introduced The COACH (Coaching Patients On Achieving Cardiovascular Health) Program (TCP) to assist people diagnosed with chronic diseases and to reduce the risk of future complications. The program has been shown to be superior to usual medical care in reducing risk factor levels in two randomised controlled trials.21,22

This program is the first standardised coaching program targeting cardiovascular risk factors and delivered by telephone and mail-out to be made available statewide. Every eligible patient in Queensland can have access to the program irrespective of where they live, in accordance with the Queensland Government’s strategy for chronic disease.23

We report here on changes in the cardiovascular risk factor status of patients enrolled in TCP, including a comparison of changes in risk factors among Indigenous and non-Indigenous enrollees in Queensland.

Methods

Design and participants

We analysed cardiovascular risk factor data collected prospectively as part of TCP. The audit data included: blood test results for fasting lipids, fasting glucose in people without diabetes, and glycated haemoglobin (HbA1c) in people with diabetes; two physical measurements — blood pressure and body weight; and self-reported information about three lifestyle factors — smoking, physical activity and alcohol intake. Information about medications (dose, frequency and adherence) was obtained by the coaches.

Data were collected from two separate cohorts of patients who had a primary diagnosis on admission of either coronary heart disease (CHD) or type 2 diabetes and who were enrolled in the coaching program between 20 February 2009 and 20 June 2013. All enrolled patients provided consent for de-identified data to be used for evaluation and reporting purposes. The audit was approved by the Clinical Governance Committee of the Health Contact Centre, Queensland Health.

The COACH Program

TCP is a standardised coaching program delivered by telephone and mail-out for people with or at high risk of chronic disease. Trained health professionals (“coaches”) coach people to achieve national guideline-recommended target levels for their particular risk factors and to take the medications as recommended by guidelines for the management of their particular medical condition or conditions. A more detailed description of TCP is given in Appendix 1.

Entry to TCP

Queensland Health’s Health Contact Centre is responsible for the operation of 13 HEALTH, a 24-hour, seven-day-a-week statewide service providing access for all Queenslanders to health information, triage and referral. Using 13 HEALTH telephone infrastructure, the contact centre also implements 13 QUIT to support smoking cessation, the Child Health Line, and TCP to deliver chronic disease management.24 Referral to the centre for participation in TCP is accepted from all sources: public hospitals, general practitioners, medical specialists, other health professionals, cardiac rehabilitation services, Quitline and self-referral. Referral can be online or by fax, email, phone or mail. Once patients are referred to the Health Contact Centre, administration assistants initiate contact with patients and book them in for their first coaching session. The patients do not meet the administration assistants or coaches face-to-face at any stage. Patients are coached in a manner identical to that in the clinical trials.21,22 TCP is directed to patients who could not or would not attend cardiac rehabilitation.

Training of the coaches

The Health Contact Centre employs registered nurses as coaches to deliver TCP. Coaches are trained face-to-face for 2 weeks in the principles and practice of TCP and then undergo a formal 12-week preceptorship program. A detailed description of the training of the coaches is in Appendix 1.

TCP software application

TCP is fully computerised and uses a customised web-based software application for program delivery and evaluation. The software records all relevant patient and risk factor details, generates structured patient letters and contains all key performance indicators including patient uptake, completion rates, achievement of risk factor targets and adherence to recommended medications at entry to and exit from the program.

Statistical analysis

Descriptive statistics comprised means and standard deviations for continuous variables, and numbers and percentages for categorical variables. The paired samples t test was used to assess the significance of differences in cardiovascular risk factors at entry and completion within each patient group (CHD and type 2 diabetes). The independent samples t test was used to compare mean change in risk factors from entry to completion of TCP between Indigenous and non-Indigenous patients. Bonferroni correction was used to adjust the P value for multiple comparisons. The Pearson χ2 test was used to compare smoking status from entry to completion across patient cohorts. Data were analysed using SPSS version 20 (SPSS Inc).

Results

During the audit period, 3235 patients enrolled in TCP and 2669 patients (83%) completed the program, including 145 Indigenous patients. Five hundred and sixty-six patients (17%) did not complete the program (26 died during the audit period). Patients had a primary diagnosis of either CHD (1962 patients) or type 2 diabetes (707). Fifty-three per cent (1409) had a diagnosis of CVD before the referral event; 59% of patients with CHD (1158) had a prior history of CVD; and 36% of patients with type 2 diabetes (251) had CVD as a comorbidity. CVD includes CHD, heart failure, stroke and peripheral vascular disease. Eighty-four per cent of referrals to TCP were made by clinical staff at the time the patient was discharged from a public hospital. Most other referrals were from community health centres or Quitline.

Access and equity

The Accessibility Remoteness Index of Australia25 was used to categorise remoteness (Box 1). The location of this cohort was typical of the location of the general population of Queensland.

Demographics

Baseline demographics and treatments for patients with CHD or diabetes as their primary diagnosis are listed in Appendix 2. Age within each diagnosis group ranged from 20 to 95 years and from 20 to 90 years, respectively. Both cohorts had the same age : sex ratio as that for the total population of patients with either CHD or diabetes,27 and both had the same proportion of Indigenous Queenslanders as the general population (approximately 6%). Patients with a primary admission diagnosis of CHD received their first coaching session within 2 months of their index event. Patients received a mean (SD) number of sessions of 5.5 (1.2) over a mean period of 182 days (6 months).

Risk factor changes

Data for individual risk factors were compared at entry to and completion of TCP in patients for whom complete data were available (for smoking, alcohol intake, physical activity: 96%–99% of patients; for body weight: 83%; for lipid levels, blood pressure, HbA1c levels in patients with diabetes: 48%–74%). For risk factors where less than 70% of patients had data at entry and completion, the patients with paired data were compared with the patients without paired data for age, sex and comorbidities and no significant differences were found between the groups. This supports the assumption that missing data occurred at random with no patient selection bias in the pairing of measurements.

Patients with CHD

Box 2 lists the mean differences between entry and completion for cardiovascular risk factors in patients with CHD. All changes in risk factors remained statistically significant after multiple comparison correction. The direction of mean change in risk factor results showed improvement across all risk factors. The most clinically significant changes were a decrease in mean low-density lipoprotein (LDL) cholesterol level from 2.4 mmol/L to 1.8 mmol/L, a decrease in mean HbA1c level from 7.8% to 7.4%, a decrease in mean alcohol intake from 1.4 to 1.1 standard drinks per day, and an increase in mean physical activity from 142 minutes to 229 minutes per week (P < 0.001 for all comparisons).

Patients with type 2 diabetes

Similarly, Box 3 lists the results for changes in risk factors in patients with type 2 diabetes, also showing statistically significant improvements in all risk factors after adjustment for multiple comparisons. Again, the most clinically significant changes were a decrease in mean LDL cholesterol (from 2.5 mmol/L to 2.0 mmol/L), a decrease in mean HbA1c (from 8.2% to 7.5%), a decrease in mean alcohol intake (from 1.3 to 0.9 standard drinks per day), and an increase in physical activity (from 127 to 182 minutes per week) (P < 0.001 for all comparisons).

Smokers

There were significant decreases in the numbers of current smokers from entry to completion of TCP among patients with CHD (from 296 to 222 [χ2(1,n = 296) = 755; P < 0.001]) and among patients with diabetes (from 139 to 105 [χ2(1,n = 139) = 467; P < 0.001].

Indigenous patients

At entry to TCP, Indigenous patients were younger, consumed more alcohol and were more likely to smoke than non-Indigenous patients; and Indigenous patients with CHD had a lower frequency of percutaneous coronary intervention than non-Indigenous patients (Appendix 3).

There were no significant differences between these two populations for changes in any of the risk factors from entry to completion of TCP.

Medication changes

Patients’ use of statins, β-blockers, antiplatelet agents and angiotensin-converting enzyme inhibitors or angiotensin receptor antagonists is detailed in Appendix 4. For each agent, there was a highly significant improvement in use between entry and completion of TCP for Indigenous and non-Indigenous patients. The most notable improvement was the increase in statin use among patients with diabetes, from 66% to 78% overall and from 83% to 92% among Indigenous people (P < 0.001 for both comparisons).

Comparison of results for Indigenous and non-Indigenous patients showed no significant differences for changes in medication use.

Discussion

People with CHD and/or type 2 diabetes have a markedly higher risk of future cardiac events than the general population and therefore constitute the most appropriate target group for risk-mitigation strategies. Participation in TCP resulted in improvements across all cardiovascular risk factors from entry to completion for patients with CHD and/or type 2 diabetes. Improvements in lipid levels, glucose levels, smoking habit and alcohol consumption combined with increases in physical activity were the most notable findings. Similar results were reported in two previous trials of TCP that assessed cardiovascular risk factor status in patients with CHD.21,22 A real-world experience of TCP in 5544 patients with CHD achieved comparable improvement in risk factors.28

Study strengths and limitations

The audit we report involved a statewide population of patients enrolled into TCP over 4 years. Its strengths include the statewide cohort, comparison of Indigenous and non-Indigenous people, measurement of multiple risk factors and data on medication use.

We note limitations with regard to missing patient data for variables that relied on patients’ usual doctors measuring the requisite information at entry to and exit from the program. More data were missing at entry because patients may not have visited their doctor to have their risk factors measured before the first coaching session. Results were also missing at exit if requests for repeat pathology tests (such as lipid, glucose and HbA1c levels) were made within a 6-month period, contrary to Medicare guidelines. Again, patients may not have attended their doctor to have their risk factors measured. Among participants for whom paired data were available, all risk factors improved significantly from entry to completion of TCP. Post-hoc analysis confirmed that the missing data were randomly distributed in both pre- and post-TCP datasets. Thus, no patient characteristics were identified that would have introduced selection bias. A final limitation was the reliance on unverified patient self-report for lifestyle measures of smoking, alcohol intake and physical activity.

Potential of The COACH Program

Overall, our results provide further evidence to support this intervention as an effective strategy for reducing cardiovascular risk and for secondary prevention. As our cohort comprised patients with CHD and/or type 2 diabetes, the results suggest the potential for TCP to be adapted for other chronic diseases.

Exclusive use of telephone and mail-outs is unique to the chronic disease management model adopted by Queensland Health. These methods eliminate barriers often seen with cardiac rehabilitation programs,5,6,10 including geographic isolation, travel costs and the inconvenience of appointments. More sessions could be given by telephone coaching than could have been given face-to-face.

This study is the first to compare effects of a cardiovascular risk factor reduction program between Indigenous and non-Indigenous populations. Even though there were significant differences in baseline demographics and risk factors, we found no significant differences between the two populations in the changes in any of the risk factors or in medication adherence after TCP. Similar reductions in risk factors in both groups (regardless of risk profile on entry) suggests TCP can be successfully applied across different populations and cultures.

Currently, the components common to most cardiac rehabilitation programs across Australia comprise exercise and education, although exactly how these are delivered in terms of frequency and intensity is not well defined and varies between programs, with no consistent measurement of changes in cardiovascular risk factors. TCP is delivered by trained coaches using a standardised model of care based on risk assessments and goal setting that reflects national disease management guidelines. TCP could be extended nationwide and its effects on risk factor profiles, clinical events, physical function and quality of life could be assessed using national surveys and routinely collected data.

Conclusion

TCP delivered by telephone and mail-outs offers equitable access to an effective health service to all Queenslanders with CHD and/or diabetes, irrespective of their geographic location and ability to access formal cardiac rehabilitation or diabetes education programs. The methods of TCP validated in previous randomised controlled trials21,22 have been applied to routine practice and made available to a widely dispersed population, including residents of remote areas and Indigenous peoples. Given the burden of CHD and diabetes, it offers a sustainable means for optimising health outcomes across diverse populations.

1 Comparison of The COACH Program (TCP) cohort with the Queensland population, by remoteness area26

2 Comparison of cardiovascular risk factors from entry to completion of The COACH Program in participants with coronary heart disease (n = 1962)


Paired differences


Risk factors

No. of patients*

Entry, mean (SD)

Completion, mean (SD)

Mean (95% CI) of difference

P


Fasting lipids, mmol/L


Total cholesterol

1106

4.29 (1.27)

3.73 (0.96)

− 0.56 (0.49 to 0.64)

< 0.001

Triglycerides

1085

1.80 (1.84)

1.47 (0.97)

− 0.33 (0.24 to 0.43)

< 0.001

HDL cholesterol

963

1.08 (0.35)

1.13 (0.34)

0.06 ( 0.07 to − 0.04)

< 0.001

LDL cholesterol

951

2.44 (1.07)

1.83 (0.77)

− 0.61 (0.54 to 0.68)

< 0.001

Fasting glucose, mmol/L

459

5.55 (0.90)

5.41 (0.92)

− 0.14 (0.06 to 0.21)

0.001

HbA1c, % (DM, n = 579)

430

7.83% (1.80%)

7.41% (1.43%)

− 0.43 (0.28 to 0.57)

< 0.001

BP systolic, mmHg

1226

124.5 (16.3)

123.0 (13.3)

− 1.5 (0.67 to 2.42)

0.001

BP diastolic, mmHg

1221

71.4 (11.0)

70.2 (9.2)

− 1.2 (0.57 to 1.82)

< 0.001

Body weight, kg

1864

85.1 (20.2)

84.1 (19.5)

− 1.1 (0.77 to 1.35)

< 0.001

BMI, kg/m2

1632

28.8 (6.0)

28.5 (5.8)

− 0.3 (0.24 to 0.43)

< 0.001

Alcohol, standard drinks per day

1922

1.4 (1.7)

1.1 (1.3)

− 0.4 (0.29 to 0.41)

< 0.001

Physical activity, min/week

1888

142.0 (170.3)

229.1 (238)

87 ( 97.30 to  76.84)

< 0.001


BMI = body mass index. BP = blood pressure. COACH =  Coaching Patients On Achieving Cardiovascular Health. DM = diabetes mellitus. HbA1c = glycated haemoglobin. HDL = high-density lipoprotein. LDL = low-density lipoprotein. * Analysis performed on the number of patients for whom paired data at entry to and exit from the program were available for analysis.


3 Comparison of cardiovascular risk factors from entry to completion of The COACH Program in participants with type 2 diabetes (n = 707)


Paired differences


Risk factors

No. of patients*

Entry, mean (SD)

Completion, mean (SD)

Mean (95% CI) of difference

P


Fasting lipids, mmol/L


Total cholesterol

492

4.51 (1.26)

4.04 (1.02)

− 0.47 (0.36 to 0.58)

< 0.001

Triglycerides

409

2.23 (1.84)

1.90 (1.24)

− 0.33 (0.19 to 0.47)

< 0.001

HDL cholesterol

404

1.06 (0.30)

1.09 (0.30)

0.04 (− 0.06 to − 0.01)

0.001

LDL cholesterol

396

2.46 (1.00)

2.04 (0.84)

− 0.42 (0.33 to 0.51)

< 0.001

HbA1c, %

564

8.15% (2.06%)

7.45% (1.54%)

− 0.70 (0.55 to 0.86)

< 0.001

BP systolic, mmHg

394

129.3 (15.7)

127.3 (12.8)

− 2.0 (0.42 to 3.53)

< 0.001

BP diastolic, mmHg

394

74.8 (9.9)

73.4 (9.5)

− 1.4 (0.39 to 2.44)

< 0.001

Body weight, kg

666

101.7 (28.5)

100.7 (28.1)

− 1.0 (0.56 to 1.47)

< 0.001

BMI, kg/m2

555

35.1 (9.5)

34.7 (9.1)

− 0.4 (0.18 to 0.64)

< 0.001

Alcohol, standard drinks per day

693

1.3 (2.0)

0.9 (1.5)

− 0.4 (0.30 to 0.50)

< 0.001

Physical activity, min/week

684

127.0 (197)

181.6 (177.1)

54.7 (− 68.14 to − 41.17)

< 0.001


BMI = body mass index. BP = blood pressure. COACH =  Coaching Patients On Achieving Cardiovascular Health. HbA1c = glycated haemoglobin. HDL = high-density lipoprotein. LDL = low-density lipoprotein. * Analysis performed on number of patients for whom paired data at entry to and exit from the program were available for analysis.

Financial capacity in older adults: a growing concern for clinicians

Determination of whether an older person is capable of managing their own financial affairs is a vexing question for health and legal professionals, as well as government agencies such as courts and tribunals. This process is often stressful for older people, and families can find that deciding when to take over is a frustrating and divisive exercise. Having family members manage an older person’s assets may result in or exacerbate existing family conflict.

In this article, we define financial capacity and provide an overview of the assessment process, the potential impact of impaired capacity on older adults and implications for clinicians. We focus on best-practice suggestions for clinical management of questions of financial capacity.

What is financial capacity?

Financial capacity entails the ability to satisfactorily manage one’s financial affairs in a manner consistent with personal self-interest and values.1 Although the terms competency and capacity are often used interchangeably in this literature,2 we will refer to capacity throughout. The capacity to appropriately manage financial affairs has both performance and judgement aspects,3 which are distinct in that older people can have limitations in one or both. For example, an older person may be capable of carrying out financial transactions such as purchasing items, but not have the judgement required to spend within their financial means. Conversely, an older adult might have the judgement to assess the relative merits of competing demands on their financial resources, but lack the technical capacity to carry out financial transactions.

Financial capacity is just one domain of capacity. Others include the capacity to consent to medical treatment, make or revoke an enduring power of attorney, participate in research, make their own will, consent to sex, marry or divorce, vote, drive and live independently (covering a broad range of abilities). Eighteen key abilities covering nine domains of financial capacity have been identified4 and these range from simple tasks, such as being able to name coins and notes, to more complex tasks, such as making and explaining investment decisions (see Box 1).

Decision making and referral

Decision making can be conceptualised as a spectrum with complete autonomy at one end and substitute decision making at the other. A person is presumed to have capacity, and thus be able to make their own decisions, unless proven otherwise; however, this capacity is decision specific and may fluctuate. The United Nations Convention on the Rights of Persons with Disabilities (CRPD) entered into force in May 2008 and Australia ratified the CRPD in July 2008. The CRPD promotes supported, rather than substitute, decision making. Supported decision making can, however, be problematic. Examples of this include cases where those providing the support are not motivated to do what is in the best interests of the impaired person or where the person’s level of impairment is so severe that any form of decision making by the impaired person is no longer possible. Informal arrangements to cover both these situations are available and are outlined in a guide to guardianship and administration laws across Australia published by the Intellectual Disability Rights Service.6 The involvement of family and friends is important, and a referral to social work services or other allied health professionals may facilitate such informal arrangements. Formal arrangements can be made through guardianship boards or tribunals that operate in most states and territories (http://www.agac.org.au). Again, referral to such bodies can be intimidating for family (and sometimes even for institutions such as residential aged care facilities). Assistance and support with such a referral from allied health professionals, general practitioners or peak bodies such as Alzheimer’s Australia and Dementia Behaviour Management Advisory Services may be invaluable.

What are the potential impacts on older adults?

Impaired financial capacity renders an individual vulnerable to financial exploitation through actions such as undue influence and consumer fraud. Financial abuse is estimated to affect 1.1% of older Australians,7 and was found to be the most common form of elder abuse in a Western Australian study, particularly for older women and very old people.8 Undue influence describes a situation in which an individual is able to convince another to act in a way contrary to their will. Such influence might manifest in situations where an older person is financially capable but the family or other caregivers decide to manage the older person’s finances based on their own interests. Furthermore, consumer fraud is estimated to affect 5% of older Australians.9 Examples of such schemes often include taking advantage of cognitive decline in a vulnerable older person — as when a person purporting to be a tradesman comes to the door demanding payment for services supposedly carried out at an earlier time. Older adults who are more socially isolated or who are more dependent on paid external services in order to continue living in the community may be more vulnerable to such exploitation.

Given that older people’s share of total wealth has increased over the past two decades and is likely to continue to do so,10 the problem of financial capacity will become more pressing, and it is likely that more questions of capacity will present in primary and community health care settings.

Who is more at risk?

Recently there has been a focus on the clinical aspects of financial capacity, which broadly span cognitive, affective, instrumental and social capacity functioning.2 Older people with neurodegenerative disorders such as Alzheimer disease, Parkinson disease, frontotemporal dementia and mild cognitive impairment appear particularly vulnerable to diminishing financial capacity.3 How such changes manifest themselves, from a lifespan perspective, might be conceptualised11 as amounting to relatively minimal changes in financial capacity with normal ageing, particularly if older people have good social and instrumental support from family and friends. However, people with mild cognitive impairment may have increasing difficulty with more complex financial skills including bank statement management, bill payments and financial judgement,4 and it is important for families and health professionals to be mindful of reports or observations of such decline. Ideally, early intervention would allow for smoother transfer of financial responsibilities and perhaps avoidance of distress or embarrassment on the part of the person with declining financial skills.

People with mild Alzheimer disease have been reported to have impairments in both simple and complex financial skills, with rapid decline in a 1-year period.5 More global impairment of financial skills with probable financial incapacity has been reported in most people with moderate Alzheimer disease;12 and complete lack of financial capacity in severe Alzheimer disease.11 Over time and with increasing severity of dementia, older adults may show declining interest and engagement in their financial affairs, as well as reduced concerns about the consequences of their inaction. Such a situation may continue without family members being aware that anything is amiss. Sorting out financial concerns in cases of advanced dementia, particularly in the context of familial discord, can be challenging for health care professionals.

How to assess financial capacity

There is currently no universal standard for evaluating financial capacity. Overreliance on clinical judgement or non-specific assessment tools (such as the mini-mental state examination13) for determining specific aspects of capacity, such as the ability to make a will and distribute assets or to determine the presence of undue influence, is worrying. Failure to include specific objective measures of financial capacity as well as emotional and cognitive functioning may result in overreliance on clinical impressions rather than objective data, and may be less useful in a legal context.

A review of clinical assessment approaches to financial capacity in older adults found that current methods were based around a clinical interview, neuropsychological assessment and performance-based assessments.2 The authors stressed the need for a multipronged evaluation. The extant literature suggests that cognitive domains relevant to capacity assessment in Alzheimer disease include conceptualisation, expressive language, numeracy skills, semantic memory, verbal recall, executive function and receptive language.14 However, all relevant cognitive domains are often not systematically tested, or may be overassessed.15 Important contextual and social variables that inform interpretation of objective data16 and may be directly tied to the potential for financial abuse17 are often ignored. Moreover, reduced insight in patients about their own limitations and abilities, as well as the presence of psychiatric conditions such as depression and anxiety, can also lead to errors in judgement by patients with cognitive decline. Abilities such as insight are only infrequently examined by clinicians in the course of assessing financial capacity. Assessment of a person’s ability to understand the facts and choices related to their decisions, to distinguish between alternatives and weigh up consequences, and to make an informed choice and communicate their decision should also be made.

Unfortunately, the research literature related to financial capacity has been difficult to translate into sound clinical practice in health care settings. Capacity assessments at times rely almost completely on clinical judgement, which is not evidence-based and which may be vulnerable to bias.18 Comparability and consistency between approaches, even in a single case, may be lacking.19 Approaches to determining capacity have rarely been empirically validated with respect to their real-world reliability and utility.20 Part of the difficulty has been establishing a credible gold standard.15

What does this mean for clinicians working with older people?

Primary care providers such as GPs and community nurses are often the first to encounter older people with diminishing financial capacity,11 and they have an important role to play in acting on their concerns; for example, by discussing them with the family or referring the patient for more formal capacity assessment. Five different roles that clinicians may choose to adopt have been suggested:11 educating patients and families about the need for advance financial planning; recognising signs of possible impaired financial capacity; assessing financial impairment, financial abuse or both; recommending interventions to help patients maintain financial independence; and making timely and appropriate medical and legal referrals. This approach seems relevant to all clinicians working with older people. Ideally, all three of the suggested assessments — clinical interview, neuropsychiatry assessment and performance-based tests — would be conducted to assess capacity.

A comprehensive clinical interview is vital to directly assessing financial capacity with respect to a patient’s physical and emotional health. Objective assessment of cognitive function and potential psychiatric disorders, such as depression, anxiety, and psychosis and related symptoms such as delusions, are important and should use instruments that have been appropriately normed and, wherever possible, developed for geriatric populations. Performance-based assessment of financial capacity and decision making, as well as an assessment of a person’s vulnerability to undue influence and exploitation, are also important.2 A brief list of relevant instruments to consider appears in Box 2; this list is indicative rather than exhaustive.

Conclusions

Financial capacity is emerging as an important concern related to older people and those involved in their care. Assessment of financial capacity should include formal objective assessment in addition to a clinical interview and gathering of contextual data. There is no one instrument that can be used in isolation; use of multiple sources of data, objective performance-based tests, neuropsychiatric assessments and self-report clinical interview data is recommended. The decisions that result from an assessment of capacity can have far-reaching consequences. In order to better meet the needs of patients, their families and their carers, as well as clinicians involved in such assessments, standards and guidelines for the assessment of capacity are needed.

1 Financial conceptual model*

Domain and task

Task description

Difficulty


1 Basic monetary skills


a Naming coins/currency

Identify specific coins and currency

Simple

b Coin/currency relationships

Indicate relative monetary values of coins/currency

Simple

c Counting coins/currency

Accurately count groups of coins and currency

Simple

2 Financial conceptual knowledge


a Define financial concepts

Define a variety of simple financial concepts

Complex

b Apply financial concepts

Practical application/computation using concepts

Complex

3 Cash transactions


a One-item grocery purchase

Enter into simulated one-item transaction; verify change

Simple

b Three-item grocery purchase

Enter into simulated three-item transaction; verify change

Complex

c Change/vending machine

Obtain change for vending machine use; verify charge

Complex

d Tipping

Understand tipping convention; calculate/identify tips

Complex

4 Chequebook management


a Understand chequebook

Identify and explain parts of cheque and cheque register

Simple

b Use chequebook/register

Enter into simulated transaction; pay by cheque

Complex

5 Bank statement management


a Understand bank statement

Identify and explain parts of a bank statement

Complex

b Use bank statement

Identify specific transactions on bank statement

Complex

6 Financial judgement


a Detect mail fraud risk

Detect and explain risks in mail fraud solicitation

Simple

b Detect telephone fraud risk

Detect and explain risks in telephone fraud solicitation

Simple

7 Bill payment


a Understand bills

Explain meaning and purpose of bills

Simple

b Prioritise bills

Identify overdue utility bill

Simple

c Prepare bills for mailing

Prepare simulated bills, cheques, envelopes for mailing

Complex

8 Knowledge of personal assets/estate arrangements

Indicate asset ownership, estate arrangements

Simple

9 Investment decision making

Understand options; determine returns; make decision

Complex

Overall financial capacity

Overall functioning across tasks and domains

Complex


* Reproduced from: Martin RC, Griffith HR, Belue K, et al. Declining financial capacity in patients with mild Alzheimer’s disease: a one-year longitudinal study. Am J Geriatr Psychiatry 2008; 16: 209-2195 with permission from Elsevier. † Requires corroboration by informant.

2 A brief list of instruments available for assessing financial capacity, decision making and vulnerability

Addenbrooke’s Cognitive Examination – III21

Informant Questionnaire on Cognitive Decline in the Elderly22

Semi-Structured Clinical Interview for Financial Capacity12

Financial Competence Assessment Inventory23

Geriatric Depression Scale24

Geriatric Anxiety Inventory25

Instrumental Activities of Daily Living Scale for elderly people26

Anticholinergic burden in older women: not seeing the wood for the trees?

Older people are particularly vulnerable to adverse medicines-related events. Reasons for this include the physiological changes of ageing, the chronic and comorbid conditions they often have, the types of medicines they are commonly prescribed, and the frequency with which they use multiple medicines.1,2 Adverse effects related to medicine use are a significant health problem in this growing population group.3 Many medicines used by older people have anticholinergic effects (effects through one of the body’s principal neurotransmitter systems).4 The anticholinergic effect of an individual medicine may be small, but the anticholinergic effects of multiple medicines may be additive, constituting “anticholinergic burden”.1,4,5

The degree of anticholinergic effect varies greatly between drugs and drug classes.6 Drug classes with anticholinergic effects that are commonly used by older people include gastrointestinal antispasmodics, medicines used for urge incontinence, antipsychotics, and tricyclic antidepressants.4 The anticholinergic effect may be intrinsic to the therapeutic effect of the medicine or an unintended side effect.4

Relatively minor anticholinergic adverse effects that are readily apparent include dry mouth, constipation and blurred vision.4 More serious effects, such as confusion and impaired cognition, have also been consistently associated with anticholinergic medicines.710 Anticholinergic burden can also affect functional status in older people, generally related to instrumental activities of daily living (skills necessary for individuals to live independently);1,7 balance, gait and mobility;5 and is associated with falls and frailty.9,11

An Australian study found that 21% of community-dwelling men aged 70 years or older were taking medicines with definite anticholinergic effects.1 Although women outnumber men in the older population,3 research into anticholinergic medicine use has focused predominantly on mixed sex and male samples.1,8,11 However, United States studies have shown that 15% of women aged 75 years and older12 and 11% of women aged 50–79 years13 used anticholinergic medicines.

Women may have a particular propensity to be prescribed highly anticholinergic medicines for conditions such as urinary incontinence and chronic neuropathic pain, and they use an increasing number of medicines as they age. The cumulative anticholinergic effects of these medicines can increase the risk of serious functional impairment, negatively affecting independence in older age. In this study we aimed, for the period 2008 to 2010, to:

  • describe the anticholinergic medicine burden among a community-based sample of older women from the Australian Longitudinal Study on Women’s Health (ALSWH);
  • identify medicines and combinations of medicines that make the greatest contribution to anticholinergic burden; and
  • describe the predictors of high anticholinergic medicine burden.

Methods

In this retrospective observational longitudinal study, we analysed survey data from the ALSWH, linked to Pharmaceutical Benefits Scheme (PBS) data. Ethics approval for data collection, linkage and analyses was obtained through the University of Queensland, University of Newcastle and Australian Department of Health and Ageing.

Sample

The sample included women from the ALSWH “older” cohort (born in 1921–1926), who had completed Survey 5 (2008), consented to PBS linkage, had concessional status for the PBS and had made at least one medicine claim from 1 January 2008 to 30 December 2010.

Data sources

ALSWH survey data: The ALSWH is a national study that began in 1996 with a random sample of more than 40 000 women in three birth cohorts. Here, we focus on those in the older cohort, born in 1921–1926, who completed Survey 1 in 1996. Since 1998, follow-up surveys have been completed every 3 years. The older cohort were aged 70–75 years at Survey 1 (12 432 women) and 82–87 years at Survey 5 in 2008 (5560 women). Deaths are ascertained using the National Death Index.

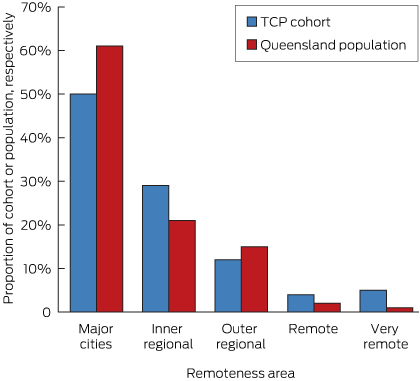
Compared with the general population, women in the cohort have had a small relative survival advantage, mainly due to baseline demographic and health behaviour differences. Compared with national data, underrepresentation of women born in non-English-speaking countries and those who were underweight has increased slightly over the course of the study.14 Such small biases are unlikely to affect measures of association.

The surveys covered a range of health, social, psychological and demographic variables. Detailed methods and surveys are available from the ALSWH website (http://www.alswh.org.au/).

Medicines data: These were records of subsidised prescriptions under the PBS and Repatriation PBS (RPBS) provided by Medicare Australia, for the calendar years 2008 through 2010. These records provide reliable data about dates of services and medicine types. The ALSWH study uses deterministic linkage between survey and individual PBS data, using personal identifier numbers held by Medicare.

PBS data include only PBS-listed prescription medicines that attract a government subsidy, so they do not include medicines provided in hospital or purchased over-the-counter (OTC). Although OTC medicines with anticholinergic activity are not captured by the PBS, we did not expect a significant impact on our results, as at ALSWH Survey 4 (2005), less than 5% of women in the older cohort reported OTC medicine use.15 Medicines data for those with concessional status are captured consistently by PBS, as all PBS medicines cost more than the concessional status threshold and will always attract a government subsidy.

Statistical analyses

PBS data were coded to conform to Anatomical Therapeutic Chemical Codes.16

Anticholinergic medicines were identified and their potency rated using the Anticholinergic Drug Scale (ADS),6 as follows.

Level 1: potentially anticholinergic as evidenced by receptor binding studies (for example, frusemide, digoxin, or captopril).

Level 2: anticholinergic adverse events sometimes noted, usually at excessive doses (for example, carbamazepine, cyproheptadine, or disopyramide).

Level 3: markedly anticholinergic (for example, amitriptyline, brompheniramine, or oxybutynin).6

The ADS provides a measure of anticholinergic burden assessed from serum anticholinergic activity for individual medicines;6 and has recently been shown to predict adverse medicines-related events.17

The characteristics of women who used at least one anticholinergic medicine at any time from 2008 through 2010 were compared with those who did not use any, using χ2 tests for categorical variables and two-sided t tests for continuous variables.

The ADS potency ratings (level 1, 2 or 3) of all anticholinergic medicines claims for each woman were summed to give individual 6-month anticholinergic burden (ADS) scores (semesters were January to June and July to December each year), for 2008 to 2010. We did not consider medicine doses in calculating ADS scores, as it has been shown that including the dose does not improve ADS correlation with serum anticholinergic activity.6

ADS scores were tabulated and graphed. High ADS scores were those in the 75th percentile of all scores, and above. Anticholinergic medicines associated with high 6-month ADS scores were identified.

The predictors of high 6-month ADS scores for women using anticholinergic medicines were analysed using stepwise backwards generalised estimating equations (GEE), with the significance level set at P < 0.05. Women who made no claims for anticholinergic medicines were excluded as they are likely to be a different population to those who receive at least one anticholinergic medicine, and including them would erroneously intensify differences between groups. Sociodemographic covariates considered in the model were: age, area of residence (rural/urban), education level (secondary or above/below secondary), living arrangements (alone/with others), marital status (partnered/not). Lifestyle covariates were: smoking status (current/not), alcohol use (yes/no), body mass index (mean).18 Health covariates included: conditions (yes/no for mental health problems [depression, anxiety, or nervous disorder], cardiovascular disease [heart attack, other heart problems, or stroke], diabetes, arthritis, asthma, cancer [excluding skin cancer], and osteoporosis), total number of other (not anticholinergic) medicines, quality of life (measured by the 36-item short form health survey [SF-36]).19

All statistical analyses were performed in Stata/IC, version 11 (StataCorp). Data file construction was performed using SAS, version 9.4 (SAS Institute).

Results

Sample characteristics

There were 5560 women born in 1921–1926 who returned ALSWH Survey 5; 3694 of these (66.4%) consented to PBS linkage (for 2008, 2009, and 2010). Of those 3694, 1883 (51.0%) had at least one PBS claim from 2008 to 2010, and had concessional PBS status. Of these women, 1126 (59.8%) had at least one anticholinergic medicine claim from 2008 to 2010.

Appendix 1 shows that, compared with women who had no anticholinergic medicines claims, the group with anticholinergic medicines claims had: a lower proportion of women with a secondary education or higher (P < 0.05); a higher mean BMI (P < 0.05); a higher proportion with cancer (P < 0.05), a mental health problem (P < 0.001), asthma (P < 0.001), cardiovascular disease (P < 0.001), and arthritis (P < 0.001); higher multimorbidity (P < 0.001). They also performed less well on all SF-36 scales (P < 0.001)

Use of anticholinergic medicines

Fifty different anticholinergic medicines were used by this group (21 at ADS level 3, four at ADS level 2 and 25 at ADS level 1). The proportion of women who used anticholinergic medicines increased over the 3 years, from 783 (42.5%) in 2008 to 823 (46.9%) in 2010 (Box 1). Just over a third of women using anticholinergic medicines (34.3%) used these in all six semesters, 25.7% used them in only one, 14.7% used them in two, 10.8% in three, 7.9% in four, and 6.8% in five semesters. The median number of claims for anticholinergic medicines per woman was four (interquartile range [IQR], 2–7) in all semesters. Most anticholinergic medicines used were at ADS level 1.

Anticholinergic burden (ADS score)

ADS scores were relatively stable across all semesters over the 3 years, as shown in Box 2. Median ADS scores were 4 or 5 in all semesters. A high ADS score for a semester was defined as ≥ 9 (75th percentile of scores).

Main contributors to anticholinergic burden

Most anticholinergic medicines used by women with high ADS scores were at ADS level 1. Given the diversity of ADS medicines used, we identified no common combinations of medicines contributing to high ADS scores. The 10 most commonly used anticholinergic medicines in women with high ADS scores were very similar across the six semesters: amitriptyline (level 3), digoxin (level 1), doxepin (level 3), frusemide (level 1), isosorbide (level 1), nifedipine (level 1), oxycodone (level 1), prednisolone (level 1), and warfarin (level 1) were present in each semester, with fentanyl (level 1) in four and dothiepin (level 3) in two semesters (Appendix 2).

Characteristics of older women with a high anticholinergic burden

The final parsimonious GEE model showed that increasing age, self-report of cardiovascular disease (heart attack, other heart problems, and stroke) and number of other (not anticholinergic) medicines were predictive of a higher anticholinergic burden for women using anticholinergic medicines (Box 3).

Discussion

This study showed that a high proportion of older women have a substantial anticholinergic burden, and that this high burden is driven by the use of multiple medicines with lower anticholinergic potency rather than use of medicines with higher anticholinergic potency. Our study is one of the few in Australia and internationally that evaluate anticholinergic burden in older women. It is also unique in that it examines anticholinergic burden longitudinally, using continuous and reliable data on medicines from the PBS.

While there are many methods for measuring anticholinergic burden,4,20 we used the ADS, which provides a measure of anticholinergic burden that correlates well with serum anticholinergic activity measures.6 A US clinic-based study of women aged 75 years and older, using a similar measure of anticholinergic burden, found that mean burden increased significantly in the 10 years of their study; however, only 15% of participants were using anticholinergic medicines within the last month at follow-up.12 Another US study using data from the Women’s Health Initiative found that 11% of women aged 50–79 years were using an anticholinergic medicine at baseline.13 Although we found that median anticholinergic burden did not increase over time, 35% of our community sample were using anticholinergic medicines during the 6-month baseline semester, and this proportion increased significantly over time. Over a third of women using anticholinergic medicines used these in all semesters, suggesting continuous use.

Total avoidance of medicines with anticholinergic properties for older people is neither practicable nor necessarily desirable.21 Multiple medicines use is not only common among older adults, but is important for ameliorating symptoms, improving quality of life, and sometimes for curing disease.21 Individual prescribing decisions about medicines with anticholinergic activity, as with all medicines, will always involve assessing the potential benefits and harms22 and, in past research, we showed that anticholinergic burden is an area where assessing the risk is problematic.23 In interviews with Australian general practitioners we found that they have limited understanding of the concept of anticholinergic burden and the range of medicines that contribute to it, despite otherwise having a sophisticated understanding of potential medicine adverse events and managing this risk.

The predictors of a high anticholinergic burden were generally not unexpected for the group we studied. One of our aims in this analysis was to identify characteristics of older people that might alert doctors to a particular risk of higher anticholinergic medicine burden. While unremarkable predictors may not be very informative in clinical practice, our study does emphasise that identifying a higher anticholinergic medicine burden is complex, and there appear to be no simple flags to help doctors identify the risk.

Our study has some potential limitations. While the PBS provides comprehensive data, as outlined in the methods, it does not include all medicines (eg, OTC medicines). Although we expect this would not have significantly affected our findings, this limitation may mean that our calculation of burden is conservative. Also, as medicines costing less than the patient “copayment” will not be captured in the PBS,24 we restricted our analyses to women with “concessional” status, as is common practice.2 As the vast majority of older women have concessional status, the effect on the generalisability of our findings to this group should be limited.

Conclusions

It is a novel and important finding for clinical practice that high anticholinergic medicines burden in this group was driven by the use of multiple medicines with lower anticholinergic potency rather than by those with higher anticholinergic potency. While we might expect that doctors would readily identify anticholinergic burden as a risk in patients using medicines with high anticholinergic potency, they may be less likely to perceive a risk for patients using multiple medicines with lower anticholinergic potency. Developing a means of calculating the anticholinergic burden of drug regimens (and of the contributions of individual drugs) and incorporating this into GPs’ prescribing software would be appropriate. Our findings provide important evidence to underpin prescribing practice and policy aimed at reducing disability and adverse medicine events among older women, and may apply to all older people.

1 Claims for anticholinergic medicines (AM) by Australian women aged 82–89 years, annually and 6-monthly, 2008 through 2010

Year

Women with any medicine claim

Women with
AM claim

AM claims by ADS level*


Number of AM claims


Level 1

Level 2

Level 3

Min

Q1

Median

Q3

Max


2008


Annual

1844

783 (42.5%)

687

16

174

1

2

6

12

56

Jan–Jun

1822

633 (34.7%)

555

13

130

1

2

4

7

33

Jul–Dec

1808

681 (37.7%)

593

13

147

1

2

4

7

27

2009


Annual

1812

796 (43.9%)

694

16

187

1

2

6

12

44

Jan–Jun

1786

654 (36.6%)

566

11

142

1

2

4

7

37

Jul–Dec

1768

683 (38.6%)

592

13

149

1

2

4

7

27

2010


Annual

1755

823 (46.9%)

733

21

169

1

2

6

13

50

Jan–Jun

1734

677 (39.0%)

594

17

135

1

2

4

7

24

Jul–Dec

1702

706 (41.5%)

628

13

137

1

2

4

7

26


ADS = anticholinergic drug scale. Min = minimum. Max = maximum. Q1 = 25th percentile. Q3 = 75th percentile.
* Level 1, 2 and 3 AM claims are not mutually exclusive.

2 Anticholinergic drug scale scores for 1126 Australian women aged 82–89 years who used anticholinergic medicines (AM), by 6-month semester, 2008 through 2010

Year

Semester

Women with
AM claim

Anticholinergic drug scale scores


Minimum

Q1

Median

Q3

Maximum


2008

Jan–Jun

633

1

2

5

9

33


Jul–Dec

681

1

2

5

9

30

2009

Jan–Jun

654

1

2

4

8

37


Jul–Dec

683

1

2

5

8

39

2010

Jan–Jun

677

1

2

5

8

39


Jul–Dec

706

1

2

5

9

33


Q1 = 25th percentile. Q3 = 75th percentile.

3 Multivariate generalised estimating equation regression of explanatory variables (final model) for anticholinergic medicine users with a high anticholinergic burden (ADS score ≥ 9) compared with those with lower anticholinergic burden (ADS score < 9)

Variable

Odds ratio (95% CI)

SE

P


Age

1.05 (1.01–1.08)

0.02

0.006*

Education (≥ secondary)

0.85 (0.72–1.00)

0.07

0.056

Alcohol use

0.86 (0.73–1.02)

0.07

0.089

Cardiovascular disease

1.25 (1.05–1.47)

0.11

0.010*

SF-36 pain index

1.00 (1.00–1.01)

0.00

0.047

SF-36 general health perception

0.99 (0.99–1.00)

0.00

0.005*

Number of non-anticholinergic medicines

1.05 (1.04–1.06)

0.01

0.000*


ADS = anticholinergic drug scale. SF-36 = 36-item short form health survey.
* Significant difference (P < 0.05).

Fuelling the debate on e-cigarettes

E-cigarettes continue to divide opinion (resulting in some strange bedfellows), but there is emerging evidence that they are a beneficial aid to stopping smoking and reducing consumption. The first version of what is likely to be a frequently updated review included two randomised trials involving 662 smokers that compared e-cigarettes with and without nicotine. About 9% of smokers who used nicotine e-cigarettes had stopped smoking for at least 6 months, compared with 4% of those using nicotine-free e-cigarettes. Nicotine e-cigarettes were also more effective than placebo e-cigarettes in enabling participants to halve cigarette consumption rates (doi: 10.1002/14651858.CD010216.pub2). There is not yet sufficient evidence to properly compare e-cigarettes with other quitting aids.

A recent review of point-of-care biomarker testing sounds a cautiously optimistic note in the fight against antibiotic resistance. Six trials involving over 3200 mostly adult patients with acute respiratory infections were reviewed. All investigated the use of C-reactive protein tests to guide antibiotic prescribing in primary care. Encouragingly, doctors who test for the presence of bacterial infections were likely to prescribe fewer antibiotics, and no difference was found between the two groups in terms of how long patients took to recover (doi: 10.1002/14651858.CD010130.pub2).

Getting back to work after the summer break can test even the most eager among us, but what of depressed workers for whom absenteeism is commonplace? A recent review of clinical and work-related interventions to reduce the number of days of sick leave taken included 23 studies involving about 6000 participants. The review found that adding a work-directed intervention, such as modifying the type of work, to usual care reduced sick leave, as did enhancing primary or occupational care with cognitive behaviour therapy (doi: 10.1002/14651858.CD006237.pub3).

Parents of children suffering from gastro-oesophageal reflux might reasonably ask whether medicines would make a difference. Although 24 studies contributed data to a new review, concerns over industry influence, diverse study populations and a lack of common end points limit the usefulness of the evidence. Most parents of young babies would probably nod resignedly on hearing there is “little evidence to suggest that medicines for babies younger than one year work”. In older children, proton pump inhibitors and histamine antagonists appear to work, but the evidence does not provide a guide to their relative efficacy (doi: 10.1002/14651858.CD008550.pub2).

For more on these and other reviews, check out www.thecochranelibrary.com.

Inappropriate pathology ordering and pathology stewardship

An effective system of stewardship is needed to optimise the use of pathology tests

Many hospital clinical pathology laboratories presently experience annual increases in workload of 5%–10%.1 Such increases in demand are often not accompanied by concomitant increases in laboratory resources. This environment presents a significant challenge to laboratories that have no control over test-ordering patterns. Compounding this situation is the fact that many pathology tests are inappropriate or unnecessary, as they have no impact on patient care. The extent of inappropriate pathology test ordering in Australia is unknown, but a United Kingdom report on National Health Service pathology services estimated that 25% of all requests were unnecessary or inappropriate.2 Such tests are ordered for a variety of reasons, often in the belief that more testing equates to better patient care. Unfortunately, this is not always the case, and in some circumstances the opposite may be true.

Ozbug3 is a well established closed and moderated email list largely but not solely restricted to members of the Australasian Society for Infectious Diseases, predominantly comprising Australian and New Zealand infectious diseases physicians but also including registrars, medical microbiologists and infection prevention practitioners. There are about 800 subscribers, who discuss a broad range of topics. I asked the following question on Ozbug: “What microbiology laboratory investigation would you consider to be the one, although requested, results in least patient benefit? or What do you consider to be the most useless of microbiology tests?” The unexpectedly large number of responses (140) to this question and the ensuing rich discussion are the stimuli for this article.

My aim here is to discuss and attempt to understand inappropriate or unnecessary pathology testing, to define the drivers for and impact of such testing, and to suggest interventions to improve the use of pathology services. I will focus on hospital pathology services and provide specific examples from my discipline of microbiology.

Inappropriate pathology test ordering

Tests that are ordered but the results of which are never viewed by the clinician are of no use to the management of the specific patient. Duplicate tests or tests performed before initial testing results are available are unnecessary. Similarly useless tests include those that, no matter what the result, will not impact on patient care. Some serological diagnoses require collection of initial and convalescent sera. In many such circumstances, only a single sample is obtained and this is of no use. Many of the serological tests undertaken for the investigation of fatigue have a low likelihood of a useful result and may give the patient false hope of a result that will lead to a definitive diagnosis and effective therapeutic intervention. A serology test should only be performed when the clinical illness and epidemiology support that diagnosis. Otherwise a false-positive result may complicate patient management. These last two points are exemplified by Lyme disease serology, which is often performed in a setting of vague, non-specific symptoms in a patient who has never visited a known endemic region or country.

For bacterial culture, a dry swab in a specimen jar is unlikely to be useful. A midstream urine specimen that has a normal urinalysis result is most unlikely to identify a pathogen. A recent trend is to swab environmental services or inanimate objects for resistant organisms. This often occurs in the absence of epidemiological evidence to support such a link, and such swabbing should be resisted.

Generally, microbiology tests for clearance, such as repeat throat and nose swabs for respiratory viruses and repeat stool tests for Clostridium difficile, are unnecessary or not recommended.

Other common individual tests suggested by Ozbug correspondents as inappropriate or unnecessary are included in Box 1. Ozbug correspondents acknowledge that for many of the tests mentioned, it is not the test itself that is under scrutiny but the use of that test, and also that these tests may be useful in specific circumstances or jurisdictions. Laboratories also have the responsibility to offer tests that have been validated for the purpose for which they are offered.

Factors contributing to inappropriate pathology ordering

The prime reason for ordering pathology testing is to optimise patient diagnosis and management. Most practitioners agree on the importance of prudent use of pathology services. However, there may be other less apparent drivers for suboptimal pathology test ordering. Such testing may be tied to the patient’s or the family’s expectations rather than to an actual need for such testing. The physician’s anxiety or fear of missing a diagnosis may generate the feeling that something needs to be done, leading to overinvestigation without a clear rationale for that testing. Junior doctors may order according to peer perception or because they are concerned that their consultant may criticise them if the test has not been requested. In some circumstances when a doctor is time pressured, ordering pathology tests may be an easier course than the timely consideration of management options.

Other less than ideal reasons to order pathology tests include: “wouldn’t it be nice to know”, “I cannot find (or have not looked for) the previous result”, “I may want to publish the case in the future” and “I do not believe the result from the first laboratory and I want to send it to a second laboratory”. Some individual factors contributing to suboptimal testing, suggested by Ozbug correspondents, are summarised in Box 2.

Pathology laboratories may also contribute to the number of inappropriate tests. New technology with new testing menus may be introduced before there is evidence that such developments have a favourable impact on patient outcomes.4

Risks of inappropriate pathology ordering

Some tests are not only unnecessary but may be misleading or even harmful. The receipt and subsequent processing of saliva when sputum is ordered may identify transient oral colonising bacteria such as Streptococcus pneumoniae or methicillin-resistant Staphylococcus aureus. This may do a patient harm if the organism is then assumed to be the aetiological cause of the pneumonia, targeted treatment is given and the real cause of pneumonia is overlooked.

When inappropriate or unnecessary tests are ordered, there is a risk of a false-positive result, leading to further unnecessary testing, other investigations and even unnecessary treatments with attendant adverse effects. Ober has described this cascade effect, highlighting that a “normal range” typically includes 95% of all normal subjects, with up to 5% of normal subjects given an abnormal result.5 With modern multichannel analysers, more often used in other pathology disciplines, the chance of a false-positive result is further increased.

Inappropriate pathology testing consumes laboratory resources, both budgetary and labour. This may, especially in more manual disciplines such as microbiology, lead to delays in processing and increase the turnaround time for specimens from the patients in greatest need.

Strategies to improve pathology test ordering

There has been much discussion among the Ozbug group concerning possible strategies to improve microbiology test ordering. Individual strategies suggested by Ozbug correspondents are shown in Box 3. There are a limited number of studies documenting the impact of a strategy targeting a specific test with a decrease in the ordering of that test during the period of observation.6 However, such interventions generally do not tackle the breadth of pathology testing, and the long-term sustainability of such interventions is questionable.

Overall, the Ozbug discussions emphasise the need for an ongoing system of stewardship to ensure the optimal use of pathology resources. To be effective, a system needs to be developed together with all the major stakeholders, have a strong and iterative educational component, be evidence-based, include a system of regular audit with feedback, and especially target those tests that are high cost, resource expensive and frequently used inappropriately. Orders from clinicians should be considered requests for testing as well as for specialist pathologist input. Within my own discipline, the clinical microbiologist should take an active lead in decisions about testing menus and indications, specimen acceptability and acceptance, testing quality, and test interpretation.

Just as antimicrobial stewardship has now become a national standard for hospital accreditation, a system of pathology stewardship would optimise the use of pathology resources. This is not a new concept. In 1922, Peabody wrote:

Good medicine does not consist in the indiscriminate application of laboratory examinations to a patient, but rather in having so clear a comprehension of the probabilities and possibilities of a case as to know what tests may be expected to give information of value.7

1 Ozbug correspondents’ examples of inappropriate microbiology test ordering*

  • Most extra tests performed on cerebrospinal fluid when no abnormalities were found on microscopy
  • Routine cultures of vascular catheters
  • Vancomycin-resistant enterococci and methicillin-resistant Staphylococcus aureus surveillance cultures in unquarantined patients
  • Parasites in stools in hospitalised patients
  • Surveillance blood cultures in asymptomatic patients
  • Streptococcal, herpes, typhoid fever (eg, Widal test) and Lyme disease serology
  • Legionella and pneumococcal urinary antigens in patients with normal chest x-ray results
  • Repeated bacterial surveillance cultures of endoscopy equipment

* Note: In some specific circumstances these tests may be appropriate.

2 Ozbug correspondents’ reports of potential factors contributing to inappropriate test ordering

  • Suboptimal teaching of undergraduates and graduates
  • Pressure of work for both clinicians and pathologists
  • Lack of pathologist input for test menu development and specimen suitability information
  • Clinicians’ poor understanding of test reliability and validity
  • Clinicians’ lack of knowledge and concern about pathology costs
  • Ease of ordering tests electronically or using prestamped request slips
  • Income generation of some pathology testing
  • Acceptance of public pathology as a learning environment that encourages more pathology
  • Fear of litigation

3 Strategies suggested by Ozbug correspondents to improve microbiology test ordering

  • Enhanced education of medical students and graduates
  • Pathology ordering audit and feedback
  • Increased collaboration and engagement with clinicians
  • Development of rejection rules such as minimum retest intervals
  • Display of costs of pathology tests with pathology results
  • Standardisation of investigations for specific clinical syndromes
  • Development and promulgation of golden rules regarding pathology testing
  • Pathology rotations for junior medical staff
  • Prevention of duplicate testing