×

Strengthening primary health care: achieving health gains in a remote region of Australia

The health status of rural and remote Australian communities is poorer than that of urban communities. Comprehensive primary health care (PHC) services can reduce these health inequities, which by definition are unfair and remediable,1 through the provision of competent clinical care, population health programs, good access to secondary and tertiary care, and client and community advocacy to address health risk factors and social determinants.2

In rural and especially remote areas, there is strong evidence that poor access to PHC remains a critical barrier, particularly for Aboriginal and Torres Strait Islander people, and this is reflected in the high rate of avoidable hospitalisations.3 However, there is a paucity of rigorous studies showing the nature of the relationship between models of health care in remote areas and health outcomes.4 Given increasingly scarce resources, high costs and workforce shortages in remote areas, understanding how well services are meeting community needs and improving health outcomes is essential.

This study addresses this gap in knowledge by evaluating a health service partnership in the Fitzroy Valley in the remote Kimberley region of north-west Western Australia.5 The Fitzroy Valley covers an area of 30 000 km2, and the population of about 3500 people is dispersed across 44 communities with a stable core population. Services are provided to both Aboriginal (80%) and non-Aboriginal residents. The hospital, main community clinic and Aboriginal community controlled health services are co-located in the town of Fitzroy Crossing. Daily primary care services and occasional specialist services are provided through community health clinics in larger outlying communities and less frequent services to smaller satellite communities.

The aim of the partnership was to reorientate the existing health services from an acute reactive approach to a more comprehensive PHC approach, as recommended in the National Strategies for Improving Indigenous Health and Health Care.6 Before the partnership, care was largely episodic and reactive to patient-initiated presentations. The objective of this article is to examine how changes in the model of service delivery were associated with increased use of primary care and resultant health outcomes for the population.

Methods

In 2011, after the health service reorientation, a WA State Health Research Advisory Council Research Translation Project grant was awarded to the research team to implement a retrospective evaluation to identify the key events leading to change and their impact.

Evaluation framework

A framework for monitoring the impact of changes to PHC services on population outcomes was developed for the Fitzroy Valley to take into account its specific demography and characteristics. Building on a similar framework used for a small rural community in Victoria,7 this framework incorporates the key requirements for high-quality health service performance8 and draws on the links between structure, process and outcomes described by Donabedian.9 The development of this evaluation framework required a targeted literature review and validation workshops with stakeholders and national experts in rural and remote PHC evaluation.

In order to maximise its transferability to other health services, the framework indicators are consistent with the National Health Performance Authority Performance and Accountability Framework10 and the Aboriginal and Torres Strait Islander Health Performance Framework.11 The program logic approach underpinning our framework is recommended by the National Strategies for Improving Indigenous Health and Health Care.6 A program logic model uses change theory to describe and identify relationships, and enables the impact of service inputs to be associated with predetermined output indicators, providing an indication of progress towards long-term health improvements. Key inputs were identified and primary health care activity and usage measures were monitored to assess the impact of changes on quality-of-care indicators, mortality, morbidity and health behaviours.12 Indicators and their relationship to policy and the logic model are shown in the Appendix.

Data collection and analysis

Health service data for all residents in the Fitzroy Valley (defined by postcode) from 1 July 2006 to 30 June 2012 were collected and analysed from the commencement of the formal partnership and reorientation of the service. Input data were collected from annual reports, financial reports, workforce data, formal agreement documents and meeting minutes of the three partner health service organisations responsible for delivering care into the Fitzroy Valley: the Kimberley Population Health Unit (KPHU), Fitzroy Crossing Hospital (FCH) and Nindilingarri Cultural Health Services (NCHS).

Output data relating to PHC activity and service use were accessed directly from health department databases and PHC program implementation from annual reports. Outcome quality-of-care indicators (such as glycated haemoglobin level, blood pressure and receiving antihypertensives) were generated from the electronic patient medical records. The proportion of those eligible who received the service was calculated against individuals enrolled in the health service.

Data were collected by an externally funded research officer. Indicators were extracted electronically from the health department databases and the electronic medical record used by Fitzroy Valley Health Services (Communicare [Communicare Systems]). Quality-of-care indicators were assessed against the National Key Performance Indicators for Aboriginal and Torres Strait Islander for primary health care.13

Data were compared over time to monitor trends in health service usage, activity, quality of care and population health outcomes. Data were analysed using the non-parametric trend command in Stata version 10 (StataCorp), which performs the non-parametric Mann–Kendall test for trend across ordered groups.14 All trend lines with < 0.05 showed a significant change in values over 2006–2011.

Ethics approval

Ethics approval for this study was provided by the Western Australian Aboriginal Health Ethics Committee and the Western Australian Country Health Service Research Ethics Committee, and was supported by the Kimberley Aboriginal Health Planning Forum Research Subcommittee.

Inputs and intervention

Several key policy events were identified, which together formed the intervention during this natural experiment. Supportive state and Commonwealth primary health care policy was a key fundamental enabler that provided the funding to strengthen primary health care services.

The formal Fitzroy Valley Health Partnership Agreement memorandum of understanding in 2006 between the government health services (comprising a 12-bed hospital [FCH] and community health services [the KPHU and NCHS]) and the community controlled health service facilitated the integration of primary health care services. The formal partnership agreement negotiated over a 1-year period enabled the three organisations to have a single governance structure for allocating funding, sharing a single electronic medical record and delineating areas of responsibility. Responsibility for health promotion, environmental health and cultural safety belonged to the community controlled NCHS; acute inpatient care, primary care clinic and specialist care to the state district hospital (the FCH); and public health, screening and primary care community clinics and programs to the state-operated KPHU.

The partnership accessed Commonwealth funding for PHC programs through Healthy for Life (an Australian Government program to improve chronic disease, men’s health, and maternal and child health primary care services for Aboriginal and Torres Strait Islander peoples), enabling the implementation of a shared electronic medical record with the capacity to collect evaluation data.

Western Australian state health funding (through the Council of Australian Governments Closing the Gap initiative) for chronic disease in 2010 provided funding for additional primary health care positions which were able to be consolidated through the partnership and provided chronic disease management and care planning.

In 2009, an application for a section 19(2) exemption (Health Insurance Act 1973 [Cwlth]) to allow Medicare billing for primary care patient visits was successful.15 This was a significant driver of increased PHC activity by providing additional resources and incentives to commence adult Indigenous health checks and care plans leading to their integration into primary care clinics. Medicare billings by all providers were reinvested in primary health care under the governance of the partnership.

Another key event was the implementation of alcohol restrictions in the Fitzroy Valley in 2008 driven by local community leadership.16 This decreased the acute care workload on health care staff and appeared to increase patient presentation for non-acute care.17

Results

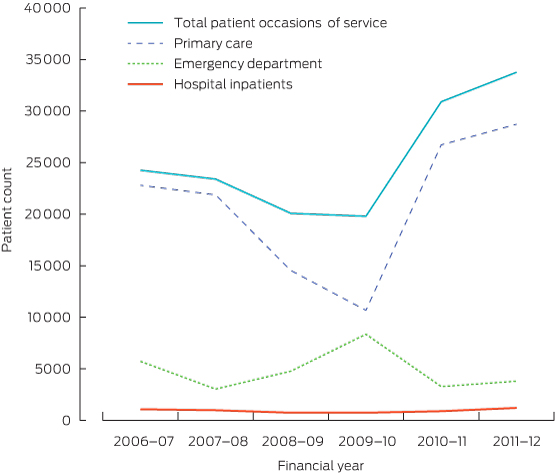
Key policy and structural inputs resulted in an increase in primary care activity (Box 1). There was an overall increase in service activity over the 6-year period, with a relatively constant number of hospitalisations. The increasing trend of emergency department presentations (mostly non-urgent triage category 4 and 5) was reversed, as an increasing number of patients were seen in the PHC clinic (Box 2).

Short-term impact: preventive activity and more equitable access to primary care

Changes in key indicators leading to improved health service performance are summarised in Box 3. There was a significant overall increase in access to PHC services particularly for outlying communities in the Fitzroy Valley. More appropriate service provision led to a large increase in health checks in accordance with national guidelines18 (particularly for males after the commencement of the men’s health program in 2008), and a subsequent increase in the proportion of patients identified with chronic disease or risk factors. Increasing proportional investment in primary health care enabled increased access and appropriateness of services provided.

The NCHS provided regular feedback from the Aboriginal community enabling the health services to provide more culturally appropriate and respectful services. Some of these changes included increased employment of Aboriginal staff and cultural training for all staff, thereby leading to a better understanding of the importance of families and their guardianship roles. In addition, more patient-support people were admitted as boarders, there was increased provision of transport to assist patients to attend appointments and a less structured approach to appointments which enabled patients to attend when it was more convenient. Traditional healers became available on request and smoking of rooms after a death was introduced. These responses to community feedback resulting in more patient centred care were reflected in an increased attendance at follow-up appointments.

Medium-term impact: quality of care

Identifying patients with chronic disease or its risk factors and placing them on care plans with regular interdisciplinary follow-up was prioritised, and resulted in 73% of patients with diabetes having care plans. This systematic approach targeting patients with chronic disease led to an increase in primary health episodes from two to 10 per person per year and a higher proportion of the community attending health services regularly for follow-up and in response to recalls. Despite increasing numbers of patients receiving regular care and completing annual cycles of care for diabetes, there was no statistically significant improvement in glycated haemoglobin levels (< 7%) or in blood pressure levels reaching target values (≤ 130/80 mmHg). (A more detailed study of diabetes management showed improvements in cholesterol levels.)19

Long-term outcomes

There was a decrease in numbers of deaths over the study period, and a decreasing trend in the proportion of hospital admissions requiring emergency evacuation.

There was an increase in screening for alcohol and tobacco use over the 6 years, and a significant increase in the numbers of patients who were ex-smokers, intending to quit and drinking within safe limits (Box 4).

Discussion

Positive changes in health service usage and clinical outcomes were demonstrable despite a number of limitations. Using routine health service data retrospectively reflects the accuracy of individual input and limits data collection to indicators routinely available. The transition from paper-based data recording to dual recording using the electronic patient record between 2006 and 2009 may have contributed to some of the variation in trends before 2009, when the electronic records became largely complete. This may account for small changes in trend in some indicators but not the large increases in key indicators such as increased primary care occasions of service, health assessments and care planning.

These limitations notwithstanding, the partnership between community controlled and government organisations drove a change in philosophy from a reactive acute care system to a more proactive, comprehensive PHC approach. This provided two key elements: population health programs targeting prevention and early intervention for high-risk groups and community advocacy around health risk factors at a population level.

Structural changes led to improvements in performance when compared with mean national key performance indicator data for Aboriginal and Torres Strait Islander people.13 These intermediate outcomes are expected to result in further improvements in health outcomes over time.2 This is important given that two-thirds of the gap in health outcomes is estimated to be due to chronic disease.11 Extant literature shows that, after accounting for burden of illness, remoteness and the increased costs of infrastructure, two to seven times the average per capita funding is required by remote Indigenous populations to maximise effectiveness and equity.20 Our study demonstrates that increased primary care investment where capacity to benefit is high can result in measurable positive outcomes in a relatively short period of time.

While improvements in health outcomes are the ultimate goal, intermediate outcome indicators are the most useful for assessing the contributions of PHC because they are sensitive to PHC interventions, and the long lead time from implementation may preclude direct improvements to health outcomes in the short term.2 However, there was an improvement in mortality in the region. Mortality figures for the Derby–Fitzroy Valley statistical local area are decreasing in contrast to other similar regions.21 While we need to be cautious in interpretation because of the small numbers involved, there was a significant drop in the mortality rate over this period. This decrease may have been due to the effects of the alcohol restrictions and was supported by anecdotal evidence from community leaders: “We don’t go to funerals every month like we used to”.

Despite the poor socioeconomic circumstances of the population, improvements in health behaviours can be credited to the health promotion activities of the NCHS, which implemented a comprehensive health promotion program across the Fitzroy Valley, including a quit smoking program. Not only has health education at the individual and community level been a feature of the service, but the alcohol restrictions brought about by strong community action addressing upstream determinants of health were also significant.16,22

The Aboriginal and Torres Strait Islander PHC sector is leading the way with innovative, integrated PHC delivery models under community governance and research linking health service delivery to intermediate health outcomes.23 Our case study builds on the legacy of outstanding leadership and culture of quality improvement across the Kimberley region.24

This study demonstrates changes that are possible with a comprehensive PHC model focusing on the upstream determinants of health, prevention and improved clinical care to meet community needs, even in a challenging remote context. Strong community leadership can maximise the opportunities provided by policy changes and increases in funding, translating them into improvements in practice and health service delivery. These factors are essential enablers and need to be dealt with concurrently for service sustainability requirements to be met.25 Attending to only one or two of these factors is likely to be ineffective, and it was the systematic approach to all of them simultaneously and comprehensively that enabled sustainable change to occur.

Our study is an example of the potency of research embedded in service delivery26 and demonstrates the importance of monitoring the impact of service delivery on the health outcomes of the population. Linking structure to process and outcomes through key indicators can be used as a planning, monitoring and evaluation tool to measure the impact of national and local policies. Resultant evidence can be used to inform policy direction and translate into service delivery changes consistent with the goals underpinning current national health care reform and Closing the Gap policies.

1 Key inputs strengthening primary health care, and their impact on service outputs, Fitzroy Valley, 2006–07 to 2011–12


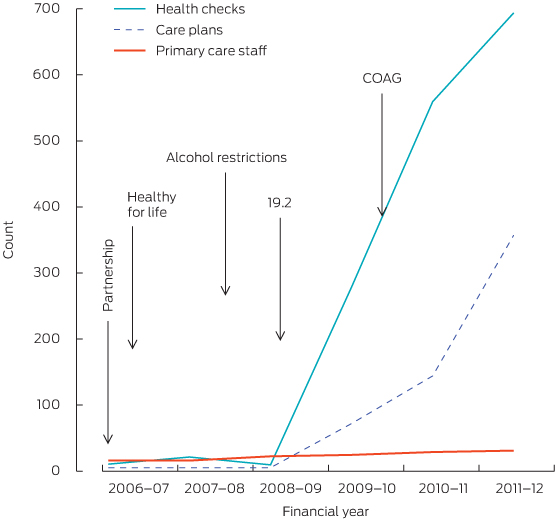
Partnership = Fitzroy Valley Health Partnership Agreement. 19.2 = section 19(2) exemption (Health Insurance Act 1973 [Cwlth]). COAG = Council of Australian Governments Closing the Gap initiative.

2 Trends in health service use, Fitzroy Valley, 2006–07 to 201112

3 Fitzroy Valley Health Service performance indicators, 2006–07 to 2011–12: trends in primary health care activity

Sentinel indicator

2006–07

2007–08

2008–09

2009–10

2010–11

2011–12

P

Mann–Kendall


Individuals on electronic health record

2160

3147

3573

4176

5626

5410


Occasions of service*


Town

4150

8666

13 433

19 628

27 087

35 940

0.03

< 0.01

Hubs

499

1925

5665

8788

10257

10 147

0.04

0.02

Satellites

364

182

476

693

1205

1191

0.05

0.06

Total

5013

10 773

19 574

29 109

38 549

47 278


No. of health assessments

340

475

525

1080

1617

1789

0.03

< 0.01

No. of male health checks performed

0

0

2

159

268

322

0.03

< 0.01

Immunisation


Children aged 24–36 months, coverage

92%

94%

95%

95%

96%

96%

0.04

0.02

No. of adults immunised against influenza

107

908

1397

996

1310

1405

0.07

0.06

No. of Aboriginal patients aged > 15 years screened for biomedical risk factors


Body mass index

143

199

277

519

760

881

0.03

< 0.01

Alcohol consumption

139

142

49

352

262

489

0.09

0.14

Smoking

184

151

82

468

727

845

0.09

0.14

Mean primary care episodes per individual per year

2

4

5

6

8

10

0.03

<0.01

Primary care investment: proportion of total funding

23%

20%

25%

25%

39%

34%

0.06

0.09

Resident population estimate

2664

2718

2773

2828

2885

2942


* Primary health care occasions of service: Fitzroy Crossing town, daily; hubs (Noonkanbah, Bayulu, Wangkatjungka) — community health clinics, Mon–Thu; satellites — community health clinics, 2–4 weekly.

4 Trends in service quality-of-care outcomes, 2006–07 to 2011–12*

Sentinel indicator

2006–07

2007–08

2008–09

2009–10

2010–11

2011–12

P

Mann–Kendall


All-cause mortality, crude death rates per 1000 population (95% CI)

9.38
(5.71 –13.06)

4.78
(2.18–7.38)

9.01
(5.48–12.80)

3.89
(1.59–6.19)

3.12
(1.08–5.16)

2.72
(0.83–4.60)

0.04

0.02

Diabetes


No. of patients

310

337

347

347

380

419

0.06

0.07

Care plans

0

0

0

18%

7%

78%

0.04

0.03

Team care arrangements

0

0

0

5%

13%

73%

0.04

0.03

No. of annual cycles of care completed

2

1

0

9

27

34

0.09

0.14

ACE inhibitor or ABR

43%

56%

57%

79%

82%

87%

0.03

< 0.01

HbA1c level measured in previous 6 months

51%

53%

45%

69%

72%

71%

0.09

0.14

HbA1c level ≤ 7%

25%

27%

20%

25%

20%

26%

0.8

1.00

HbA1c level < 8%

39%

19%

39%

48%

41%

43%


HbA1c level > 10%

31%

35%

34%

31%

37%

34%


BP ≤ 130/80 mmHg

44%

34%

34%

42%

42%

39%

0.9

1.00

Health behaviour


No. of attendees

1290

1568

2015

2164

2327

2504


Regular attendees, > 3 visits over 2 years

49%

68%

77%

78%

82%

79%

0.04

0.02

Smoking


No. of patients screened

184

151

82

468

727

845


Ex-smoker

2%

5%

10%

11%

12%

13%

0.03

< 0.01

Intention to quit

10%

24%

24%

26%

32%

34%

0.03

0.01

Alcohol consumption


No. of patients screened

139

142

49

352

262

489


Within safe limit

11%

9%

29%

21%

26%

28%

0.2

0.27


ABR = angiotensin-receptor blocker. ACE = angiotensin-converting enzyme. BP = blood pressure. HbA1c = glycated haemoglobin. * Data are proportion of patients unless otherwise indicated. † Reference interval. ‡ Aboriginal patients aged > 15 years.

Point-of-care testing for coeliac disease antibodies — what is the evidence?

To the Editor: The recent introduction of rapid point-of-care testing (PoCT) in Australian pharmacies to screen for coeliac disease has attracted controversy1 and provides an important opportunity to review the current literature.

PoCT provides a rapid (within 10 minutes) assessment of the presence or absence of coeliac disease-specific antibodies using a skin-prick blood sample. Based on lateral flow immunochromatography, circulating IgG and IgA antibodies to deamidated gliadin peptides, if present, bind to a membrane, which generates a coloured line of varying intensity.2 Total IgA antibodies are also assessed to detect the 3% of patients with coeliac disease who are IgA-deficient.

Coeliac Australia’s Medical Advisory Committee has developed a position statement, supported by the Royal College of Pathologists of Australasia, that reviews the evidence base for PoCT in coeliac disease and provides a detailed explanation of the technology used in currently available PoCT kits.3

The diagnostic accuracy of current assays to perform PoCT for coeliac antibodies is inferior to laboratory-based testing, particularly in the context of average-risk populations, where coeliac disease prevalence is relatively low.4,5 A positive PoCT result does not confer a definitive diagnosis of coeliac disease; nor does a negative test sufficiently exclude it. Diagnosis of coeliac disease still requires demonstrating the characteristic enteropathy in a small intestinal biopsy specimen.6

Interpretation of PoCT results requires a suitably trained practitioner, as it is inherently subjective and greater reader experience is associated with improved accuracy. Interpretation of results where antibody binding generates a “faint positive” line is challenging.4 Validated standards for reporting results, sound clinical governance, and protocols that establish regular control procedures will be important to ensure robust performance of PoCT.

Although it is an attractive technology, the accuracy and clinical utility of PoCT by community clinics, general practitioners and pharmacies have not been studied, and prospective data are required. Given the clinical implications of a positive or negative screen for coeliac disease and the multitude of differential diagnoses in patients presenting with a range of symptoms, professional medical review remains a crucial factor in the diagnostic work-up of coeliac disease.

Where are general practitioners when disaster strikes?

GPs, inevitably involved in disasters, should be appropriately engaged in preparedness, response and recovery systems

In the past two decades it is estimated that Australians have experienced 1.5 million disaster exposures to natural disasters alone.1 General practitioners are a widely dispersed, inevitably involved medical resource who have the capacity to deal with both emergency need and long-term disaster-related health concerns. Despite the high likelihood of spontaneous involvement, formal systems of disaster response do not systematically include GPs.

An Australian Government review of the national health sector response to pandemic (H1N1) 2009 influenza suggested: “General practice had a larger role than had been considered in planning”.2 It commented that “structures . . . in place to liaise with, support and provide information to GPs were not well developed”; personal protective equipment provision to GPs was “a significant issue”; and planned administration of vaccinations through mass vaccination clinics was instead administered through GP surgeries.2

GPs are well positioned to help

As of the financial year 2013–14, Australia had 32 401 GPs,3 distributed through rural and urban communities. GPs are onsite with local knowledge when disaster affects their communities. External assistance may be delayed, and the local doctor may be integral in initial community response and feel compelled to act, yet have a poorly defined role.

GPs can identify vulnerable community members, and are situated in local medical infrastructure with medical resources. When other agencies withdraw in the months after disaster, GPs remain, providing continuity of care, which is likely to be important at this time of high distress and medical need (Box 1). Primary health care during extreme events can support preparedness, response and recovery, with the potential to improve health outcomes.4 The challenge lies in linking GPs with the existing medical assistance response.

Australian GPs’ experience of responding to disasters

Australian GPs have a strong sense of responsibility and moral obligation to their patients. They have spontaneously demonstrated willingness and capacity to respond in recent disasters, including the 2011 Australian floods, the 2009 pandemic influenza, and recent bushfires. In interviews with 60 Tasmanian GPs, 100% of GPs surveyed intended to contribute to patient care in the event of a pandemic, with expression of a strong sense that to do otherwise was unethical, although this was dependent on provision of appropriate personal protective equipment.5

What is lacking is consistent support for GPs, their families and their practices. Local GPs may be personally affected and immersed in the disaster, or experience repetitive exposure to their patients’ trauma. Changes in patient presentations, workload, income and working conditions create additional stress, particularly if compounded by personal loss or injury.6 GPs involved in ad hoc spontaneous response may experience uncertainty of their role or efficacy, reluctance to stand down, or may prefer no involvement. GPs interviewed after the 2011 Christchurch earthquake noted experiencing “emotional exhaustion” and physical fatigue; some were aware of the need for personal care at the time, and others only in retrospect.6

Principles of disaster management

The principles of disaster management follow the internationally accepted all-hazards, all-agencies approach through the phases of prevention, preparedness, response and recovery (PPRR).7 Despite the variation in GP roles due to practice locations and context, the GP role in disaster management is most evident across the time frames of PPRR. As shown in Box 1, GPs provide continuity of care across these periods, but with the least consistency in the response phase.

Preparedness

Our discussions with key GP groups and leaders in the field suggest that despite a rapid increase in the number of practices engaging in disaster planning over the past year, most GPs are currently underprepared for disasters (Box 2). Lack of preparedness increases vulnerability. To redress this global problem, the World Medical Association recommends disaster medicine training for medical students and postgraduates. This could include education on existing disaster response systems, mass casualty triage skills, psychological first aid and the epidemiology of disaster morbidity in the first instance.

Response

In the response phase, it is important that GPs are aware of the overarching plan following the incident management system that coordinates multiple disciplines (including fire, police, ambulance and health) to respond to all types of emergencies, from natural disasters to terrorism. With this in mind, roles for GPs have previously included accepting patients from a neighbouring affected practice, assisting at other practices or with surges in hospital emergency department presentations and at GP after-hours services, or keeping patients out of hospitals through “hospital in the home” services. It may involve providing prescriptions and medical treatment in an evacuation centre, being included in medical teams such as St John Ambulance or identifying more vulnerable patients for evacuation assistance. Most importantly, GPs should maintain usual practice activities where possible. These response models are aligned with the range of GP skills and have clear operational requirements.

Recovery

GP involvement is imperative in the recovery phase, ensuring continuity of physical and psychosocial health care during the ensuing months to years. While most patients recover with minimal assistance, it is crucial that individuals in need of increased support are recognised, particularly those with pre-existing chronic disease. Some presentations may be related to particular hazards, eg, smoke inhalation after bushfire, but many others are risks regardless of the hazard. These include increased substance use, anxiety, depression, acute or post-traumatic stress disorder, chronic disease deterioration, and the emergence of new conditions, including hypertension, ischaemic heart disease and respiratory conditions.8 Children are particularly vulnerable, and changes in behaviour or school performance may indicate residual problems.

Support from general practice organisations (GPOs)

During the 2009 Victorian bushfires, Divisions of General Practice provided strong support to enable general practices affected by the fires to continue to offer health care, by providing human and material resources, skills training, advocacy and media liaison. During the 2013 New South Wales bushfires, there was strong GP linkage by the Nepean-Blue Mountains Medicare Local to existing systems through the Nepean Blue Mountains Local Health District and the state health emergency operations centre, as well as to GPOs at a state level. Lessons learnt need to be incorporated into systems planning.

The need for unified disaster planning is increasingly recognised at both individual GP and GPO levels. The General Practice Roundtable, with input from all the major GPOs, has diverse GP representation, providing an opportunity for broad input into disaster planning across PPRR. Important recent initiatives by GPOs include position statements for GPs,9 and ongoing development of disaster resources, promotion of general practice disaster planning, and the recent formation of a national Disaster Management Special Interest Group within the Royal Australian College of General Practitioners.

Where to from here?

Disasters are devastating events and by nature are unpredictable. While recognising and acknowledging the critical role of the formal emergency response agencies in the existing system of specialised health response and management, the strength of general practice lies in the provision of comprehensive continuity of care, and this lends itself to greatest involvement in the preparedness and recovery phases. There is a need for a clear definition of roles in the response stage. GPs as local medical providers in disaster-affected communities need to be systematically integrated into the existing stages of PPRR with clear responsibilities, lines of communication, and support from GPOs, avoiding duplication of other responders’ tasks. Valuing and using the expertise and resources that GPs can bring to disasters may improve long-term patient and community health outcomes.

1 Current defined roles for general practitioners in disasters

2 Potential roles for general practitioners and GP-related groups in disasters

Prevention and preparedness — before the disaster

  • national position on the role of GPs in disasters across PPRR;
  • clearly defined roles that integrate with other responding agencies;
  • GPO representation on national, state and local disaster management committees;
  • unified disaster planning across GPOs through the GPRT;
  • information for other agencies on GPs’ skills and roles through the GPRT and GPOs;
  • education and training in core aspects of disaster medicine for GPs and medical students;
  • involvement of local GPs in local disaster planning and exercises through ML or PHN;
  • general practice business continuity and disaster response practice planning;
  • assisting patient preparedness to reduce vulnerability;
  • GP personal and family preparedness; and
  • vaccination, infection control measures and surveillance in infectious events.

Response — during the disaster

  • representation in EOCs for communication and coordination with other responders (including ambulance, mental health, public health, etc);
  • unified disaster response from GPOs, including information, resources and phone support;
  • coordination through GP networks for workforce support for affected practices;
  • clearly defined integrated roles in existing systems for GPs involved in response, such as:
    • maintaining usual practice activities where possible to help surge capacity
    • expanding practice capacity to treat extra patients if needed
    • expanded use of practice infrastructure, medical resources and trained staff as appropriate
    • supporting existing medical teams such as St John Ambulance
    • assisting at the scene, evacuation centre or local clinic as appropriate;
  • assistance in identification of potentially vulnerable and at-risk individuals and families;
  • ongoing communication with and referral between other local primary care health providers;
  • patient education on hazard-related health matters, eg, asbestos, infectious outbreaks, etc;
  • preventive vaccination — tetanus (clean-up injuries); and
  • surveillance for future outbreaks and emerging community disease threats.

Recovery — after the disaster

  • inclusion in the review process to improve future PPRR;2
  • representation on recovery committees to improve interagency referral and communication;
  • ongoing support from GPOs for affected GPs and staff through regular contact and resources;
  • GPOs and ML or PHN support for those practices that are more affected;
  • management of deterioration of pre-existing physical and mental health conditions;
  • surveillance for new physical and psychological conditions to improve patient outcomes;
  • surveillance for emerging community disease threats; and
  • linkage and communication with community groups and allied health on recovery activities.

EOC = emergency operations centre. GPO = general practice organisations. GPRT = General Practice Roundtable. ML = Medicare Locals. PHN = Primary Health Networks. PPRR = prevention, preparedness, response and recovery.

Dorothy Helena Herbert AM, BSc, MB BS, DObstRCOG

Dorothy Herbert’s medical and aviation career is now a silhouette in the collective memory of the Australian pioneer spirit. She was a local hero for the Charleville community in South West Queensland. Within her family, she was both a role model and someone who took an active interest in the studies and careers of the emerging generations.

Dorothy was born on 24 September 1922 and attended Ascot State School and then Somerville House in Brisbane. After finishing school in 1939, she commenced a science degree at the University of Queensland.

In 1942, she joined the Women’s Auxiliary Air Force as a wireless operator based at General Douglas MacArthur’s headquarters in Brisbane. At the end of World War II, she returned to complete her degree, majoring in physiology and zoology. In 1947, she gained her private pilot’s licence flying a Tiger Moth and, in 1950, she became a foundation member of the Australian Women Pilots’ Association (AWPA).

In 1948, Dorothy worked as a biochemist at the Peel Island leprosarium. She then moved to Tasmania in 1949 and worked as a biochemist at Royal Hobart Hospital.

After a year in the United Kingdom, she returned to Brisbane to study medicine at the University of Queensland. After graduating in 1958, she spent 2 years as a resident medical officer at Brisbane General Hospital.

In 1961, she moved to Charleville to work as a locum for the Royal Flying Doctor Service (RFDS) for 3 months. She remained in Charleville in private practice until 1981.

In 1963, Dorothy bought her first aircraft — a 1957 single-engine Cessna, which she used to fly to emergencies of her own patients, medical conferences and remote properties. She was a member of a flying surgeon team and would stand in for the flying doctor as required. At a time when there were few women doctors and fewer women pilots, Dorothy made quite an impression flying to remote communities with her three corgis in tow.

In 1977, she cared for a premature baby who was successfully transferred from Charleville to the Mater Mothers’ Hospital in Brisbane via a pressurised government jet (http://www.youtube.com/watch?v=-CEZYWssxgc). This was one of the first times a premature baby had been retrieved back to a Brisbane hospital and survived.

In 1978, she was crushed under a glider in a freak weather accident, suffering a fractured spine and chest injuries. She was in a coma for 3 weeks, in intensive care for 5 weeks and returned to practice in a back brace after 5 months of sick leave.

In 1981, Dorothy left Charleville and semiretired to the Sunshine Coast (with her Major Mitchell cockatoo, Linda). She continued to work in general practice, specialising in acupuncture and aviation medicine. She fully retired in 1996, when she also flew her final flight. Her flying record at this time totalled 2200 hours.

She was awarded the Nancy Bird Walton Trophy for services to aviation in Australasia in 1972. In 1997, she was made an honorary life member of the Aviation Medicine Society of Australia and New Zealand for her contribution as a designated examiner for 35 years. She was made a Member of the Order of Australia in 1999 for her service to rural medicine through the RFDS and to aviation through the AWPA. She also received a Centenary Medal in 2001 for her distinguished service to the RFDS.

Dorothy died on 27 August 2014. Throughout her life, she was an inspiration to her family, many friends, medical colleagues and fellow pilots. We remember Dorothy as a pioneer and innovator with a wonderful sense of adventure, and as a good listener who was both perceptive and decisive.

Obesity management in general practice: does current practice match guideline recommendations?

Primary health care, generally the first point of contact for people seeking health services, has been identified as a good environment for implementing strategies for preventing and managing obesity.1 Clinical practice guidelines for managing overweight and obesity in adults, adolescents and children in Australia have been developed by the National Health and Medical Research Council (NHMRC), providing evidence-based recommendations that support a systematic approach to preventing overweight and obesity.2,3 The guidelines emphasise patient engagement in decision making, tailored recommendations, co-management and/or referral, and long-term follow-up with regular monitoring by a general practitioner. We examined the documentation of quantitative measures as recommended in the NHMRC guidelines by GPs in a metropolitan region of Melbourne, to assess whether GPs’ practice was consistent with these recommendations.

Methods

Study population

We performed a retrospective analysis of general practice patient data retrieved from the Melbourne East Monash General Practice Database (MAGNET). This database holds patient data collected from the computerised medical records of 78 participating general practice clinics in the inner-eastern region of Melbourne between 1 July 2011 and 31 December 2013. The data are collected by Inner East Melbourne Medicare Local, one of 61 organisations across Australia tasked with improving primary care service delivery.

Data collection

We examined recommendations 1 and 2 of the NHMRC guidelines, relating to the documentation of body mass index (BMI) and waist circumference. Data on “active” patients (those who had visited the same practice more than three times in the previous 2 years) aged over 18 years were extracted, along with other relevant demographic data such as the patient’s age, sex, quintile on the Index of Relative Socio-Economic Disadvantage,4 and clinical information related to diagnoses and prescribed medications. Ethics approval for the study was granted by the Monash University Human Research Ethics Committee.

Statistical analysis

Documentation of height, weight and waist circumference was examined across demographic and clinical groups. Patients with both a height measurement and weight measurement recorded in the previous 2 years were identified as having a documented BMI. Logistic regression by means of generalised estimating equations to account for clustering within practices (intracluster correlation, 0.25) was used to examine the associations between documentation of BMI and sociodemographic and clinical characteristics. Effect estimates were reported as odds ratios with associated 95% CIs, adjusted for sociodemographic and clinical characteristics. Analyses were conducted using SAS, version 9.4 (SAS Institute).

Results

A total of 270 426 active patients were included in the study (Box 1). Three-quarters of the patients (77.3%) were aged between 19 and 64 years, and the sociodemographic distribution of patients was strongly skewed (64.5% living in areas of least disadvantage). Hypertension was the most commonly recorded condition, followed by hyperlipidaemia, musculoskeletal problems and depression or anxiety.

Documentation of height, weight and waist circumference

Height was recorded for 99 704 patients (36.9%), while 69 807 patients (25.8%) were found to have a weight recorded in the previous 2 years. Consequently, 59 987 patients (22.2%) had a documented BMI, and 11 684 patients (4.3%) had a waist circumference measurement recorded (Box 2). Documentation varied across age groups, with older patients generally having better documentation.

Predictors of BMI documentation

Box 2 shows that patients aged over 75 years were more likely to have a BMI recorded, and women had lower levels of BMI documentation than men. Patients with three or more listed diagnoses were most likely to have their BMI recorded. Specific diagnoses of diabetes, hyperlipidaemia, hypertension and musculoskeletal problems were found to be associated with an increase in BMI documentation (Box 2). Lower levels of BMI documentation were associated with diagnoses for depression and anxiety, and stroke. The prescription of medications related to diabetes, depression and anxiety, and for blood pressure and cardiovascular disease, were found to be associated with increased BMI documentation.

Discussion

Documentation of BMI and waist circumference was found to be considerably lower than that observed in studies in other primary care settings, although legislative requirements in these systems and the age of the patients in some studies may account for the higher rates.58 The documentation rates we found in this study imply a continued need for programs of support to increase screening for obesity and documentation of related clinical information, in accordance with the recommendations in the NHMRC guidelines. Increasing screening for obesity in general practice has been found to be problematic for a number of reasons, including problems in identifying obesity in the patient, difficulty in approaching the discussion of obesity, a perceived lack of appropriate training, and clinical software restrictions.915 Factors have been identified that can contribute to improved support for implementation of guidelines, particularly those aimed at enhancing organisational capacity.16 For example, Inner East Melbourne Medicare Local has initiated support to general practices by assigning practice liaison officers to generate regular feedback reports for individual practices on data quality and population-level health indicators. This facilitates good data governance and standardised collection and recording throughout practices, and has resulted in improved data quality and completeness.17,18

Our study has some limitations. It was not possible to assess free-text components of the patient medical records for instances where height and weight had been entered in free-text form rather than in the specific height and weight fields, which may also have led to an underestimation of BMI reporting. Also, because patient identifiers were practice-specific, it was not possible to track patients across practices.

By examining routine general practice data, we found that further support is needed to improve levels of screening for obesity and overweight in Australian general practice. Continued research is required to assess how documentation of obesity-related clinical information changes over time as the NHMRC guidelines on managing overweight and obesity become embedded in clinical practice, and to examine barriers and enablers to increased obesity screening. To improve the quality of patient care, GPs should be supported to increase levels of obesity screening in accordance with the NHMRC guidelines.

1 Characteristics of the cohort of 270 426 patients on the Melbourne East Monash General Practice Database*

Characteristic

Patients


Characteristic

Patients


Age group


Number of diagnoses recorded


19–44 years

122 136 (45.2%)


0

136 858 (50.6%)

45–64 years

86 915 (32.1%)


1

60 079 (22.2%)

65–74 years

30 596 (11.3%)


2

32 574 (12.1%)

75 + years

30 779 (11.4%)


3 +

40 915 (15.1%)

Sex


Specific diagnoses recorded


Male

109 346 (40.4%)


Hypertension

46 928 (17.4%)

Female

160 695 (59.4%)


Hyperlipidaemia

36 089 (13.4%)

IRSD (quintiles)


Musculoskeletal problems

35 329 (13.1%)

1 (most disadvantaged)

4 842 (1.8%)


Depression and anxiety

32 635 (12.1%)

2

5 393 (2.0%)


Diabetes

14 789 (5.5%)

3

11 977 (4.4%)


Cardiovascular-related

14 538 (5.4%)

4

72 612 (26.9%)


Stroke

4 165 (1.5%)

5 (least disadvantaged)

174 487 (64.5%)


Kidney disease

3 177 (1.2%)


IRSD = Index of Relative Socio-Economic Disadvantage.
* Percentages may not sum to 100% because of missing data. † Includes acute coronary syndrome, myocardial infarction, chronic heart failure, heart failure, atrial fibrillation and chronic heart disease.


2 Frequency of recording for height, weight, body mass index (BMI) and waist circumference

Variable

BMI

Waist circumference

Adjusted odds ratio* (95% CI)
for BMI documentation


Total patients with records

59 987 (22.2%)

11 684 (4.3%)


Age group


19–44 years

18 498 (15.1%)*

2 114 (1.7%)

1 [Reference]

45–64 years

21 533 (24.8%)

4 782 (5.5%)

1.31 (1.25–1.38)

65–74 years

8 618 (28.2%)

2 348 (7.7%)

1.20 (1.13–1.27)

75 + years

11 338 (36.8%)

2 440 (7.9%)

1.60 (1.48–1.72)

Sex


Male

26 498 (24.2%)

6 163 (5.6%)

1 [Reference]

Female

33 471 (20.8%)

5 520 (3.4%)

0.86 (0.78–0.94)

Number of diagnoses recorded


0

20 583 (15.0%)

2 832 (2.1%)

1 [Reference]

1

13 497 (22.5%)

2 565 (4.3%)

1.25 (1.21–1.30)

2

9 622 (29.5%)

2 185 (6.7%)

1.45 (1.38–1.52)

3 +

16 285 (39.8%)

4 102 (10.0%)

1.69 (1.59–1.79)

Specific diagnoses recorded (“yes”)


Hypertension

17 886 (38.1%)

4 515 (9.0%)

1.18 (1.11–1.24)

Hyperlipidaemia

13 859 (38.4%)

3 238 (9.6%)

1.26 (1.20–1.33)

Musculoskeletal problems

12 606 (35.7%)

2 896 (8.2%)

1.07 (1.02–1.12)

Depression and anxiety

8 352 (25.6%)

1 845 (5.7%)

0.94 (0.90–0.98)

Diabetes

7 484 (50.6%)

2 520 (17.0%)

1.85 (1.70–1.99)

Cardiovascular-related

5 509 (37.9%)

1 268 (8.7%)

0.91 (0.85–0.97)

Stroke

1 513 (36.3%)

356 (8.6%)

0.87 (0.78–0.95)

Kidney disease

1 316 (41.4%)

295 (9.3%)

0.99 (0.90–1.08)

Medication (“yes”)


Blood pressure/cardiovascular

12 157 (34.7%)

2 800 (7.9%)

1.07 (1.02–1.12)

Depression and anxiety

9 183 (25.3%)

1 935 (5.3%)

1.07 (1.03–1.11)

Diabetes-related

3 390 (49.0%)

1 002 (14.5%)

1.24 (1.12–1.35)

Lipids

6 172 (36.1%)

1 549 (9.1%)

1.01 (0.96–1.06)

Anticoagulants

5 899 (36.5%)

1 362 (8.4%)

1.02 (0.95–1.08)


* Adjusted for Index of Relative Socio-Economic Disadvantage and all other variables in this Box. † Reference category is “no” for each diagnosis and each type of medication. ‡ Includes acute coronary syndrome, myocardial infarction, chronic heart failure, heart failure, atrial fibrillation and chronic heart disease.


Identified health concerns and changes in management resulting from the Healthy Kids Check in two Queensland practices

To the Editor: Thomas and colleagues, in their article on identification rates for health and developmental problems of preschoolers before and after Healthy Kids Check (HKC) services,1 make a valuable contribution to the literature on the outcomes of health assessments.

Their research showed that HKCs were more likely than routine general practitioner visits (in the first 4 years of life) to detect oral health, vision and behavioural problems (prevalence rates among 557 children of 1.8% v 0, 3.8% v 1.4% and 2.3% v 1.8%, respectively), suggesting that HKCs presented an opportunity for families to deal with previously unmet health needs. However, the numbers of height and weight problems and oral health problems reported in this study were surprisingly small. National prevalence rates of more than 20% for childhood overweight2 and 40% for untreated dental caries3 were not matched in this study, where the rates for height and weight problems and oral health problems were only 3.2% and 1.8%, respectively.

It is possible that the communities involved experienced exceptional health status (the socioeconomic status of clinic populations was not described) or that only healthy children attended HKCs — or it is perhaps more likely that these problems remained undetected. Such discrepancies in the rates are significant because HKCs were established, in part, to detect early lifestyle risk factors; an aim that cannot be realised if there is incomplete recording of these developmental indicators.

The findings of Thomas and colleagues suggest that HKCs are partially improving the early detection of lifestyle risk factors. However, a more comprehensive evaluation of HKC outcomes — incorporating the views of clinicians and parents with long-term follow-up of children across various health settings — is needed to determine the true impact.

Mapping the diagnosis of autism spectrum disorders in children aged under 7 years in Australia, 2010–2012

The early diagnosis of children with autism spectrum disorder (ASD) is a critical step in gaining access to early intervention, providing optimal opportunity for developmental benefits by taking advantage of early brain plasticity.1 The age at which intervention begins has been associated with improved outcomes, with younger children showing greater gains from intensive early intervention.2,3 Although research suggests ASD can be reliably diagnosed by the age of 24 months,4,5 a recent review found that, on average, diagnosis is delayed until 3 years, with the average age at diagnosis ranging from 38 to 120 months across 42 studies conducted across the United States, United Kingdom, Europe, Canada, India, Taiwan and Australia.6

Many factors have been found to influence the age at which ASD is diagnosed, including the characteristics of the child, the clinical presentation, sociodemographic characteristics, and parental concerns and behaviour.6 These factors may interact with characteristics of the local community, the health professional and health service to differentially influence the age at which children are identified and diagnosed with ASD in any local area.6

There are limited data on the age and frequency of ASD diagnoses across all states and territories in Australia which, given the ethnically diverse and geographically dispersed population, would provide an important national and international comparison.

In this study, we sought to establish the age at which children registered with the Helping Children with Autism Package (HCWAP) in Australia currently receive a diagnosis. We also investigated trends in diagnosis across states, regional and rural areas, and child characteristics. Diagnostic groups within the autism spectrum, as specified in the fourth edition of the Diagnostic and statistical manual of mental disorders (DSM-IV),7 as well as the combined ASD group (consistent with fifth edition of the DSM8) were examined, to facilitate comparisons over time.

Methods

Study population and measures

We used de-identified data on 15 074 children (12 183 boys [81%] and 2891 girls [19%]) who received support through the HCWAP between 1 July 2010 and 30 June 2012. Data were collected and managed by the former Australian Government Department of Families, Housing, Community Services and Indigenous Affairs (FaHCSIA; now the Department of Social Services). To be eligible for the HCWAP, children must be Australian residents, aged under 7 years and have a documented diagnosis of ASD consistent with DSM-IV criteria from a paediatrician or psychiatrist, or after a multidisciplinary team assessment (involving a psychologist and speech pathologist).

The database contained the following information: age at diagnosis (months), state and postcode of residence, diagnosis, sex, Aboriginal and Torres Strait Islander status and culturally and linguistically diverse (CALD) status. The postcode was used to match age at diagnosis to geographical and population data.

Ethics approval was received from the La Trobe University Faculty of Science, Technology and Engineering Human Ethics Committee.

Age at diagnosis

Children’s age at diagnosis was calculated by subtracting their date of birth from the month and year that their diagnosis was confirmed, and rounded to the closest month.

Accessibility/remoteness index of Australia

The Accessibility/remoteness index of Australia (ARIA), developed by the Australian Bureau of Statistics, is a measure of remoteness, aggregated into the following categories: major cities; inner regional; outer regional; remote; very remote and migratory.

Estimates

The numbers of children at each year of age under 7 years (obtained from Australian Bureau of Statistics estimates) were summed and averaged over the period of 30 June 2010 to 30 June 2012 to create population estimates aligned to the study period and age group.

The estimated incidence of ASD was conservatively calculated as 1% of the population of children aged 0–7 years, based on estimates presented in the research literature from Australia (1/119 or 0.84%,9 1/106 or 0.94%10) the UK (98/10 000 or 0.98%)11 and US (1/68 or 1.47%).12

Statistical analysis

We conducted non-parametric comparisons (Kruskal–Wallis and Mann–Whitney U-Tests) because age at diagnosis for the study population was not normally distributed, and sample size varied across groups. Bonferroni adjustments controlled for multiple comparisons, and a conservative α (P < 0.01) was adopted.

Results

Age at diagnosis

The average age at diagnosis of ASD between 1 July 2010 and 30 June 2012 in children aged under 7 years and registered with the HCWAP was 49 months. As shown in Box 1, children with autistic disorder were diagnosed 7 months earlier than children with pervasive developmental disorder — not otherwise specified (PDD-NOS) and 16 months earlier than children with Asperger’s disorder (AspD) (χ2 = 1614.67; df = 2; P < 0.001; ɳ² = 0.11). Less than 3% of children with ASD were diagnosed by 24 months (Box 2). A clear spike in the frequency distribution of age at diagnosis was evident at 71 months (Box 3), indicating the most frequently reported age at diagnosis of ASD (under 7 years) nationwide in the HCWAP database.

Mapping the average age at diagnosis of ASD in children registered with the HCWAP across Australia showed small but significant differences between states (χ2 = 146.69; df = 7; P < 0.001; ɳ² = 0.01). To reduce the number of post-hoc comparisons, states were grouped into logical clusters by ascending age at diagnosis. There were significant differences in age at diagnosis between these clusters of states, with children registered with the HCWAP in Western Australia and New South Wales diagnosed earlier than in other states (Box 4).

Frequency of autism spectrum disorder diagnoses

On the basis of HCWAP data, 0.74% of children aged under 7 years in Australia (72/10 000) were diagnosed with ASD between 2010 and 2012. Case ascertainment rates were calculated to determine if differences could be attributed to the number of children at an eligible age. Using 95% CIs, state-level differences were evident, with the highest ascertainment rate in Victoria and lowest in the Northern Territory (Box 4). Differences were also evident between states across diagnostic subgroups; using 95% CIs, a smaller proportion of children than expected with AspD were diagnosed in WA, Tasmania and the NT compared with other states (Appendix 1).

Age at diagnosis by remoteness

Significant differences in age at diagnosis were evident between major cities and regional areas (χ2 = 61.64; df = 4; P < 0.001; ɳ² = 0.004; Appendix 2). There was no statistically significant difference in age at diagnosis across major cities, remote and very remote areas, probably because of differences in sample size between these groups. However, ASD was diagnosed, on average, slightly earlier in remote areas, and 5 months later in very remote areas, compared with in major cities, although these differences were not significant.

Age at and frequency of diagnosis by child characteristics

Although girls registered with HCWAP were diagnosed, on average, 1 month earlier (48 months) than boys (49 months), this difference was not significant considering the conservative α adopted (U = 17 177 845; z = − 2.06; P = 0.04; r = 0.02). No difference was evident in the age at diagnosis of children of Aboriginal and Torres Strait Islander origin registered with HCWAP (U = 3 455 468.5; z = − 1.77; P = 0.08; r = 0.02), but children from a CALD background were diagnosed, on average, 5 months earlier (U = 9 444 467.5; z = − 10.36; P < 0.001; r = 0.08). On the basis of 95% CIs, a smaller than expected proportion of children of CALD and Aboriginal and Torres Strait Islander backgrounds with AspD were identified (Appendix 3).

Discussion

The average age at diagnosis of ASD in children aged under 7 years registered with HCWAP is 49 months, with the most frequently reported age being 71 months. Given that research suggests a reliable and accurate diagnosis is possible for many children with ASD at 24 months,4,5 this finding represents a possible average delay of 2 years (and common delays of up to 4 years).

The increase in frequency of ASD diagnoses at 6 years of age may be attributable to children’s ASD being identified when they enter school, aged about 5 years, and the associated delay for diagnostic assessments. The end of the eligibility period for funding through the HCWAP (at age 7) may also contribute to the increase in diagnoses at 6 years of age. Further, there may be a subgroup of children who are diagnosed later because of factors in their clinical presentation, such as comorbid conditions or the presentation being less severe.

Previous research reported an average age at diagnosis of 4 years in WA and 3 years in NSW in 1999 to 2000,13 with a decrease in age at diagnosis from 4 to 3 years in WA between 1983 and 2004.14 In comparison, we found an average age at diagnosis of 3 years and 10 months in WA and 3 years and 11 months in NSW. These differences may reflect differences in study methods; for example, Nassar et al used the year of entering the data registry as a proxy variable for age at diagnosis in 77% of cases, and the difference between studies may therefore be explained by the limited accuracy of this variable.14

The number of children currently diagnosed with ASD and registered with the HCWAP suggests that the incidence of ASD in Australia has increased substantially from previous estimates. In 1999–2000, the incidence of ASD in 0–4-year-olds was reported to be 5.1 per 10 000 in NSW and 8.0 per 10 000 in WA.14 The national prevalence of ASD in 0–5-year-olds was estimated to increase from 16.1 to 22.0 per 10 000 from 2003 to 2005.15 Our study indicates that more than three times this many children are currently diagnosed with ASD and registered with the HCWAP. While reasons for the observed increase in ASD diagnoses remain largely unknown, many possible contributing factors have been suggested, including changes to the diagnostic criteria, improved awareness and diagnostic sensitivity.16

Delays of 3 to 6 months in age at diagnosis were evident between states, which may be clinically meaningful if they translate into equivalent delays in access to early intervention and family support services. Local differences in age at diagnosis have also been reported in the UK,17 US18 and Canada;19 suggesting that characteristics of local health care systems play a role in determining diagnostic timing.

Case ascertainment rates indicate that a larger proportion of children with ASD were identified in Vic and less than half of the expected children with ASD were identified in WA, the ACT and NT. There are many possible reasons for these differences, including the uptake of HCWAP across states, diagnostic substitution, and/or a greater tendency to diagnose ASD after the age of 7 years.

Children were diagnosed earlier in major cities compared with regional Australia. This is consistent with international research and probably the result of reduced access to health services.17,20,21 The possible earlier diagnosis of children in remote areas compared with major cities may reflect longer waiting times for specialist services in highly populated areas.22

This is the first study to investigate trends in the diagnosis of ASD in Indigenous Australians, with results indicating no difference in age at diagnosis. A smaller proportion of children of Aboriginal and Torres Strait Islander origin than expected were diagnosed with AspD before age 7 years, suggesting that children of Aboriginal and Torres Strait Islander origin with a less severe clinical presentation may not currently be identified early.

Children from a CALD background received a diagnosis 5 months earlier than other children. Most studies investigating age at diagnosis in ethnic minority groups have reported either no association21,23 or that children from a minority background are diagnosed later.24,25 A smaller proportion of children from a CALD background were diagnosed with AspD, which may account for the overall earlier age at diagnosis in these children.

A few limitations should be noted. The exclusion of children aged 7 years and over (in accordance with HCWAP eligibility) may have resulted in an underestimation of the age at diagnosis of ASD in Australia. The dataset only included families who registered to receive funding through the HCWAP. Although this is the most complete dataset currently available in Australia, it is possible that some cases were missed as families either chose not to register or were unaware of the HCWAP. Also, we were not able to confirm the reliability of diagnoses.

Despite these limitations, this study provides an important examination of trends in the diagnosis of ASD and suggests there may be a substantial gap between the age at which a reliable and accurate diagnosis is possible and the average age at which ASD is diagnosed in Australia. Future research should examine this gap, and investigate barriers that delay the diagnosis of ASD to ensure that families and communities can benefit from best-practice approaches to early intervention.

1 Average age at diagnosis of autism spectrum disorders across diagnostic groups

Diagnostic group

No. (%) of children

Mean age in months (SD)*

Median age in
months (95% CI)


Autistic disorder

10 263 (68.1%)

46.5 (13.6)

45 (45–46)

Asperger’s disorder

2 164 (14.4%)

59.5 (10.6)

61 (60–62)

Pervasive developmental disorder —
not otherwise specified

2 626 (17.4%)

51.1 (13.5)

52 (51–53)

Autism spectrum disorder (combined group)§

15 074

49.2 (14.0)

49 (49–49)


* Mean age in months (SD) is reported for comparison with other studies. † Significantly different from autistic disorder (P < 0.001). ‡ Significantly different from Asperger’s disorder (P < 0.001). § Children with childhood disintegrative disorder and Rett’s disorder are included in the total sample but are not reported by diagnostic group because of the very low frequency of these disorders.

2 Frequency of diagnoses and proportion of children diagnosed with autism spectrum disorder by age group

Age group

No. of children diagnosed

Percentage (95% CI)


< 24 months

395

2.6% (2.4%–2.9%)

25–36 months

2905

19.3% (18.6%–19.9%)

37–48 months

4052

26.9% (26.2%–27.6%)

49–60 months

3914

26.0% (25.3%–26.7%)

61–72 months

3578

23.7% (23.1%–24.4%)

73–84 months

230

1.5% (1.3%–1.7%)

3 Frequency distribution of age at diagnosis of autism spectrum disorder in children younger than 7 years in Australia


PDD-NOS = pervasive developmental disorder – not otherwise specified.

4 Frequency of and age at autism spectrum disorder diagnoses as a proportion of state population estimates


No. of children diagnosed

Age at diagnosis (months)


Case ascertainment


Cluster*

State

Median (95% CI)

Range

Population (N)

Expected Incidence

Ascertainment (95% CI)


1

Western Australia

930

46 (45–47)

15–81

218 051

2 181

42.6% (40.3%–45.8%)


New South Wales

4 735

47 (46–47)

19–83

656 880

6 569

72.1% (70.0%–74.0%)

2§

Tasmania

335

49 (48–51)

22–83

44 561

446

75.1% (67.0%–83.0%)


Victoria

4 771

50 (49–50)

15–84

489 659

4 897

97.4% (94.3%–99.8%)


South Australia

1 076

50 (48–51)

17–81

136 348

1 363

78.9% (74.3%–83.7%)

3§

Australian Capital Territory

149

51 (47–55)

16–83

33 411

334

44.6% (37.8%–52.2%)


Queensland

2 980

52 (51–52)

16–83

425 968

4 260

70.0% (67.5%–72.5%)


Northern Territory

97

53 (50–58)

25–75

25 811

258

37.6% (30.5%–45.5%)


Total

15 074

49 (49–49)

15–84

2 030 690

20 307

74.2% (72.8%–75.2%)


* WA and NSW were combined for analysis as there was no statistically significant difference in the average age at diagnosis between states (P = 0.36). There were no statistically significant differences between Tas, Vic and SA (P = 0.94), or between ACT, QLD and NT (P = 0.84), with these states also grouped for analysis. † State population estimates of children aged under 7 years. ‡ Expected incidence is calculated as 1% of the population (N). § Significantly different from cluster 1 (P < 0.001). ¶ Significantly different from cluster 2 (P < 0.001).

An incidentaloma not to be missed

A frail 92-year-old woman presented with pelvic and femoral fragility fractures after a fall. She had synchronous gross abdominal distension which was diagnosed as ascites. Computed tomography was requested to exclude malignancy before performing paracentesis.

Formal imaging showed a large intraperitoneal structure. The 4-Hounsfield unit attenuation was consistent with simple fluid. However, identification of septations, together with rim enhancement, led to a revised diagnosis of a cystic mass. The lesion measured 24 cm × 28 cm × 33 cm and, at an estimated volume of 16 L, displaced most of the abdominal and pelvic viscera. Fortunately, this was recognised before paracentesis.

Gonorrhoea notifications and nucleic acid amplification testing in a very low-prevalence Australian female population

Passive surveillance has shown a rapid increase in the number of gonorrhoea (Neisseria gonorrhoeae) notifications in Victoria, Australia, over the past decade. About 17% of all notified cases are in women, and of cases in men, 71% are among men who have sex with men (MSM).1

Gonorrhoea notifications can occur from a positive culture or a nucleic acid amplification test (NAAT). NAATs are more sensitive than culture, particularly for urine sampling,2 which is the most common specimen type collected in Australia. However, NAATs for gonorrhoea are less specific than culture, and the specificity of NAAT varies by specimen type and testing platform, producing false-positive results that reduce the positive predictive value (PPV) when the prevalence of infection is low.3,4 The product information5 and United States sexually transmitted infection (STI) treatment guidelines warn against the use of NAAT in low-prevalence populations for this reason.6 In contrast, gonorrhoea culture has a specificity of 100%.7

A dual NAAT for the detection of chlamydia (Chlamydia trachomatis) and gonorrhoea infection was introduced in Australia in 2007, and is now substantially more commonly used than the single test for chlamydia detection.8,9 The Royal Australian College of General Practitioners screening guidelines recommend chlamydia screening for individuals aged 15–29 years, but only recommend gonorrhoea screening for individuals at higher risk.10 The prevalence of gonorrhoea is extremely low even among Australian women attending sexual health clinics (0.3%–0.4%).11 Conversely, gonorrhoea prevalence is higher in certain populations, such as the Indigenous population in remote areas (7.2%)12 and MSM (7.1%);13 these individuals are advised to undergo gonorrhoea testing every 3–6 months.

If NAAT is widely used among Australian women with low gonorrhoea prevalence, the low PPV of NAAT may cause substantial harm.3,14 We therefore aimed to evaluate the proportion of positive NAATs among women, and whether this changed over time. We also assessed possible changes in gonorrhoea prevalence by analysing women tested by culture alone in a sentinel sexual health clinic population.

Methods

We performed a retrospective analysis of data from three sources: Medicare reporting of dual NAAT detection and gonorrhoea notifications for Victoria, and gonorrhoea culture at the Melbourne Sexual Health Centre (MSHC), among women, from 1 January 2008 to 31 December 2013. This period was chosen to study the effect of the introduction of the dual NAAT in May 2007 in Australia.

The study received ethics approval from the Alfred Health Human Ethics Committee (no. 147/14).

Data sources

We reviewed Medicare Item Reports from Medicare Australia for chlamydia testing alone (Medicare Benefits Schedule [MBS] item 69316) and the dual NAAT (MBS items 69317 and 69319) for chlamydia and a second or third organism (which predominantly reflects the multiplexed assay for chlamydia and gonorrhoea) among women in Victoria during the study period.15

As gonorrhoea is a notifiable disease in Australia, the annual notified cases among women, stratified by test type (ie, NAAT alone, culture alone or NAAT and culture), were obtained from the Victorian Department of Health.

We also reviewed the electronic database records of all women attending the MSHC over the same period to determine if changes had occurred at the MSHC, which uses culture only for gonorrhoea detection. The MSHC is the largest public sexual health centre in Victoria. Patients’ demographic characteristics, sexual behavioural data and clinical diagnoses were collected and recorded in the electronic medical system at each clinic visit. All women who attended the MSHC during the study period were included in the analysis and the data were de-identified.

Women who presented to the MSHC with symptoms of an STI (eg, vaginal discharge), those at higher risk (eg, Indigenous people), those who had engaged in high-risk behaviour (eg, overseas contacts, injecting drug use, and contact with gonorrhoea) and sex workers were offered testing for gonorrhoea. Consenting individuals had endocervical swabs taken for culture by a clinician. All swabs were directly plated onto gonococci agar in the clinic room and immediately delivered to the onsite laboratory for culture. We also reviewed the records of women who were referred by GPs to the MSHC with a positive NAAT result of gonorrhoea who had not had treatment and had a swab taken for gonorrhoea culture at the MSHC.

Statistical analysis

Descriptive statistics and frequency distribution of the sample were calculated. The percentage of women who tested positive for gonorrhoea over the study period was calculated. A χ2 test for trend was used to evaluate the significance of gonorrhoea positivity in women over time. Data were analysed using SPSS, version 21.0 (SPSS Inc).

Results

There was a 2.3-fold increase in the use of dual NAATs for chlamydia and gonorrhoea among women in Victoria over the study period, from 47 134 tests in 2008 to 110 209 in 2013 (Box 1). The number of chlamydia tests alone increased 1.3-fold, from 56 916 tests in 2008 to 76 485 tests in 2013.

Notifications to the Victorian Department of Health of gonorrhoea cases identified by culture alone (excluding cases diagnosed at the MSHC) among women decreased slightly from 19 cases in 2008 to five cases in 2013. Gonorrhoea cases identified by culture alone and cases identified by NAAT and culture increased from 38 cases in 2008 to 86 cases in 2013. However, gonorrhoea cases identified by NAAT alone increased 3.5-fold, from 98 cases in 2008 to 343 cases in 2013 (Box 2). Of all NAATs performed in Victoria, the proportion of positive tests ranged between 0.2% and 0.3% and did not change over time (P for trend, 0.66) (Box 3).

Over the same period, 35 874 women were tested for gonorrhoea by culture alone at the MSHC, of whom 158 (0.4%) tested positive. Gonococcal culture positivity among all women at the MSHC did not change over time (P for trend, 0.70) (Box 3). Gonococcal culture positivity among sex workers was 3–4 times higher than among other heterosexual women, but the gonococcal culture positivity among sex workers did not change over time (P for trend, 0.34). During 2010–2013, 25 women were referred to the MSHC with a positive NAAT result for gonorrhoea and had not had any prior treatment, but only 10 of these women tested positive for gonorrhoea by culture alone at the MSHC, and nine of these presented with symptoms.

Discussion

Our study shows that most testing of gonorrhoea among women in Victoria is undertaken using NAAT detection, despite the very low population prevalence. Testing with dual NAAT rose 2.3-fold over the study period and was temporally associated with substantial increases in gonorrhoea notifications among women in Victoria. However, there was no observable increase in the proportion of women diagnosed with gonorrhoea by culture at the MSHC, or in the proportion of notifications per reported MBS item numbers for dual NAAT in Victoria. Taken collectively, these data suggest that the prevalence of gonorrhoea among women remains very low and stable in Victoria (0.2%–0.3%) and at the MSHC (0.4%–0.6%), and that the rise in notifications is likely due to false-positive results arising from the increased use of NAATs in a low-prevalence population,6 with potential for unnecessary treatment of patients and partners and consequent harm.

These findings confirm current guidelines that testing for gonorrhoea with NAAT should be used when there is a clinical indication or for women at increased risk of gonorrhoea.10 We recommend that women being screened for chlamydia who are not at increased risk of gonorrhoea should be tested for chlamydia alone, or the gonorrhoea result supressed in the laboratory.

Our study has several limitations. First, the nature of notification data may be incomplete or inaccurate. However, in Victoria, notifications are received from both clinicians and laboratories, with duplicates carefully removed. Second, a small proportion of laboratory testing for gonorrhoea is done in public hospitals that do not use the MBS, so we may have overestimated the prevalence, but a lower prevalence would only strengthen our conclusions. Third, the sample of women referred to the MSHC for treatment of gonorrhoea who were initially diagnosed by NAAT was small, which may limit the statistical power. However, if these were real cases of gonorrhoea, one would expect about 90% to test positive by endocervical culture regardless of bias, but only 40% of untreated infection was confirmed by culture, suggesting that the remainder (60%) were false positives.2,16 Finally, we do not know how many laboratories suppress gonorrhoea results from the dual NAAT. If a significant proportion do not supress gonorrhoea results when testing for chlamydia, the number of gonorrhoea notifications could have been overestimated, and up to 60% could be false positives based on our data.

Although endocervical culture is almost as sensitive as NAAT for that site,2 only 10/25 of our NAAT-positive samples had positive endocervical cultures for gonorrhoea, suggesting that most of the positive gonorrhoea NAATs (60%) are false positives. This finding is consistent with the product information and the screening recommendation from the US Preventive Services Task Force warning against routine screening for gonorrhoea with NAAT among individuals in a low-prevalence population (ie, < 1%).4,6

Previous studies have shown that the dual NAAT for chlamydia and gonorrhoea has high sensitivity and specificity, and does not require further confirmatory testing;17,18 however, this recommendation is only valid in high-prevalence populations. The Australian Public Health Laboratory Network guidelines recommend that cases identified by NAAT should be confirmed by supplementary testing in low-prevalence populations, or the PPV of the test should exceed 90%.19 A New Zealand study with low gonorrhoea prevalence (0.77%) showed that the PPV of NAATs in female urogenital specimens reached 80% if a secondary confirmatory assay was not used.20 Our lowest prevalence was about a third of this, so the PPV would be expected to be substantially lower.21

In the New Zealand study, when discordant results were evaluated by a clinical microbiologist, the PPV exceeded 90%.20 Supplementary confirmatory testing is advocated in Australia,19,22 European countries23 and the United Kingdom.24 The proportion of Australian laboratories that do this is unknown.

Over our study period, there was a substantial increase in the proportion of laboratories using the dual NAAT for chlamydia and gonorrhoea. The Royal College of Pathologists of Australasia Molecular Quality Assurance Programs Diagnostics Report found that about 53% of participating laboratories used dual NAAT in 2013 compared with 8% in 2007.8,9 This increase has been driven by the move to dual assays by the main manufacturers. The capacity to test for dual targets, with little or no difference in cost, may have contributed to this increase. If the gonorrhoea test is performed and is positive, the laboratory has a duty of care to report the positive gonorrhoea result. A recent study suggests that even when only chlamydia is ordered, most laboratories are reporting a positive gonorrhoea result.25 When this is done, the clinician needs to be aware of the possibility of a false positive, and a confirmatory test by culture should be performed. Ideally, laboratories should suppress any gonorrhoea result.

It is difficult to estimate the number of women, or low-risk heterosexual men, who receive a false-positive result from a gonorrhoea screening test. This number depends on the specificity of the assay used, and whether confirmatory testing is always carried out. The published specificity of the four most popular testing platforms varies from 98.8% to 99.9%.5,21,26,27 If 0.3% of NAATs ordered test positive, the PPV will be between 19% and 75% — a false-positive rate between 25% and 81%. If supplementary assays are always carried out, this will be substantially reduced. In a recent study in a New Zealand population with a prevalence of 0.77%, 22% (8/37) of NAAT-positive, culture-negative samples were evaluated by a clinical microbiologist and deemed to be false-positive results.20

Finding the balance between under- and overdiagnosis of gonorrhoea among women at low risk is a difficult clinical and public health question. Currently, we are likely testing too many low-risk women, who are presumably attending a GP for chlamydia screening. A false-positive diagnosis of an STI has important implications for relationships,6 and unnecessary treatment may be associated with side effects.28

In conclusion, testing for gonorrhoea using NAAT is currently being done in a very low-prevalence population in Victoria, contrary to the manufacturers’ and other guidelines, and likely resulting in a substantial number of false-positive results and unnecessary treatment. The current increase in notifications may be an artefact of more testing for gonorrhoea using automated multiplex NAAT. In Victoria, and Australia outside of high-prevalence populations (eg, Indigenous populations and MSM),12,29 testing should be minimised or done by culture unless the pretest probability is high (eg, symptoms of pelvic inflammatory disease, had a gonorrhoea contact, engaged in commercial sex, or had sex overseas). Positive gonococcal NAATs among low-risk women should then be confirmed by culture or regarded as doubtful. This will minimise the number of false-positive notifications, and reduce potential harm to individuals.

1 NAATs for chlamydia only and chlamydia with another infection ordered through Medicare Australia among women in Victoria, 2008–2013


NAAT = nucleic acid amplification test. * Other infection is largely gonorrhoea.

2 Gonorrhoea notifications among women in Victoria, 2008–2013,* by year and types of laboratory tests


NAAT = nucleic acid amplification test. * Cases tested by culture at Melbourne Sexual Health Centre are excluded.

3 Number of women tested and positivity for gonorrhoea by culture at MSHC, and notifications by NAAT,* 2008–2013


MSHC = Melbourne Sexual Health Centre. NAAT = nucleic acid amplification test. * As a proportion of reports of item numbers 69317 and 69319. † P for trend, 0.70. ‡ P for trend, 0.66.

Compliance with Australian splenectomy guidelines in patients undergoing post-traumatic splenectomy at a tertiary centre

To the Editor: The lack of a functioning spleen is associated with a lifelong risk of overwhelming post-splenectomy infection (OPSI). Historically, mortality rates associated with OPSI have been in excess of 50%.13 OPSI is a preventable illness through vaccination, education, prophylactic antibiotic use and other measures, as summarised in the national Australasian Society for Infectious Diseases (ASID)-endorsed guidelines for prevention of sepsis in asplenic and hyposplenic patients.4

We performed a retrospective cohort study among adult patients who had undergone post-traumatic splenectomy at a tertiary referral centre in Sydney, to assess compliance by health professionals and identify factors that could improve uptake of ASID recommendations. We reviewed hospital medical records and discharge summaries to assess compliance with recommendations before and after the publication of the ASID guidelines.

The Research and Ethics Office of the South Western Sydney Local Health District granted site-specific approval on the basis of low and negligible risk.

A total of 79 patients were identified, 37 in the preguideline group (January 2003 – June 2008) and 42 in the postguideline group (July 2008 – December 2013). Our findings are summarised in the Box.

Overall, compliance with the recommendations was poor, except for the rate of first vaccination against Streptococcus pneumoniae, Neisseria meningitidis and Haemophilus influenzae type b (Box). At discharge, most patients were advised to follow up with their general practitioner; however, GPs were neither provided with the information on the type of vaccination given in the hospital, nor with the appropriate recommendation on follow-up vaccinations.

Our study highlights gaps in best practice and areas for quality improvement and education. Lack of awareness of the guidelines among the surgical teams was found to be a notable factor in the poor compliance with the 2008 ASID guidelines. Asplenia and hyposplenia care should involve a multidisciplinary approach with involvement of surgeons, infectious diseases physicians, haematologists, pharmacists and clinical nurse coordinators.

We recommend the ASID 2008 guidelines be updated, as there have been changes in the vaccination recommendations since publication. A national spleen registry could be considered, for sending vaccination reminders and providing long-term follow-up and ongoing support. This would also allow prospective data collection for assessing compliance and measuring rates of OPSI.

Compliance with recommendations in the ASID management guidelines for prevention of sepsis in patients with asplenia or hyposplenia,4 before and after guideline publication in 2008


Number of patients*


Areas of compliance

Preguideline (n = 37)

Postguideline (n = 42)

P


Patient education

8

22

0.08

First vaccination after surgery


Pneumococcal

34

39

0.87

Meningococcal

34

39

0.87

Haemophilus influenzae type b

34

38

0.82

Influenza

2

5

0.31

Day of first vaccination, median (range)

7 (− 7 to 44)

7 (1 to 45)

0.47

Prophylactic antibiotic use

11

17

0.32

Reserve antibiotic supply

1

5

0.20

Risk-reduction measures


Patient alerts (eg, bracelet)

1

9

0.04

Splenic salvage

0

0

Risk of sepsis included in histology report

0/36

0/42

Risk of sepsis reported if Howell-Jolly body seen in peripheral blood smear

0/15

0/19

Meningococcal vaccination for travellers to high-risk areas

0

0

Informing the patient of malaria risks

1

3

0.61

Informing the patient of Babesia risks

0

1

> 0.99

Patient warned of risks associated with animal bites

1

1

Spleen registry referral

0

3

0.24


ASID = Australasian Society for Infectious Diseases. * Unless otherwise indicated. † Optimal timing uncertain; ideally 14 days after emergency splenectomy, or earlier if there is a risk of loss of the patient to follow-up. ‡ Amoxicillin 250 mg daily was the most commonly prescribed prophylactic antibiotic, with a variable duration of recommendation (1 year to lifelong).