×

Professional and psychosocial factors affecting the intention to retire of Australian medical practitioners

The known The number of doctors who work beyond the age of 65 is growing. Studies of retirement intention have focused on single factors, such as health and income, and have generally been limited to single specialties. 

The new 38% of doctors aged 55 or more were unsure about retiring or did not intend to retire. Both professional and broader psychosocial factors (including financial resources, work centrality, emotional resources, anxiety about ageing) influenced the intention to retire. 

The implications Education programs facilitating retirement planning are needed for late career doctors, including advice on financial planning and developing non-professional interests. 

In the absence of a mandatory retirement age in Australia, many doctors work beyond the age of 65.1 In 2014, 9.9% of the medical workforce were 65 or older, and the total number of doctors over 65 years of age has increased by 80% since 2004,1,2 consistent with an ageing society.

Older practitioners who prolong their careers are important for providing medical care as well as for teaching and mentoring younger colleagues.3 These benefits, however, must be weighed against a complex array of factors associated with ageing, including physical and cognitive changes that may hinder optimal practice.4

The challenges associated with retiring from a career in medicine were highlighted by the finding that only 61% of older Australian psychiatrists had commenced planning their retirement.5 Anticipated reasons for retirement reported in single specialty studies include deteriorating health and family or personal reasons;5 self-perception of one’s skill levels, rather than age;6 and financial aspects and the inability to find a suitable replacement.7

Whether the broader retirement literature is directly applicable to the medical profession is unclear.8 The largest reported effect sizes for factors favouring retirement planning have been for work involvement and job satisfaction. We similarly suggest that being a doctor is so closely linked with self-identity9 as to make retirement threatening. If so, it would be expected that work centrality — the extent to which work is of primary personal importance compared with other life roles; that is, an indicator of a person’s affective commitment to work10 — would be higher in doctors who are less inclined to retire. Further support for this hypothesis would be that doctors are less likely to retire if work is perceived as a calling (the work itself is fulfilling and perceived as contributing to the greater good), rather than a career (achievement is defined by advancement and promotion) or job (defined purely by financial success).11

Other psychological factors that may affect retirement planning include positive emotions, such as adaptability and optimism. Anxiety about ageing — the tendency to fear anticipated threats and losses associated with advancing age12 — may also be involved.

The factors that are weighed when considering retirement have not been explored in specific subgroups of doctors, such as international medical graduates (IMGs). Working in a rural or remote area may hinder retirement planning, given the lower replacement rates in such locations.

The aim of our survey was to determine the professional and personal factors associated with the intention to retire (ITR) among older medical practitioners. Significant correlations between retirement intention and subsequent retirement behaviour have been reported in the general literature on retirement.13

Methods

We undertook a cross-sectional self-report survey of doctors aged 55 or more, using a commercial database rented from the Australasian Medical Publishing Company (AMPCo). A pilot study (among doctors in the Australian Capital Territory and South Australia) verified the questionnaire items and data collection methodology. The main study was conducted in October 2015: 6000 doctors received an email from AMPCo (independently of the study authors) with an embedded link to the survey, twice within 2 weeks. Participants were offered the chance to win one of ten $50 gift vouchers. Data from the pilot study were not included in the data analysed in this article.

Questionnaire

The questionnaire (see online Appendix) included questions about demographic and professional details, such as country in which the primary medical degree was obtained, specialty, geographic location, and hours and type of practice. Representative items from the social resources and financial resources subscales of the Retirement Resources Inventory (RRI)14 were included. Health was measured on a 5-point self-rating scale of overall physical health, and also with the Self-Administered Comorbidity Questionnaire (SACQ),15 which asked whether the participant experienced, received treatment for, or was limited by any of 12 common medical problems.

Psychological variables were assessed with the K10, a validated screening instrument for measuring psychological distress.16 Items from the emotional resources subscale of the RRI that measure positive emotion, mastery, self-esteem, and self-perception of cognitive functioning14 were applied. The Anxiety about Ageing Scale17 was administered, including items reflecting each of four previously validated dimensions: fear of old people, psychological worries, concerns about physical appearance, and fear of losses.

A doctor’s self-identification with medical practice was assessed by two methods. The Work Centrality Questionnaire measures the primacy of work in a person’s life.18 Participants were also asked to state (on a 7-point Likert scale, ranging from “strongly agree” to “strongly disagree”) whether they viewed medical practice as a “job,” a “career”, or a “calling”.

Participants were asked to indicate whether they intended to retire (options: “I do not intend to retire”; “I do not know whether I will retire”; “I do intend to retire”). Those who intended to retire were asked to indicate a retirement age, and to rate the salience of factors that would determine its timing (on a Likert scale). Similarly, those who did not plan to retire or were unsure were asked about factors determining their decision. These factors were derived from previous research on older doctors, and from the general literature on retirement.19,20

Statistical analyses

As there was significant skew in the distribution of continuous variables (determined in one-sample Kolmogorov–Smirnov tests), descriptive statistics are reported as medians and interquartile ranges (IQRs). For categorical and dichotomous variables, numbers and percentages are reported. Skewed continuous data for dichotomous groupings were compared in Mann–Whitney U tests; χ2 tests and linear-by-linear association tests for ordinal variables were applied in univariate analyses of variables with respect to age, sex and ITR. Please note when interpreting results that it is possible for groups to have different rank sums that are statistically significant in non-parametric tests, but to also have identical or nearly identical medians.

Potential predictors with a significant relationship with ITR (univariate analysis, P < 0.2) were included in logistic regression models, with dichotomised ITR as the dependent variable. The first model included all participants, the second and third models assessed each age group separately (55–64 years, 65 years and over), and the fourth and fifth models each sex. A sixth model included medical specialties for which there were at least 50 respondents.

A two-block variable entry procedure was applied; block 1 included demographic factors (age, sex, location of practice, country of qualification), with forced entry. In block 2, forward conditional likelihood ratio entry was used for survey scores.

All analyses were conducted in SPSS 22 (IBM). P < 0.05 was deemed statistically significant.

Ethics approval

The study was approved by the Human Research Ethics Advisory Panel of the University of New South Wales (reference, 2014-7-68).

Results

Of the 6000 doctors invited to participate, 1049 responded; one participant was excluded because they had recently retired, leaving a final cohort of 1048 (response rate, 17.5%). The proportion of respondents by state and territory was similar to the proportion of registrants aged 55 and older located in the respective jurisdictions:1 37.1% from New South Wales, 26.2% from Victoria, 20.7% from Queensland, 11.6% from Western Australia, 2.6% from Tasmania, and 1.2% from Northern Territory; five respondents (0.5%) were from the ACT and SA.

The demographic characteristics of the participants are summarised in Box 1. The median age was 65 years (IQR, 59–69 years; range, 55–89 years). The medical specialties with at least 50 respondents were general practice (439 doctors, 41.9% of sample), internal medicine specialists (122, 11.6%), anaesthesia (72, 6.9%), surgery (71, 6.8%) and psychiatry (56, 5.3%). Compared with national data, the sample was similar with regard to the proportion of female doctors aged 55 or more and general practitioners aged 55 or more, but there were fewer IMGs.1

Six hundred and fifty respondents (62.0%) intended to retire; the others (combined as one group in further analyses) either had no intention of retiring (11.4%) or were unsure (26.6%). There were no differences in ITR according to age or sex (Box 2). There were, however, statistically significant differences between the five specialties with more than 50 respondents (P = 0.001): anaesthetists were the most likely to affirm an ITR (76%), followed by surgeons (69%), internal medicine specialists (67%), GPs (56%), and psychiatrists (50%).

Of the doctors who intended to retire, 33% did not nominate a specific retirement age. The anticipated retirement age for those who did increased progressively with age: for those aged 55–64 years, the median anticipated retirement age was 65 years (IQR, 65–68 years); for those aged 65–74, it was 71 years (IQR, 70–75 years); for those aged 75–84, it was 80 years (IQR, 78–83 years); and for those aged 85 or more, it was 86 years (IQR, 86–88 years). The median anticipated retirement age was 70 years (IQR, 65–73 years) for men and 68 years (IQR, 65–71 years) for women.

There were significant differences by age in the anticipated reasons for retirement. Those aged 55–64 years were more likely than older doctors to nominate achieving financial security, being able to access superannuation, a desire for more personal or leisure time, and a partner or spouse retiring. Further, the younger group was more likely to plan transition to retirement by reducing working hours. Women were more likely to nominate a partner retiring as an anticipated reason for retirement (Box 2).

Among doctors who did not intend to retire or were unsure about retirement, there were significant differences by age in the reasons for continuing to work. Doctors aged 65 or older were more likely to indicate that continuing to work was motivated by the wishes of their partner or family, the cognitive stimulation afforded by work, their maintaining a sense of purpose, or their good physical health. Men were more likely to nominate a partner’s or family’s wishes as a reason for continuing to work (Box 3).

Factors associated with intention to retire

For the entire sample of respondents, the odds of ITR were lower for IMGs, and for those with a higher work centrality score and greater emotional resources. The odds of ITR were higher for doctors with better financial resources and greater anxiety about ageing (Box 4, model 1). It is notable that factors such as location of practice, social resources, and objective health were not significant factors.

For doctors aged 55–64 years, the odds of ITR were higher for those with better financial and social resources, and lower for IMGs and for those with greater work centrality. For doctors aged 65 or more, the odds of ITR were higher for doctors with better financial resources and greater anxiety about ageing, and lower for those with greater work centrality and greater emotional resources (Box 4, models 2 and 3).

The factors significant for ITR in male doctors were the same as for the whole sample. For women, the odds of ITR were higher for doctors with better financial resources, and lower for those with greater work centrality score and greater emotional resources (Box 4, models 4 and 5).

When regression analysis was restricted to doctors from the five specialties with more than 50 respondents (Box 4, model 6), the odds of ITR were lower for doctors who were IMGs, psychiatrists, GPs, and for those who reported greater work centrality and greater emotional resources. The odds of ITR were also higher for doctors with better financial resources and greater anxiety about ageing (Box 4, model 6).

Discussion

This is the first study of the broader professional and psychosocial factors associated with retirement intention among doctors in different specialties. Planning retirement has benefits for the continuity of patient care and service provision, and is likely to assist the medical practitioner’s adjustment to retirement.21

Our sample of doctors were less likely to retire than people aged 45 and over in the general population: male doctors planned to retire 4 years later (at age 69.7 v 65.7 years) and female doctors 3.6 years later (age 68.1 v 64.5 years) than people in the general community, while fewer doctors reported an ITR (62% v 79%).19 Only two-thirds of doctors who intended to retire nominated a retirement age, and the anticipated age increased progressively with each successive 10-year age bracket.

There were a number of differences between age groups in the reasons for either anticipating retirement or continuing to work. The responses of doctors aged 65 or more who intended to continue to work suggested that this group was financially independent, enjoyed good physical health, and valued a sense of purpose in life more than leisure time.

Women were more likely than men to accompany a spouse into retirement, and a greater proportion of women nominated responsibilities as a carer as a reason for retiring (although the difference was not statistically significant), consistent with data for the general community.19,22 Men were more likely to continue working because of the wishes of a partner or family.

Two factors, work centrality and financial resources, consistently predicted ITR in all regression models. It is unclear whether the association of greater work centrality with reduced odds of retiring is related to the self-identity of people attracted to medicine and, if so, whether this effect is limited to the current sample or generally applies to doctors over 55. Alternatively, the nature of medical practice may lead to work becoming the pre-eminent feature of one’s life. That greater emotional resources and greater anxiety about ageing were also associated with reduced odds of retirement is another indication of the importance of personal characteristics in determining retirement intentions.

Financial security was the other consistent factor when considering retirement, in keeping with data for the general community.19 Retirement intentions were informed by the views of a broader community, not just the practitioner themselves; for one-third of doctors the wishes of partners and family were a key consideration in the decision to keep working.

The desire of IMGs to delay retirement is unsurprising, given their later entry into the medical workforce in Australia. Interpretation of ITR in different specialties was limited by the fact that only five provided sufficient responses for statistical analysis. The odds of GPs and psychiatrists intending to retire were the lowest of the five specialties; this may reflect the respective salience for these two groups of financial rewards and physical demands in decision making about retiring. Although being a surgeon or anaesthetist were not significant factors in regression model 6, the proportions of respondents in these two specialties who planned to retire was greater than in the other three; this was perhaps related to the systemic approaches to ageing and retirement undertaken by their respective colleges.23

There are limitations to our study. These include the modest response rate to our survey of 17.5%. Although comparable with similar surveys,24 the low rate limits our ability to generalise our findings about subgroups of doctors. In addition, there are potential sources of bias, such as sample skewing toward doctors who were already contemplating retirement, the lack of demographic data on respondents apart from age, sex, and the proportion of practitioners in a specialty compared with their overall state/territory proportion, the under-representation of IMGs, and the electronic format of the survey. Although our sample was not fully national, its demographic data were comparable with national data on the proportions of women, GPs, and the states of practice. Finally, the cross-sectional nature of the survey did not allow retirement intention to be analysed as a dynamic process, although significant correlations between retirement intention and behaviour over 5 years have been reported.13

Our findings are relevant to developing education and support programs for assisting late career medical practitioners to transition to retirement. Retirement is potentially an emotional question for many doctors; learning about their colleagues’ experiences may be helpful. Such programs should include general advice (including about financial and emotional resources), recognise work as part of self-identity, and target specific groups, such as IMGs and GPs. Programs should be provided within continuing professional development programs, and receive funding from the medical colleges.

Box 1 –
Demographic characteristics of the 1048 respondents to the survey on intention to retire

Total

55–64 years old

65 years old or more

P

Men

Women

P


Number of doctors

1048

520 (49.6%)

528 (50.4%)

807 (77.0%)

241 (23.0%)

Married (de jure/de facto)

921 (87.9%)

458 (88.1%)

463 (87.7%)

0.85

745 (92.3%)

176 (73.0%)

< 0.001

Work less than 40 h/week

558 (53.2%)

206 (39.6%)

352 (66.7%)

< 0.001

403 (49.9%)

155 (64.3%)

< 0.001

International medical graduate

205 (19.6%)

75 (14.4%)

130 (24.6%)

< 0.001

157 (19.5%)

48 (19.9%)

0.87

Live in a capital city

646 (61.6%)

317 (61.0%)

329 (62.3%)

0.77

491 (60.8%)

155 (64.3%)

0.33

Solo practitioner*

197 (19.9%)

74 (14.8%)

123 (25.0%)

< 0.001

154 (20.1%)

43 (18.9%)

0.69

Self-rated health

Excellent/very good

718 (68.5%)

355 (68.3%)

363 (68.8%)

0.87

546 (67.7%)

172 (71.4%)

0.28

Poor to good

330 (31.5%)

165 (31.7%)

165 (31.3%)

261 (32.3%)

69 (28.6%)

SACQ score, median (IQR)

2.0 (0.0–4.0)

2.0 (0.0–3.0)

2.0 (1.0–4.0)

< 0.001

2.0 (0.0–4.0)

2.0 (0.0–3.0)

0.031

K10 score, median (IQR)

12.0 (11.0–15.0)

13.0 (11.0–15.0)

12.0 (11.0–14.0)

< 0.001

12.0 (11.0–15.0)

12.0 (11.0–15.0)

0.68

Perception of work

Job

59 (5.6%)

37 (7.1%)

22 (4.2%)

0.11

49 (6.1%)

10 (4.1%)

0.013

Career

423 (40.4%)

203 (39.0%)

220 (41.7%)

342 (42.4%)

81 (33.6%)

Calling

566 (54.0%)

280 (53.8%)

286 (54.2%)

416 (51.5%)

150 (62.2%)

Work centrality score, median (IQR)

23.0 (21.0–25.0)

23.0 (20.0–25.0)

23.0 (21.0–25.0)

0.001

23.0 (21.0–25.0)

23.0 (20.0–25.0)

0.16

Anxiety about ageing score, median (IQR)

29.0 (26.0–32.0)

29.0 (25.0–32.0)

29.0 (26.0–32.0)

0.24

29.0 (26.0–32.0)

30.0 (25.0–32.0)

0.48


SACQ = Self-Administered Comorbidity Questionnaire. * Excludes 56 practitioners not engaged in patient care.

Box 2 –
Factors determining the timing of retirement among 650 doctors who intend to retire

Total

55–64 years old

65 years old or more

P

Men

Women

P


Intend to retire (proportion of 1048 respondents)

650 (62.0%)

335 (64.4%)

315 (59.7%)

0.11

497 (61.6%)

153 (63.5%)

0.59

Intend to transition to retirement

540 (83.1%)

296 (88.4%)

244 (77.5%)

< 0.001

416 (83.7%)

124 (81.0%)

0.44

Factors affecting timing of retirement*

Financial security

371 (57.1%)

220 (65.7%)

151 (47.9%)

< 0.001

294 (59.2%)

77 (50.3%)

0.054

Physical illness/disability

364 (56.0%)

190 (56.7%)

174 (55.2%)

0.70

275 (55.3%)

89 (58.2%)

0.54

Cognitive impairment

354 (54.5%)

177 (52.8%)

177 (56.2%)

0.39

272 (54.7%)

82 (53.6%)

0.81

Work-related burnout

255 (39.2%)

141 (42.1%)

114 (36.2%)

0.12

192 (38.6%)

63 (41.2%)

0.57

Act as carer

178 (27.4%)

92 (27.5%)

86 (27.3%)

0.96

127 (25.6%)

51 (33.3%)

0.06

Desire more personal/leisure time

438 (67.4%)

243 (72.5%)

195 (61.9%)

0.004

336 (67.6%)

102 (66.7%)

0.83

Ability to access superannuation

225 (34.6%)

134 (40.0%)

91 (28.9%)

0.003

178 (35.8%)

47 (30.7%)

0.25

Spouse/partner retiring

139 (21.4%)

94 (28.1%)

45 (14.3%)

< 0.001

97 (19.5%)

42 (27.5%)

0.036


* Responses for each factor were dichotomised into “strongly agree”/“agree” v other responses.

Box 3 –
Factors determining decision to continue working for 398 doctors not intending to, or unsure about, retirement

Total

55–64 years old

65 years old or more

P

Men

Women

P


Do not intend to retire, or unsure (proportion of entire sample)

398 (38.0%)

185 (35.6%)

213 (40.3%)

0.11

310 (38.4%)

88 (36.5%)

0.59

Factors affecting timing of retirement*

Relationship with patients

232 (58.3%)

101 (54.6%)

131 (61.5%)

0.16

179 (57.7%)

53 (60.2%)

0.68

Cognitive stimulation

349 (87.7%)

154 (83.2%)

195 (91.5%)

0.012

273 (88.1%)

76 (86.4%)

0.67

Finances

229 (57.5%)

115 (62.2%)

114 (53.5%)

0.08

174 (56.1%)

55 (62.5%)

0.29

Fulfilling professional relationships

254 (63.8%)

114 (61.6%)

140 (65.7%)

0.40

196 (63.2%)

58 (65.9%)

0.64

Good physical health

312 (78.4%)

134 (72.4%)

178 (83.6%)

0.007

239 (77.1%)

73 (83.0%)

0.24

Family’s/partner’s wishes

136 (34.2%)

49 (26.5%)

87 (40.8%)

0.003

118 (38.1%)

18 (20.5%)

0.002

Sense of purpose/goals

322 (80.9%)

140 (75.7%)

182 (85.4%)

0.013

248 (80.0%)

74 (84.1%)

0.39


*Responses for each factor were dichotomised into “strongly agree”/“agree” v other responses.

Box 4 –
Logistic regression analyses of factors significantly influencing the intention to retire by 1048 medical practitioners in Australia

Intend to retire

No intention/don’t know

Adjusted odds ratio (95% CI)

P


Model 1: Whole sampleP < 0.001; variance accounted, 9.5%

n = 650

n = 398

International medical graduate

99 (15.2%)

106 (26.6%)

0.61 (0.44–0.85)

0.004

RRI score: cognitive, emotional and motivational resources, median (IQR)

47 (44–50)

48 (45–51)

0.96 (0.93–0.98)

0.001

RRI score: financial resources, median (IQR)

7 (6–8)

7 (6–8)

1.31 (1.18–1.44)

< 0.001

Work centrality, median (IQR)

22 (20–24)

24 (22–26)

0.89 (0.85–0.92)

< 0.001

Anxiety about ageing, median (IQR)

30 (26–32)

28 (25–32)

1.05 (1.02–1.09)

< 0.001

Model 2: 55–64 years oldP < 0.001; variance accounted, 10.1%

n = 335

n = 185

International medical graduate

33 (9.9%)

42 (22.7%)

0.47 (0.28–0.80)

0.005

RRI score: social, median (IQR)

15 (13–17)

15 (12–17)

1.07 (1.01–1.14)

0.017

RRI score: financial resources, median (IQR)

7 (6–8)

7 (6–8)

1.38 (1.18–1.60)

< 0.001

Work centrality, median (IQR)

22 (20–24)

23 (21–25)

0.89 (0.83–0.94)

< 0.001

Model 3: 65 years or olderP < 0.001; variance accounted, 10.2%

n = 315

n = 213

RRI score: cognitive, emotional and motivational resources, median (IQR)

46 (43–49)

48 (45–50)

0.94 (0.91–0.98)

0.001

RRI score: financial resources, median (IQR)

7 (6–8)

7 (6–8)

1.22 (1.06–1.39)

0.004

Work centrality, median (IQR)

23 (20–25)

24 (22–26)

0.87 (0.82–0.93)

< 0.001

Anxiety about ageing, median (IQR)

30 (27–32)

29 (25–32)

1.06 (1.02–1.11)

0.004

Model 4: MenP < 0.001; variance accounted, 8.8%

n = 497

n = 310

International medical graduate

75 (15.1%)

82 (26.5%)

0.59 (0.41–0.86)

0.006

RRI score: cognitive, emotional and motivational resources, median (IQR)

47 (44–50)

48 (45–50)

0.97 (0.94–0.995)

0.021

RRI score: financial resources, median (IQR)

7 (6–8)

7 (6–8)

1.26 (1.13–1.41)

< 0.001

Work centrality, median (IQR)

22 (20–24)

24 (22–26)

0.89 (0.85–0.94)

< 0.001

Anxiety about ageing, median (IQR)

30 (26–32)

28 (25–31)

1.06 (1.02–1.10)

0.001

Model 5: WomenP < 0.001; variance accounted, 13.8%

n = 153

n = 88

RRI score: cognitive, emotional and motivational resources, median (IQR)

46 (44–49)

48 (45–51)

0.92 (0.86–0.98)

0.014

RRI score: financial resources, median (IQR)

7 (6–8)

6 (5–8)

1.48 (1.18–1.85)

0.001

Work centrality, median (IQR)

22 (20–24)

24 (21–26)

0.87 (0.79–0.96)

0.004

Model 6: Medical specialties with more than 50 responsesP < 0.001; variance accounted, 12.9%

n = 462

n = 298

International medical graduate

74 (16.0%)

84 (28.2%)

0.67 (0.45–0.99)

0.044

General practitioner

248 (53.7%)

191 (64.1%)

0.54 (0.34–0.87)

0.012

Psychiatrist

28 (6.1%)

28 (9.4%)

0.40 (0.20–0.79)

0.009

RRI score: cognitive, emotional and motivational resources, median (IQR)

47 (44–50)

48 (45–50)

0.95 (0.92–0.98)

0.001

RRI score: financial resources, median (IQR)

7 (6–8)

7 (6–8)

1.31 (1.17–1.48)

< 0.001

Work centrality, median (IQR)

22 (20–25)

24 (22–26)

0.87 (0.82–0.92)

< 0.001

Anxiety about ageing, median (IQR)

30 (27–32)

29 (25–32)

1.07 (1.03–1.11)

< 0.001


RRI = Retirement Resources Inventory. For all models, demographic variables were entered in a first block (eg, age groups, sex, international medical graduate, location of practice, specialty), before questionnaire data were entered in a second block (eg, RRI subscale, Self-Administered Comorbidity Questionnaire, work centrality, and Anxiety About Ageing scores). Note that it is possible for groups to have different rank sums that are statistically significant in non-parametric tests, but identical or nearly identical medians.

Detecting the gallop: the third heart sound and its significance

Good technique and a reflective approach assist clinicians to identify an easily missed indicator of ventricular dysfunction

The term “gallop rhythm” was first coined in 1847 by Jean-Baptiste Bouillaud to describe the cadence of three heart sounds occurring in rapid succession. It was further described by his pupil Pierre Potain as follows:

One distinguishes therein three sounds, namely: two normal sounds of the heart and a superadded sound… It is a shock, a perceptible elevation; it is hardly a sound. If one applies the ear to the chest it is affected by a tactile sensation, perhaps more so than an auditory one… In addition to the two normal sounds, this bruit completes the triple rhythm of the heart… This is the bruit de gallop.1

Third heart sound (S3) and fourth heart sound gallops are indicators of underlying ventricular dysfunction; however, the term gallop is only used when the sounds are pathological.

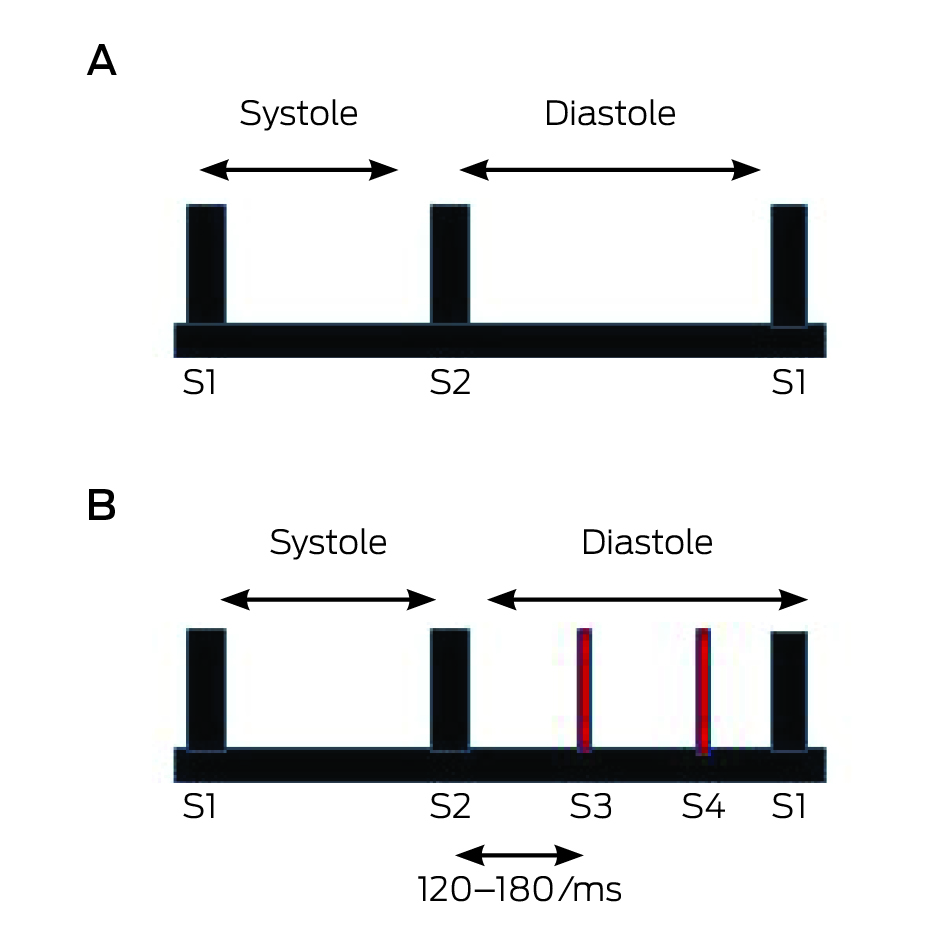
The S3 is a mid-diastolic, low pitched sound (Box 1). In early diastole, the ventricular pressure falls below atrial pressure, and the atrioventricular valves open initiating rapid ventricular filling. Filling slows as the ventricles reach the limit of their elasticity. It is thought that the S3 occurs in the presence of volume overload or ventricular dysfunction when the rapid filling phase ends abruptly.2 It is not completely clear whether the sound arises from vibrations in the valve cusps or tautening of the papillary muscles. Factors that affect S3 intensity include age, atrial pressure, unobstructed flow across the atrioventricular valve, rapidity of early diastolic filling, compliance of the ventricle, blood volume, ventricular cavity size, and patient positioning.

The sound is easily missed, as the level of clinical experience correlates with the ability to detect it.3 The S3 is a low frequency sound in the range of 20 to 70 Hz, with a thudding quality, easily masked by respiratory or environmental sounds.2 It is localised to a small area of the precordium, does not radiate and can be completely missed unless the bell or its equivalent is used during auscultation. An S3 can originate from the left or right ventricle. The differential diagnosis includes splitting of the second heart sound, opening snap of the mitral or tricuspid valve, tumour “plop” from atrial myxoma, or pericardial knock. An S3 is best detected when it is anticipated based on valuable clinical clues of heart failure or valvular pathology (Box 2).

While the sound challenges many clinicians, there are several strategies that can be effective in its detection. It is essential to tune out all other sounds, including systole, and focus on diastole alone (Box 3). As the sound itself may not be distinct or sharp like the first or second heart sounds, clinicians should become accustomed to recognising the cadence which could indicate its presence. An S3 originating in the left ventricle is best heard in the left lateral decubitus position (a position that brings the apex closest to the stethoscope), in held end expiration, and by using the bell or light pressure. It can be augmented by mild exertion which worsens left ventricular dysfunction. An S3 originating in the right ventricle is best heard along the left lower sternal border, sometimes in the epigastrium, and augmented during inspiration and manoeuvres that increase venous return.

The S3 is often physiological in asymptomatic children and young adults, but usually pathological in people over 40 years of age. It correlates with ventricular dysfunction or volume overload. Typical causes of ventricular dysfunction include ischaemic heart disease, cardiomyopathy, myocarditis and cor pulmonale. The S3 can also be heard in aortic and mitral regurgitation, and high output heart failure associated with anaemia, pregnancy, arteriovenous fistulae, thyrotoxicosis and left-to-right shunts.

The S3 can serve as a vital clue in the detection of patients with congestive cardiac failure as well as their risk stratification. The acute decompensated heart failure syndromes (ATTEND) registry study, a multivariate analysis performed in 4107 patients hospitalised with acute heart failure, suggested that the presence of the S3 was independently associated with increased in-hospital all-cause death (adjusted odds ratio [OR], 1.69; 95% CI, 1.19–2.41) and cardiac death (adjusted OR, 1.66; 95% CI, 1.08–2.54).4 Box 4 lists the haemodynamic significance of the presence of the S3.3,5,6

As elusive as the S3 might seem, good technique and reflective practice can help clinicians in eliciting the sound — a finding that provides clues to important cardiac pathology as well as severity of disease.

Box 1 –
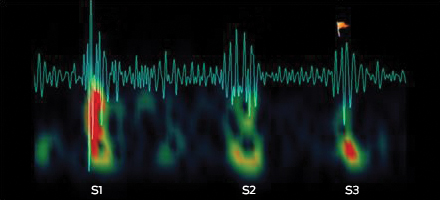
Phonocardiogram from an abnormal heart, showing the third heart sound

Box 2 –
Symptoms of heart failure and associated physical examination findings


Symptoms of left-sided heart failure

Dyspnoea on exertion, orthopnoea, paroxysmal nocturnal dyspnoea, cough, wheeze

Symptoms of right-sided heart failure

Poor appetite, abdominal distension, right hypochondrial discomfort, oedema

Associated examination findings

Increased jugular venous pressure, oedema, resting tachycardia, displaced apical impulse, parasternal heave, murmurs of valvular dysfunction


Box 3 –
Normal heart sounds (A) and abnormal diastolic heart sounds showing the third and fourth sounds (B)

Box 4 –
Significance of the third heart sound: cardiovascular pathology

The third heart sound can be predictive of:

  • Depressed left ventricular ejection fraction of < 50% (likelihood ratio [LR], 4)
  • Depressed left ventricular ejection fraction of < 30% (sensitivity [Sn], 68–78%; specificity [Sp], 80–88%; LR, 4.1)
  • Post-operative pulmonary oedema (Sn, 17%; Sp, 99%; LR, 14.6)
  • Myocardial infarction in patients with chest pain (LR, 3.2)
  • Post-myocardial infarction mortality (LR, 8.0)

Understanding 30-day re-admission after hospitalisation of older patients for diabetes: identifying those at greatest risk

The known Re-admissions are a significant contributor to the burden and medical costs associated with hospitalisation of people with diabetes. 

The new Almost one-quarter of older patients hospitalised for diabetes were re-hospitalised within 30 days, most of whom were re-admitted within 14 days of discharge. The patients at greatest risk of re-admission were those with comorbid heart failure, multiple recent hospitalisations, and multiple prescribers involved in their care. 

The implications Identification in hospital of at-risk patients with diabetes, together with targeted follow-up during the first 14 days after discharge, may facilitate appropriate interventions that avert their re-admission. 

People with diabetes are often admitted to hospital several times; it was reported in the United States that 30% of patients hospitalised for diabetes had been admitted at least twice during the previous year.1 These findings have important consequences for health care costs; hospital inpatient care was identified as the largest item of medical expenditure for patients with diabetes in the US, accounting for 43% of the total medical costs, or US$409 billion.2 In Australia, hospital inpatient care for people with diabetes was conservatively estimated to cost $647 million in 2008–09, or more than 40% of all diabetes-related health care expenditure.3 About 85% of patients hospitalised for type 2 diabetes in Australia are aged 65 years or over,4 and the average cost per hospitalisation is $8755.3 Many of these admissions could potentially be prevented were appropriate primary care provided.5 Hospitalisations for diabetes account for almost one-quarter of all potentially preventable admissions in Australia.5

Re-admissions are a significant contributor to the burden and medical costs associated with hospitalisation of people with diabetes.6,7 Studies in the US have found that as many as 20% of patients hospitalised for diabetes are re-admitted within 30 days of discharge, compared with 5–14% for other types of admission.8,9 Almost half of these re-hospitalisations (9.4% of index admissions) are for a diabetes-related diagnosis.8

Hospital re-admission, particularly within 30 days of discharge, is used as a quality-of-care metric in the US, and has been identified as a high priority health care quality measure for patients with diabetes.10,11 It is suggested that poor coordination of care and discharge planning contribute to high rates of re-admission;10 a large US study of almost 600 000 re-admissions within 30 days of discharge (for either a medical or surgical index condition) found that half of the patients had had no primary care visit between discharge and re-hospitalisation.11,12

Little is known at the population level about the rate of re-admission after hospitalisation for diabetes in Australia or the factors that contribute to the risk of re-admission. The aim of our study was to identify which patients are at risk of 30-day re-admission, and factors that contribute to re-hospitalisation of older Australians with diabetes.

Methods

Data source

We undertook a retrospective cohort study of administrative claims data in the health claims database of the Department of Veterans’ Affairs (DVA) for all patients hospitalised for a diabetes-related condition between 1 January 2012 and 31 December 2012. The DVA database contains details of all subsidised prescription medicines, medical and allied health services, and hospitalisations for a treatment population of 240 000 veterans and war widows and widowers.13

Cohort selection

Patients were included if they were eligible for all health services subsidised by the DVA in the 12 months prior to 1 January 2012 and had been hospitalised for diabetes (primary diagnosis: International Classification of Diseases, version 10, Australian modification [ICD-10-AM] codes E10, E11, E13, E14, R73, T383, Y423) during the period 1 January 2012 – 31 December 2012. Diabetes in these patients included insulin-dependent diabetes, non-insulin-dependent diabetes, other specified and unspecified types of diabetes, with or without complications (coma; hypoglycaemia; ketoacidosis; renal, ophthalmic, neurological, or peripheral circulatory complications; arthropathy). Also included were hospitalisations for elevated blood glucose levels and adverse effects specifically caused by insulin and oral hypoglycaemic (anti-diabetic) drugs. The first index hospitalisation during the study period for each patient was included. Patients who were alive at discharge from the index hospital stay and were neither re-hospitalised with a primary diagnosis of dialysis or rehabilitation within 30 days of discharge, nor re-admitted on the day of discharge, were included in the final study cohort.

Study outcomes and clinical characteristics

The primary study outcomes were the causes of re-hospitalisation and the prevalence of clinical factors associated with re-hospitalisation, including age, sex, residential status at the index admission; length of stay for the index hospitalisation; number and types of comorbid conditions, number of unique medicines, and number and type of prior hospitalisations (in the 6 months before the index admission); and the number of standard general practitioner visits and numbers of unique prescribers and pharmacies (in the 12 months before the index admission). Whether a medication review was undertaken or a GP management plan prepared (during the 12 months before the index admission) and the specific types of anti-diabetic medicines used (during the 6 months before the index admission) were also examined. Secondary outcomes included the proportions of patients who were re-hospitalised within 1–3 days, 1–7 days and 1–14 days of discharge; the proportions of patients who visited a GP within 14 and 30 days of discharge; and the proportion of patients who visited a GP before re-hospitalisation.

Comorbid conditions were identified using the validated, pharmaceutical-based comorbidity index Rx-Risk-V model (Australian adaptation), diagnoses in hospital records (based on ICD-10-AM codes), and specific Anatomical Therapeutic Chemical (ATC) codes for medications (that are not part of the Rx-Risk score).14 Specifically, depression was identified by the dispensing of a non-tricyclic antidepressant (ATC codes N06AB, N06AG02, N06AX; tricyclic antidepressants were excluded because they are commonly used to treat diabetic neuropathy). Cancers, except non-malignant skin cancer, were identified from hospital records for the 12 months before the index admission (ICD-10-AM codes C00–C97, excluding C44). Urinary incontinence was identified by dispensing of medicines for urinary incontinence (ATC code G04BD). Comorbidities were categorised as those related to diabetes (conditions with a shared pathogenesis or management plan, including macrovascular and microvascular diseases) and those unrelated to diabetes (as described previously14).

Following discharge, patients were followed up for 30 days, or until re-hospitalisation or death. Re-hospitalisations were classified according to whether they were potentially preventable according to criteria previously defined in Australia; that is, admissions that might have been prevented by high quality primary and preventive care.5 Potentially preventable hospitalisation diagnoses included chronic conditions, selected acute conditions, and vaccine-related hospitalisations, as described previously (online Appendix).5 We used principal diagnosis codes for this study, as the recording of secondary diagnoses may not reflect the reason for admission, but rather the presence of co-existing conditions or conditions that developed during the episode of admitted patient care.15

Statistical analyses

Data are presented as medians (with interquartile ranges [IQRs]) and percentages. Characteristics predictive of 30-day re-hospitalisation were identified by univariate logistic regression. Variables for which P ≤ 0.10 in the univariate analyses were included in a backward stepwise multivariate logistic regression analysis; P < 0.05 was deemed statistically significant for including a factor in the final model. The goodness of fit of the final model was assessed with the Hosmer–Lemeshow statistic. All statistical analyses were performed in SAS 9.4 (SAS Institute).

Ethics approval

Ethics approval was obtained from the University of South Australia Human Research Ethics Committee (reference, P099/10) and the Department of Veterans’ Affairs Human Research Ethics Committee (reference, E010/010).

Results

A total of 848 older patients hospitalised for diabetes were included in the study cohort, of whom 209 (24.6%) were re-hospitalised within 30 days of discharge. Of all 30-day re-admissions, the re-admission diagnosis for 51 patients (24%) was a diabetes-related condition; in most cases (41 of all re-admissions, 20%) these were type 2 diabetes-related conditions, namely hospitalisation for foot ulcer (19 patients, 9.1%) or hyperglycaemia or hypoglycaemia (11 patients, 5.7%). One-fifth of re-admissions (43 patients, 21%) were for cardiovascular conditions, including heart failure (10 patients, 5%) or atherosclerosis (9 patients, 4%). Other re-admission diagnoses included respiratory disorders (8 patients, 4%), cellulitis (8 patients, 4%) and pneumonia (6 patients, 3%). Eighty-five re-admissions (40.7%) were potentially avoidable; most were hospitalisations for chronic conditions (75 patients, 88% of potentially avoidable re-admissions), including diabetes complications (49 patients, 65%). The median lengths of stay were 5 days (IQR, 2–9 days) for re-hospitalisation, and 6 days (IQR, 2–12 days) for the index hospitalisation.

The demographic and clinical characteristics of the 848 older patients hospitalised for diabetes are shown in Box 1. The median age of the study cohort was 87 years (IQR, 77–89 years); 60% were men. The proportion of patients who had seven or more comorbid conditions in the 6 months before the index hospitalisation was greater among those who were re-hospitalised; the number of visits to a GP and numbers of prescribers and pharmacies where medicines were dispensed in the 12 months before admission were also higher for these patients than for those who were not re-admitted (Box 1). The prevalence of both comorbid heart failure (unadjusted odds ratio [OR], 1.53; 95% confidence interval [CI], 1.06–2.21) and end-stage renal disease (OR, 1.96; 95% CI, 1.03–3.72) was significantly higher in people with a 30-day re-admission. There were no significant differences in the types of anti-diabetic medicines used at the time of admission. Almost one-quarter (23.4%) of patients re-admitted within 30 days had had two or more hospitalisations in the 6 months before the index admission, compared with 14.9% of people who were not re-admitted (OR, 1.98; 95% CI, 1.29–3.06; Box 1).

Multivariate analysis indicated that comorbid heart failure, higher numbers of prescribers, and two or more prior hospitalisations were independent predictors of re-admission within 30 days (Box 2).

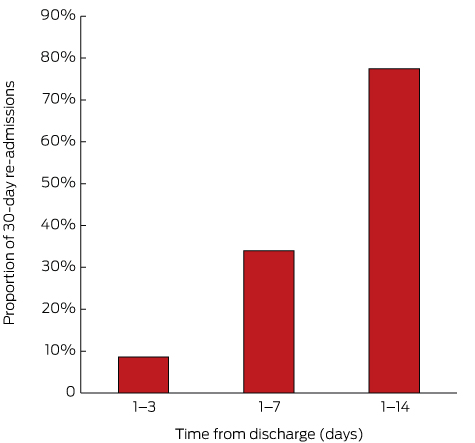
Of the 209 re-admissions within 30 days, 162 (77.5%) were within 14 days of discharge, and more than one-third within 7 days (Box 3). Of the patients who were re-admitted within 30 days of discharge, 128 (61.2%) visited a GP before their re-admission; of the 162 patients re-admitted within 14 days of discharge, 96 (59.3%) had visited a GP before the re-admission. Following discharge, 654 patients in the entire study cohort (77.1%) saw a GP within 30 days, including 515 (60.7%) within 14 days of discharge.

Discussion

Almost one-quarter of older patients hospitalised for diabetes were re-admitted to hospital within 30 days of discharge, of whom three-quarters were re-admitted within 14 days of discharge. We identified a number of factors that characterised diabetic patients at higher risk of re-admission, including comorbid heart failure, more than two recent previous hospitalisations, and seeing multiple prescribers. Proactive identification of patients at higher risk may facilitate preventive actions, including organising GP visits one to two weeks after discharge, particularly for patients who have had a recent prior hospitalisation and who have more than one medical practitioner prescribing their medicines; 41% of patients who were re-admitted had not visited a GP during this period.

While hospital re-admissions are a multifaceted problem, our findings highlight the need for improved care transitions and coordination of care to reduce this significant burden on both patients and the Australian health care system. Re-admissions are expensive, demanding on health care resources, and pose a significant risk to patient safety.6

More than 40% of re-admissions in our study were potentially preventable by providing appropriate primary care. This underscores the importance of the timeliness of clinical handover and of GP visits after discharge, but the proportion of re-admissions within 30 days that are truly preventable is unknown. A recent US study found that 31% of all re-admissions of older patients admitted to hospital for treatment of diabetes were potentially preventable, with hospitalisations for heart failure and diabetes respectively accounting for 48% and 22% of preventable admissions, costing the US health care system an estimated $US62 million.16

Heart failure was the only comorbidity that was a significant predictor of re-admission in our study; it was associated with a 49% increase in the likelihood of re-hospitalisation within 30 days (Box 2). In a large US study, the most common diagnosis among 580 000 Medicare patients re-hospitalised within 30 days of an initial hospitalisation for a medical condition or surgical procedure was also heart failure.12 Another US study reported that the most common cause of re-admission within 30 days for patients initially hospitalised for diabetes, heart failure, ischaemic heart disease, atrial fibrillation or chronic kidney disease was heart failure; comorbid heart failure was associated with a 23% increase in risk of re-admission (risk ratio, 1.23; 95% CI, 1.02–1.48).6

Together with the results from our study, this highlights the significance of comorbid heart failure for the risk of re-hospitalisation of older patients with diabetes. These patients should be targeted for continuity of care services after discharge, particularly during the first 14 days. A 2014 systematic review of 47 studies found that post-discharge interventions, such as home visit programs and multidisciplinary clinics, reduced all-cause re-admission and mortality rates among people with heart failure, and structured telephone support services reduced mortality and the number of heart failure-specific re-admissions.17

Patients who had been admitted to hospital several times during the 6 months before the index hospitalisation were almost 80% more likely to be re-admitted within 30 days (Box 2). Re-admissions are more common among older people, and this population has a higher risk of adverse events and use health services more.18 In a US study, only 30% of patients hospitalised for diabetes had been admitted to hospital more than once in the previous 12 months, but these patients accounted for most (55%) of the inpatient costs for this disorder; many hospitalisations were considered to be preventable by quality outpatient care.19 Inpatient diabetes education, in particular, was found to be associated with a 34% reduction in 30-day re-admission rates (OR, 0.66; 95% CI, 0.51–0.85) for patients with poor glycaemic control at the index hospital admission.20

The risk of re-admission involves a complex relationship between the presence of chronic and acute conditions, the health status of the patient, and health system factors, such as the transition between primary and hospital care and coordination of care, including timely, comprehensive communication.11 It was recently postulated that post-hospital syndrome, an acquired transient condition of generalised vulnerability after discharge, also contributes to re-admissions within 30 days.21 Focused, comprehensive holistic strategies that target stressors which contribute to increased vulnerability may mitigate post-hospital syndrome and the risk of re-hospitalisation.21 Structured multidisciplinary post-discharge support visits have been shown to reduce re-admission rates in people with heart failure, chronic obstructive pulmonary disorder, and in older frail people in general,18,22 as has comprehensive inpatient geriatric health care assessment together with ongoing multidisciplinary support after discharge.23 An Australian study found that such intervention reduced emergency re-admission rates by more than 50%, reduced the number of emergency GP visits, and improved patients’ quality of life;23 the intervention was also found to be cost-effective.24

Medicines reviews had not been undertaken for most of our study cohort (Box 1). Collaborative medicines reviews expedite identifying and resolving medication-related problems and delay the time to hospitalisation for several conditions,25 and may therefore also reduce the risk of re-admission of patients hospitalised for diabetes.

There were limitations to our study. We analysed DVA administrative health data that may not be representative of the overall older Australian population. Members of the DVA cohort can access all health care services, and this may influence their health-seeking behaviour and, potentially, their health outcomes. However, age-specific comparisons of members of the DVA cohort with non-service-related disabilities with people in the wider Australian population have found similar annual rates of GP visits, use of prescriptions, and numbers of hospitalisations.26 We were unable to determine whether re-admission was directly related to the index condition on the basis of the ICD-10 codes for the hospital separation. Further, we could not examine in-hospital changes to medications or the provision of inpatient subacute services during the index admission that may have influenced re-admission, as the dataset did not completely capture in-hospital medicine use and services.

In summary, older people hospitalised for diabetes with comorbid heart failure, more than two other hospitalisations in the previous 6 months, or multiple prescribers involved in their care are at greater risk of being re-admitted to hospital within 30 days of discharge. Improved timeliness of primary care after discharge may be warranted, as almost half of those re-admitted within 14 days of discharge had not seen their GP during this time. The identification of these at-risk patients may help to target appropriate interventions for preventing these re-admissions.

Box 1 –
Characteristics of 848 older patients hospitalised for diabetes, according to whether they were re-admitted to hospital within 30 days of discharge

No re-admission

30-day re-admission

Unadjusted odds ratio (95% CI)

P


Number of patients

639

209

Demographic data

Age category

≤ 85 years old

309 (48.4%)

114 (54.5%)

Reference

> 85 years old

330 (51.6%)

95 (45.5%)

0.78 (0.57–1.17)

0.12

Sex (men)

363 (56.8%)

132 (63.2%)

1.31 (0.95–1.81)

0.09

Location of residence

Community

534 (83.6%)

180 (86.1%)

Reference

Residential aged care

105 (16.4%)

29 (13.9%)

0.85 (0.54–1.33)

0.47

Clinical characteristics

Median index LOS (IQR), days

5 (2–11)

6 (2–12)

1.14 (0.85–1.36)

0.09

Index LOS 0–5 days

329 (51.3%)

101 (48.3%)

Reference

Index LOS 6–11 days

164 (25.6%)

52 (24.9%)

1.05 (0.68–1.61)

0.85

Index LOS > 11 days

149 (23.2%)

56 (26.7%)

1.24 (0.81–1.90)

0.29

Median number of comorbid conditions* (IQR)

6 (4–8)

7 (5–8)

0.95 (0.79–1.78)

0.31

0–4 comorbid conditions

182 (28.5%)

48 (23.0%)

Reference

5–6 comorbid conditions

250 (39.1%)

89 (42.6%)

0.92 (0.78–1.12)

0.75

≥ 7 comorbid conditions

207 (32.4%)

72 (34.5%)

1.28 (1.08–1.53)

0.04

Median number of unrelated comorbid conditions (IQR)

2 (1–3)

2 (1–3)

1.06 (0.98–1.17)

0.20

Median number of unique medicines* (IQR)

11 (8–16)

11 (8–17)

0.97 (0.91–1.14)

0.23

1–7 unique medicines

125 (19.6%)

34 (16.3%)

Reference

8–14 unique medicines

324 (50.7%)

106 (50.7%)

1.13 (0.73–1.76)

0.71

≥ 15 unique medicines

190 (29.7%)

69 (33.0%)

1.47 (1.0 –2.17)

0.04

Health service use

Median number of GP visits* (IQR)

7 (4–11)

8 (5–15)

1.03 (1.02–1.04)

0.02

Median number of prescribers (IQR)

3 (2–5)

4 (2–5)

1.07 (1.01–1.13)

0.02

Median numbers of pharmacies (IQR)

2 (1–2)

2 (1–3)

1.15 (1.03–1.29)

0.02

Medicines review

49 (7.8%)

15 (7.2%)

0.89 (0.47–1.67)

0.73

General practitioner management plan

135 (21.2%)

53 (25.4%)

1.06 (0.72–1.57)

0.78

Specific comorbid conditions/medications*

Depression

187 (29.3%)

51 (24.4%)

0.78 (0.54–1.13)

0.19

Anxiety

73 (11.4%)

22 (10.5%)

0.91 (0.55–1.51)

0.72

Chronic respiratory disease

174 (27.2%)

53 (25.4%)

0.96 (0.67–1.38)

0.82

Heart failure

121 (18.9%)

55 (26.3%)

1.53 (1.06–2.21)

0.02

Dementia

15 (2.2%)

5 (2.4%)

1.02 (0.37–2.84)

0.97

End-stage renal disease

26 (4.1%)

16 (7.7%)

1.96 (1.03–3.72)

0.04

Cancer

18 (2.8%)

10 (4.8%)

1.46 (0.62–3.43)

0.39

Urinary incontinence

25 (3.9%)

11 (5.3%)

1.37 (0.66–2.82)

0.40

Non-steroidal anti-inflammatory drugs

61 (9.5%)

23 (11.0%)

1.17 (0.71–1.95)

0.54

Oral corticosteroids

88 (13.8%)

36 (17.2%)

1.36 (0.85–1.99)

0.22

Anti-psychotics

41 (6.4%)

19 (9.1%)

1.46 (0.83–2.60)

0.19

Anti-diabetic medicines

Median number of medicines for diabetes (IQR)

1 (1–2)

1 (0–2)

0.94 (0.79–1.10)

0.43

Insulins and analogues (ATC code, A10A)

162 (25.4%)

50 (23.9%)

0.99 (0.68–1.43)

0.95

Other anti-diabetic medicine (ATC code A10B)

328 (51.3%)

100 (47.8%)

0.84 (0.61–1.17)

0.30

Insulin and other anti-diabetic

104 (16.3%)

27 (12.9%)

1.02 (0.99–1.05)

0.22

Number of prior hospitalisations*

None

269 (42.1%)

70 (33.5%)

Reference

1

169 (26.4%)

52 (24.9%)

1.18 (0.78–1.78)

0.37

2

106 (16.6%)

38 (18.2%)

1.38 (0.88–2.17)

0.86

> 2

95 (14.9%)

49 (23.4%)

1.98 (1.29–3.06)

0.009

Type of prior hospitalisations*

Diabetes-related admission

37 (5.8%)

24 (11.5%)

1.63 (0.94–3.17)

0.08

Cardiovascular-related admission

132 (20.7%)

67 (32.1%)

1.36 (0.89–2.05)

0.07

Infection-related admission

46 (7.2%)

25 (11.9%)

1.09 (0.60–2.07)

0.82

Respiratory-related admission

14 (2.2%)

9 (4.3%)

0.94 (0.30–2.90)

0.92


ATC = Anatomic Therapeutic Chemical classification system; LOS = length of stay. * During the 6 months before hospitalisation. During the 12 months before hospitalisation.

Box 2 –
Predictors of re-admission within 30 days of a diabetes-related hospitalisation (multivariate analyses)*

Predictors of 30-day re-admission

Adjusted odds ratio (95% CI)

P


Comorbid condition: heart failure

1.49 (1.03–2.17)

0.036

Number of prescribers

1.06 (1.01–1.08)

0.031

Two or more hospitalisations during 6 months before index admission

1.79 (1.15–2.78)

0.009


* Backward stepwise multivariate logistic regression: all variables with α ≤ 0.10 in the univariate analyses in were included; only those for which α ≤ 0.05 were included in the final model. Goodness-of-fit test: P = 0.67. † Odds ratio: for each additional prescriber.

Box 3 –
Time between discharge and re-admission for 209 patients re-admitted within 30 days of an index admission for diabetes

Holistic medicine provision in the outback

Overcoming the barriers to chronic disease management in rural areas

The Royal Flying Doctor Service (RFDS) has been providing essential medical services to rural and remote Australia since its inception in 1927. The service, founded by Reverend John Flynn, started as a single base at Cloncurry in Queensland1 and now operates out of 21 bases, providing both primary care clinics and emergency retrieval services. RFDS has been servicing clinics from its Broken Hill base since the 1940s; by 1970, there were three full-time doctors conducting the clinics and running the on-call service via the radio network. In 2016, Broken Hill doctors treated patients in 17 different clinic locations each month. On most weekdays, there are general practitioners at three clinic sites, along with dentists, nurses and mental health practitioners.

RFDS is well recognised within Australia and internationally as the only provider of emergency care to large swathes of the outback. Television shows, such as The Flying Doctors and Outback ER, make acute care and cutting-edge medicine familiar to the public. What is less well known, however, is the organisation’s extensive involvement in delivering primary care services to people living in remote locations.

Chronic disease management (CDM) is a key component of the primary care services offered, and the appointment of a practice nurse in 2011 was the first step taken to focus on CDM. The nurse’s initial task was to create and manage the chronic disease register. This formalised the disease database and enabled the setting up of recalls to ensure that patients received regular follow-ups, and it also required doctors to comply with the full functionality of the MedicalDirector system. In addition, the opening of the Clive Bishop Medical Centre (CBMC) at the airport base, in August 2014, allows patients from remote locations to see an RFDS doctor when they are in town in between remote clinic days. Thus, in recent years, the RFDS has redefined its role from bush clinics and emergency evacuations to include a more comprehensive primary care approach in an effort to improve chronic disease outcomes.2 However, due to a number of factors, RFDS is still limited in its ability to deliver high quality primary care.

This model of care in remote New South Wales requires significant investment in medical staff. In an area of 640 000 km2 and with about 6000 patients who live outside Broken Hill,3 eight whole-time-equivalent (WTE) GPs are needed to provide appropriate primary care and emergency services — an increase from four WTEs in 2000. Staff fatigue management and CDM considerations have driven the increase in staff numbers. Clinical, pilot and engineering staff salaries, along with aviation fuel, are all required to enable aircraft-serviced clinics and incur a high cost per patient.

In a metropolitan setting, a patient may need an emergency ambulance ride to hospital at a cost of $364 plus $3.29 per km travelled.4 However, in remote locations an $8 million dollar aircraft will need to be sent out at a cost of about $3000 per hour flown. Although the secondary care costs may be expected to be comparable, the approximate tenfold transport cost impacts significantly on health budgets, and demands optimised local CDM and patient concordance.5,6

Western countries have resourced primary care significantly in the past decade, with GPs incentivised to improve CDM. For example, the United Kingdom Qualities and Outcomes Framework rewards GP practices for the overall control of diabetes, chronic obstructive pulmonary disease and cardiovascular disease.7 In Australia, GP management plans (GPMPs) can be charged at a significant premium ($144.25) compared with a standard long Medicare consultation ($71.70).When done well, this should have the effect of more reliable monitoring and control of chronic conditions.8

The Commonwealth contract for the RFDS South Eastern Section, however, does not place a premium on these services. Standard RFDS consultations outside Broken Hill are funded based on historical data; CBMC consultations are Medicare bulk billed under a separate arrangement. When GPMPs are used in remote settings, they do not enable patients to access allied health services — such as diabetes educators, podiatry or physiotherapy — under the Medicare-funded scheme. Patients must either finance it themselves, or book an appointment in a Medicare billed location to access Team Care Arrangements funding.

By involving its in-house multidisciplinary team (funded by a variety of income streams), including practice nurses, women’s and children’s nurses, mental health practitioners and substance misuse workers, RFDS has sought to develop services in line with current best practice. Additional integrated team-based care with medical (generalist and specialist), nursing and allied health staff is known to be associated with improved health outcomes in patients with chronic illnesses.9 Rural and remote primary care centres, such as clinics in far west NSW, are less likely to have a team approach because of limited access to allied health workers.9,10

Recruitment and retention of doctors

RFDS doctors at Broken Hill are required to have a fellowship of the Royal Australian College of General Practitioners or a fellowship of the Australian College of Rural and Remote Medicine. Attainment of these qualifications ensures the standard of knowledge and training of the GPs responsible for treating patients in remote settings. However, the reality is that a full-time doctor may only conduct 2–3 clinics per week (spending the rest of their time on call). With travel time to clinics of up to 2 hours each way, and the attendance varying from 8 to 16 patients per day, clinical skills are used less often and confidence may diminish. Some doctors find this frustrating; others are happy to have time out of private general practice.

The maintenance of clinical skills in emergency care is more challenging. Practitioners need to complete a regular cycle of courses — including Advanced Paediatric Life Support, Advanced Life Support in Obstetrics, Early Management of Severe Trauma and airway skills updates — but there may be months between course completion and the need to use the skills. The gap between competence and confidence may be too much for some doctors to bear, and for those who prefer the emergency to the routine, there is not enough excitement.

Therefore, there are two competing challenges to address: where to find GPs who are experienced enough in their field to be able to manage well the uncertainty in remote places — whether face to face or over the phone — and enough emergency cases to keep this self-selecting group interested. Then of course, there is the remoteness of the place; 1200 km from Sydney and 500 km from Adelaide is too much for most Australian GPs. At present, the full-time practitioners are UK or Irish graduates, and the longest serving of them has been employed for 3 years.

Continuity of care

If a high staff turnover is not controlled, continuity of care in each clinic site will be adversely affected. Even when fully staffed, manning 17 clinic sites and rostering night shifts means that doctors have to be rotated. However, it has been shown that both patients and doctors prefer to know each other as part of an effective therapeutic relationship.11,12 This is an important factor in the effectiveness of CDM and patient engagement.

In addition to the RFDS doctors, health services in Wilcannia, Ivanhoe and Menindee are simultaneously provided by GPs from Maari Ma Health, which is the Indigenous community controlled health organisation. Five Local Health District (LHD) facilities, which include these three, also provide nursing staff at these sites. With the rotating system of both RFDS and Maari Ma Health rosters, along with significant use of agency nursing in remote sites, it is easy to recognise the fragmentation of what should ideally be integrated care. The responsibility for CDM of certain groups falls between the gaps sometimes, and it is not always clear who should be keeping track of follow-up and recall systems. There is, therefore, room for further system development and collaboration here.

Medical records

GP and hospital records are now multi-user friendly and most sites enable multidisciplinary teams to make entries within the same system. However, Maari Ma Health has a separate MedicalDirector system from RFDS, and LHD has recently upgraded to NSW Health’s latest hospital electronic medical record system. Thus, the usual norms of primary care, in which a GP is confident that the electronic record is complete, have not been possible to achieve in recent years. RFDS doctors are fully oriented to the need of keeping updated records for emergency and primary care consults, so that colleagues may be apprised of their decision making.

Social considerations

In remote NSW, there are many circumstances that may impact the clinical follow-up of medical conditions. It is widely believed that logistical, economic and cultural factors affect the low attendance rates for CDM in remote settings.13,14 The reasons for low RFDS clinic attendance rates include socio-economic conditions, the lower likelihood that males in rural communities will use preventive health services than urban males, and a higher proportion of Indigenous people.14 Logistical dimensions of proximity, affordability, accommodation, timeliness and psychosocial attitudes and beliefs are well known to hinder continued primary care in remote regions.1315 Identifying infrequent users of primary health care who have chronic disease, with consideration of culturally appropriate preventive care, will assist in targeting those patients who require medical services.

There are still many barriers to the high quality management of chronic conditions. Efforts to improve this situation should focus on enhancing continuity of care, follow-up systems and planning of a team care approach. The increased use of telehealth technologies will be an important part of remote consultations, and current initiatives to improve CDM are of the utmost importance.

Critical antibiotic resistant superbug list released by WHO

The World Health Organisation has released a list of the most critical bacteria that are resistant to antibiotics, in the hope that governments will act soon.

These bugs could pose a risk to patients in hospitals and nursing homes by causing severe and often deadly infections among patients requiring devices like ventilators or blood catheters.

The bacteria have built-in abilities to find new ways to resist treatment. They can also pass along genetic material to allow other bacteria to also become drug resistant.

According to Dr Marie-Paule Kieny, WHO’s Assistant Director-General for Health Systems and Innovation, “This list is a new tool to ensure R&D (research and development) responds to urgent public health needs.”

“Antibiotic resistance is growing, and we are fast running out of treatment options. If we leave it to market forces alone, the new antibiotics we most urgently need are not going to be developed in time,” she said.

Related: Superbugs could be ‘worse than global financial crisis’: World Bank

The WHO have released 12 bugs divided into three categories based on the urgency of the need for new antibiotics.

The superbugs are:

Priority 1: CRITICAL

  1. Acinetobacter baumannii, carbapenem-resistant
  2. Pseudomonas aeruginosa, carbapenem-resistant
  3. Enterobacteriaceae, carbapenem-resistant, ESBL-producing

Priority 2: HIGH

  1. Enterococcus faecium, vancomycin-resistant
  2. Staphylococcus aureus, methicillin-resistant, vancomycin-intermediate and resistant
  3. Helicobacter pylori, clarithromycin-resistant
  4. Campylobacter, fluoroquinolone-resistant
  5. Salmonellae, fluoroquinolone-resistant
  6. Neisseria gonorrhoeae, cephalosporin-resistant, fluoroquinolone-resistant

Priority 3: MEDIUM

  1. Streptococcus pneumoniae, penicillin-non-susceptible
  2. Haemophilus influenzae, ampicillin-resistant
  3. Shigella, fluoroquinolone-resistant

Dr Rietie Venter is Head of Microbiology at the Sansom Institute for Health Research at the University of South Australia highlights that it was one of these organisms that was responsible for an American woman’s death earlier this year as the organism was resistant to all antibiotics available in the US.

Related: We need more than just new antibiotics to fight superbugs

Despite this reality, research into antimicrobials is still not very well supported by pharmaceutical companies.

“We can only hope that the publication of this list would translate into the necessary funding to develop new antimicrobials and prevent us from slipping into a world without effective antimicrobials where small injuries would once again be life-threatening and modern medicine such as transplants would be impossible to practice,” she said.

According to Professor Ramon Shaban, President of the Australasian College for Infection Prevention and Control, antimicrobial resistance shouldn’t be considered just a problem for clinicians in human sectors.

“It is a whole of society challenge, and many of the solutions are non-clinical. It, like infection control, is everyone’s business,” he concludes.

Latest news

Daily step count and the need for hospital care in subsequent years in a community-based sample of older Australians

The known Most investigations of the benefits of physical activity for health have used self-reported measures of physical activity of limited validity. As a large proportion of people admitted to Australian hospitals are over 55, quantifying the factors that influence their need for hospital care is important. 

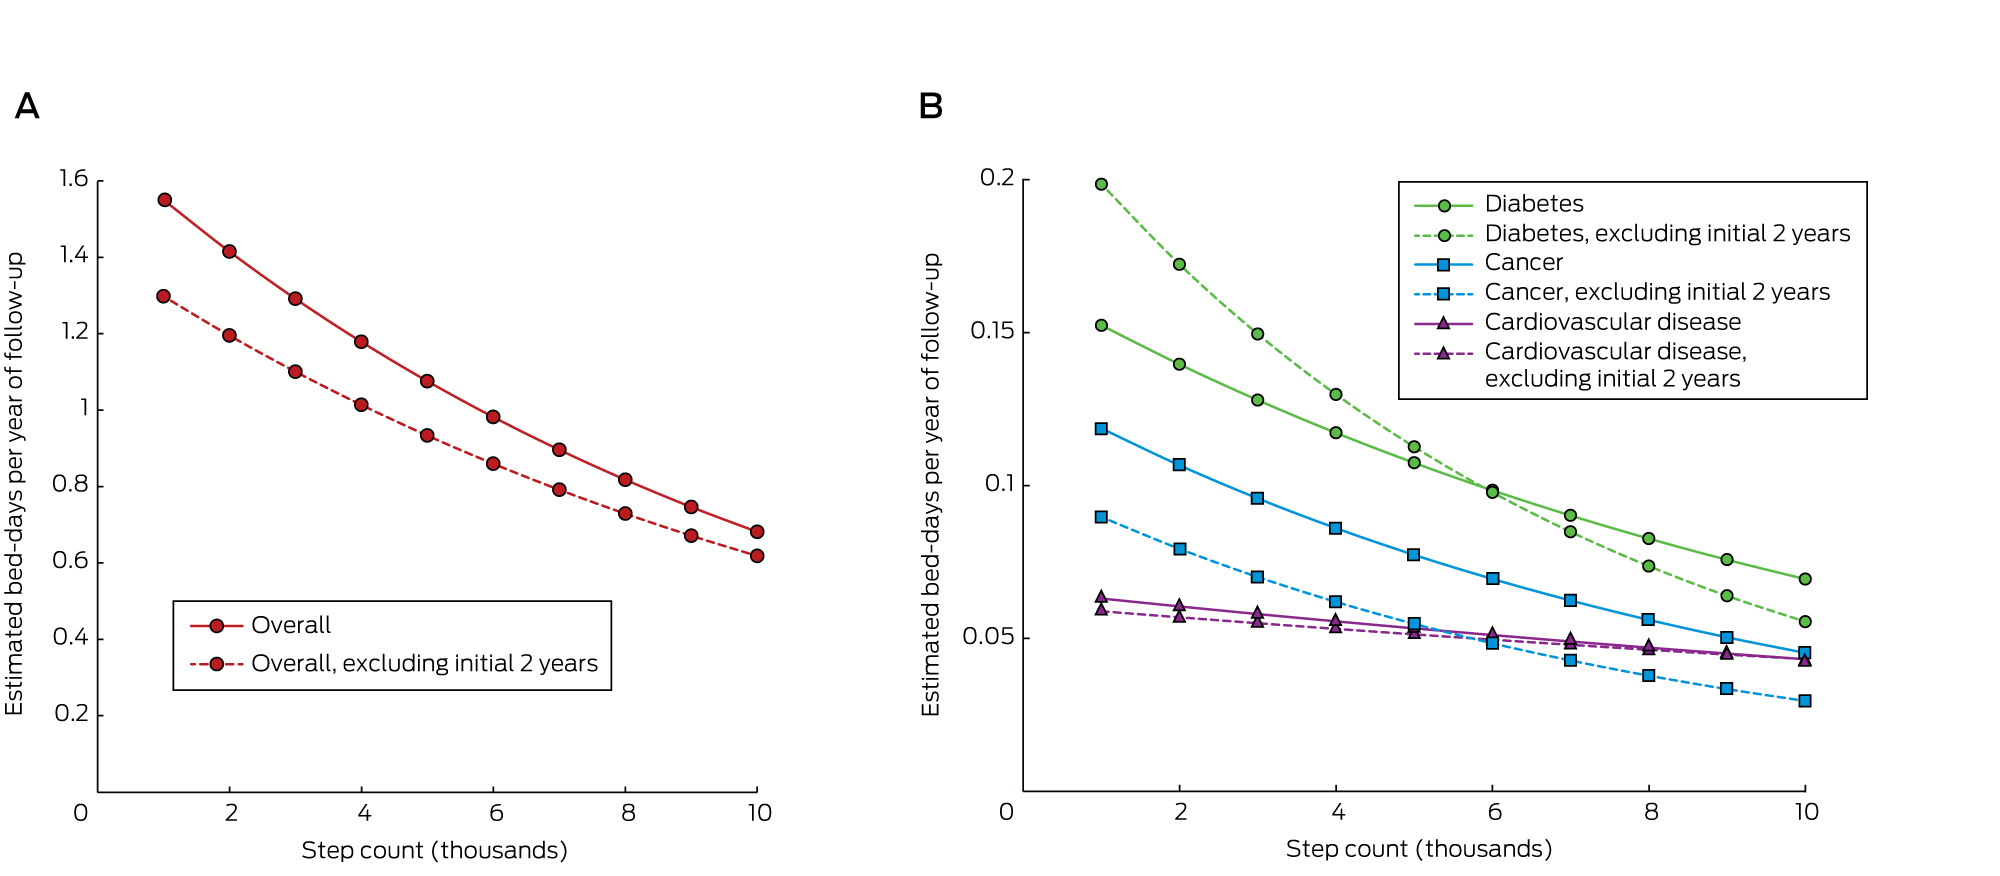
The new An increase in step count from 4500 to 8800 steps per day was associated with 0.36 fewer hospital bed-days per person per year. 

The implications Health interventions and urban design features that encourage walking could have a substantial effect on the need for hospital care, and should be features of health policy. 

Epidemiologic evidence strongly suggests that increased levels of physical activity are associated with the reduced incidence, prevalence and mortality of a range of diseases.1 Its impact on the use of health services, however, is not well studied. With an ageing and largely inactive population putting increased pressure on inpatient hospital services, it is important to understand the extent to which increased physical activity might reduce the number of hospital admissions. The direct health care costs for Australia of physical inactivity were estimated to be $377 million in 2000, but this figure was based on population-related risks for a range of diseases, rather than assessment of the actual use of services.2

Data on hospital admissions for particular diseases are available; for example, for patients in Denmark with chronic obstructive pulmonary disease the risk of hospital admission over the subsequent 12 years was 28% lower for those who reported any physical activity than for patients who reported no activity.3 In another study, the risk of hospital admission for women with venous thrombo-embolism was 24% lower in those walking more than 5 hours a week than for those who walked less than one hour per week.4

Health care costs have also been studied; for example, in a large community-based sample of Canadians over 65 years of age, the self-reported health care costs for people who met physical activity guidelines were CAN$1214 (60%) lower over the following 12 months than for those who were inactive.5 Similar results were found in Japan, with 12-month health care costs £174 (13%) lower for those walking one hour a day than for people who did not.6 Contrasting findings were made in the younger National Health and Nutrition Examination Survey (NHANES) sample in the United States (average age, 45 years), for whom there was no association between self-reported physical activity and total health expenditure in the following year.5,7

Only one previous study has investigated associations between objectively measured physical activity and subsequent health service use. A United Kingdom cohort of 240 people (average age, 78 years) wore accelerometers for a week and was followed for an average of almost 5 years. The incidence of unplanned hospitalisation was 2.13 times higher in those with low levels than in people with higher daily levels of moderate to vigorous physical activity (mean, 3 v 39 minutes), and 1.81 times higher in those with low daily step counts than in people with high counts (mean, 2100 v 7100 steps). There was also an inverse association with the number of prescriptions written, but not for the number of general practice consultations or referrals to specialist care.8 The question of reverse causation was not investigated: the possibility that, rather than physical activity improving health, illness causes people to be less active.

Research into population-wide physical activity has been hampered by the low validity of self-reported measures, so that more recent published research has favoured objective measurement with pedometers, accelerometers, and metabolic methods.

We enrolled people over the age of 55 years in a cohort study during 2004–2007, collecting a wide range of data on baseline variables, including step counts. This was the first cohort of more than 1000 people for whom data on an objective measure of physical activity at baseline were collected, giving us a unique opportunity to examine the effect of baseline step counts on hospital use in subsequent years.

Methods

The Hunter Community Study includes a cohort of community-dwelling men and women aged 55–85 years who reside in Newcastle, New South Wales. Participants were randomly selected from the NSW state electoral roll and contacted between December 2004 and December 2007. Listing on the electoral roll is compulsory in Australia, and it is estimated to be 93.6% complete.9 A modified Dillman recruiting strategy10 was applied. Two letters of introduction and an invitation to participate were posted to the selected candidates; individuals who did not respond to the initial letters were telephoned by a research assistant if a publicly listed number was available. If contact was not established after five attempts, the individual was classified as a non-responder. People who could not speak English or were living in residential aged care facilities were excluded.

After providing consent, participants were asked to complete two questionnaires and to return them when they attended a data collection clinic, at which a series of clinical assessments was undertaken. Consent from participants was also sought at this time to link personal information obtained during the study with Medicare data (Medicare and Pharmaceutical Benefits Scheme) and local hospital databases. A package of three further questionnaires, to be returned by reply-paid post, was given to participants to complete at home after their clinical assessment. Administering the questionnaires in segments before and after the clinical phase aimed to reduce the burden for respondents and to thereby maximise attendance for clinical assessments.

Step count was recorded over a week by a pedometer (Yamax) worn during waking hours, and participants recorded the daily step count in a diary. In 2004–2007, there was little community awareness of step count targets, and no guidance was given as to how many steps constituted a healthy amount of activity. The pedometer was worn on the waist belt, in line with either leg. Days with less than 9 hours’ wear were excluded from analysis, and a daily average count was calculated for participants with at least 3 days of wear.

Hospital admissions for the 2623 people who consented to record linkage were retrieved from both public and private hospitals. All hospital admissions in NSW are coded by professional hospital coders using the International Classification of Diseases, version 10 (ICD-10), with a first position code for the principal reason for admission and up to ten other codes for comorbidities. We chose bed-days rather than admissions as the outcome measure because it more accurately reflects health care costs, and physical activity could conceivably influence the severity as well as the incidence of disease.

Statistical methods

Baseline demographic information for the analysis population (all those with complete pedometry, hospital admissions and relevant clinical and demographic data) was summarised as means and standard deviations for continuous variables and as frequencies and percentages for categorical variables. The distributions of these variables were compared with the NSW 2006 census population aged 55–85 years (where available) in χ2 tests.

For each consenting participant, we estimated the number of hospital bed-days from enrolment in the study to 31 March 2015, based on data in the admitted patient database. The number of days in hospital was defined according to the admission and discharge dates, initially for all admissions, and then stratified by ICD-10 and procedural codes, allowing us to determine cancer-, diabetes- and cardiovascular disease (CVD)-specific hospital separations. Private hospital follow-up time was excluded for CVD-related admissions because data were missing for some years.

We initially analysed the total number of bed-days after recruitment, and then performed a sensitivity analysis that excluded data for the first 2 years of follow-up, in order to examine the effect of reverse causality.

To determine the appropriate set of confounding variables for estimating the effect of physical activity on the number of hospital admissions, we constructed a directed acyclic graph (online Appendix). The following variables were deemed sufficient: age at the baseline survey, sex, number of medications, number of comorbidities (angina, asthma, heart attack, osteo-arthritis, rheumatoid arthritis, stroke, diabetes, elevated cholesterol levels, thyroid conditions, depression or anxiety, atrial fibrillation, bronchitis or emphysema, cancer), smoking status (never, former or current smoker), level of alcohol consumption (never drink, safe, moderate, hazardous/binge, hazardous/chronic, unknown), and most advanced level of education.

A negative binomial regression model was used, with number of hospital bed-days as the outcome, log length of follow-up as an offset, and step counts, education level, sex, number of comorbidities, number of medications, smoking status, and alcohol consumption included as independent variables. In the models for disease-specific bed-days, the number of participants with no bed-days was high, so a zero-inflated negative binomial model was employed for these analyses. Incidence rate ratios are presented with Wald 95% confidence intervals [CIs], P values, and least squares mean estimates for number of bed-days at the lower quartile, median, and upper quartile boundaries for step counts. Goodness of fit was assessed by visually inspecting estimates of observed and model-predicted bed-days, and plots of deviance residuals v independent variables. All analyses were conducted in Stata 13.1 (StataCorp).

Ethics approval

Ethics approval was granted by the University of Newcastle Human Research Ethics Committee (reference, H-820-0504a).

Results

Invitation letters were sent to 9784 individuals randomly selected from the electoral roll. Of the 7575 subjects who responded, either in person or through a relative, 258 were ineligible (148 did not speak English, 92 had subsequently died, 18 had moved to an aged care institution); 3440 refused and 3877 agreed to participate. A total of 3253 people actually participated, giving a response rate of 44.5% of eligible responders. The participant group reflected the Australian population aged 55–85 years in terms of sex and marital status, but was slightly younger. Further details of recruitment and the representativeness of the sample have been published elsewhere.11

Valid step count data were recorded for 2458 participants, of whom 2174 had consented to record linkage. The baseline number of medications was not well reported (20% missing data), so this variable was omitted from further analyses. We present a complete case analysis of the data for the 2110 participants for whom complete data on all variables of interest were available (Box 1).

Compared with the NSW population aged 55–85 years in 2006, the proportion of participants who did not drink alcohol was similar; more had a university or trade qualification, fewer were smokers, and there was a statistically significant different age distribution.

The total number of person-years followed up was 17 374 (excluding the first 2 years, 13 514 person-years), with a mean of 8.2 years (range, 7.0–11.1 years). The median daily step count was 6.6k steps (k = 1000; interquartile range, [IQR], 4.5k–8.8k steps); 1% of participants had step counts greater than 16.4k, and the maximum value was 23.9k. The median overall time in hospital was 2 days (IQR, 0–9 days); 1% of participants spent more than 135 days in hospital, and the maximum stay was 384 days. Excluding the first 2 years of follow-up, the median time in hospital was 0 days (IQR, 0–5 days; maximum, 294 days). The number of bed-days of hospital care associated with particular diseases is shown in Box 2.

Association between step count and number of bed-days

The average number of bed-days per year for people at the 25th percentile step count was 1.12, for those at the 75th percentile it was 0.76, a difference of 0.36 bed-days, or 32%. After excluding the first 2 years’ follow-up, the average number of bed-days per year for people at the 25th percentile step count was 0.97, while for those at the 75th percentile it was 0.68, a 30% reduction (Box 3).

After adjusting for potential confounders, the overall estimated number of bed-days per year of follow-up decreased by 9% for each 1000-step increase in daily step count (95% CI, –10% to –6%; P < 0.001). A higher step count was found to be associated with fewer bed-days for cancer and diabetes, but not for CVD (Box 3). Estimated bed-days for step counts in the range 1k–10k are shown in Box 4.

A sensitivity analysis was conducted to explore the effect of outliers. Models were re-run after exclusion of the top 1% of values for bed-days and step counts. The results were essentially similar, but the benefit for patients with cancer was no longer statistically significant (data not shown).

Discussion

We report the first investigation of the association between objectively measured physical activity and hospital use over an extended follow-up period. People taking 8800 steps per day (the 75th percentile boundary) spent almost one-third of a day less in hospital per year of follow-up than people taking 4500 steps per day (the 25th percentile boundary). The estimated difference was slightly smaller (0.29 days) when the first 2 years of follow-up were excluded, and we regard this smaller figure as the best estimate of the causal effect. This difference equates to a 30% lower requirement for hospital care being associated with 4300 extra steps per day, or about 40 minutes of walking.

While the effect of step count on cancer and diabetes admissions data was significant, we were surprised to find no significant effect on CVD admissions; this anomaly may be related to the fact that data for CVD admissions in the private sector were missing.

The strengths of our study included the large community-based sample, our adjustment for appropriate confounders, the extended follow-up, and complete ascertainment of hospital admissions from NSW hospital records. The response rate with respect to recruitment was only 22%, but the sample was nevertheless reasonably representative of the NSW population. Potential weaknesses included the possibility of residual reverse causality, even after removing the first 2 years’ follow-up and adjusting for the number of diagnoses at baseline. Our analysis assumes that the week of step counts recorded at baseline was typical for the participant’s usual activity. There is also an inherent limitation in the use of step counters to record overall physical activity, as they do not capture, for instance, swimming or cycling, nor do they record the intensity of activity. They do, however, capture all movement throughout the day, and we have previously shown that step counts have greater validity than a self-reported physical activity scale.12

The cost of a day in hospital in Australia in 2012–13 was $1895,13 so $550 can potentially be saved annually for each person who increases their physical activity by an achievable 4300 steps per day. These steps can be accumulated as many brief activities throughout the day, or as steady walking for about 3 kilometres. Previous investigation of the dose–response curves for various health indicators in older people has shown that the steepest part of the curve is at the lower end of activity.14 Moving from 3000 to 5000 steps per day is of greater benefit than moving from 8000 to 10 000 steps.

Health implications

Our estimates of the hospital care burden associated with varying levels of physical activity suggest that large reductions in hospital use may be possible with measures that increase community physical activity levels, such as health coaching, restricting parking availability, and better urban design.

Box 1 –
Baseline characteristics for the 2110 participants, compared with those of the standard New South Wales population aged 55–85 years (2006)

Characteristic

Participants

NSW population*

P (χ2)


Age (years), mean (SD)

66.1 (7.4)

Age group

< 0.001

55–59 years

472 (22.4%)

26.6%

60–64 years

541 (25.6%)

21.0%

65–69 years

436 (20.7%)

16.8%

70–74 years

317 (15.0%)

13.9%

75–79 years

229 (10.9%)

12.4%

80–84 years

115 (5.5%)

9.3%

Sex (men)

1026 (48.6%)

47.5%

0.31

Medications, median number (IQR)

3 (2–5)

Comorbidities, median number (IQR)

2 (1–3)

Smoker

Never

1170 (55.5%)

Former

805 (38.2%)

Current

135 (6.4%)

10.9%

< 0.001

Alcohol consumption

Teetotaller

590 (28.0%)

29.7%

0.088

Safe drinker

979 (46.4%)

Moderate drinker

151 (7.2%)

Hazardous drinker/binge

124 (5.9%)

Hazardous drinker/chronic

96 (4.6%)

Unknown

170 (8.1%)

Education level

Primary schooling only

47 (2.2%)

Secondary schooling completed

493 (23.3%)

Secondary schooling not completed

399 (18.9%)

18.4%

0.55

Trade or TAFE qualification

558 (26.5%)

21.5%

< 0.001

University or other tertiary study

490 (23.2%)

10.5%

< 0.001

Other or not applicable

123 (5.8%)


TAFE = Technical and Further Education college. * Data generated in TableBuilder (http://www.abs.gov.au/websitedbs/censushome.nsf/home/tablebuilder). † Of the 13 conditions listed in the Methods.

Box 2 –
Number of hospital bed-days for the 2110 participants, and proportions of bed-days associated with cardiovascular disease, cancer and diabetes

Number of bed-days

Proportion


Overall

All follow-up

28 876

Excluding initial 2 years

20 172

Cardiovascular disease

All follow-up

1747

6.1%

Excluding initial 2 years

1353

6.7%

Cancer

All follow-up

1794

6.2%

Excluding initial 2 years

1174

5.8%

Diabetes

All follow-up

5528

19.1%

Excluding initial 2 years

4107

20.4%


Box 3 –
Association of step count with number of bed-days, and estimated bed-days per year of follow-up (least squares means) for specific step count levels*

Incidence rate ratio (95% CI) per extra 1k steps

P

Estimated bed-days per year of follow-up (95% CI)


Q14.5k steps

Median6.6k steps

Q38.8k steps


Overall

All follow-up

0.91 (0.90–0.94)

< 0.001

1.12 (1.00–1.30)

0.93 (0.84–1.00)

0.76 (0.68–0.85)

Excluding initial 2 years

0.92 (0.90–0.95)

< 0.001

0.97 (0.84–1.10)

0.82 (0.72–0.91)

0.68 (0.60–0.80)

Cardiovascular disease

All follow-up

0.96 (0.91–1.00)

0.096

0.054 (0.04–0.07)

0.05 (0.04–0.06)

0.045 (0.03–0.06)

Excluding initial 2 years

0.97 (0.91–1.03)

0.27

0.052 (0.03–0.07)

0.049 (0.03–0.07)

0.045 (0.03–0.06)

Cancer

All follow-up

0.90 (0.83–0.98)

0.012

0.082 (0.05–0.11)

0.065 (0.04–0.09)

0.05 (0.03–0.07)

Excluding initial 2 years

0.88 (0.80–0.96)

0.005

0.058 (0.03–0.08)

0.045 (0.03–0.06)

0.034 (0.02–0.05)

Diabetes

All follow-up

0.92 (0.86–0.98)

0.013

0.11 (0.07–0.15)

0.09 (0.06–0.13)

0.08 (0.04–0.11)

Excluding initial 2 years

0.87 (0.80–0.94)

0.001

0.12 (0.07–0.17)

0.09 (0.05–0.13)

0.07 (0.03–0.10)


Q1 = first quartile; Q3 = third quartile. * After correction for age, sex, number of medications, number of comorbidities, smoking and alcohol status, and education level.

Box 4 –
Estimated numbers of bed-days per year of follow-up, by step count: A. overall; B. disease-specific

The importance of taking care of our own

I’ve read a lot of articles lately about the issues of mental health and suicide in medicine, and to those within medicine there is no surprise about the sentiment in these articles. Each one addresses a different issue, although often talks about a “profession that eats its young” or the “importance of standing up for yourself”. In times of emotional upheaval, we all want to find the root cause an issue and fix it as soon as possible. This is especially so for us physicians and surgeons, ever ready to treat illness as effectively and as quickly as possible. In this spirit, many a person is quick to the conclusion that “This is it! This is the problem! If we just fix these things everything will be better!”. I just don’t think it’s that simple. It never has been and it certainly isn’t now.

Never in my time as a doctor have I ever seen a patient and have expected them to solve their problems by themselves. And yet, this is what we often expect of our colleagues, or our colleagues think it is what’s expected of them. If someone is under-performing, too often the system assumes the problem is with them. Individually we can be kind, compassionate and caring. Collectively as a workforce, we can sometimes be cold, unfeeling and quite simply just out of time. There are systemic supports in place for the underperforming doctor, but we fall through the cracks so easily time and time again. And most of us are so busy just trying to get the job done that we don’t even notice those falling off the edge, let alone help them back up.

We have a system where unhealthy rosters make it near impossible to take leave in times of stress or crisis. We have a system in which part-time employment is practically non-existent and approaches to change this are met with 1950s attitudes about professionalism and practice. We have almost no opportunity for those who are burned out or mentally unwell to gradually return to work in a supervised and supportive manner. And we certainly don’t have a workforce in which it is OK to be mentally ill. Mentally ill doctors are outcasts; pariahs amongst scores of highly functioning practitioners. This is not helped by the fact that in all states except Western Australia, you are expected to report these critically unwell colleagues to a registration board that has an incredibly unhealthy approach to conditions and notifications, thus making the problem worse.

Personally, I’ve worked in wonderful workplaces. I’ve seen initiatives for better rostering supported. I’ve seen part-time work embraced as a way to improve training and workforce flexibility. I’ve seen a colleague supported back to work in a manner that suited their illness. But I’m concerned that while these examples exist all over the country, they are not the primary way of doing business in medicine. Healthy workplaces need to be the rule, not the exception.

There are plenty of reasons for why this is the case. We know how hypercompetitive medicine is, even after medical school. We know there is an ever-tightening workforce with fewer job prospects. We can talk about the divorce of clinical management from administrative management and the distance between clinicians and departmental rostering and staffing. But I don’t want to talk about these things. I want to move forward.

I want to talk about you about the actions that we can take. Chances are, you’re a healthy doctor-in-training, with strong social supports and an optimistic future. We are the ones who needs to stand up for our unwell colleagues. We are the ones who will be able to change the system and make the profession a healthy and sustainable one again. Don’t expect those who suffer from mental illness to make the first steps; you don’t expect it from your unwell patients and it’s cruel to expect it from your unwell colleagues. Maybe it’s something as small as a frank discussion around unhealthy rules and regulations at your hospital or practice, but it’s a start and an important one at that. Systems change isn’t just about helping those in crisis. It’s about enabling those who are doing well to help those around them.

I’m not writing this to you as a motivating plea to naively revolutionise a whole profession overnight. I’m writing this to you because I’m tired. I’m tired of seeing my friends having to deal with the onslaught of depression and anxiety that this job can bring their way. Not just for them, but because I know all too well that mental illness doesn’t discriminate, and that most of the difference between a healthy doctor and an unhealthy one is luck half the time. We’re just not that special. That’s why we need profession-wide organisations like the AMA. We can’t expect a handful of people to shoulder the burden. The whole profession has to bear it, and take ownership of the future.

You may or may not agree with my sentiment and my position in this article. But surely we can all agree that when doctors-in-training are committing suicide and leaving the profession, there is something terribly wrong with our culture and our workplaces. So let’s change it. It’s as simple, and as complicated, as that.

Until next time,

Z

Dr John Zorbas

Chair, AMA Council of Doctors in Training

Latest news

Q&A: Darren Hartnett, 2016 AMA Indigenous Peoples’ Medical Scholarship winner

Image: Former AMA President, Professor Brian Owler, presenting the scholarship to Darren Harnett at this year’s AMA National Conference.

Darren Hartnett is the recipient of the 2016 AMA Indigenous Peoples’ Medical Scholarship. The third year medical student, from the University of Newcastle, spoke to doctorportal about the scholarship, and what it means to be an Indigenous man studying medicine and soon to be working as a medical practitioner.

What’s your background, and what made you decide that you wanted to study medicine?

I have been a registered nurse since the early 90s. I have been working in intensive care, coronary care and emergency departments throughout that time, and found that I wanted to do more, hence the progression in to Medicine

What was your path to medicine?

Apart from Nursing, I enrolled into the pre-medicine course at the University of NSW to see initially if I had the ability to take on study. Also, at the same time, I enrolled in a refresher courses for biology and chemistry to brush up on the basics.

What area of medicine interests you the most?

I still really enjoy critical care, such as intensive care, emergency and anaesthetics, and see myself in those roles in the future if I am lucky enough to be accepted into those areas. In saying that, I also really enjoy the rural areas as well, so a combination of the two would be perfect for me in the future.

How did the AMA Indigenous Peoples’ Medical Scholarship help you in your studies?

Enormously! While studying medicine, I have had to work to support myself. The scholarship has lightened the load in that respect, and enabled me to focus more on studying. It enabled me to travel to Broken Hill and Menindee this year to spend time in a remote area where the indigenous population is higher to see what effect distance had on specialist treatment. Some of the cultural experiences that I had I will never forget; it was very special.

What advice would you give other Aboriginal and Torres Strait Islander students who are thinking of studying medicine?

Do it! Even if it’s just inquiring about attending a pre-medicine program to see what it’s like, or to actually enrol in a pre-medicine course. All it takes is a phone call or an email to get started.

What has your experience been of being an Indigenous doctor so far? Are there any unique challenges or advantages?

It has been very positive. The support I have been given from the staff at the Wollotuka Institute at the University of Newcastle has been fantastic. From tutoring to mentoring programs, there is always someone there for you if you need a hand. As for challenges, I think the biggest challenge is settling in to the first year, and finding a routine that suits you. After that, it’s great.

How do you think your perspective or your path to medicine has differed as an Indigenous man?

I tend not to look at treating people as individuals, but more as the treating of a community. I always look at how my actions could influence a community in a positive way with regard to healthcare. We are slowly ‘closing the gap’, but now I just want to get out there to do my bit to make a difference.

Applications for the 2017 AMA Indigenous Peoples’ Medical Scholarship close January 31, 2017. Click here for more information. 

Latest news

Stating best practice in breast cancer care

Although survival for women with breast cancer in Australia is among the highest in the world, there is evidence that not all patients are receiving the most appropriate care.

Cancer Australia has brought together evidence and expertise to support improved and informed practice in breast cancer. The Cancer Australia Statement — influencing best practice in breast cancer is based on the best available evidence and is supported by expert clinical and consumer advice. The statement represents agreed priority areas which, if implemented, will support effective, patient-centred breast cancer care and reduce unwarranted variations in practice.

The statement aims to encourage health professionals to reflect on their clinical practice to ensure that it is aligned with best practice. It also aims to encourage consumers to start conversations with their medical teams to improve their cancer experience and outcomes.

There are 12 practices in the breast cancer statement, from diagnosis across the continuum of care. The practices are identified as either appropriate or not appropriate.

A practice is appropriate if it is beneficial for patients, effective (based on valid evidence, including evidence of benefit), efficient (cost-effective) and equitable.

A practice is not appropriate if it is not consistent with the evidence, may cause potential harm or provides little benefit to patients.

The practices were chosen with the collaboration, participation and engagement of relevant clinical colleges, cancer and consumer organisations. The statement is intended to complement relevant clinical practice guidelines.

Supporting materials have been developed for the statement, including information on the value to patients, evidence base and references for each practice.

More information about the statement and recommended practices is available at canceraustralia.gov.au/statement.

Clinical quality registries have the potential to drive improvements in the appropriateness of care

The effectiveness of clinical quality registries (registries) to monitor and benchmark patient outcomes is well established.13 There is also compelling evidence for the ability of registry information to drive continuous improvements in patient outcomes and adherence to guideline-recommended care.25 Systematic and ongoing collection of standardised data on medical and surgical interventions allows the identification and analysis of clinical practice variation and its effect on patient outcomes. Registry data has credibility with clinicians, stimulating increased use of evidence-based clinical management, decreased variation in care and improved patient outcomes.2,4

Capturing a high proportion of a registry’s eligible patient population is critically important in minimising the selection bias associated with incomplete capture. A low capture rate renders the pool of results unrepresentative and ungeneralisable, thus weakening the power of a registry to inform policy determinations.3 Omissions of data within a single clinical unit create the potential for “manipulation” of included and excluded data, thus weakening the credibility of unit-level reports and their ability to drive change.

Current reporting in Australia

A small number of national registries in Australia now capture a high proportion of their eligible patient populations. These include the Australia and New Zealand Dialysis and Transplant Registry,6 the Australian Orthopaedic Association National Joint Replacement Registry,7 the adult and paediatric registries run by the Australian and New Zealand Intensive Care Society,8 the Australasian Rehabilitation Outcomes Centre9 and the Palliative Care Outcomes Collaboration.10

Examples of how these registries report on rates of appropriate or recommended care include reports from the Australia and New Zealand Dialysis and Transplant Registry, which show improvement in the preferred type of vascular access — arteriovenous fistula — for haemodialysis patients over the period 2008 to 2012 (Box 1).11

The extent of adherence to guideline-recommended care delivered in intensive care units (ICUs) across Australia is demonstrated by information provided by the Adult Patient Database8 of the Australian and New Zealand Intensive Care Society’s Centre for Outcome and Resource Evaluation. Box 2 shows the high proportion of ICU admissions for which the patient received guideline-recommended care for venous thromboembolism prophylaxis each year for 5 years.8

Data from the Australasian Rehabilitation Outcomes Centre (AROC) demonstrate improvements in a key process indicator — assessment of functional status — for rehabilitation care provided in Australian hospitals over the period from 2002, when the Centre opened, to 2015 (unpublished data provided by AROC, July 2016) (Box 3).

The Palliative Care Outcomes Collaboration (PCOC) collects data from palliative care services across Australia on the length of time palliative care patients spend in the unstable phase of illness. An unstable phase ends when a new plan of care is in place, has been reviewed, and no further changes are required. A patient is considered to have an acceptable outcome if they experience no more than 3 days of instability. Information reported by the PCOC shows a considerable improvement in palliative care services achieving this benchmark over the period 2010–2015 (unpublished data provided by PCOC, July 2016). For care provided in hospital, the proportion of patients spending no more than 3 days in the unstable phase increased from 57% in 2010 to 86% in 2015. Similarly, for patients receiving care at home, the proportion increased from 41% to 76% (Box 4).

Governments across Australia have developed a number of registries with a jurisdictional focus. The Victorian Department of Health and Human Services, in particular, has invested in a significant number of clinical quality registries. In some instances, substantial funding has been made available by other organisations such as the Victorian Transport Accident Commission, Medibank Private and the Movember Foundation. Some state-based registries such as the Victorian Cardiac Outcomes Registry and its counterparts in South Australia, Queensland and New South Wales are collaborating to develop nationally consistent datasets.

There remains, however, limited capacity across Australia to benchmark outcomes and assess the degree with which health care aligns with evidence-based practice in a number of high priority clinical domains. In 2011, Evans and colleagues conducted a national survey to determine the capacity of Australian clinical registries to accurately assess quality of care. Of 28 registries surveyed, the majority were found to require modifications to provide useful and reliable information for quality improvement purposes. Thirteen of the 28 registries (46%) recruited fewer than 80% of the eligible population. Twenty-three surveyed registries (82%) did not formally audit reliability of coding at the clinical level and five (18%) did not collect the information required for basic risk adjustment of outcome measures.12

In a 2010 systematic review of how medical registries provide information feedback to health care providers, van der Veer and colleagues confirmed findings from previous studies that process of care measures — such as adherence to guideline-recommended treatment or treatment modality, time to treatment, and use of secondary prevention medication — are more readily influenced by feedback than by outcome measures.13 However, national measurement of health care appropriateness (as measured by how closely care aligns with guidelines) in some important clinical domains such as acute coronary syndrome and stroke care has relied on intensive periods of clinical audit.14,15 This could be monitored more effectively using registries, which routinely collect a minimum dataset. Well constructed registries collect and report information on both the effectiveness of care (outcomes) and the appropriateness of care (process) on an ongoing basis, obviating the requirement for clinical audit.3,16,17

Some Australian registries are developing to the point where national auditing of clinical care will no longer be required in order to gain an accurate picture of national outcomes and patterns of care. The Australian Cardiac Outcomes Registry18 intends to develop its collection of outcomes data for patients with acute coronary syndrome along with processes of care data in line with the Guidelines for the management of acute coronary syndromes 2006.19 The recently launched Australian and New Zealand Hip Fracture Registry20 has commenced collecting data items on both effectiveness and appropriateness of care in line with the Australian and New Zealand guideline for hip fracture.21 The Australian Stroke Clinical Registry22,23 collects and reports information on the outcomes of care for stroke patients and information on processes of care in accordance with the Clinical guidelines for stroke management 2010.24 For example, Box 5 shows participating adult hospitals’ adherence to five guideline-recommended process of care indicators.

Registry reporting outside Australia

In the United Kingdom, the National Hip Fracture Database (NHFD) was developed as a collaboration between the British Orthopaedic Association (BOA) and the British Geriatrics Society (BGS). Data are collected on casemix, care processes and patient outcomes.25 Care is measured against six standards laid out in the 2007 Blue Book (clinical care standards) on the care of fragility fracture patients, including prompt admission to orthopaedic care; surgery within 48 hours and within normal working hours; nursing care aimed at minimising pressure ulcer incidence; routine access to orthogeriatric medical care; assessment and appropriate treatment to promote bone health; and falls assessment.26 In 2010, the NHFD registry became a ready-made data collection and reporting mechanism for measuring compliance with a set of clinical care standards incentivised by a best practice tariff.27 Box 6 shows the compliance with best practice for a number of clinical care standards using registry data.

The authors of the 2012 NHFD national report note:

clinical teams have used the synergy of audit, feedback and standards locally in clinical change or service development initiatives prompted and monitored by the NHFD, often with very substantial and quantifiable improvements. These include reduced mortality and reductions in length of stay, often arising from care pathway redesign and improved collaboration between surgeons, anaesthetists and ortho-geriatricians; and substantial efficiency savings that are in keeping with an important point made in the BOA/BGS Blue Book: “Looking after hip fracture patients well is cheaper than looking after them badly”.25

In the United States, the American Heart Association/American Stroke Association Stroke registry has been successful in measuring adherence to a number of agreed care processes, including deep vein thrombosis prophylaxis, antithrombotic therapy, discharge medication, dysphagia screening, stroke education, smoking cessation and assessment for rehabilitation.28 The registry has over two million patients enrolled from more than 2000 hospitals and links performance data with Medicare fee-for-service claims data. This has enabled the creation of 30-day and 1-year mortality prediction models, outcomes variation comparison across hospitals and the assessment of the impact of critical variables on outcomes of interest.28

Heart failure registries in the US collect data on clinical characteristics, patterns of hospital and outpatient care, as well as outcomes of patients admitted with this condition.4 Online tools are used to provide personally tailored feedback on performance and other quality measures against a national benchmark. Process of care improvement tools have been developed and made available in a toolkit, which includes evidence-based practice algorithms, critical pathways, standardised orders, discharge checklists, pocket cards, and chart stickers. The toolkit also includes algorithms and dosing guides for guideline-recommended therapies and a comprehensive set of patient education materials. Participation in heart failure registries in the US has been associated with substantial improvements in the use of guideline-recommended therapies for heart failure in both the inpatient and outpatient settings.4 Conformity with appropriateness measures has been shown to improve patient outcomes and disparities in care have been reduced or eliminated.4

Swedish registries have contributed to a vast amount of information used in health services research in that country.29 Many of the Swedish registries commenced operations over 20 years ago with government financial support and have been attentively maintained. Incentives are provided to hospitals complying with routine contributions to the registries. Required datasets are succinct, thereby minimising data entry burden. This has produced high participation rates which are closely representative of the eligible population. In return hospitals and clinicians are provided with high quality reports which are up to date and risk adjusted.30

Opportunities that registries provide

Well designed and managed clinical registries provide clinical information which is richer, more reliable and more credible than information generated from hospital administrative systems.31 Analyses based on clinical data are respected by clinicians and patients. A comparative review by Cohen in 2014 demonstrated that the Cardiac Care Network Registry in Ontario, Canada, provides relevant clinical details with greater accuracy when compared with administrative databases.32 Data from the registry were found to be more robust for informing best practice cardiac clinical care pathways and evidence-based cardiac procedures. Information provided by registries therefore enjoys a high level of trust by clinicians, health managers, governments, private hospital groups and funding bodies.

The use of registries to monitor health care quality and safety is supported by patients. Analyses show that as long as appropriate measures are taken to ensure data security and confidentiality, the majority of patients acknowledge the value of registries and the necessity to collect identifying data, and accept the requirement for registries to operate under opt-out consent with scope for linkage to other datasets.33

The purpose and scope of patient registries are expanding. Aside from the principal function of monitoring and benchmarking the appropriateness and effectiveness of clinical care, registries can provide the foundation for opportunities to undertake evidence-based health care reform. The potential for articulation with best practice pricing incentive schemes has been highlighted above. Registries also provide a way of generating an early warning of lowered outcomes and a means to share learnings from high performing units, such as those with lower infection rates. Examples of other opportunities provided by registries include clinician and facility performance assessment and credentialing; greater accountability and transparency through public reporting; performance-based reimbursement; value-based purchasing; the development of evidence-based practice guidelines; enhanced post-market surveillance of medical devices and pharmaceuticals; monitoring trends in utilisation and access to care; supporting cost-effectiveness studies; and the provision of infrastructure with which to conduct clinical trials and comparative effectiveness studies.5,29,34

Patient-reported outcome measures (PROMs) are increasingly being introduced into registries,35 providing a personal perspective on the expectations and impact of surgery. For example, the Victorian Severe Trauma Registry and the Victorian Prostate Cancer Registry both collect and report PROMs at a time of clinical stability. The Arthroplasty Clinical Outcomes Registry in NSW reports pre- and post-operative PROMs, and health-related quality of life, for primary and revision procedures (Box 7).36 In the UK, the National Health Service requires the routine measurement of PROMs for all patients undergoing total knee or hip arthroplasty (http://content.digital.nhs.uk/proms). In Sweden, almost all units performing total hip arthroplasty are administering PROMs before and after surgery.37 The respective registries in those countries collect and report such data.

There is increasing evidence that registries demonstrate good value for money, that is, improved health outcomes at lower cost.3840 In 2012, Larsson and colleagues calculated that if the US had a registry for hip replacement surgery that encouraged reductions in surgical revision rates comparable with those attributed, in part, to the presence of the Swedish registry, the US might have avoided $2 billion of an expected $24 billion in total costs in 2015 for these surgeries.39

Barriers to effective reporting

Barriers to registry development are well documented.4145 Adequate funding is a problem that registries share with many other health care initiatives. Funding aside, the principal barriers to the development of clinical quality registries in Australia are:

  • reluctance of some health care providers and organisations to supply source data;

  • poor interoperability between clinical information systems leading to unnecessary duplication of data entry;

  • limited availability of the skills (clinical, epidemiological, biostatistical) and resources (advanced and secure data systems) to run national registries; and

  • data governance burdens and constraints, including restrictions on the disclosure, collection, linkage and reporting of patient level data.

Notwithstanding successful efforts to develop new registries20 and improve established registries, these barriers persist for clinical groups and registry experts wishing to improve the quality of information and level of participation in registries in Australia.

Beyond the barriers

To address these barriers, the Australian Commission on Safety and Quality in Health Care worked with jurisdictional representatives and registry experts to develop a framework detailing national arrangements under which patient level data may be routinely and securely disclosed, collected, analysed and reported. The Framework for Australian clinical quality registries46 (endorsed by the Australian Health Ministers’ Advisory Council in March 2014) describes a mechanism by which government jurisdictions and private hospital groups can authorise and secure record-level data, within high priority clinical domains, to measure, monitor and report the appropriateness and effectiveness of health care. Application of the Framework to registries provides assurances to jurisdictions, private hospital groups, clinicians and patients, that registry data and the systems that hold those data have satisfied minimum security, technical and operating standards.

The establishment of a number of national clinical quality registries for high burden, high variance conditions or interventions is a cost-effective3840 way of addressing Australia’s information gaps in order to effectively monitor the appropriateness and effectiveness of health care. The development of one national registry per clinical domain — rather than multiple state and territory-based registries all attempting to monitor similar indicators — has obvious efficiencies and is more likely to attract funding. Well designed registries are an increasingly important component of clinical practice47 and health system monitoring. The provision of timely, relevant and reliable feedback about patient care to clinicians drives improvements in health care quality. Improved reporting of registry information on the appropriateness of care is likely to improve adherence to evidence-based practice.

Box 1 –
Vascular access type at initial treatment, by time to referral for haemodialysis in Australia, 2008–2012


Source: reproduced with permission from ANZDATA Annual Report 2013, Ch 5: Haemodialysis, Fig 5.75.11

Box 2 –
Proportion of admissions in which venous thromboembolism prophylaxis was administered to eligible patients within 24 hours of admission to an intensive care unit, 2010–11 to 2014–15


Source: data provided by the Australian and New Zealand Intensive Care Society, July 2016.

Box 3 –
Proportion of patients assessed for functional status (activities of daily living) within three days of admission to a hospital rehabilitation ward, 2002–2015


Source: data provided by the Australasian Rehabilitation Outcomes Centre, Australian Health Services Research Institute, University of Wollongong, July 2016.

Box 4 –
Proportion of patients in the unstable phase with an effective care plan implemented in 3 days or less


Source: data provided by the Palliative Care Outcomes Collaboration, Australian Health Services Research Institute, University of Wollongong, July 2016.

Box 5 –
Hospital adherence to process indicators for stroke care

Hospital stroke care

All episodes

Ischaemic

TIA


Patients admitted to a stroke unit

5847/7608 (77%)

3904/4583 (85%)

992/1489 (67%)

Patients who received intravenous thrombolysis (tPA) of an ischaemic stroke

na

476/4583 (10%)

na

Patients discharged (not deceased while in hospital)

6744/7400 (91%)

4115/4481 (92%)

1470/1474 (99.7%)

Patient discharged on an antihypertensive (if not deceased while in hospital)

4661/6555 (71%)

3044/4027 (76%)

969/1440 (67%)

Patients who received a care plan at discharge (if discharged home or to RACF)

2046/3713 (55%)

1122/1996 (56%)

651/1289 (51%)


Source: Australian Stroke Clinical Registry Annual Report 2013, Table 7, p.29.22 na = not applicable. RACF = residential aged care facility. TIA = transient ischaemic attack. tPA = tissue plasminogen activator. Unknowns coded as no; inpatient death determined using National Death Index data.

Box 6 –
Compliance with best practice standards for hip fracture patients in the United Kingdom, 2009–2012


Source: prepared with permission from data in the National Hip Fracture Database National Report 2012 – Supplement, Table 1.25

Box 7 –
Pre- and post-operative patient-reported outcome measures (Oxford Hip Scores [OHS]) for hip arthroplasty — all hospitals, 2013


Source: reproduced with permission from Arthroplasty Clinical Outcomes Registry, 2013 Annual Report, Fig 7.1.36