Systemic lupus erythematosus (SLE) is a chronic multisystem autoimmune disease. Predominantly affecting young women, it continues to have an unacceptably high morbidity burden.1 Its clinical heterogeneity often makes diagnosis and management challenging even for experienced physicians. Additionally, the natural history of SLE is variable, with some patients experiencing fluctuating periods of relative inactivity contrasted by disease flare while others have persistently active disease.2 The classification criteria for SLE have recently been reappraised, and the new criteria have facilitated a more robust diagnostic process. The treatment approach of early and sustained control of disease activity is likely to lead to the prevention of irreversible end-organ damage,3 which correlates with early mortality.4 Advances have also been made in the therapeutic area, based on the exciting translational research identifying new targets that develop into therapies promising to ameliorate disease activity and lessen the reliance on treatments such as glucocorticoids. Patients with SLE experience poor health-related quality of life (HR-QoL),5 which can be worse than in groups with other chronic diseases such as congestive cardiac failure, myocardial infarction and diabetes.6 The determinants of HR-QoL in SLE are complex, but there may be disease- and treatment-related factors as well as factors associated with health care provision that may be amenable to change. Here, we present an overview of the key advances made in the diagnosis and management of this challenging disease, based on a review of recently published literature in peer-reviewed journals and international guidelines.
Diagnosis
By definition, SLE is a multisystem autoimmune disease, resulting in a wide spectrum of clinical manifestations, ranging from mucocutaneous, musculoskeletal and constitutional symptoms, to potentially life-threatening manifestations such as lupus nephritis or central nervous system (CNS) involvement. The use of classification criteria in rheumatology has allowed a more consistent description of the disease for the purpose of research and surveillance, and data from large observational cohorts using these classification criteria have become the basis on which clinicians derive important prognostic and treatment information on the disease.
The new Systemic Lupus International Collaboration Clinics (SLICC) classification criteria7 provide greater sensitivity with similar specificity to the previously used American College of Rheumatology (ACR) criteria.8 The more extended clinical and laboratory items that make up the SLICC classification criteria (see a summary in Box 1, and more details in the Appendix at mja.com.au) include conditions such as transverse myelitis, autoimmune haemolytic anaemia or immune-mediated cytopenias that carry separate weighting. Whereas previously, patient’s symptoms and test results may have been labelled as undifferentiated, the new criteria allow identification of otherwise missed SLE cases; in some cases this may result in earlier diagnosis.9
Autoantibody profiling can be useful in aiding the diagnosis of SLE. Antinuclear antibodies (ANA) are present in the vast majority of patients with SLE, but are not specific and can be seen at low to moderate titres in 5–13% of the normal population.10 In Australia, ANA can be detected using either indirect immunofluorescence or enzyme-linked immunosorbent assay (ELISA). It is important to recognise that the measurement of ANA is generally expressed as a titre, which reflects the number of dilutions at which ANA can still be detected. The laboratory reference range can vary, but generally a titre of 1:160 is considered as a weak positive ANA result. In its reporting, the staining pattern of the ANA is also included to provide clues to the specific underlying autoantibody, and clinical association with certain rheumatic diseases.
Detection of antibodies to double-stranded DNA (dsDNA) or Sm antigens are more specific for SLE, particularly for lupus nephritis, and they are present in about two-thirds of cases.11 The testing of anti-dsDNA in Australia has also undergone significant change, with many clinical immunology laboratories moving away from the conventional Farr assay. Although the Farr assay is the most robust test for anti-dsDNA, particularly in its association with disease flare, the efficiency of reporting is greater with the newer tests such as ELISA, fluorescent enzyme immunoassays (FEIA) and Luminex beads.12 Clinicians should be aware of the differences between these assays in their ability to detect different anti-dsDNA subsets and in their reference ranges. Other laboratory markers that may facilitate diagnosis include the presence of hypocomplementaemia, antiphospholipid antibodies, unexplained cytopenia and a positive direct anti-globulin test result. The latter illustrates the close relationship between immune-mediated haematological disorders and SLE.13
In practice, for general practitioners and other physicians, the diagnosis of SLE should be considered in any patient presenting with inflammatory joint pain with one or more extra-articular features, as arthralgia is one of the most common clinical manifestations (Australian Lupus Registry, Monash University, unpublished data). The diagnostic process relies on taking a good history in seeking confirmation of organ involvement for a variety of organs that are typically affected by this disease and, in some cases, laboratory tests that may reveal relatively “silent” features, such as haematological or renal manifestations. ANA testing should serve as a screening test and, in the right clinical setting, further serological testing including for autoantibodies to dsDNA or Sm, antiphospholipid antibodies, complement levels, and direct anti-globulin tests, may aid diagnosis (Box 2). In the Australian context, patients of Asian ancestry and Indigenous Australians are more likely to have clinically severe disease, with higher rates of lupus nephritis and autoantibody positivity, and higher levels of overall disease activity compared with their counterparts of European ancestry.14,15
While the use of classification criteria is widely accepted as a useful way to aid in the diagnosis of SLE, it is by no means a complete list of “diagnostic criteria”. When in doubt, categorising patients as having undifferentiated connective tissue disease is always the preferred option. Rheumatologists must weigh up the risk of delayed diagnosis (as many patients with SLE can present initially with undifferentiated symptoms and laboratory test results) against the risk of over-diagnosis purely based on criteria. Many studies have shown that most patients who do not meet classification criteria (ie, “possible SLE” cases) never develop SLE.16
Management
Pharmacotherapy
Glucocorticoids
Glucocorticoids (GCs) have rapid anti-inflammatory and broad immunosuppressive effects, and are often used as an adjunct in induction therapy of serious SLE manifestations such as lupus nephritis. In many instances, however, patients continue to require maintenance therapy with GCs as well as conventional immunosuppression, although recent literature and studies underway are challenging the need for long term use of GC in treating SLE.17 Although a “safe” maintenance dose of prednisolone is still being debated, studies assessing prednisolone use in rheumatic disease have shown that doses as low as 5 mg daily significantly increase the risk of osteoporosis,18 impaired glucose tolerance,19 and infections.20 The SLE Damage Index (SDI), which measures the accumulation of comorbid conditions commonly associated with SLE or its treatment, contains items that are classically related to GC exposure and other items that do not initially appear to be related. The progression of damage as measured by the SDI is commonly known as damage accrual in SLE, which correlates well with mortality. Recent research has shown that the use of GCs can independently predict damage accrual including the non-GC related domains within the SDI.21 A large cohort study has also shown that at GC doses of 6 mg or less, there appears to be insignificant impact on damage accrual in patients with SLE.22
Hydroxychloroquine
Hydroxychloroquine has been used to treat SLE since the 1960s, and may be considered an “anchor drug” in SLE therapy, just like methotrexate in rheumatoid arthritis. It is often adequate for controlling milder manifestations of SLE, has an independent protective effect on damage accrual, and confers a survival benefit in patients with SLE.23 There are some data to suggest that this drug can improve the efficacy of other immunosuppressive medications such as mycophenolate.24 It is generally well tolerated and is not associated with increased infection risk. Long term maintenance doses should be kept within the “safe level” of lower than 5 mg/kg wherever possible. The latest recommendation for annual screening after 5 years of therapy25 allows early detection of retinopathy and can prevent serious visual loss26 (Box 3). Screening with automated visual field testing offers a sensitive way of detecting hydroxychloroquine-related retinopathy, and the greater availability of new technologies, such as spectral domain optical coherence tomography, can assist with a more specific diagnosis.25
Immunosuppression
In the past decade, there has been a significant change in the choice of induction immunosuppression for lupus nephritis. Increasingly, mycophenolate is used, as it has been shown to be equivalent to pulse cyclophosphamide in inducing remission of renal disease and preventing relapse in a number of randomised control trials (RCTs).27 It has become the preferred first-line treatment for lupus nephritis in women of childbearing age because of a lack of gonadal toxicity (Box 3). A recent observational cohort study has shown that mycophenolate is also useful in a range of non-renal manifestations.28 Cyclophosphamide remains an important immunosuppressive therapy in managing refractory nephritis and other serious manifestations such as CNS disease. The Euro-Lupus Nephritis Protocol, which consists of a lower dose and shorter duration of cyclophosphamide therapy, has comparable renal remission rates, with a better safety profile.29
Biological therapy
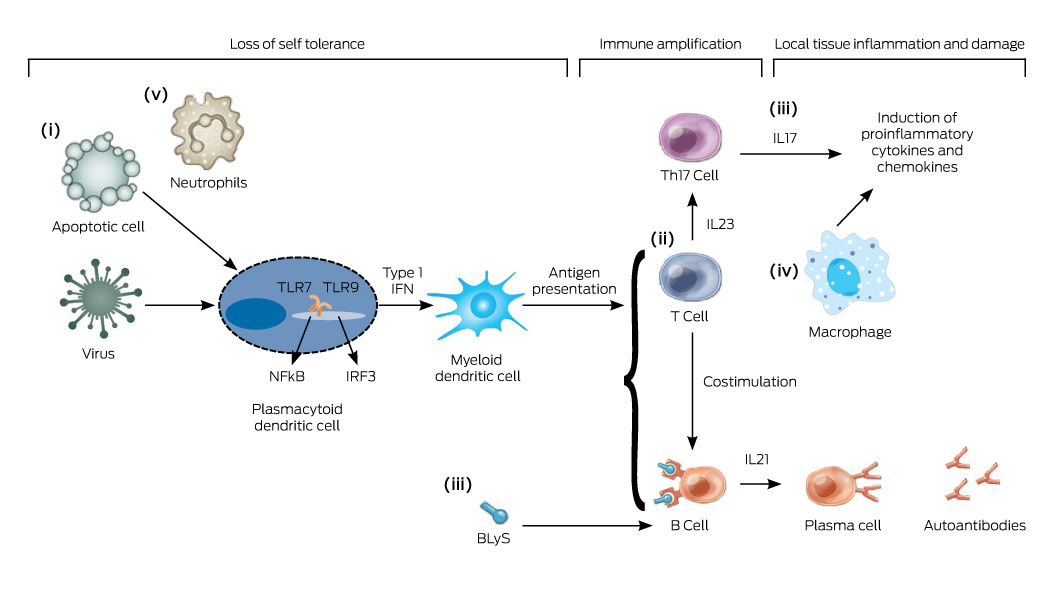
In contrast to other rheumatic diseases, such as rheumatoid arthritis and ankylosing spondylitis, there is a lag in finding an effective targeted biological therapy for treating SLE. The reasons for this are multifactorial, including SLE having a more complex immunopathogenesis (Box 4), clinical disease heterogeneity, difficult trial designs with criticisms on the role of concomitant immunosuppression and GCs, and problematic outcome measures.30 While the understanding of lupus pathogenesis continues to advance (Box 4), many therapeutic targets that have shown great potential in preclinical studies and phase 2 trials have failed to show clinical efficacy in phase 3 RCT settings. The most notable examples are abatacept,31 which blocks costimulation of T cells, and rituximab, a B cell-depleting therapy.32 Pivotal phase 3 RCTs of rituximab in SLE have failed to reach their primary efficacy endpoints,33 despite widespread anecdotal experience suggesting positive results in at least some patients. For this reason, rituximab is still used off-label as rescue therapy based on observational data.
Belimumab, a monoclonal antibody inhibiting a B cell cytokine called BLyS (B lymphocyte stimulator), has been shown in phase 3 RCTs to be efficacious and is currently registered by the Therapeutic Goods Administration (TGA) as an add-on therapy for moderate to severe SLE. Multinational phase 3 trials showed clinical and serological improvement compared with placebo, particularly in patients with active musculoskeletal and mucocutaneous disease,34 and post hoc analysis showed it to be more effective in patients with serologically active disease (a low complement level and a high concentration of antibodies to dsDNA).35 Although statistically significant, the absolute effect size of belimumab over placebo appeared to be small, and the trials excluded patients with active lupus nephritis or CNS disease. Its role in lupus treatment is still to be defined, especially given that it has not been approved by the Pharmaceutical Benefits Scheme in Australia.
Because of the encouraging results of the belimumab trials, there has been a flurry of research focusing on alternative B cell targeted therapy, albeit without much success. Most recently, blockade of the type I interferon (IFN) pathway has gained significant interest, with anifrolumab, the first anti-IFNα receptor monoclonal antibody showing clinical efficacy in a phase 3 RCT.36 The interferon pathway is implicated in the process of loss of self-tolerance, and type I IFN is known to upregulate a panel of over a hundred genes that can be measured by blood microarray analysis. The so-called IFN signature is gathered by quantitative analysis of the downstream IFN-inducible genes, and can be used as biomarker for active disease in patients with SLE.37 A simplified interferon signature metric can be used to predict treatment response.38 Novel ways to target IFN are also in development, and it is to be hoped that, in time, one of these biological therapies may become a game changer in the management of SLE.
Treat-to-target in SLE
In addition to the advances in our understanding of the biological paradigm of SLE, there has been progress in the area of clinical science that may change the way physicians manage patients with SLE in the future. Analogous to the treat-to-target approach in other chronic diseases, an international taskforce was set up to define the principle of treat-to-target in SLE.39 Apart from having target organ response criteria (eg, in lupus nephritis), significant advances have been made in defining remission and overall low disease activity in SLE. The concept of lupus low disease activity state (LLDAS) has been shown to be an achievable target, and is associated with less damage accrual.40 A large multinational prospective cohort study is underway to validate the significance of LLDAS, and to determine its predictors.41 Future studies on treatment strategy may involve newer agents, but better still, may reveal ways that we can use existing therapies more optimally. One possibility is to consider selected use of therapeutic drug monitoring for the commonly used drugs in SLE to improve their efficacy and safety.
Quality of care in SLE
The challenge of translating clinical studies into everyday practice and health care decision making is another key area of interest in SLE management. Disease outcomes in SLE can be influenced by a complex interplay between genetic, biological, socio-economic and health system variables. The ability to implement the knowledge acquired by clinical studies and published in guidelines into clinical practice is the basis of implementation research. While SLE is not necessarily a common disease, patients often require frequent interaction with the health system, sometimes with different specialists.42 The quality of health care delivery can be benchmarked in accordance with published guidelines for monitoring, treatment and preventive care in SLE, and including the frequently associated comorbid conditions.43
Based on recommendations from published guidelines, a series of quality indicators has been defined which encompasses areas of diagnosis, disease assessment, cardiovascular risk assessment, osteoporosis management, drug monitoring, renal disease monitoring, immunisation, cancer screening, and pregnancy counselling (Box 3).44 It has recently been shown that improving the quality of care for patients with SLE can have an impact on disease outcomes, such as reductions in damage accrual45 and in-hospital mortality.46 Studies are currently underway to assess performance on SLE quality indicators within the Australian health system. While we await the results of these studies, simple preventive strategies should be considered and can be implemented by any doctor involved in the care of patients with SLE.
For example, the risk of cardiovascular death for patients with SLE is more than double that of age- and sex-matched counterparts.47 In addition to the traditional cardiovascular risk factors such as hypertension, hypercholesterolemia, diabetes and smoking, the risk of cardiovascular death is further compounded by prolonged active disease and use of GCs.48 Cardiovascular risk assessment can be easily done using the widely available absolute risk calculators. Recently, the University of Toronto Lupus Clinic researchers published a modified Framingham Risk Factor Score, proposing a doubling of the traditional score to better reflect the rate of cardiovascular disease captured in their cohort.49 Clinicians should also be suspicious when patients with SLE present with symptoms that could suggest premature coronary artery or peripheral artery disease, and proceed with appropriate investigations.
Patients with SLE are at increased risk of osteoporosis and fracture due to a combination of factors, such as a chronic inflammatory state, GC use, vitamin D deficiency and premature ovarian failure.50 Therefore, vitamin D status should be assessed in patients with SLE, especially as many may be avoiding sun exposure either because of their disease or medication increasing their sun sensitivity. Existing guidelines are available for any patient who is on chronic GC therapy with regard to bone density assessment and prevention of osteoporosis with anti-resorptive therapy, depending on the severity of osteopenia.
Conclusions
SLE is a chronic multisystem autoimmune disease that results in significant morbidity and loss of life expectancy. A lack of effective targeted therapies for SLE means that most patients are still treated with chronic GC therapy and broad spectrum immunosuppression. Our understanding of the relationship between disease activity and irreversible and progressive accrual of organ damage has advanced. Earlier clinical trials assessing novel biological agents failed because of a combination of factors, but there is ongoing interest in finding the optimal way to use B cell targeted therapy, and interferon blockade has shown some early success. Emerging definitions for remission and low disease activity are promising to not only change trial design, but to allow a “treat-to-target” approach in clinical practice. Meanwhile, research into quality of care for patients with SLE will shed light on areas of deficiency in clinical practice in a real world setting, and findings could potentially lead to evidence-based system redesign.
Box 1 –
Summary of classification criteria for systemic lupus erythematosus*
|
Systemic Lupus International Collaborating Clinics (SLICC) Criteria7
|
American College of Rheumatology (ACR) Criteria8
|
|
|
Clinical criteria
|
|
|
1. Acute cutaneous lupus
|
1. Malar rash
|
|
2. Chronic cutaneous lupus
|
2. Discoid rash
|
|
3. Oral ulcers
|
3. Oral ulcers
|
|
4. Non-scarring alopecia
|
4. Photosensitivity
|
|
5. Synovitis
|
5. Non-erosive arthritis
|
|
6. Serositis
|
6. Serositis
|
|
7. Renal
|
7. Renal disorder
|
|
8. Neurologic
|
8. Neurologic disorder
|
|
9. Haemolytic anaemia
|
9. Haematologic disorder
|
|
10. Leukopenia
|
|
|
11. Thrombocytopenia
|
|
|
Laboratory criteria
|
|
|
1. Antinuclear antibody
|
1. Antinuclear antibody
|
|
2. Anti-double-stranded DNA antibody
|
2. Immunological disorders
|
|
3. Anti-Sm antibody
|
|
|
4. Antiphospholipid antibody positivity
|
|
|
5. Low complement
|
|
|
6. Direct Coombs’ test
|
|
|
Requirement for diagnosis
|
|
|
- Must meet 4 of 17 SLICC criteria (with at least one criterion being clinical and at least one criterion being immunological) OR,
- Lupus nephritis proven by biopsy and at least one immunological criterion
|
- Must meet 4 of 11 ACR criteria
|
|
|
* A more detailed classification is provided in the Appendix at mja.com.au.
|
Box 2 –
Recommendations for autoantibody profile testing in relation to systemic lupus erythematosus (SLE)
Recommendation 1
- In making the diagnosis of SLE, ANA testing may be indicated if patients present with one of the following:
- Inflammatory arthralgia/ arthritis;
- Pleurisy or pericarditis;
- Photosensitive rash;
- Haemolytic anaemia, thrombocytopenia, leucopenia;
- Raynaud’s phenomenon;
- Acute brain syndrome in a young person.
Recommendation 2
- The following supportive serological tests can be pursued in patients suspected of having SLE, after a positive finding of an ANA test:
- anti-dsDNA;
- ENA;
- C3 and C4;
- Anti-phospholipid antibodies (anticardiolipin antibodies, anti-beta-2 glycoprotein, and lupus anticoagulant);
- Direct Coomb’s tests;
- Consider ANCA, RF and anti-CCP as potential mimics.
Recommendation 3
- ANA and ENA testing should normally not be repeated as they are not of monitoring value.
- If an unexpected result is seen, or the clinical features of the patient change, then repeat testing can be considered.
ANA = antinuclear antibody; ANCA = anti-neutrophil cytoplasmic antibody; C3 = complement component 3; C4 = complement component 4; CCP = cyclic citrullinated peptide; dsDNA = double-stranded DNA; ENA = extractable nuclear antigen; RF = rheumatoid factor; SLE = systemic lupus erythematosus.
Box 3 –
Current recommendations for the management of systemic lupus erythematosus (SLE) from which quality indicator sets were derived
Diagnosis
- For a suspected diagnosis of SLE, initial workup should include testing levels of ANA, FBE and creatinine, and urinalysis.
- Once a diagnosis of SLE is made, evaluation of the baseline antibody profile should include ANA, dsDNA, Ro, La, RNP, Sm, antiphospholipid antibodies.
Disease and comorbidities monitoring
- For patients diagnosed with proliferative renal disease (Class III or IV), treatment with prednisolone and other immunosuppressant should be initiated and documented within a month, unless contraindicated.
- Disease activity should be recorded using a validated index at each visit.
- For patients with renal disease and proteinuria, or eGFR < 60 and persistent hypertension, anti-hypertensive medication should be considered.
- For patients with proteinuria > 300 mg/day, ACE inhibitor or ARB should be considered unless contraindicated.
- Presence of comorbid conditions should be recorded at each visit.
- For those requiring high-dose corticosteroids and/or immunosuppressive drugs, hepatitis B virus, hepatitis C virus and tuberculosis status should be evaluated and results recorded.
- Risk factors for cardiovascular disease including smoking, blood pressure, body mass index, diabetes and serum lipid levels should be evaluated annually.
- Damage accrual should be evaluated and documented using the Systemic Lupus International Collaborating Clinics Damage Index.
- Quality of life should be evaluated at each visit.
General preventive strategy
- Sun avoidance strategies should be discussed.
Medications-related monitoring
- For newly prescribed medication, risks versus benefits should be discussed with the patient.
- Drug toxicity should be evaluated at each visit, including review of laboratory results.
- For patients receiving prednisolone ≥ 7.5 mg/day for 3 months.
- bone mineral density testing should be done and results recorded unless the patient is already being treated with anti-resorptive therapy;
- supplemental vitamin D and calcium should be recommended.
- For patients receiving prednisolone ≥ 7.5 mg/day for 3 months, and who have a bone density test T score of ≤ −2.5 or already have a fragility fracture, an anti-resorptive or anabolic agent should be recommended.
- For patients treated with hydroxychloroquine or long term corticosteroid, an ophthalmologic assessment according to current guidelines should be followed.
- For patients taking prednisolone ≥ 10 mg/day for 3 months, an attempt should be made to taper the prednisolone dose, or to add or optimise doses of a steroid-sparing agent, unless contraindicated.
Immunisation
- For patients treated with an immunosuppressive therapy:
- annual inactivated influenza vaccination should be given unless contraindicated;
- pneumococccal vaccination should be given unless contraindicated.
Pregnancy
- Contraception and potential teratogenic risk should be discussed with women aged 18–45 years with childbearing potential who are starting therapy with methotrexate, leflunomide, mycophenolate, cyclosporine, cyclophosphamide or thalidomide.
- Antiphospholipid, Ro and La antibody levels should be documented for pregnant women with SLE.
- Women who have had an adverse pregnancy outcome due to antiphospholipid syndrome should be given aspirin and heparin/enoxaparin for any subsequent pregnancy.
ACE = angiotensin converting enzyme; ANA = antinuclear antibody; ARB = angiotensin II receptor blocker; BMI = body mass index; BP = blood pressure; dsDNA = double-stranded DNA; eGFR = estimated glomerular filtration rate; FBE = full blood examination; La = Sjögren’s-syndrome-related antigen B; RNP = ribonucleoprotein; Ro = Sjögren’s-syndrome-related antigen A; SLE = Systemic Lupus Erythematosus; SLICC = Systemic Lupus International Collaborating Clinics; Sm = Smith, as in anti-Smith antibodies. Key recommendations are based on available literature from which sets of quality indicators were derived.45
Box 4 –
Key cellular pathways in the immunopathogenesis of systemic lupus erythematosus (SLE)