Previous studies of colorectal cancer survival in New South Wales,1 South Australia,2 Queensland3 and the Northern Territory4 have found that survival tended to be poorer for Aboriginal than for non-Aboriginal people. These studies identified disease factors and less access to primary and follow-up treatments as possible reasons for the survival disparities.
The recommended treatment for colorectal cancer is generally surgery combined with adjuvant chemotherapy or radiotherapy, depending on the cancer type and extent of disease.5,6 Treatment guidelines also highlight the importance of post-surgical follow-up care, as one in three people will die from disease recurrence after initial treatment.3 However, the Australian guidelines available during the study period for this article did not describe a specific protocol for follow-up care.5,6
Our main aim was to compare the treatment and survival rates for Aboriginal and non-Aboriginal people diagnosed with colorectal cancer in NSW using routinely collected, population-based linked data. We also estimated the proportions of a sample of NSW Aboriginal people with colorectal cancer who received chemotherapy or radiotherapy.
We respectfully use the descriptor “Aboriginal people” throughout this report to refer to the original people of Australia and their descendants.
Methods
We analysed two different linked datasets, both of which have been described previously:7,8 data from the NSW Population-wide Study (2001–2007) and data from the Patterns of Care study (2001–2011). The NSW Population-wide Study data comprised incident cancer cases linked with hospital separations data and death records; the Patterns of Care study data comprised information collected in an audit of medical records of Aboriginal people with colorectal cancer (diagnosed during the period 2000–2011) linked to incident cancer cases, hospital separations data and death records. People were eligible for inclusion in the study if they were NSW residents diagnosed with primary colorectal cancer (International Classification of Diseases, revision 10, topography codes C18–C20, and International Classification of Diseases for Oncology morphology codes ending /3) and 18 years or older.
NSW Population-wide Study
Data sources
Demographic and disease information for all eligible people diagnosed with colorectal cancer during the period 2001–2007 was obtained from the NSW Central Cancer Registry. Cases were matched by the Centre for Health Record Linkage (CHeReL) with inpatient records from the NSW Admitted Patient Data Collection (APDC), death records from the NSW Registry of Births, Deaths and Marriages, and coded causes of death in Australian Bureau of Statistics (ABS) data. A person was determined to be Aboriginal if they were identified as Aboriginal in any of their linked records.
Variables for analysis
Information from the Clinical Cancer Registry included month and year of diagnosis, age at diagnosis, and spread of disease at diagnosis (reported as localised, regional, distant, or unknown). Cancers were also categorised by site (colon, rectum, or rectosigmoid junction).
Using the Accessibility and Remoteness Index for Australia (ARIA+),9 the Local Government Area (LGA) of residence of participants at diagnosis was categorised as major city, inner regional or rural (“rural” comprising outer regional, remote, and very remote). The LGA of residence at diagnosis was also assigned to a quintile of socio-economic disadvantage according to the Index of Relative Socio-economic Advantage and Disadvantage.10
We restricted our analysis to surgical treatment, both planned and emergency, as other studies have shown a high concordance between surgery recorded in the APDC and clinical audits of medical records.11
Comorbidities were any non-cancer conditions described in the Charlson Comorbidity Index12 that were recorded for any hospital admission in the 12 months before and the 6 months after diagnosis with colorectal cancer. People not admitted to hospital during this period were recorded as having “no comorbidity information available”.
Statistical methods
Analyses were performed with SAS 9.2 (SAS Institute) and R 3.0.0 (R Foundation for Statistical Computing). We used Pearson χ2 tests to compare demographic data for Aboriginal and non-Aboriginal people. Logistic regression was initially used to compare the unadjusted odds of Aboriginal and non-Aboriginal people having surgery within 12 months of diagnosis. We then fitted a multivariable model by adding the variables sex, age at diagnosis, year of diagnosis, site of cancer, spread of disease, comorbidities, socio-economic disadvantage, and place of residence.
Colorectal cancer-specific survival was analysed with cumulative incidence curves and Cox regression models. Follow-up was censored at 31 December 2008 for all people whose deaths were not recorded. People who died from other causes were censored at the date of death. Variables were entered into the model described above, with the addition of surgical treatment as a variable. We included the statistically significant interaction between surgery and Aboriginal status in the final model. The proportional hazards assumption for Aboriginal status was satisfied in the final model.13
The probabilities of having a colonoscopy between 3 months and 3 years post-surgery were estimated for Aboriginal and non-Aboriginal people with localised or regional spread at diagnosis using cumulative incidence curves, with the competing risk of death without a colonoscopy included in the analysis.14
Patterns of Care (POC) study
Variables for analysis
The information collected from 23 public hospitals and three clinical cancer registries included age, sex, year of diagnosis, spread of disease, postcode of residence, and comorbidities. Postcode of residence was used to assign quintiles of socio-economic disadvantage10,15 and ARIA+ category.9 Treatment information (surgery, chemotherapy and radiotherapy) included start and end dates, and reasons for incomplete or no treatment. We merged data for people who attended several hospitals, and data were checked for appropriate ranges of responses and any anomalies.
Ethics approval
The collection of the POC data was approved by the Royal Prince Alfred Hospital Human Research Ethics Committee (reference, 08/RPAH/374) and the Aboriginal Health and Medical Research Council (AH&MRC; reference, 636/08). Local Regional Governance Offices granted site-specific approval for data collection in participating hospitals and clinical cancer registries. Linkage of the POC data to the population datasets was approved by the NSW Population and Health Services Research Ethics Committee (reference, 2011/04/319) and the AH&MRC Ethics Committee (reference, 791/11). Analysis of the NSW population data was approved by the NSW Population and Health Services Research Ethics Committee (reference, 2006/04/004) and the AH&MRC committee (reference, 550/06).
Results
NSW Population-wide Study
Characteristics
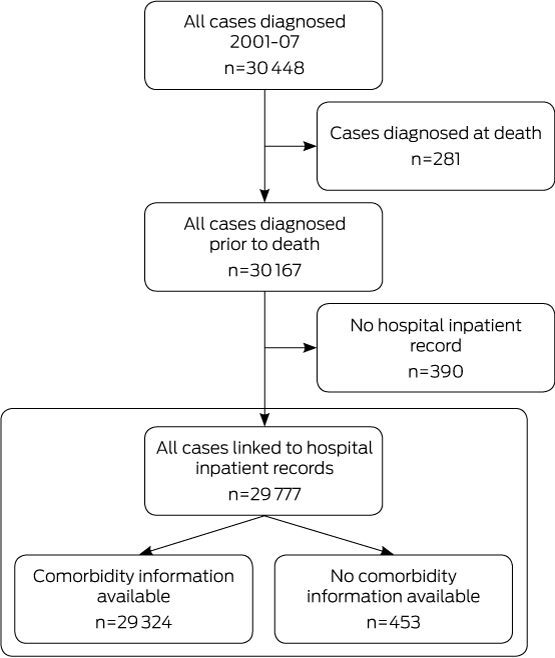
During 2001–2007, 30 448 people were diagnosed with primary colorectal cancer in NSW. We excluded 281 people notified to the Clinical Cancer Registry by death certificate only (0.9% of all cases) and 390 people (1.3%) with no matching hospital inpatient record (Box 1). This resulted in a final sample of 29 777 people, of whom 278 (0.9%) were identified as Aboriginal.
Compared with non-Aboriginal people (median age, 71 years), the Aboriginal people in our study were younger (median age, 64 years), more likely to live outside major cities and in socio-economically disadvantaged areas, and to have diabetes and chronic pulmonary disease at the time of their cancer diagnosis. Cancer site, disease spread at diagnosis, and the proportions of men and women were similar for Aboriginal and non-Aboriginal people (Box 2).
Surgical treatment
Aboriginal and non-Aboriginal people had the same median time to surgical treatment (13 days; interquartile range [IQR] for non-Aboriginal people, 1–33 days; IQR for Aboriginal people, 2–28 days), and the proportions who had received surgical treatment within 12 months of diagnosis were also similar (76% and 79% respectively) (Box 2). After accounting for differences in sex, age at diagnosis, year of diagnosis, spread of disease at diagnosis, cancer site, place of residence at diagnosis, comorbidities, and socio-economic disadvantage, there was no significant difference in the likelihood of Aboriginal and non-Aboriginal people receiving surgical treatment (odds ratio for Aboriginal people receiving surgical treatment, 0.93; 95% confidence interval [CI], 0.68–1.27).
Survival
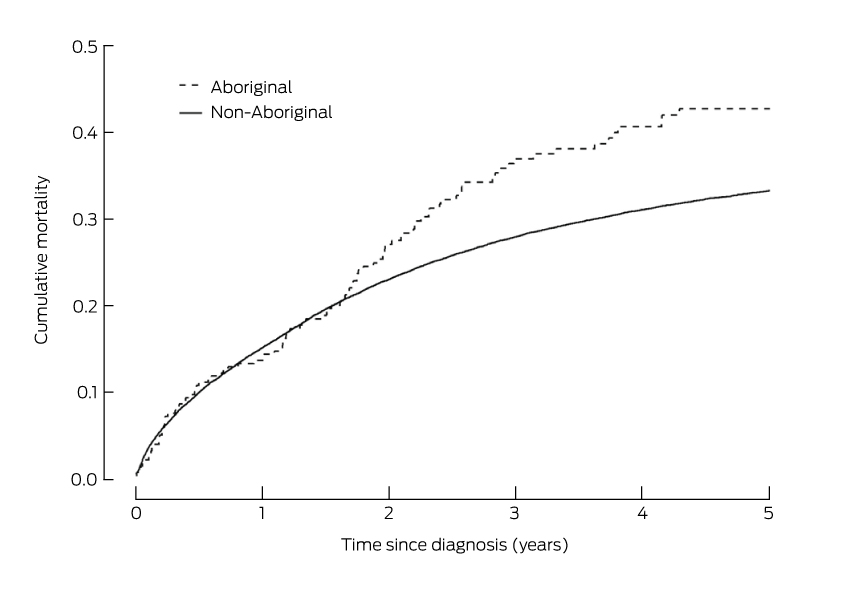
For the first 18 months after diagnosis, mortality among people with colorectal cancer was similar for Aboriginal and non-Aboriginal people (Box 3). However, from 18 months a difference between the two groups was apparent, and by 5 years after diagnosis the cumulative mortality from colorectal cancer was 43% for Aboriginal people, compared with 33% for non-Aboriginal people (Box 4).
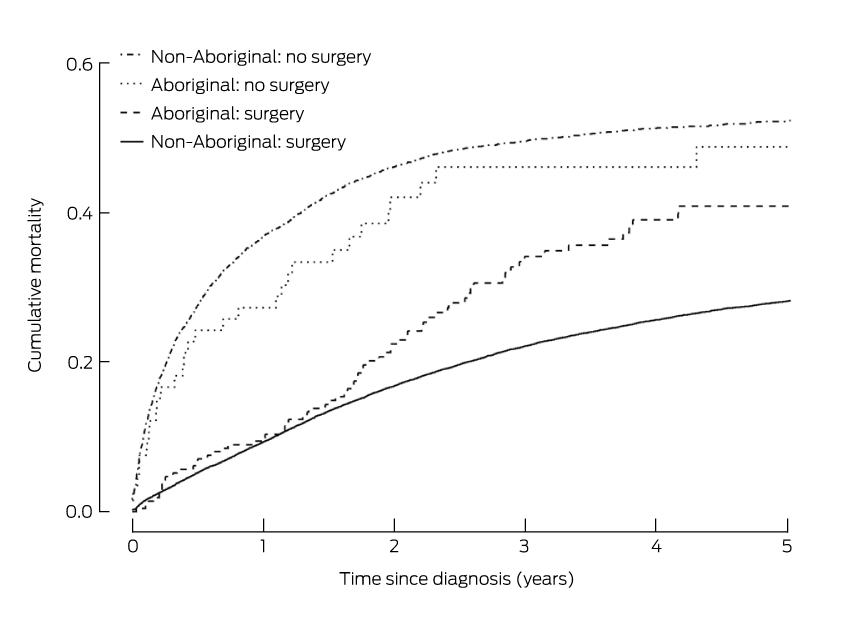
The unadjusted risk of death from colorectal cancer for Aboriginal people was 33% greater than for non-Aboriginal people (hazard ratio [HR], 1.33; 95% CI, 1.09–1.61; P = 0.006). For those who did not have surgical treatment, the risk of death after adjusting for sex, age at diagnosis, year of diagnosis, spread of disease, site of cancer, comorbidities, socio-economic disadvantage, and place of residence, was similar for Aboriginal and non-Aboriginal people (HR, 1.05; 95% CI, 0.70–1.50). However, the adjusted risk of death among those who had received surgical treatment was 68% greater for Aboriginal than for non-Aboriginal people (HR, 1.68; 95% CI, 1.32–2.09) (Box 4). The risk of death for those who had had surgical treatment was similar for Aboriginal and non-Aboriginal people during the first 18 months after diagnosis (Box 5).
Aboriginal and non-Aboriginal people who had received surgical treatment had similar rates of emergency surgery (Box 2) and median lengths of stay in hospital (10 days). During the admission for surgical treatment, 15% of Aboriginal and 13% of non-Aboriginal people had post-surgical complications (difference, 2%; 95% CI, −2.7% to 6.9%); 2% of Aboriginal people and 3% of non-Aboriginal people died within 30 days of surgery (difference, −1%; 95% CI, –2.9% to 1.2%).
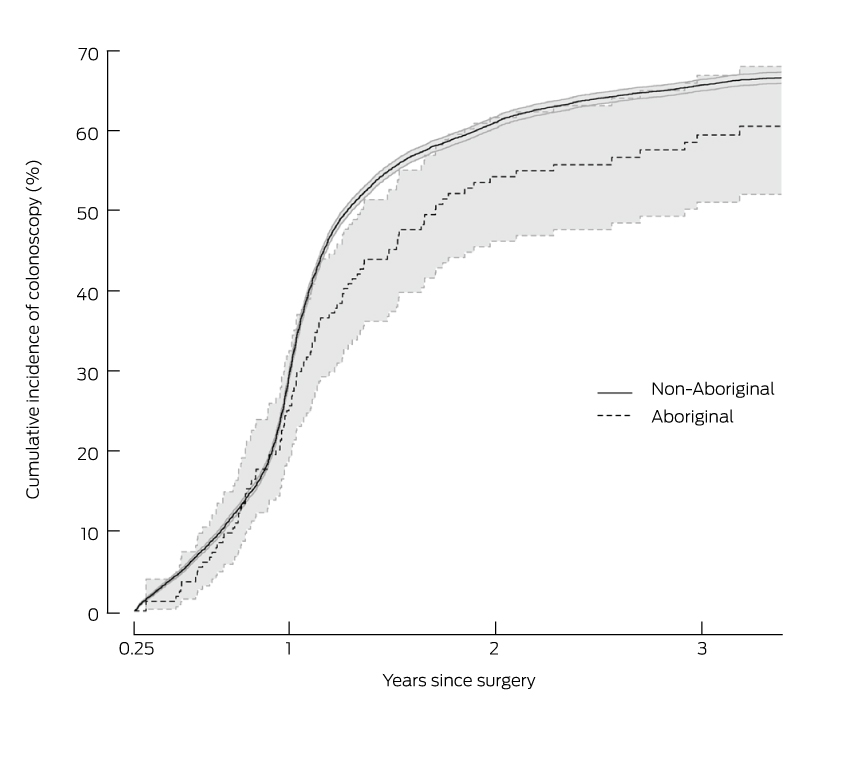
By 18 months after surgery, 45% of Aboriginal people had had a colonoscopy, compared with 55% of non-Aboriginal people (Box 6). However, the proportions after 3 years were 59% for Aboriginal people and 65% for non-Aboriginal people.
Patterns of Care study
Characteristics
Compared with the Aboriginal people recorded in the NSW Population-wide Study data, the 145 Aboriginal people with colorectal cancer whose medical records we reviewed were, on average, younger at diagnosis (median age, 61 years), more likely to live outside major cities, and less likely to have been diagnosed with rectal cancer (Box 2, Box 7). As the two samples overlapped, formal statistical comparisons could not be made.
Surgical treatment
Overall, 117 people (81%) had received surgical treatment within 12 months of diagnosis. The proportions of people receiving surgical treatment were 82% for people with colon cancer, 77% for people with rectal cancer, and 82% for people with cancer in the rectosigmoid junction.
Adjuvant chemotherapy and radiotherapy
Of those who received surgical treatment, 48% also received adjuvant chemotherapy and/or radiotherapy. Of the 56 people with regional spread of disease, ten (18%) did not receive adjuvant treatment. Reasons for not receiving adjuvant treatment included the choice of the patient, and advice from their doctor that the associated harms would probably outweigh the benefits. Of the 42 people with localised disease who had surgery, three (7%) also received adjuvant treatment.
Discussion
We found that the 5-year survival rate was lower for Aboriginal people in NSW with colorectal cancer than for non-Aboriginal people, despite their being, on average, younger at diagnosis and having a similar spread of disease, similar surgical treatment rates, and similar times to surgery. This disparity in survival was evident from 18 months after diagnosis, and was largely confined to those who had received surgical treatment, although we found no differences in post-surgical complications or in the 3-year rates of follow-up colonoscopy. We also found that the Aboriginal people in our POC data received adjuvant chemotherapy and radiotherapy at levels similar to those reported in a previous population-based survey of colorectal cancer care in NSW16,17 and in a more recent analysis of node-positive cases.18
The survival disparity was only observable from 18 months post-surgery, suggesting that Aboriginal people may have had higher rates of disease recurrence, recurrence that was not identified because of poorer follow-up, lower rates of follow-up colonoscopies to detect new tumours, or lower rates of adjuvant therapies. However, we observed no significant differences (when compared with non-Aboriginal people) in planned or emergency post-surgical admissions, or in the receipt of adjuvant therapies, and no differences in the rates of colonoscopy up to 3 years after surgery. Alternatively, the observed difference in mortality between Aboriginal and non-Aboriginal people may be due to differences in the proportions of people with microsatellite unstable tumours or to other tumour characteristics; information in this regard, however, was not available for this study.
As we found that Aboriginal people with colorectal cancer had poorer survival outcomes than non-Aboriginal people, but no obvious differences in the treatment or follow-up they received, it is plausible that small differences and delays along the treatment pathway, perhaps caused by cultural barriers, contribute to lower survival. This has been found for Māori people accessing chemotherapy for stage III colon cancer in New Zealand.19
That Aboriginal people with cancer generally have poorer survival outcomes than non-Aboriginal people with cancer has been reported by other Australian studies, with health care access and cultural differences generally being identified as factors underlying this disparity.1–3,7 The Cancer Institute NSW recently reported that Aboriginal people had a 63% increased risk of death from bowel cancer after adjusting for age and year of diagnosis and for spread of disease;1 this report did not, however, adjust for comorbidities, surgical treatment, sex, place of residence, socio-economic disadvantage, or cancer site. Similarly, a South Australian study reported that Aboriginal people with bowel cancer had a 5-year survival rate of 34.1%, compared with 56.1% for non-Aboriginal people.2 An older study of cancer survival in the Northern Territory4 attributed the higher risk of death for Aboriginal people to their having poorer access to quality health services, perhaps because of a lack of “social proximity” to these services.
Qualitative research on the health care received by Aboriginal people with cancer20 has identified several cultural barriers that may contribute to delays in their accessing mainstream health services (such as follow-up colonoscopies), including feelings of fatalism, shame, and embarrassment about colorectal cancer. More recent studies have identified lower health literacy,21 feelings of social exclusion when in hospital,22 and health services not fully responding to cultural differences as potential barriers to optimal care for Aboriginal people.23
Our analysis of the NSW Population-wide Study data is the first to include detailed information about the influence of comorbidities on surgical treatment and survival for Aboriginal people with colorectal cancer. However, it does have some limitations. First, the identification of Aboriginal people is dependent on correct recording of their status in the source datasets. As 98% of the Australian population is non-Aboriginal, the chance of positive misclassification is low, and we attempted to minimise under-identification of Aboriginal people by accepting any record of Aboriginal status in any linked record, including admissions not related to cancer. Second, using ABS information on deaths to identify Aboriginal people may have biased our survival results. In a sensitivity analysis we found, however, that using the APDC alone to determine Aboriginal status reduced the proportion of Aboriginal people who died from colorectal cancer within 5 years of diagnosis from 43% to 37%, and the overall survival patterns were similar to those reported here. Other potential sources of error include the possibility that we did not fully account for potential confounding factors that might contribute to the observed differences in survival, and measurement errors in the recording of covariates, such as comorbidities and spread of disease at the time of diagnosis. In addition, socio-economic disadvantage and place of residence were determined at the LGA level, and may thus be a source of measurement error. Further, although the POC data included more detailed information on the medical treatment of Aboriginal people with colorectal cancer than any other published study, the representativeness of the results may be limited, as we included only people from 23 hospitals and three clinical cancer registries.
Conclusion
Aboriginal people with colorectal cancer who had received surgery had lower survival rates than non-Aboriginal people, even though we found no overall differences in time to surgery, surgical rates, post-surgical complications, or receipt of adjuvant therapies or follow-up colonoscopies. However, small differences and delays along the cancer treatment pathway, possibly caused by cultural barriers to health care, may have resulted in lower survival for Aboriginal people with colorectal cancer. To ensure that survival rates improve, further work is needed to understand and reduce potential barriers to Aboriginal people with colorectal cancer receiving the best care.
Box 1 –
Inclusion and exclusion criteria for the NSW Population-wide Study of colorectal cancer diagnosed during 2001–2007 in New South Wales
Box 2 –
Comparison of socio-demographic and clinical data for 29 777 Aboriginal and non-Aboriginal people diagnosed with colorectal cancer during 2001–2007 in New South Wales
|
|
Aboriginal
|
Non-Aboriginal
|
P
|
|
Number
|
%
|
Number
|
%
|
|
|
Total number
|
278
|
|
29 499
|
|
|
|
Sex
|
|
|
|
|
0.864
|
|
Men
|
150
|
54%
|
16 068
|
54%
|
|
|
Women
|
128
|
46%
|
13 431
|
46%
|
|
|
Age at diagnosis, years
|
|
|
|
|
< 0.001
|
|
18–49
|
47
|
17%
|
1901
|
6%
|
|
|
50–59
|
49
|
18%
|
4256
|
14%
|
|
|
60–69
|
81
|
29%
|
7678
|
26%
|
|
|
70–79
|
77
|
28%
|
9216
|
31%
|
|
|
≥ 80
|
24
|
9%
|
6448
|
22%
|
|
|
Place of residence at diagnosis*
|
|
|
|
|
< 0.001
|
|
Major cities
|
114
|
41%
|
20 184
|
68%
|
|
|
Inner regional
|
103
|
37%
|
7177
|
24%
|
|
|
Rural†
|
61
|
22%
|
2138
|
7%
|
|
|
Site of cancer
|
|
|
|
|
0.555
|
|
Colon
|
174
|
63%
|
19 342
|
66%
|
|
|
Rectum
|
81
|
29%
|
7785
|
26%
|
|
|
Rectosigmoid
|
23
|
8%
|
2372
|
8%
|
|
|
Spread of disease at diagnosis
|
|
|
|
|
0.551
|
|
Localised
|
98
|
35%
|
9985
|
34%
|
|
|
Regional
|
102
|
37%
|
11 801
|
40%
|
|
|
Distant
|
54
|
19%
|
4977
|
17%
|
|
|
Unknown
|
24
|
9%
|
2736
|
9%
|
|
|
Socio-economic disadvantage*
|
|
|
|
|
< 0.001
|
|
Least disadvantaged
|
15
|
5%
|
5296
|
18%
|
|
|
Second least disadvantaged
|
34
|
12%
|
6324
|
21%
|
|
|
Third least disadvantaged
|
43
|
15%
|
4762
|
16%
|
|
|
Second most disadvantaged
|
67
|
24%
|
6218
|
21%
|
|
|
Most disadvantaged
|
119
|
43%
|
6899
|
23%
|
|
|
Comorbid conditions‡
|
|
|
|
|
|
|
Diabetes
|
56
|
21%
|
4321
|
15%
|
0.009
|
|
Cardiovascular disease§
|
52
|
19%
|
4405
|
15%
|
0.071
|
|
Chronic pulmonary disease
|
33
|
12%
|
2360
|
8%
|
0.016
|
|
Renal disease
|
14
|
5%
|
1262
|
4%
|
0.518
|
|
Liver disease
|
8
|
3%
|
810
|
3%
|
0.879
|
|
Other comorbid conditions
|
17
|
6%
|
2511
|
9%
|
0.162
|
|
Surgical treatment by 12 months post-diagnosis
|
|
|
|
|
0.480
|
|
Emergency presentation
|
36
|
13%
|
3651
|
12%
|
|
|
Planned surgical treatment
|
176
|
63%
|
19 641
|
67%
|
|
|
No surgical treatment
|
66
|
24%
|
6207
|
21%
|
|
|
|
* Based on Local Government Area of residence at time of diagnosis. † “Rural” includes outer regional, remote and very remote. ‡ Comorbidities were not available for 453 people, of whom six were Aboriginal and 447 were non-Aboriginal. § Myocardial infarction, congestive heart failure, peripheral vascular disease, or cerebrovascular disease.
|
Box 3 –
Cumulative mortality from colorectal cancer for 278 Aboriginal and 29 499 non-Aboriginal people diagnosed in New South Wales during 2001–2007
Box 4 –
Mortality and hazard ratios for death from colorectal cancer for 278 Aboriginal people, compared with those for 29 499 non-Aboriginal people in New South Wales during 2001–2007
|
|
Hazard ratios for death from colorectal cancer (v non-Aboriginal people)
|
|
Aboriginal (unadjusted)
|
1.33 (95% CI, 1.09–1.61)
|
|
Aboriginal (adjusted)*
|
|
|
Surgical treatment
|
1.68 (95% CI, 1.32–2.09)
|
|
No surgical treatment
|
1.05 (95% CI, 0.70–1.50)
|
|
Unadjusted mortality 5 years after diagnosis
|
|
Aboriginal
|
43%
|
|
Non-Aboriginal
|
33%
|
|
|
* Adjusted for sex, age at diagnosis, year of diagnosis, place or residence, site of cancer, spread of disease at diagnosis, socio-economic disadvantage, and comorbid conditions.
|
Box 5 –
Cumulative mortality from colorectal cancer for 278 Aboriginal and 29 499 non-Aboriginal people diagnosed in New South Wales during 2001–2007, by surgical treatment received
Box 6 –
Cumulative incidence of colonoscopy after surgery for colorectal cancer for 212 Aboriginal and 23 292 non-Aboriginal people diagnosed in New South Wales during 2001–2007*
Box 7 –
Characteristics of 145 Aboriginal people in the Patterns of Care Study data diagnosed with colorectal cancer in New South Wales during 2001–2010
|
|
Number
|
%
|
|
|
Sex
|
|
|
|
Men
|
83
|
57%
|
|
Women
|
62
|
43%
|
|
Age at diagnosis, years
|
|
|
|
18–49
|
38
|
26%
|
|
50–59
|
27
|
19%
|
|
60–69
|
50
|
34%
|
|
70–79
|
25
|
17%
|
|
≥ 80
|
5
|
3%
|
|
Place of residence at diagnosis*
|
|
|
|
Major cities
|
44
|
30%
|
|
Inner regional
|
42
|
29%
|
|
Rural†
|
59
|
41%
|
|
Site of cancer
|
|
|
|
Colon
|
88
|
61%
|
|
Rectum
|
35
|
24%
|
|
Rectosigmoid
|
22
|
15%
|
|
Spread of disease at diagnosis
|
|
|
|
Localised
|
51
|
35%
|
|
Regional
|
57
|
39%
|
|
Distant
|
34
|
23%
|
|
Unknown
|
3
|
2%
|
|
Socio-economic disadvantage*
|
|
|
|
Least disadvantaged
|
3
|
2%
|
|
Second least disadvantaged
|
14
|
10%
|
|
Third least disadvantaged
|
30
|
21%
|
|
Second most disadvantaged
|
42
|
29%
|
|
Most disadvantaged
|
56
|
39%
|
|
Comorbidities‡
|
|
|
|
Diabetes
|
26
|
18%
|
|
Cardiovascular disease
|
25
|
17%
|
|
Chronic pulmonary disease
|
28
|
19%
|
|
Liver disease
|
6
|
4%
|
|
Other comorbid conditions
|
7
|
5%
|
|
Tumour size at diagnosis, mm
|
|
|
|
0–29
|
24
|
17%
|
|
30–44
|
28
|
19%
|
|
45–59
|
30
|
21%
|
|
≥ 60
|
29
|
20%
|
|
Not available
|
34
|
23%
|
|
|
* Based on postcode of residence at time of diagnosis. † “Rural” includes outer regional, remote and very remote. ‡ Comorbidities not available for five people.
|

 more_vert