×

Trends in the prevalence of hepatitis B infection among women giving birth in New South Wales

The known In NSW, HBV vaccination of infants born to women at high risk commenced in 1987, and catch-up vaccination programs for adolescents in 1999. 

The new Among women giving birth, targeted infant and school-based adolescent vaccination programs were associated with an 80% decline in HBV prevalence among Indigenous women by 2012. HBV prevalence in Indigenous women was higher in rural and remote NSW than in major cities, but among non-Indigenous and overseas-born women it was higher in cities. 

The implications HBV prevention programs for Indigenous Australians should focus on regional and remote NSW and those for migrant populations on major cities. Antenatal HBV screening can be used to monitor population HBV prevalence and the impact of vaccination programs. 

Chronic infection with the hepatitis B virus (HBV) can cause serious liver disease, and contributes worldwide to a significant burden of disease. Most chronic infections are acquired early in life, predominantly by maternal transmission.1 While its prevalence in Australia is generally considered to be low (under 2%), the prevalence of HBV infections in Aboriginal and Torres Strait Islander (hereafter: Indigenous)2 people and in some migrant populations3 has been substantial.

A three-dose vaccine that is 95% effective in preventing HBV infection4 has been available in Australia since the early 1980s.5 In New South Wales, a targeted HBV vaccination program commenced in 1987.6 The program offered vaccination for babies born to parents from population groups considered to be at higher risk of HBV infection (defined as HBV prevalence ≥ 5%), including Indigenous Australians.7 In 1997, the National Health and Medical Research Council recommended universal HBV catch-up vaccination of children aged 10–16 years;8 in NSW, this was provided from 1999 to adolescents born since 1983 by general practitioners.9 The National Immunisation Program Schedule included universal infant HBV vaccination from May 2000. During 2004–2013, this was complemented by a NSW-wide school-based HBV vaccination catch-up program for year 7 students (born since 1991; online Appendix 1).5,7 In NSW, coverage through the universal infant program was reported to have exceeded 95% since 2003,10 and about 60% of eligible children not vaccinated as infants had been vaccinated through the school-based catch-up program in 2011 and 2012.11

To assess the impact of the vaccination programs on HBV prevalence in NSW, we determined its prevalence in women giving birth, as in Australia they are routinely screened for HBV during pregnancy.12 Our methodology was similar to that used in earlier studies that linked records of women giving birth and HBV infection notifications.2,3

Methods

Data sources and linkage

Data from two statutory registers were linked. The NSW Perinatal Data Collection (PDC) records all births in NSW of babies of at least 400 grams birth weight or 20 weeks’ gestation. The PDC contains details about the mother, such as year and country of birth, parity, postcode of residence, and Indigenous status, and about the birth, including the date of delivery and outcome. The NSW Notifiable Conditions Information Management System (NCIMS) is a population-based surveillance system that records reports of conditions deemed notifiable under the NSW Public Health Acts 1991 and 2010.13,14 The Act requires notification to NCIMS by any laboratory detecting HBV surface antigen (HBsAg), a marker of HBV infection, in a specimen submitted for diagnostic testing. The NCIMS records personal details, including date of birth, sex, postcode, and classification of the report as newly acquired hepatitis B infection or infection of unspecified duration (based on standard definitions15), notification date, and either the estimated onset date or date of the diagnostic test.

PDC records of women giving birth between January 1994 and December 2012 and NCIMS HBV notifications for the same period were available. Records from the two registers were linked by probabilistic matching of personal identifying details; this was conducted by the NSW Centre for Health Record Linkage (CHeReL), independently of the study investigators, to whom de-identified, linked data were provided for analysis. The reported false positive and negative rates for CHeReL linkage are about 0.5%.16

Study population and definitions

After linkage, we restricted our study population to women resident in NSW — using their postcode on the PDC record — of reproductive age (10–55 years at time of giving birth) who gave birth to their first child (ie, parity null) between January 2000 (when routine antenatal screening for HBV began17) and December 2012.

A woman was defined as having a chronic HBV infection at the delivery of her first child if there was at least one linked HBV notification in the NCIMS database that was recorded as unspecified and with a notification date earlier than the delivery date. Women with no linked HBV notifications were assumed to be not infected with HBV. Women with an HBV infection notified as being acute were excluded from the analysis, as it was unknown whether they would have cleared their acute infection or progressed to a chronic infection.

Statistical analysis

Women were categorised into four groups by their year of birth, which determined the likelihood of their being included in an HBV vaccination program: pre-vaccination era (maternal year of birth, 1981 or earlier); catch-up vaccination, predominantly GP-administered (1982–1987); at-risk newborn vaccination (1988–1991); and universal school-based catch-up and at-risk newborn vaccination (1992–1999; online Appendix 1). No women in our analyses were born during the period of universal HBV vaccination of newborns (from May 2000).

We also classified the women as Indigenous Australian, non-Indigenous Australian-born, or overseas-born women, based on their PDC record. For Indigenous status, we enhanced reporting in the PDC by linkage to other PDC records.18 Records with missing country of birth data (2090 records, 0.4% of all records) were placed in the “born overseas” category.

We calculated crude HBV prevalence for the four maternal year-of-birth categories, and used logistic regression to examine the relationship between these categories and HBV infection. We adjusted analyses for year of giving birth (in 5-year intervals) to account for possible temporal trends in HBV prevalence,2 and for the mother’s area of residence (two categories, based on residential postcode in the PDC record: major cities and regional/remote, according to the Accessibility/Remoteness Index of Australia19), as HBV prevalence in Australia varies between regions.3 The two most recent maternal year-of-birth categories (1988–1991, 1992–1999) were combined (1988–1999) for the logistic regression analysis because the numbers of records in the individual groups were small.

Ethics approval

The study was approved by the NSW Population and Health Services Research Ethics Committee (reference, 2009/11/193) and the Aboriginal Health and Medical Research Council Human Research Ethics Committee (reference, 841/12).

Results

Between January 2000 and December 2012, 482 998 women residing in NSW gave birth to their first child (PDC data); 54 were linked to an acute HBV notification and excluded from further analysis. Of the remaining 482 944 records, 11 738 (2.4%) were Indigenous Australian women, 319 629 (66.2%) were non-Indigenous Australian-born women, and 151 577 (31.4%) were born overseas. A linked unspecified HBV notification before the date of birth of their first child was available for 3383 women (HBV prevalence, 0.70%; 95% confidence interval [CI], 0.68–0.72%). HBV prevalence was estimated as 0.79% (95% CI, 0.63–0.95%) for Indigenous Australian women, 0.11% (95% CI, 0.09–0.12%) for non-Indigenous Australian-born women, and 1.95% (95% CI, 1.88–2.02%) for overseas-born women.

For Indigenous Australian women, the prevalence of HBV infection was significantly lower for those who were eligible for universal school-based or at-risk newborn vaccination (born between 1992 and 1999) than for women born during the pre-vaccination period (≤ 1981): 0.15% (95% CI, 0.00–0.35%) v 1.31% (95% CI, 0.91–1.71%; for trend, P < 0.001). For non-Indigenous Australian-born women, the prevalence also declined, but the fall was not statistically significant: from 0.10% (95% CI, 0.09–0.11%) to 0.04% (95% CI, 0.00–0.09%; for trend, P = 0.5). There was no significant trend for overseas-born women between the two periods (P = 0.1) (Box 1, online Appendix 2).

In analyses adjusted for year of giving birth and region of residence (Box 2), the proportion of Indigenous Australian women notified as having an HBV infection was 80% lower for those eligible for vaccination as part of the at-risk infant or universal school-based vaccination programs (born 1988–1999) than for women born during the pre-vaccination period (1981 or earlier) (adjusted odds ratio [aOR], 0.20; 95% CI, 0.09–0.48). There was no significant change for non-Indigenous Australian-born women (aOR, 0.87; 95% CI, 0.54–1.44). For overseas-born women, the number of notifications was significantly higher for women born during 1988–1999 than for those born before 1981 (aOR, 1.38; 95% CI, 1.15–1.67).

Box 2 also shows that HBV notifications were more frequent for Indigenous women living in regional and remote areas than for those in major cities (aOR, 2.23; 95% CI, 1.40–3.57). The opposite applied to non-Indigenous Australian-born (aOR, 0.39, 95% CI, 0.28–0.55) and overseas-born women (aOR, 0.61; 95% CI, 0.49–0.77).

The study timeframe and inclusion criteria (first births during 2000–2012) meant that the mean age of mothers was lower in later than in earlier birth year groups. After adjusting for maternal birth year groups, a significant decline in HBV notifications among Indigenous women of about 30% was still detected (aOR for each 5-year period, 0.69; 95% CI, 0.49–0.97; P = 0.03). A decline for overseas-born women was also found, but it was much smaller (aOR, 0.89; 95% CI, 0.84–0.93; P < 0.001), and there was no change for non-Indigenous Australian-born women (aOR, 0.99; 95% CI, 0.84–1.16; P = 0.90; Box 2).

To further explore the changes in HBV prevalence in overseas-born women, HBV notifications were also analysed by maternal year of birth and region of birth (Box 3). The highest proportions of women with HBV notifications were for those born in North-East Asia, South-East Asia, and sub-Saharan Africa. The small sample sizes made comparisons of trends across maternal year of birth less robust, but a consistent increase in HBV notification rates was observed for women born in North-East Asia and sub-Saharan Africa (for each trend, P < 0.001).

Discussion

This is the largest study to examine differences in HBV notification rates for women born before and after the introduction of HBV vaccination programs in Australia, analysed by country of birth, Indigenous status, and region of residence. We found that HBV notification rates for Indigenous women born after the introduction of targeted infant HBV vaccination were 80% lower than for those born earlier. For non-Indigenous Australian-born and overseas-born women there were no consistent associations between HBV notification rates and HBV vaccination programs in NSW. Despite limited data about the level of HBV vaccination coverage achieved when the at-risk newborn vaccination program was introduced in NSW in 1987, our findings suggest that it was highly successful. The estimates of HBV notification rates in Indigenous women were substantially lower among those born after 1987 than among women born before the start of the program (Box 1). It is notable that the 80% decline we report matches the 79% reduction found by a study that compared Indigenous women in the Northern Territory born before and after the introduction of universal newborn vaccination,2 suggesting that the targeted program was highly effective in reaching those at risk. The estimated fall is also similar to the results of investigations in other countries of the impact of universal newborn vaccination programs.20,21

A lack of consistent trend in HBV notifications among non-Indigenous Australian-born women might be expected, as the notification rate in this population before the introduction of vaccination was considerably lower than for Indigenous women. Further, most non-Indigenous women born during 1988–1999 would have been eligible only for school-based catch-up vaccination, which is less effective in preventing chronic disease than infant vaccination. Interpreting the relationship between birth cohorts and HBV prevalence in overseas-born women was complicated by a number of factors, including the differing prevalence of HBV in the regions from which overseas-born women migrated, their age at migration, and the lack of information about receipt of vaccination in their country of origin. When analysed by region of origin, the observed changes in notification rates could reflect either varying local uptake of infant HBV vaccination or differences in the populations that have migrated to Australia from particular regions over the 13-year study period. The smaller numbers of women involved in each group, however, limit our ability to draw conclusions.

Regional differences in HBV prevalence were also observed. Indigenous Australian women in regional and remote NSW were more likely to be HBV-seropositive than those in urban areas, whereas the reverse was true for non-Indigenous Australian-born and overseas-born women. These differences in HBV prevalence have been described previously in Indigenous Australians,2 but the reasons underlying them are unclear. The colonisation process and the institutional racial discrimination that Indigenous Australians experience affect their health outcomes, mediated by a number of different pathways, including unequal access to health care, housing and employment.22,23 As access to primary health care services relative to need is lowest in remote areas, and proportionately more Indigenous than non-Indigenous Australians live in remote areas,24 these factors may contribute to higher HBV prevalence among Indigenous women in rural and remote areas. In addition, an uncommon, more virulent HBV subgenotype circulates among Indigenous Australians in the NT, perhaps reducing the efficacy of vaccination;25 the distribution of this subgenotype in NSW, however, is unknown.

The higher prevalence of HBV among urban than regional non-Indigenous women may be related to the higher proportions of women in cities who inject drugs or are in prison, both risk factors for acute HBV infection.26 For women born overseas, the difference might be related to the fact that a greater proportion of migrants from high HBV prevalence countries (such as Asia) reside in urban than in regional and remote areas (online Appendix 3).27

It was not possible in our ecological study to take into account interactions between the effects of age and calendar year on HBV notification. Women who were born more recently, and therefore more likely to have been vaccinated, would have been younger at the time of our linkage, but also potentially subject to different risks of exposure at a given age. Including the year a woman gave birth as a factor in the regression model for Indigenous Australian women led to a small reduction in the effect of maternal birth year on HBV prevalence, and HBV prevalence was lower for more recent year of giving birth, after adjusting for maternal year of birth (Box 2). This suggests that temporal trends other than the effect of maternal birth year may have contributed to the decline in HBV notifications for Indigenous Australian women, although residual confounding related to inadequate adjustment for maternal birth year effects cannot be excluded. A similar trend, but of smaller magnitude, was seen among overseas-born women.

Antenatal screening for HBV infection enabled us to systematically assess HBV prevalence in a large population of women. Study limitations include our focus on women giving birth; our conclusions may not be generalisable to other women or to men, but we expect that the overall trends would be similar. We were unable to assess the impact of universal newborn vaccination on HBV notifications, as no women born after 2000 had given birth during the study period. Further, the ecological nature of our analyses depended on assumptions about the exposure of individuals to different vaccination strategies according to year of birth, whereas individual level vaccination data would assist us more reliably quantify their effects. Interpreting changes in HBV prevalence by country or region of birth was further limited by a lack of information about when women migrated to Australia. Some HBV notifications classified as “unspecified” may actually have been acute infections, but their frequency should not have differed between maternal birth year groups, and would therefore not have affected our estimates of HBV prevalence. Finally, linkage errors are possible, but their rate is known to be low.

Conclusion

Analysing routine antenatal HBV screening data is a simple and cost-effective method for monitoring changes in HBV prevalence in both the general population and in some high risk populations. The newborn and childhood HBV vaccination programs in NSW have had a significant impact on HBV prevalence in Indigenous Australian women, but it is still substantially higher than among non-Indigenous women. HBV infection prevention programs for high risk groups should be targeted differently, with those for Indigenous Australians focused on regional and remote NSW, and those for migrant populations on major cities. Finally, our analysis could be repeated periodically to assess the ongoing impact of universal newborn HBV vaccination and future targeted programs on HBV prevalence in Australia.

Box 1 –
Hepatitis B notifications for primiparous women giving birth, by maternal birth year, New South Wales, 2000–2012
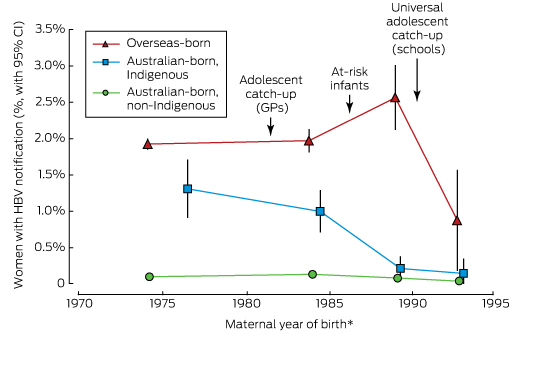

* HBV notification rates plotted against the median maternal year of birth for each maternal year of birth category (≤ 1981, 1982–1987, 1988–1991, 1992–1999).

Box 2 –
Association between HBV notifications* and maternal year of birth, year of giving birth, and region of residence

Median age (years)

Number of women


Univariate analysis


Multivariate analysis


Giving birth

Giving birth, with HBV record

Odds ratio (95% CI)

P

Adjusted odds ratio (95% CI)

P


Australian-born women, Indigenous

Maternal year of birth

≤ 1981

27.4

3057

40 (1.3%)

1

< 0.001

1

0.002

1982–1987

20.8

4509

45 (1.0%)

0.76 (0.50–1.17)

0.79 (0.51–1.23)

1988–1999

18.8

4172

8 (0.2%)

0.15 (0.07–0.31)

0.20 (0.09–0.48)

Region of residence

Major cities

4916

24 (0.5%)

1

0.002

1

< 0.001

Regional/remote

6752

69 (1.0%)

2.08 (1.31–3.32)

2.23 (1.40–3.57)

Year of giving birth (per 5 years)

0.45 (0.34–0.61)

0.69 (0.49–0.97)

0.03

Australian-born women, non-Indigenous

Maternal year of birth

≤ 1981

30.7

227 608

227 (0.1%)

1

0.50

1

0.10

1982–1987

23.6

67 762

91 (0.1%)

1.35 (1.06–1.72)

1.47 (1.14–1.91)

1988–1999

19.9

24 259

18 (0.1%)

0.74 (0.46–1.20)

0.87 (0.54–1.44)

Region of residence

Major cities

242 392

298 (0.1%)

1

< 0.001

1

< 0.001

Regional/remote

77 195

38 (0.0%)

0.40 (0.29–0.56)

0.39 (0.28–0.55)

Year of giving birth (per 5 years)

1.04 (0.90–1.20)

0.99 (0.84–1.16)

0.90

Overseas-born women

Maternal year of birth

≤ 1981

31.7

116 659

2245 (1.9%)

1

0.10

1

0.001

1982–1987

25.2

29 431

580 (2.0%)

1.03 (0.93–1.12)

1.11 (1.01–1.22)

1988–1999

20.9

5487

129 (2.4%)

1.23 (1.03–1.47)

1.38 (1.15–1.67)

Region of residence

Major cities

144 926

2872 (2.0%)

1

< 0.001

1

< 0.001

Regional/remote

6621

82 (1.2%)

0.62 (0.50–0.77)

0.61 (0.49–0.77)

Year of giving birth (per 5 years)

0.92 (0.88–0.96)

0.89 (0.84–0.93)

< 0.001


* For the purposes of our analysis: defined as a record in the NSW Notifiable Conditions Information Management System of the detection of hepatitis B surface antigen (HBsAg) between January 1994 and December 2012 with the infection classified as being of unspecified duration (or not newly acquired). † For trend across categories of maternal birth year, calculated using the median maternal year of birth in each category. ‡ Adjusted for maternal year of birth, region of residence, and year of giving birth (5-year intervals).

Box 3 –
HBV notifications for non-Australian-born women giving birth for the first time, by region of birth

Mother’s region of birth

Maternal year of birth


≤ 1981


1982–1987


1988–1999


Number of women

Proportion with HBV record (95% CI)

Number of women

Proportion with HBV record (95% CI)

Number of women

Proportion with HBV record (95% CI)


North-East Asia

21 159

4.4% (4.2–4.7%)

4455

5.4% (4.7–6.1%)

583

11.2% (8.8–14.0%)

South-East Asia

22 824

4.3% (4.2–4.7%)

4596

4.5% (4.0–5.2%)

680

4.1% (2.9–5.9%)

Oceania (excluding Australia)

12 124

1.1% (0.9–1.2%)

3335

1.0% (0.7–1.4%)

1260

0.7% (0.4–1.4%)

Sub-Saharan Africa

4409

0.9% (0.6–1.2%)

965

3.0% (2.1–4.3%)

244

4.9% (2.8–8.4%)

North Africa or Middle East

9064

0.6% (0.5–0.8%)

4592

0.5% (0.3–0.8%)

1368

0.9% (0.5–1.5%)

South or Central Asia

12 268

0.3% (0.3–0.5%)

7292

0.4% (0.3–0.6%)

831

0.2% (0.1–0.9%)

Europe

25 899

0.2% (0.1–0.2%)

2764

0.4% (0.3–0.8%)

303

0.3% (0.1–1.9%)

Americas

7262

0.04% (0.0–0.1%)

1084

0.3% (0.1–0.8%)

126

0.0% (0.0–3.0%)

Other

1650

0.6% (0.3–1.0%)

348

0.9% (0.3–2.5%)

92

0.0% (0.0–4.0%)


First confirmed case of transfusion-transmitted hepatitis E in Australia

Clinical record

In July 2014, a 6-year-old boy underwent a split liver transplant following liver failure of unknown cause and received 18 blood components peri-operatively. In January 2015, routine monitoring revealed elevated levels of serum liver enzymes (alanine aminotransferase, 289 U/L; reference interval, < 30 U/L). Two biopsies showed possible but inconclusive evidence of rejection, and alanine aminotransferase levels continued to rise, reaching 1170 U/L, despite anti-rejection treatment. Hepatitis E virus (HEV) testing was performed on a third biopsy sample and HEV RNA was detected by reverse transcription polymerase chain reaction. Retrospective testing of the patient’s blood and liver samples showed that he was HEV RNA negative before transplantation, but HEV RNA positive in post-transplant blood from September 2014. After 3 months of ribavirin therapy, the patient’s liver enzyme levels normalised and HEV RNA became undetectable.

The patient had not consumed uncooked pork products and had no history of contact with swine, a known zoonotic HEV source, or overseas travel. HEV RNA was not detected in donor liver samples tested retrospectively. In July 2015, the case was referred to the Australian Red Cross Blood Service (Blood Service) for investigation into possible transmission by transfusion. HEV RNA and IgG testing was performed on archived samples from all 18 blood donations manufactured into the transfused components. HEV RNA was detected in one donation manufactured into a transfused fresh frozen plasma component. The donor of this component reported no symptoms but had travelled to the south of France, a known high HEV prevalence area,1 in the 2 months before donation and had eaten local pork products. The timing of travel was consistent with overseas-acquired infection and donation during the infectious period. HEV IgG was detected in a subsequent donation with RNA clearance, demonstrating seroconversion. This, together with molecular characterisation of patient and blood product HEV (see the Appendix at mja.com.au), strongly supported transmission by transfusion.

Hepatitis E virus (HEV) is a single-stranded RNA virus spread by various routes — including faecal–oral, foodborne, bloodborne, mother to child during pregnancy or birth, and animals to humans — typically causing a self-limiting viral hepatitis after an incubation period of 2–6 weeks.1 Chronic HEV infection has been identified almost exclusively among immunocompromised people and has been found to lead to cirrhosis in liver transplant patients.1 However, early recognition and addition of ribavirin treatment has generally good outcomes with viral clearance.2

Hepatitis E is a disease of emerging importance in developed nations,1 especially in the context of blood donation. HEV is a known transfusion-transmission agent,3 and the prevalence of asymptomatic blood donor viraemia internationally has been found to be considerably higher than expected. England has reported a viraemic prevalence of 1 in 28483 blood donors, and the Netherlands has reported a prevalence of 1 in 762.4 In addition, the potential for adverse outcomes is highest in immunosuppressed recipients who typically receive blood components. Laboratory testing for HEV is not performed on Australian blood donors during the donation process.

We report the first confirmed case of the transmission of HEV by transfusion in Australia; although transmission by transfusion was not definitely excluded in a previously described case.5 The risk that HEV poses to blood safety is specific to the Australian context. Hepatitis E is a rarely notified disease in Australia with about 30–40 notifications to health authorities each year.6 The vast majority of HEV infections notified in Australia are acquired overseas. Asymptomatic infections from most overseas-acquired infections are expected to be covered by existing Blood Service malarial risk travel deferrals, which prevent donation for fresh component manufacture for 4 months.7 However, the assumption that locally acquired infections are rare may be influenced by past external laboratory practice, where testing for HEV infection only occurred in individuals with a history of overseas travel.6 Given that infection with HEV genotype 3 has a high asymptomatic proportion — reportedly as high as 98%1 — the true infection burden in the Australian population remains unknown.

A preliminary Blood Service study found a rate of HEV viraemia of 1 in 14 799 donations,8 which is considerably lower than in other countries such as the United Kingdom that supply an HEV-safe inventory for high risk recipients. Compared internationally, adverse outcomes from transfusion-transmitted HEV in Australia are likely to be a rare event and Australia’s blood supply is at considerably lower risk. In Australia, potential risk management approaches include options such as accepting the risk as tolerable, HEV-specific travel deferrals, universal screening, and targeted screening for high risk recipients. Quarantine and donor deferrals have very limited effectiveness for infections with a high asymptomatic proportion. To guide risk management, the Blood Service has commenced a large Australia-wide HEV RNA prevalence study in blood donors. In the interim, given the uncertain incidence of HEV infection in Australia, we suggest that clinicians remain alert to the possibility of HEV infection, especially in immunosuppressed patients.

Lessons from practice

  • Hepatitis E is a disease of emerging importance for blood safety in developed nations, with the published prevalence of blood donor viraemia reported to be approximately 1 in 750 in the Netherlands, 1 in 3000 in England and 1 in 15 000 in Australia.

  • HEV is a known transfusion-transmissible agent; while the risk in Australia is low compared with other countries, we report the first confirmed Australian case of transmission by transfusion.

  • Chronic infection can occur in immunocompromised individuals and may lead to cirrhosis; however, early recognition and treatment generally results in viral clearance.

  • Clinicians should remain alert to the possibility of HEV infection, particularly in immunocompromised patients.

Dangerous toys: the expanding problem of water-absorbing beads

Water-absorbing beads are made from superabsorbent polymer, and can swell to 400 times their original size when immersed in water. They begin as small pellets (1–15 mm) but expand to as much as 6 cm in diameter (Box 1).1,2 Water beads have been marketed for some time for decorative and horticultural purposes, but have recently been promoted as toys (fairy eggs, dragon eggs, jelly beads, water orbs, hydro orbs, polymer beads, gel beads) and as learning aids for autistic children. Due to their progressive expansion after being immersed in fluids, they present a unique foreign body challenge. While most objects that pass the pylorus will also pass through the rest of the gastrointestinal tract, water-absorbing beads that pass the pylorus can later pose an obstruction risk as they swell. There have been reports of serious bowel obstruction (including one death) in children ingesting water beads.1,3,4

We examined cases reported to the New South Wales Poisons Information Centre (NSWPIC) in which children (0–14 years old) had ingested water beads. The NSWPIC database has been described previously.5 We extracted cases for a 12.5-year period (January 2004 – June 2016) in which “bead” or “ball” was mentioned in the substance field, and then manually reviewed records for inclusion. Ethics approval was obtained from the Human Research Ethics Committee of the Sydney Children’s Hospitals Network (reference, LNR/16/SCHN/44).

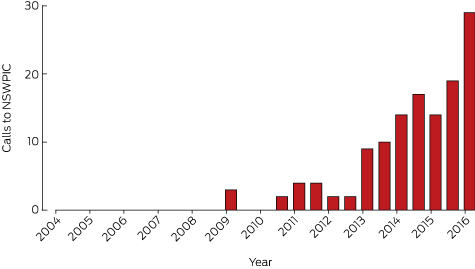
Since 2004, 129 incidents involving water-absorbing beads were reported to the NSWPIC. Call numbers have increased rapidly in recent years, with 112 exposures (87%) occurring since 2013 (Box 2). Age was recorded in 117 cases; the median was 24 months (interquartile range, 18–48 months). Fifty per cent of the patients (65) were boys, 46% (59) were girls, and sex was not recorded for five cases. Three children were documented as having autism. Most cases were managed at home, with callers advised to watch for signs of obstruction, but 16 calls originated from hospitals, while a further five patients were referred to hospital. Ten children had symptoms suggesting possible obstruction (vomiting, abdominal pain, constipation) that developed between 6 hours and 5 days after ingestion.

Our study indicates that water beads are an emerging foreign body risk to Australian children. The Australian Competition and Consumer Commission has issued a warning, urging companies not to market water beads as toys, and alerting consumers of the risks.2 While the polymer is non-toxic, it is important for clinicians to recognise the unique challenge posed by these products. They are radiolucent, but other imaging modalities, including ultrasound and computed tomography, are potential options for their detection.1 The NSWPIC does not routinely make follow-up calls, so the outcomes of the cases described here are unknown, but serious complications have been reported in other cases, including water beads lodged in the jejunum1 or distal ileum3 requiring surgical removal. A 6-month-old infant with a jejunal obstruction underwent surgical removal, but developed an anastomotic leak and died of sepsis.4 Patients ingesting multiple or larger sized beads are at increased risk of obstruction, and early hospital referral should be considered. Any patient who has ingested a water bead and has gastrointestinal symptoms should be assessed for potential obstruction.

Box 1 –
Three differently sized water-absorbing beads before (lower row) and after (upper row) immersion in water

Box 2 –
Calls to the New South Wales Poisons Information Centre (NSWPIC) about incidents in which water-absorbing beads were swallowed, January 2004 – June 2016*


* Call numbers are displayed as half-yearly counts.

Young-onset colorectal cancer in New South Wales: a population-based study

The known The incidence of young-onset colorectal cancer (yCRC) is increasing in developed countries. 

The new The incidence of yCRC is currently stable in NSW. Rectal and distal colon cancer is more common in younger patients. Cancer-specific survival is better for younger than for older patients, despite more advanced disease at diagnosis. 

The implications 6% of all CRC occurs in people under 50 years of age, who are not eligible for the National Bowel Cancer Screening Program. Health professionals should be alert to alarm symptoms in younger patients that would allow earlier detection and treatment of CRC. 

In 2012, more than 1.3 million people had colorectal cancer (CRC) worldwide, and there were 694 000 associated deaths.1 While the incidence of CRC is increasing rapidly in countries with transitioning economies, probably because of increased exposure to risk factors associated with rising prosperity, including dietary and lifestyle factors,2 it appears to have plateaued in developed countries.3,4 However, recent studies in the United States and Europe57 have identified an alarming increase in incidence among adults under 50 years of age; indeed, 2–9% of all new cases of CRC worldwide are diagnosed in people under 50.4,8 In the US, certain ethnic groups, including African Americans and Hispanics, are disproportionately represented in this age group.9,10

Australia, which shares a similar Western lifestyle with the US and Europe, has the highest incidence of CRC in the world.1 However, population-based data on incidence trends and outcomes for patients under 50 years of age in Australia are limited. Conflicting findings have been reported from studies that have evaluated different time periods, and that were limited by their use of aggregated data11 or the lack of survival outcomes.12 Therefore, our aim was to conduct a population-based study that assessed the incidence of CRC in younger adults in New South Wales, the demographic and clinico-pathological characteristics of these patients, and their survival.

Methods

Study population

The study population included all cases of adenocarcinoma of the colon and rectum diagnosed in NSW (resident population [2008], 7 million) between 1 January 2001 and 31 December 2008.

Data sources

Data on newly diagnosed cases of CRC were obtained from the NSW Central Cancer Registry, a statutory registry that contains information on patient demographic characteristics, cancer diagnosis, and date and cause of death for each new case of cancer diagnosed in NSW, based on mandatory notifications by public and private hospitals. At the time of extraction in 2012, complete data were available only for 2001–2008. Mortality data were obtained from death registrations by the NSW Registry of Births Deaths and Marriages to 2012, allowing calculation of 5-year survival for the entire cohort. The diagnosis, topography and morphology for each cancer diagnosis were coded according to the International Classification of Diseases, version 10, Australian modification (ICD-10-AM) and the third edition of the World Health Organization International Classification of Diseases for Oncology (ICD-O-3).

Study outcomes and factors

The primary outcomes of interest were the incidence of CRC, trends in incidence, cancer spread at presentation, and cancer-specific survival. The main study factor of interest was age at diagnosis, dichotomised into patients under 50 years of age (young-onset colorectal cancer, yCRC) and patients aged 50 years or more. Explanatory variables examined included CRC, stratified into cancers of the colon (ICD-10-AM C18.0, C18.2–C18.9; with right colon defined as caecum [C18.0], ascending colon [C18.2] and hepatic flexure [C18.3]), the rectosigmoid (ICD-10-AM C19.9), and the rectum (ICD-10-AM C20.9); age at diagnosis; sex; country of birth; socio-economic status; and geographic remoteness. Socio-economic status, based on the postcode of residence, was derived from the Australian Bureau of Statistics’ Index of Relative Socio-economic Disadvantage13 and aggregated into quintiles, ranging from “least disadvantaged” (quintile 1) to the “most disadvantaged” (quintile 5). Similarly, area of residence was assigned to one of five categories (major cities, inner regional, outer regional, remote and very remote), based on the Accessibility and Remoteness Index of Australia (ARIA+).14 Disease spread, defined as the maximum extent of disease at diagnosis, was assessed; spread at diagnosis was defined as the maximum extent of disease, and is reported as localised, regional, distant (metastatic), or unknown.

Statistical analyses

Overall age-specific CRC incidence rates were calculated, stratified by age group and CRC type. Rates were then standardised to the NSW population at 30 June 2001 and expressed as numbers per 100 000 people. Poisson regression assessed the average annual linear trend in incidence rates of CRC by diagnosis age group, corrected for overdispersion. Crude associations between diagnosis age group and each potential risk factor for cancer were assessed in cross-tabulations and χ2 tests. Unadjusted median and 5-year survival estimates for cancer-specific mortality were determined, and presented as product limit Kaplan–Meier survival curves. The association between age at time of diagnosis and cancer-specific mortality was assessed by multivariable Cox regression, adjusted for potential confounding by explanatory variables. Proportional hazards assumptions were assessed graphically and statistically, including testing time-dependent covariates, with final models satisfying the assumptions. Adjusted hazard ratios (aHRs) and 95% confidence intervals [CIs] were calculated. Analyses were conducted in SAS 9.4 (SAS Institute) and Stata/IC 13.0 (StataCorp). P < 0.05 was deemed statistically significant.

Ethics approval

This study was approved by the NSW Population and Health Services Research Ethics Committee (reference, 2012-06-020).

Results

Demographic characteristics of the study population

A total of 32 178 new cases of colorectal adenocarcinoma were diagnosed in NSW during 2001–2008. At diagnosis, 2001 patients (6.2%) were under 50 years of age (including 1491 [74.5%] aged 40–49 years); 30 177 patients (93.8%) were 50 years old or more. Most patients in each age group were men, and their proportion was greater among the older patients (≥ 50 years, 55.7%; < 50 years, 51.5%). A greater proportion of patients with yCRC lived in the city (72.1% v 66.9% for older patients), were born outside Australia (31.1% v 28.9%), and lived in postcodes in the lowest socio-economic quintile (19.5% v 18.1%; Box 1).

Trend in incidence of CRC

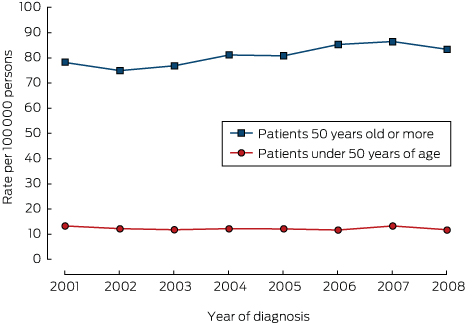
There was no significant change in the overall incidence of yCRC (2001, 13.7 cases per 100 000 population; 2008, 11.8 per 100 000; P = 0.26; Box 2). Further, there was no change in incidence in younger subsets of the yCRC cohort (under 40 years of age, P = 0.17; 40–49 years of age, P = 0.59; data not shown). For people over 50 years of age, there was a small increase in the incidence of CRC, from 79.0 per 100 000 population in 2001 to 83.4 per 100 000 in 2008 (P = 0.045; Box 2). There were no significant changes in the incidence of CRC in specific locations over time (colon, P = 0.21; rectosigmoid, P = 0.44; rectum, P = 0.85; data not shown).

Tumour site, spread and histopathology

In patients with yCRC, most tumours were in the distal colon and rectum; 71.5% of tumours were located distal to the splenic flexure. Rectal cancer was more common in those with yCRC than in older patients (34.4% v 26.0%). In contrast, tumours in the right colon were more frequent in patients over 50 years of age (28.4% v 19.3%). A higher proportion of patients with yCRC had advanced disease; distant disease was more common than in patients over 50 years of age (21.2% v 15.3%), and localised disease more frequent in patients older than 50 years (35.3% v 28.6%; Box 1).

Survival

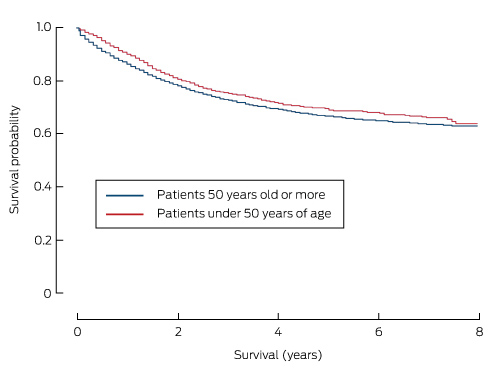
Death attributed to CRC was the most common cause of death in both age groups (Box 1). Overall 5-year survival was significantly higher for patients with yCRC (67.1% [95% CI, 64.5–69.6%] v 55.8% [95% CI, 55.0–56.4%] for those over 50 years of age; P < 0.001). As a result, patients with yCRC had a 33% lower risk of dying from their disease than those over 50 years of age (adjusted hazard ratio [aHR], 0.67; 95% CI, 0.61–0.74). Additionally, 5-year cancer-specific survival was also slightly higher for patients with yCRC (68.8% [95% CI, 66.2–71.2%]) than for those over 50 years of age (66.3% [95% CI, 65.6–67.0%]; P < 0.001; Box 3), but was similar to 5-year cancer-specific survival for patients aged 50–59 years (69.7%; 95% CI, 68.0–71.3%).

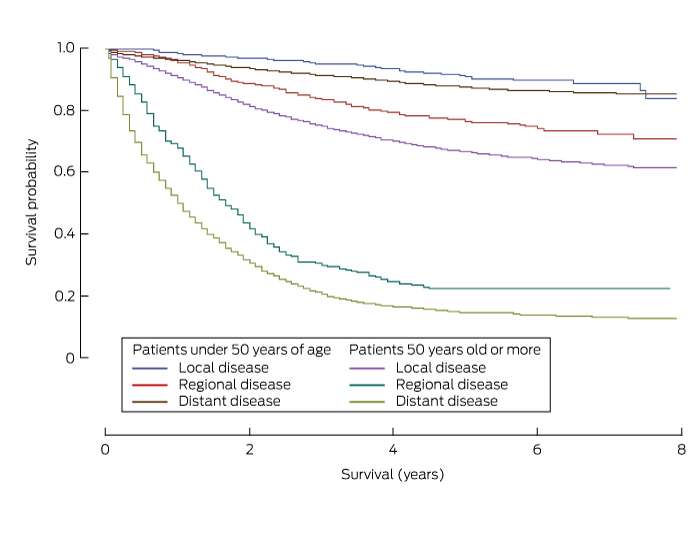
Five-year survival was consistently higher for patients with yCRC than for patients aged 50 years or more for each of the clinical, demographic and pathological parameters analysed (Box 4). Survival was also greater for patients with colon cancer than for those with rectosigmoid cancer, survival with which was in turn higher than that for patients with rectal cancer (Box 4). Additionally, 5-year survival varied significantly with spread of disease; it was highest for those with localised cancer (yCRC, 90.9% [95% CI, 87.2–93.5%]; over 50 years of age, 87.6% [95% CI, 86.7–88.4%]) than for those with regional disease (yCRC, 76.6% [95% CI, 72.7–80.0%]; over 50 years of age, 66.7% [95% CI, 65.6–67.8%]) or distant disease (yCRC, 22.3% [95% CI, 17.5–27.5%]; over 50 years of age, 14.6% [95% CI, 13.3–16.0%]) (Box 4, Box 5).

Factors associated with cancer-specific mortality in patients with yCRC

In patients with yCRC, cancer-specific mortality was higher for those from disadvantaged areas (quintile 1 v quintiles 2–4: aHR, 1.39; 95% CI, 1.16–1.92), those with increased spread of disease (regional spread v localised: aHR, 2.97; 95% CI, 2.07–4.24; distant spread v localised: aHR, 17.60; 95% CI, 12.49–24.81), and those who did not undergo surgery within 3 months of diagnosis (aHR, 1.88; 95% CI, 1.53–2.29) (Box 6). In contrast, cancer-specific mortality was lower for patients with yCRC who were born outside Australia (aHR, 0.80; 95% CI, 0.66–0.98) (Box 6).

Discussion

This population-based study shows that there was no increase during 2001–2008 in the incidence of CRC in patients less than 50 years of age. Young patients with CRC were more often from disadvantaged and urban backgrounds and born overseas than older patients with CRC, and they presented more frequently with left-sided and rectal cancers, with greater spread at diagnosis than those aged 50 years or more. However, adjusted 5-year survival for patients with yCRC was better than for older patients, and the risk of cancer-specific mortality was also significantly lower.

The overall incidence of CRC has plateaued in many developed countries.4 Indeed, both incidence and mortality have fallen in the US, and this has been attributed to screening programs, reducing exposure to risk factors, and better treatment.15 Despite these improvements, the incidence of yCRC is rising in the US5 and Europe,6 perhaps the consequence of young people being increasingly exposed earlier in life to known risk factors, including obesity, inactivity, fast food consumption, and diabetes.4,7

Australia has the highest incidence of CRC in the world1 and its urban lifestyle is similar to that of the US and Europe. Nevertheless, we did not find an increase in the incidence of yCRC across the study period. Our finding is consistent with that of another, smaller population-based study in Victoria, which found that 7% of all cases of colorectal cancer diagnosed during 2000–2010 were in people under 50 years of age, and that there had been no increase in incidence.12 In contrast, a recent analysis of aggregated 5-year data from both the National and the South Australia Cancer Registries found an increase in incidence in subgroups of patients with yCRC; specifically, an increase was noted for patients under 40 years of age, although the incidence was stable or falling in those over 40 years of age.11 This difference in reported trend is probably explained by differences in the baseline incidence rate during the two relevant study periods (1990–2010 in the South Australian study, 2001–2008 in our study).

The apparent lack of an increase in the incidence of yCRC in NSW cannot be explained by information available to our study. However, the impact of rising rates of obesity and diabetes in Australian children16 on the incidence of CRC in young adults may yet to be realised. Further, certain ethnic groups are disproportionately represented among American patients with yCRC,9,10 but differences in immigration patterns mean that the ethnic make-up of the Australian population is different.

In our study, a higher proportion of patients with yCRC than of older patients lived in cities and in lower socio-economic status postcodes. Low socio-economic status and urban residence, in addition to migration to high risk countries, have all been identified as risk factors for CRC.3,17 Patients with yCRC were more likely to present with greater spread of disease at diagnosis, with 22% having distant disease, consistent with studies that also found that younger patients had often had symptoms for several months.18,19 We were unable to determine the prevalence of symptoms in patients with yCRC, but more than 70% of tumours were distal to the splenic flexure and 34% were in the rectum, consistent with findings of previous studies,7 including one in Australia.10 Large population studies have identified that survival is poorer for patients with rectal cancers than for those with right colon tumours.20

The screening of asymptomatic individuals over 50 years of age has been credited with reducing the incidence and mortality of CRC,15 and it has been argued that screening programs should be expanded to include younger adults.21 However, we found that the rates of CRC in Australia are much lower in adults under 50 years of age (12 per 100 000 population in 2008) than in those over 50 years of age (83 per 100 000). The cost of screening for CRC in Australia is estimated to be $25 000–$41 667 for each year of life gained.22 However, the cost of each life year gained would be higher were screening extended to 40–49-year-old people, as there is a lower incidence of adenoma in younger patients.23

yCRC has been described as having a particularly aggressive phenotype, with adverse pathological features and lower survival.18,24 We found, however, that stage-adjusted cancer-specific survival in patients with yCRC was better than for older patients. Indeed, the risk of CRC-related death was 33% lower, and 5-year survival was greater. Increased survival may be the result of otherwise better general health than in older patients, or of the greater likelihood of being selected for and completing adjuvant chemotherapy treatment.17 Although encouraging, longer term (10-year) survival data are needed to confirm that this benefit is sustained, particularly as many patients with yCRC have advanced disease at diagnosis, and their condition may subsequently deteriorate if disease recurs after more than 5 years.25

The strength of our investigation was that it was a large population-based study of almost 7 million people over nearly a decade, employing robust data collection methods and long term survival data. However, there were some limitations. We did not have detailed clinical or pathology reports for each patient, and we were not able to determine the contribution of genetic conditions to CRC in the younger patients. Although major genetic components are implicated in fewer than 5% of all CRC cases, this proportion may be higher for patients with yCRC.

In conclusion, the incidence of yCRC in NSW did not increase during 2001–2008. Patients with yCRC accounted for 6% of all CRC cases; they presented with distal tumours and advanced disease more often than did older patients with CRC. People under 50 years of age are not eligible for the National Bowel Cancer Screening Program, so health professionals should be alert to alarm symptoms in younger patients (eg, persistent unexplained bleeding per rectum or change in bowel habit) that would allow earlier detection and treatment of CRC.

Box 1 –
Demographic characteristics of the study population, and clinico-pathologic characteristics of newly diagnosed cases of colorectal cancer, New South Wales, 2001–2008, by age group

Demographic and clinical characteristics

Less than 50 years old


50 years old or more


P

Total


Number

%

Number

%

Number

%


Total number of patients

2001

30 177

32 178

Age group

< 30 years

109

5.5%

109

0.3%

30–39 years

401

20.0%

501

1.2%

40–49 years

1491

74.5%

1491

4.6%

50–59 years

4747

15.7%

4747

14.8%

60–69 years

8619

28.6%

8619

26.8%

70–79 years

10 127

33.6%

10 127

31.5%

80–89 years

6003

19.9%

6003

18.7%

≥ 90 years

681

2.3%

681

2.1%

Sex

0.002

Male

1030

51.5%

16,810

55.7%

17 840

55.4%

Female

971

48.5%

13,367

44.3%

14 338

44.6%

Country of birth

0.008

Australia

1378

68.9%

21 438

71.0%

22 816

70.9%

Outside Australia

623

31.1%

8739

28.9%

9362

29.1%

Geographic remoteness

< 0.001

Major cities

1443

72.1%

20 202

66.9%

21 645

67.3%

Inner regional

414

20.7%

7442

24.7%

7856

24.4%

Outer regional

131

6.6%

2381

7.9%

2512

7.8%

Remote/very remote

13

0.6%

152

0.5%

165

0.5%

Socio-economic status (quintiles)

< 0.001

1 (least disadvantaged)

392

19.6%

6118

20.3%

6510

20.2%

2

423

21.1%

5206

17.3%

5629

17.5%

3

366

18.3%

6334

21.0%

6700

20.8%

4

430

21.5%

7064

23.4%

7494

23.3%

5 (most disadvantaged)

390

19.5%

5455

18.1%

5845

18.2%

Spread at diagnosis

< 0.001

Localised

572

28.6%

10 651

35.3%

11 223

34.9%

Regional

861

43.0%

12 605

41.8%

13 466

41.8%

Distant

444

21.2%

4621

15.3%

5065

15.7%

Unknown

124

6.2%

2300

7.6%

2424

7.5%

Tumour location

< 0.001

Colon

Right colon

386

19.3%

9029

28.4%

8967

27.9%

Transverse

104

5.2%

2284

7.1%

2260

7.0%

Left colon

120

6.0%

1885

5.9%

1898

5.9%

Sigmoid

420

21.0%

6415

19.9%

6426

20.0%

Unspecified

80

4.0%

1425

4.5%

1425

4.4%

Rectosigmoid

203

10.1%

2476

8.2%

2679

8.3%

Rectal

688

34.4%

7835

26.0%

8523

26.5%

Cause of death

< 0.001

Missing/alive

1490

74.5%

19 541

64.8%

21 031

65.4%

Colon cancer

259

12.9%

5121

17.0%

5380

16.7%

Rectal cancer

225

11.2%

2555

8.5%

2780

8.6%

Other cancer

7

0.4%

647

2.3%

654

2.0%

Non-cancer death

13

0.7%

2194

7.7%

2207

6.9%

Unknown cause of death

7

0.3%

119

0.4%

126

0.4%


Box 2 –
Incidence of colorectal cancer, New South Wales, 2001–2008, by age group


For colorectal cancer in persons under 50 years of age, each extra year was associated with an estimated 2.6% reduction in incidence (Poisson regression test for trend: exp[β] = 1.026; 95% CI, 0.985–1.068; P = 0.26); for colorectal cancer in persons aged 50 years or more, each extra year is associated with an estimated 5.0% increase in incidence (exp[β] = 1.050; 95% CI, 1.010–1.096; P = 0.045).

Box 3 –
Cancer-specific survival curves for patients with colorectal cancer, New South Wales, 2001–2008, by age group

Box 4 –
Five-year survival rates for patients with colorectal cancer, New South Wales, 2001–2008

Demographic and clinical characteristics

Five-year survival (95% CI)


P

Less than 50 years old

50 years old or more


Age group

< 0.001

< 30 years

65.6% (52.6–75.8%)

30–39 years

70.1% (64.3–75.1%)

40–49 years

68.6% (65.5–71.4%)

50–59 years

69.7% (68.0–71.3%)

60–69 years

70.2% (69.0–71.5%)

70–79 years

66.6% (65.4–67.8%)

80–89 years

58.8% (57.1–60.5%)

≥ 90 years

45.1% (38.9–51.1%)

Sex

0.03

Male

67.7% (63.9–71.1%)

65.8% (64.9–66.8%)

Female

69.2% (65.6–72.7%)

66.9% (65.9–67.9%)

Country of birth

< 0.001

Australia

66.9% (63.7–69.9%)

65.6% (64.8–66.4%)

Outside Australia

72.9% (68.4–76.9%)

68.1% (66.8–69.3%)

Geographic remoteness

< 0.001

Urban

69.6% (66.6–72.4%)

66.9% (66.0–67.7%)

Rural

66.1% (61.1–70.7%)

65.3% (64.0–66.4%)

Socio-economic status

< 0.001

Quintile 1 (least disadvantaged)

73.4% (67.6–78.3%)

68.8% (67.3–70.2%)

Quintiles 2–5

67.6% (64.7–70.3%)

65.7% (64.9–66.4%)

Cancer type

0.007

Colon

69.9% (66.4–73.0%)

66.5% (65.6–67.3%)

Rectosigmoid

67.7% (58.5–75.4%)

66.9% (64.5–69.3%)

Rectal

66.0% (61.2–70.3%)

65.7% (64.3–67.1%)

Spread at diagnosis

< 0.001

Localised

90.9% (87.2–93.5%)

87.6% (86.7–88.4%)

Regional

76.6% (72.7–80.0%)

66.7% (65.6–67.8%)

Distant

22.3% (17.5–27.5%)

14.6% (13.3–16.0%)

Colorectal surgery within 3 months of diagnosis

< 0.001

Yes

73.0% (70.2–75.6%)

70.0% (69.2–70.7%)

No

53.4% (47.4–59.1%)

52.8% (51.3–54.3%)


Box 5 –
Cancer-specific survival curves for patients with colorectal cancer, New South Wales, 2001–2008, by stage of diagnosis and age group

Box 6 –
Factors associated with cancer-specific mortality for patients with young-onset colorectal cancer, New South Wales, 2001–2008

Demographic and clinical characteristics

Deaths


Hazard ratio (95% CI)


Number

%

Crude

Adjusted*


Number of patients

481

Age group (years)

< 30 years

27

5.6%

1.11 (0.75–1.65)

1.26 (0.85–1.86)

30–39 years

98

20.3%

0.99 (0.79–1.24)

0.94 (0.75–1.17)

40–49 years

356

74.0%

1

1

Sex

Male

250

52.0%

1.02 (0.86–1.22)

1.07 (0.90–1.29)

Female

231

48.0%

1

1

Country of birth

Australia

349

72.6%

1

1

Outside Australia

132

27.4%

0.81 (0.66–0.99)

0.80 (0.66–0.98)

Geographic remoteness

Urban

337

70.1%

1

1

Rural

144

29.9%

1.14 (0.93–1.38)

0.95 (0.75–1.14)

Socio-economic status

Quintile 1 (least disadvantaged)

78

16.2%

1

1

Quintiles 2–5

403

83.8%

1.33 (1.05–1.70)

1.39 (1.16–1.92)

Cancer type

Colon

258

53.6%

1

1

Rectosigmoid

47

9.8%

0.97 (0.71–1.33)

0.82 (0.60–1.13)

Rectal

176

36.6%

1.09 (0.90–1.32)

1.18 (0.97–1.44)

Spread at diagnosis

Localised

38

7.9%

1

1

Regional

146

30.4%

2.83 (1.98–4.04)

2.97 (2.07–4.24)

Distant

271

56.3%

17.9 (12.7–25.2)

17.6 (12.5–24.8)

Colorectal surgery within 3 months of diagnosis

Yes

320

66.5%

1

1

No

161

33.4%

2.16 (1.78–2.61)

1.88 (1.53–2.29)


* Adjusted for all other factors listed in the first column. † P < 0.05.

Factors associated with quality of care for patients with pancreatic cancer in Australia

The known Treating patients with pancreatic cancer is challenging, and socio-demographic factors influence whether patients receive specific treatment forms, such as surgery and chemotherapy. 

The new Our composite quality of care score was lower for patients from rural or socially disadvantaged areas; it was higher for patients who first presented to a hospital with a high pancreatic case volume. A higher score was significantly associated with improved survival. 

The implications Strategies should be developed which ensure that all patients with pancreatic cancer have the opportunity to receive optimal care from or in conjunction with high pancreatic case volume centres. 

In Australia, pancreatic cancer is the tenth most common cancer, and the fourth leading cause of cancer-related death.1 One-year survival is 20%, 5-year survival 6%.2 Treating pancreatic cancer presents distinctive challenges, and requires highly specialised care to achieve optimal outcomes.3 Studies in Australia and overseas have shown that fewer patients receive the recommended treatment than expected,4,5 that receiving recommended care is inconsistent,6,7 and that socio-demographic factors influence the treatment of patients with pancreatic cancer.7,8 Treating patients in non-specialised centres appears to at least partly explain these findings.9,10

Previous studies have tended to focus on individual types of treatment, such as surgery or chemotherapy. We took a more holistic approach and calculated an overall quality of care score for Australian patients diagnosed with pancreatic cancer. We examined variations in the score associated with patient and health service-related factors, and analysed the relationship between quality of care and survival.

Methods

This analysis was nested within a population-based study of patterns of care for patients in Australia with pancreatic cancer. Eligible patients were residents of Queensland and New South Wales diagnosed with pancreatic cancer between July 2009 and June 2011. Patients with histological confirmation of pancreatic adenocarcinoma were included, as were patients with presumed pancreatic cancer but without histological or cytological confirmation. Trained research nurses collected information about patient treatment from medical records in public and private facilities.4 Patients were excluded from this analysis if they died within one month of diagnosis or clinical staging data were unavailable.

We calculated a quality of care score based on the results of our previously reported Delphi process.11 Briefly, clinicians from a range of specialties involved in care for patients with pancreatic cancer were asked “What is important in the care of patients with pancreatic cancer?” A list of statements was prepared on the basis of a thematic analysis of the responses. The clinicians were asked to score each statement on a scale of 0 (“disagree”, “not important”) to 10 (“strongly agree”, “very important”). The mean score and the coefficient of variation (CV) were calculated for each statement.

Calculating the quality of care score

We calculated quality of care scores on the basis of the mean Delphi process scores, selecting statements about which there had been reasonable consensus in the Delphi process (CV ≤ 0.4) and when information for assessing whether the item of care had been delivered was available in our database. Eighteen items were included in the analysis (Box 1).

For each patient, we calculated a potential score by identifying the items that applied to their clinical situation and summing the mean scores from the Delphi survey for these items. For example, items related to surgical procedures were included only for patients who underwent attempted resection. We then identified items for which there was evidence that the specified care had been delivered and summed their mean Delphi scores as a score for care delivered. The proportional care score was calculated by dividing the care delivered score by the potential score, yielding a value between 0 and 1. The clinical information that determined eligibility and whether or not care specified by an item was delivered are shown in Box 1.

Measurement of potential determinants of care

Patient characteristics assessed included age, sex, Eastern Cooperative Oncology Group (ECOG) performance status, and Charlson comorbidity index.12 Based on their area of residence at diagnosis, each person was allocated a socio-economic index for areas (SEIFA)13 score and Accessibility/Remoteness Index of Australia (ARIA+)14 category. We grouped the SEIFA scores into quintiles, and collapsed the ARIA into three levels: major city, inner regional, and rural (which included the outer regional, remote and very remote categories).

Tumour-related factors included the stage of the tumour, categorised as potentially resectable or not, and as confined to the pancreas, locally advanced, or metastatic.

Health service-related factors included the type of specialist first seen, and the number of pancreatic cancer presentations (volume) for the facility to which the patient first presented.

Statistical analysis

The proportions of eligible patients who received each item of care were calculated; the statistical significance of differences between proportions according to socio-economic status and place of residence categories was assessed in χ2 tests.

We used linear regression analyses, with the proportional score as the outcome, to examine variation in the score attributable to patient-, tumour- and health service-related factors. Mean proportional scores for levels of each exposure variable were calculated and β coefficients reported (with 95% confidence intervals [CIs]). The β coefficients were interpreted as the difference between the mean score for patients in a particular category and that of patients in the reference category. Multivariable models included age, ECOG performance status, and comorbidity score as factors.

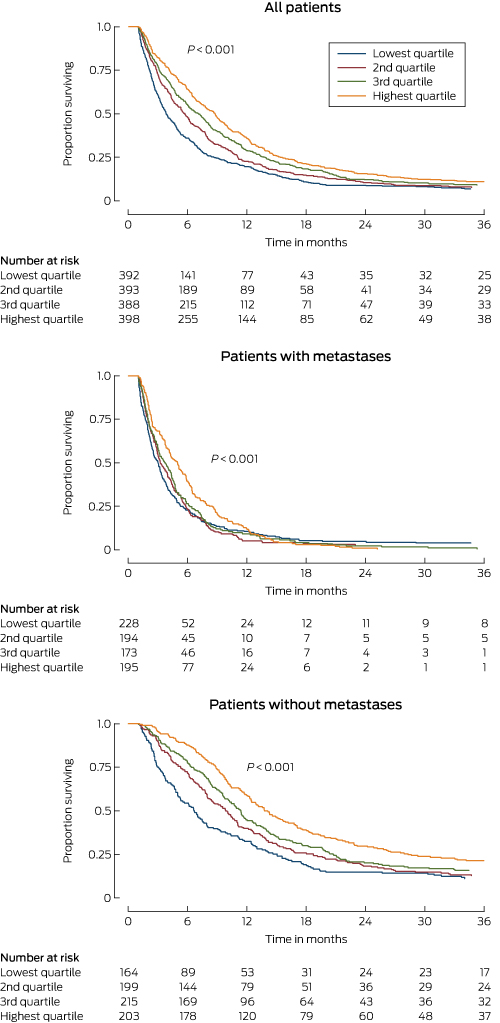
Survival time was calculated from the date of diagnosis until the death of the patient or the date of the final follow-up (February 2014). Patients were grouped in quartiles according to their proportional care scores; Kaplan–Meier graphs were generated and log-rank tests assessed differences in survival according to score quartile. We also performed the analysis with the proportional care score as a continuous variable; we report changes in survival associated with each 10 percentage point increase in score, using Cox proportional hazard models to adjust for patient-related factors and clinical stage. The association between the score and survival was further investigated by calculating adjusted hazard ratios for each care score item separately. Analyses were performed for the entire patient group and separately for patients with or without metastases identified at clinical staging. We used Stata 14 (StataCorp) for all analyses. P < 0.05 (two-sided) was deemed statistically significant.

Ethics approval

Access to medical records was approved under the Queensland Public Health Act and the NSW Privacy Act. Ethics approval was obtained from the QIMR Berghofer Medical Research Institute (reference, P1292), the Royal Brisbane and Women’s Hospital (on behalf of all public hospitals in Queensland; reference, HREC/10/QRBW/16), and the NSW Population and Health Services Research Ethics Committee (reference, HREC/10/CIPHS/45).

Results

A total of 1896 patients were eligible for inclusion in the patterns of care study. We were unable to locate medical records for 33 patients; 259 had died within one month of diagnosis, and staging information was not available for 33, so that 1571 patients (83%) were included in our analysis, including 867 men (55%). At clinical staging, 781 patients (49.7%) had non-metastatic disease and 790 (50.3%) metastatic disease. Most patients lived in major cities (1076, 68%); 338 (22%) lived in inner regional areas and 157 (10%) in rural areas. Almost three-quarters of patients (1151, 73%) died within one year of diagnosis. The median survival time was 6 months (11 months for patients without metastases; 4 months for those with metastases).

Younger patients and those with better ECOG performance status had higher care scores than older and less active patients with pancreatic cancer (Appendix 2). ARIA+ category, area level socio-economic status, age, ECOG performance status, institutional pancreatic cancer case volume, and specialist first seen were all factors that significantly influenced the care score (Box 2; Appendix 3). After adjusting for these factors, the care scores for patients living in rural areas were 11% lower (95% CI, 8–13%) than for those living in major cities. The care scores for patients living in more disadvantaged areas were up to 8% lower (95% CI, 6–11%) than for patients living in the least disadvantaged areas. Care score estimates for patients presenting to a low pancreatic cancer case volume hospital (fewer than ten presentations per year) were 13% lower (95% CI, 11–15%) than for those presenting to hospitals with more than 30 presentations annually. They were higher for patients for whom a hepatobiliary surgeon was the first specialist seen; scores for patients initially seeing a general surgeon were 10% lower (95% CI, 8–13%) (Box 2).

To further investigate the association between ARIA+ category and care score, models were then also adjusted for the pancreatic cancer case volume of the first hospital and specialist seen. The differences in the adjusted mean scores for major cities and rural areas (5% lower for rural patients; 95% CI, 3–8%) and between least and most disadvantaged areas (6% lower for most disadvantaged patients; 95% CI, 3–8%) were lower in this model.

For patients who had been clinically staged with non-metastatic disease, the factors most strongly associated with lower care scores were being seen initially by a general rather than a hepatobiliary surgeon (17% lower; 95% CI, 13–21%), living in a rural area rather than a major city (11% lower; 95% CI, 8–15%), and being at least 80 years of age (v aged less than 60 years: 16% lower; 95% CI, 13–20%). For patients diagnosed with metastatic disease, being seen at a lower volume facility (15% lower; 95% CI, 12–17%) and having a poorer ECOG performance status (11% lower; 95% CI, 7–15%) were the factors most strongly associated with quality of care.

Individual items of care were also examined. Less than one-third of patients received some items: 31% were presented to multidisciplinary teams (MDTs), received psychosocial support (19%), participated in clinical trials (7%), or were first seen by a hepatobiliary surgeon (19%). Most eligible patients were offered resection or received a valid reason why they were not (98%), had a tissue diagnosis (80%), saw a medical oncologist (86%), and were referred to palliative care (82%) (Box 1). There were significant differences for patients according to their ARIA+ category and area level socio-economic status; for example, 32 patients living in rural areas (41%) were referred to a hepatobiliary surgeon, compared with 53% of patients (290 of 548) in metropolitan areas (Appendix 4, Appendix 5).

Patients with scores in the highest quartile of proportional care scores had an estimated median survival time of 8 months, double that for those with scores in the lowest quartile. Median survival time for patients with non-metastatic disease in the highest and lowest score quartiles was 14 and 7 months respectively; for those with metastatic disease, it was 5 and 3 months (Box 3).

After adjusting for age, ECOG performance status, comorbidities, and clinical stage of pancreatic disease, each 10 percentage point increase in proportional care score was associated with a statistically significant 6% reduction in the risk of dying (hazard ratio [HR], 0.94; 95% CI, 0.91–0.97; Box 4). The reduction was greater for patients who were diagnosed with non-metastatic disease (adjusted HR, 0.91; 95% CI, 0.87–0.95) than for those with metastatic disease (adjusted HR, 0.95; 95% CI, 0.91–0.99).

Individual care score items that were statistically significantly associated with survival included having a diagnostic tissue sample collected (HR, 0.66; 95% CI, 0.57–0.77), being offered adjuvant chemotherapy (HR, 0.43; 95% CI, 0.33–0.56), being referred to a hepatobiliary surgeon if potentially resectable (HR, 0.82; 95% CI, 0.69–0.96), being presented to an MDT (HR, 0.86; 95% CI, 0.77–0.96), being offered psychosocial support (HR, 1.24; 95% CI, 1.09–1.12), pancreatic enzyme replacement therapy (HR, 0.83; HR, 95% CI, 0.73–0.94), and, if diagnosed with metastatic disease, referral to palliative care (HR, 1.42; 95% CI, 1.17–1.74) (Appendix 6).

Discussion

We found that the quality of care for patients with pancreatic cancer varied according to their age, where they live, and the pancreatic cancer case volume of the hospital to which they first presented. We also found that higher quality of care was associated with improved survival. This association was strongest for patients clinically staged with non-metastatic pancreatic cancer, for whom there is more scope for treatment that can increase survival.

Earlier studies found that receiving surgery, chemotherapy and palliative care was influenced by the age, education, place of residence, ethnic background, and marital status of patients.5,7,15 By applying a composite measure of care that included a broad range of factors, we found that age and ECOG performance status influenced its overall quality. While this is unsurprising, it is important to recognise that age alone is not a barrier to high quality care. Our more worrying finding is that quality of care varied according to the geographic classification and the area level socio-economic status of the patient’s place of residence. This is at least partly explained by differences in access to specialists and care in high case volume centres, suggesting that interventions which ensure that all patients are managed by high volume teams could improve the quality of care.

Our analysis of individual care items found that the proportion of people receiving care from specialist teams, as recommended, was particularly small: fewer than one-third of patients had been referred to an MDT, only half of potentially resectable patients had been referred to a hepatobiliary surgeon, and referral to a clinical trial was only rarely considered, even though these factors have consistently been found to influence the quality of care.9,16,17 These aspects of care were particularly poorly delivered to patients living in more rural areas. Distance causes particular challenges in Australia,1820 but they should not be insurmountable; it has been reported, for example, that a multi-level approach (such as telemedicine MDTs and formalising referral relationships between regional and metropolitan centres) can improve outcomes.21

Survival for patients with lower care scores was poorer, consistent with previous reports.2224 This association was stronger for patients diagnosed with non-metastatic disease, for whom there is more scope for influencing survival by ensuring that staging is adequate, that surgery is undertaken in high case volume centres, and that patients have access to adjuvant chemotherapy. For patients with metastatic disease, a focus on quality-of-life indicators is arguably more important; this could be explored in further investigations of care quality.

Some care items were associated with a greater hazard of dying when the care was received, including statements that patients should be “offered psychosocial support”, that “patients with metastatic disease should be referred to palliative care”, and that “patients with technically resectable disease should be offered resection or a valid reason for no surgery”. Receiving psychosocial and palliative care is more likely as the expected survival time shortens, and this probably explains these findings (reverse causation). The care item regarding resection was classed as having been delivered if a valid reason for the resection not being offered had been recorded. This applied to 28% of patients eligible for resection; the reasons for not attempting surgery included older age, comorbidity, and poor ECOG performance status, each of which were associated with poor survival. When these three care items were all omitted from the care score, the risk of death was 2% lower for each 10 percentage point increase in care score (data not shown).

Our study was comprehensive, reasonably large, and population-based, and was also the first Australian investigation to assess the overall quality of care with a single score. Nevertheless, it had some limitations. Firstly, different weights for the care items may have been obtained if another mix of specialists had participated in the Delphi process. Secondly, the Delphi study highlighted the importance of communication between patients and clinicians. This factor cannot be adequately captured in a medical record review and could therefore not be incorporated into our score, but may have influenced decisions regarding care. Thirdly, some patients may have been incorrectly classified as having resectable tumours, which would have affected their eligibility for certain care items and thereby the delivery of appropriate care. Finally, although we controlled for age, ECOG performance status and comorbidities, we may not have completely accounted for confounding patient-related factors.

In conclusion, our population-based study provides evidence that the geographical location of their place of residence, among other factors, influences the quality of care received by Australian patients with pancreatic cancer, and that survival can be improved by delivering optimal care. Systems of care need to be implemented which ensure that equitable treatment is provided for all Australian patients with pancreatic cancer.

Box 1 –
Statements about care for patients with pancreatic cancer deemed to be most important in our Delphi process, patient eligibility criteria, and definition of care received

Care statement

Weight*

Eligible patients

Number eligible

Number who received care

Care received


All patients with potentially resectable disease should be referred to a hepatobiliary surgeon§

9.3

Non-metastatic

781

401 (51%)

Any referral or consultation with hepatobiliary surgeon

All patients with technically resectable disease should be offered resection or valid reason for not doing so

9.2

Potentially resectable

519

509 (98%)

Surgery attempted or valid reason for not doing so

Surgery should be performed by surgeons who perform more than five pancreatic resections per year

9.0

Resection attempted

366

158 (43%)

Surgeon performed more than five resections per year

Tumour resectability should be assessed by an MDT at a tertiary hospital

9.0

Non-metastatic

781

229 (29%)

MDT prior to attempted surgery, or within 40 days of diagnosis if no surgery

All patients should have a triple phase/pancreas protocol CT scan for staging

8.9

All patients

1571

674 (43%)

Evidence of pancreas protocol CT

Entry into a clinical trial should be considered for all patients

8.8

All patients

1571

103 (7%)

Clinical trial discussed, considered, offered or participated in a trial

Surgery should take place in tertiary institutions where more than 15 resections are performed annually**

8.6

Resection attempted

366

152 (42%)

Attempted resection performed at hospital with more than 11 resections each year**

Each patient should be assigned a care coordinator and an individualised treatment/clinical plan

8.5

All patients

1571

345 (22%)

Evidence of a navigator, care plan or nursing referral

Tissue diagnosis should be obtained where possible

8.3

All patients

1571

1251 (80%)

Histology or cytology analysis completed

All patients should be presented to an MDT

8.3

All patients

1571

494 (31%)

Evidence of presentation to an MDT

Biliary obstruction should routinely be managed endoscopically in non-resectable patients

8.2

Non-resectable with biliary obstruction

416

346 (83%)

Evidence of endoscopic biliary stent, not bypass surgery

All patients should be offered adjuvant therapy after surgery, assuming performance status is adequate

8.1

Resection attempted

366

244 (67%)

Evidence of any adjuvant chemo- or radiation therapy

All patients should be offered psychosocial support

8.0

All patients

1571

301 (19%)

Evidence of referral to or consultation with psychological services

Pancreatic enzyme replacement therapy should be considered for all patients

7.9

All patients

1571

345 (22%)

Evidence of pancreatic enzyme replacement

All patients should see a medical oncologist

7.9

All patients

1571

1353 (86%)

Seen by a medical oncologist or valid reason why not

A specialist hepatobiliary surgeon should be the initial/primary specialist unless the patient has obvious metastases

7.3

Non-metastatic

781

146 (19%)

Hepatobiliary surgeon was the first specialist seen

All patients should be referred to a dietitian soon after diagnosis

7.3

All patients

1571

1000 (64%)

Evidence of referral to or consultation with dietitian

Patients with confirmed metastatic disease should be referred to palliative care

6.0

Metastatic

790

646 (82%)

Any evidence of palliative care consultation or referral


CT = computerized tomography; MDT = multidisciplinary team meeting. * Final mean average score of importance from Delphi process. † Patients eligible for care according to classification by clinical staging. ‡ Number and percentage of eligible patients who received the item of care. § Hepatobiliary surgeon: defined as a surgeon who had undergone recognised specialist hepatobiliary surgery training or who was recognised by peers as an experienced hepatobiliary surgeon. ¶ Includes all inpatient records and consultations. ** Only three hospitals from the patterns of care study performed 15 resections each year; this high volume classification was therefore amended, on the basis of Australian data and literature reports, to hospitals where 11 or more resections were performed each year.

Box 2 –
Associations between patient, tumour and health service-related characteristics and proportional care scores for all patients, and for patients with or without evidence of metastases at clinical staging

Adjusted β coefficient (95% confidence interval)*


All patients

Patients without metastases

Patients with metastases


Number of patients

1571

781

790

Age group

< 60 years

Reference

Reference

Reference

60–69 years

0.01 (−0.01 to 0.03)

0.01 (−0.02 to 0.04)

0.00 (−0.03 to 0.04)

70–79 years

−0.05 (−0.08 to −0.03)

−0.05 (−0.08 to −0.02)

−0.06 (−0.09 to −0.03)

≥ 80 years

−0.13 (−0.15 to −0.10)

−0.16 (−0.20 to −0.13)

−0.10 (−0.13 to 0.06)

P (overall; trend)

< 0.001; < 0.001

< 0.001; < 0.001

< 0.001; < 0.001

Sex

Women

Reference

Reference

Reference

Men

−0.01 (−0.02 to 0.01)

0.01 (−0.01 to 0.03)

−0.03 (−0.05 to −0.00)

P (overall)

0.34

0.40

0.03

Charlson comorbidity score

0

Reference

Reference

Reference

1

−0.01 (−0.03 to 0.01)

−0.00 (−0.03 to 0.02)

−0.01 (−0.03 to 0.02)

2

−0.01 (−0.03 to 0.01)

−0.01 (−0.04 to 0.02)

−0.01 (−0.04 to 0.02)

P (overall; trend)

0.64; 0.38

0.88; 0.63

0.89; 0.66

ECOG performance status

0

Reference

Reference

Reference

1

−0.01 (−0.03 to 0.01)

−0.01 (−0.04 to 0.02)

−0.01 (−0.04 to 0.02)

≥ 2

−0.06 (−0.08 to −0.03)

−0.06 (−0.09 to −0.03)

−0.05 (−0.08 to −0.02)

Not stated

−0.09 (−0.12 to −0.06)

−0.07 (−0.11 to −0.03)

−0.11 (−0.15 to −0.07)

P (overall; trend)

< 0.001; < 0.001

< 0.001; < 0.001

< 0.001; < 0.001

Residence (ARIA+ classification)

Major city

Reference

Reference

Reference

Inner regional

−0.06 (−0.08 to −0.04)

−0.03 (−0.06 to −0.00)

−0.08 (−0.11 to −0.05)

Rural

−0.11 (−0.13 to −0.08)

−0.11 (−0.15 to −0.08)

−0.09 (−0.13 to −0.06)

P (overall; trend)

< 0.001; < 0.001

< 0.001; < 0.001

< 0.001; < 0.001

Socio-economic status (quintiles)

1 (least disadvantaged)

Reference

Reference

Reference

2

−0.03 (−0.06 to −0.01)

−0.04 (−0.07 to −0.00)

−0.03 (−0.07 to 0.01)

3

−0.07 (−0.10 to −0.04)

−0.08 (−0.12 to −0.05)

−0.06 (−0.10 to −0.02)

4

−0.08 (−0.11 to −0.05)

−0.08 (−0.12 to −0.05)

−0.08 (−0.12 to −0.04)

5 (most disadvantaged)

−0.08 (−0.11 to −0.06)

−0.07 (−0.10 to −0.03)

−0.10 (−0.13 to −0.06)

P (overall; trend)

< 0.001; < 0.001

< 0.001; < 0.001

< 0.001; < 0.001

Clinical stage of disease

Confined to pancreas

Reference

NA

NA

Locally advanced

−0.02 (−0.04 to 0.01)

Metastatic

−0.02 (−0.04 to 0.00)

P (overall; trend)

0.26; 0.14

Pancreatic cancer case volume of first facility seen

> 30 per year

Reference

Reference

Reference

10–29 per year

−0.06 (−0.08 to −0.04)

−0.07 (−0.10 to −0.05)

−0.04 (−0.07 to −0.02)

< 10 per year

−0.13 (−0.15 to −0.11)

−0.10 (−0.13 to −0.07)

−0.15 (−0.17 to −0.12)

P (overall; trend)

< 0.001; < 0.001

< 0.001; < 0.001

< 0.001; < 0.001

First specialist seen

Hepatobiliary surgeon

Reference

Reference

Reference

Gastroenterologist

−0.09 (−0.11 to −0.06)

−0.12 (−0.15 to −0.09)

−0.03 (−0.07 to 0.01)

General surgeon

−0.10 (−0.13 to −0.08)

−0.13 (−0.16 to −0.10)

−0.05 (−0.09 to −0.01)

Other

−0.14 (−0.16 to −0.11)

−0.17 (−0.21 to −0.13)

−0.10 (−0.14 to −0.06)

P (overall)

< 0.001

< 0.001

< 0.001


ECOG = Eastern Cooperative Oncology Group; NA = not applicable. * Adjusted for age group at diagnosis (< 60, 60–69, 70–79, ≥ 80 years), ECOG performance status (0, 1, ≥ 2, not stated), and Charlson comorbidity index score (0, 1, ≥ 2). † Includes patients in outer regional, remote and very remote areas.

Box 3 –
Kaplan–Meier survival curves for all patients, patients with non-metastatic disease and patients with metastatic disease on clinical staging, by proportional care score (quartiles)


* Log-rank test of equality of survivor functions across proportional care score quartiles.

Box 4 –
Association between total care score and survival according to stage of pancreatic cancer at diagnosis

Number of patients

Hazard ratio (95% CI)*


Unadjusted

P

Adjusted

P


All patients

1571

0.90 (0.87–0.93)

< 0.001

0.94 (0.91–0.97)

< 0.001

Non-metastatic disease

781

0.87 (0.83–0.91)

< 0.001

0.91 (0.87–0.95)

< 0.001

Metastatic disease

790

0.95 (0.91–0.98)

0.006

0.95 (0.91–0.99)

0.013


* Reduction in the risk of dying associated with a 10 percentage point increase in care score. † Adjusted for age group, Eastern Cooperative Oncology Group performance status, Charlson comorbidity score, and clinical stage.

Gut feeling: how your microbiota affects your mood, sleep and stress levels

The gut microbiota is the community of bugs, including bacteria, that live in our intestine. It has been called the body’s “forgotten organ” because of the important role it plays beyond digestion and metabolism.

You might have read about the importance of a healthy gut microbiota for a healthy brain. Links have been made between the microbiota and depression, anxiety and stress. Your gut bacteria may even affect how well you sleep.

But it can be difficult to work out exactly how far the science has come in this emerging field of research. So what evidence is there that your gut microbiota affects your brain?

How does your gut talk to your brain?

When you’re healthy, bacteria are kept safely inside your gut. For the most part, the bacteria and your gut live in harmony. (The gut has been known to nurture or even control the behaviour of the bacteria for your well-being.)

The best evidence is that the normal channels of communication from your gut are being hijacked by the bacteria. So how do the bacteria get their signal out?

The gut has a bidirectional relationship with the central nervous system, referred to as the “gut-brain axis”. This allows the gut to send and receive signals to and from the brain.

A recent study found that the addition of a “good” strain of the bacteria lactobacillus (which is also found in yoghurt) to the gut of normal mice reduced their anxiety levels. The effect was blocked after cutting the vagus nerve – the main connection between brain and gut. This suggests the gut-brain axis is being used by bacteria to affect the brain.

This link was clarified in a study where bacterial metabolites (by-products) from fibre digestion were found to increase the levels of the gut hormone and neurotransmitter, serotonin. Serotonin can activate the vagus, suggesting one way your gut bacteria might be linked with your brain.

There are many other ways gut bacteria might affect your brain, including via bacterial toxins and metabolites, nutrient-scavenging, changing your taste-receptors and stirring up your immune system.

How can the gut affect your mental health?

Two human studies looked at people with major depression and found that bacteria in their faeces differed from healthy volunteers. But it’s not yet clear why there is a difference, or even what counts as a “normal” gut microbiota.

In mouse studies, changes to the gut bacteria from antibiotics, probiotics (live bacteria) or specific breeding techniques are associated with anxious and depressive behaviours. These behaviours can be “transferred” from one mouse to another after a faecal microbiota transplant.

Even more intriguingly, in a study this year, gut microbiota samples from people with major depression were used to colonise bacteria-free rats. These rats went on to show behavioural changes related to depression.

Stress is also likely to be important in gut microbiota and mental health. We’ve known for a long time that stress contributes to the onset of mental illness. We are now discovering bidirectional links between stress and the microbiota.

In rat pups, exposure to a stressor (being separated from their mums) changes their gut microbiota, their stress response, and their behaviour. Probiotics containing “good” strains of bacteria can reduce their stress behaviours.

How gut microbiota affects your mood

Medical conditions associated with changes in mood, such as irritable bowel syndrome (IBS) and chronic fatigue syndrome (CFS), might also be related to gut microbiota.

IBS is considered a “gut-brain disorder”, since it is often worsened by stress. Half of IBS sufferers also have difficulties with depression or anxiety.

Ongoing research is investigating whether gut bacteria are one reason for the mood symptoms in IBS, as well as the gastrointestinal pain, diarrhoea and constipation.

Similarly, CFS is a multi-system illness, with many patients experiencing unbalanced gut microbiota. In these patients, alterations in the gut microbiota may contribute to the development of symptoms such as depression, neurocognitive impairments (affecting memory, thought and communication), pain and sleep disturbance.

In a recent study, higher levels of lactobacillus were associated with poorer mood in CFS participants. Some improvements in sleep and mood were observed when patients used antibiotic treatment to reduce gut microbial imbalance.

The exact contributions of stress and other factors such as intestinal permeability (which allows nutrients to pass through the gut) to these disorders are not understood. But the downstream effects seem to be involved in IBS, inflammatory bowel conditions, CFS, depression and chronic pain.

How our gut affects our sleep

Our mental health is closely linked to the quality and timing of our sleep. Now evidence suggests that the gut microbiota can influence sleep quality and sleep-wake cycles (our circadian rhythm).

A study this year examined patients with CFS. The researchers found that higher levels of the “bad” clostridium bacteria were associated with an increased likelihood of sleep problems and fatigue, but this was specific to females only. This suggests that an unbalanced gut may precipitate or perpetuate sleep problems.

There is emerging evidence that circadian rhythms regulate the gut immune response. The effect of immune cells on the biological clock could provide insights into the possible bidirectional relationship between sleep and the gut. For example, data from animal studies suggests that circadian misalignment can lead to an unbalanced gut microbiota. But this effect can be moderated by diet.

There is growing concern that disruptions to our circadian timing of sleep leads to a range of health issues, such as obesity, metabolic and inflammatory disease, and mood disorders. This is particularly important for shiftworkers and others who experience changes to their sleep/wake patterns.

What this means for treatment

In terms of using interventions directed at the gut to treat brain disorders – so called “psychobiotics” – there is a lot of promise but little clear evidence.

Probiotic (live bacteria) treatments in mice have been shown to reduce cortisol, an important stress hormone, and decrease anxious and depressive behaviours.

But there are very few studies in humans. A recent systematic review of all the human studies showed the majority do not show any effect of probiotics on mood, stress or symptoms of mental illness.

On the plus side, large studies show us that people who eat a balanced diet with all the usual good stuff (fibre, fresh fruit and vegetables) have lower rates of mental illness as adults and adolescents.

Clearly, diet affects both the gut microbiota and mental health. Research is ongoing to see whether it is a healthy gut microbiota that underlies this relationship.

A healthy gut microbiota is linked to a healthy brain. However there are only a handful of human studies demonstrating real-world relevance of this link to mental health outcomes.

There is still a way to go before we can say exactly how best to harness the microbiota in order to improve brain function and mental health.

Read the other articles in our Gut series here.The Conversation

Paul Bertrand, Senior Lecturer in School of Health and Biomedical Sciences, RMIT University; Amy Loughman, Associate Lecturer, Industry Fellow, RMIT University, and Melinda Jackson, Senior Research Fellow in the School of Health and Biomedical Sciences, RMIT University.

This article was originally published on The Conversation. Read the original article.

Latest news

Barrett’s oesophagus: epidemiology, diagnosis and clinical management

In most industrialised countries, including Australia, the incidence of oesophageal adenocarcinoma has increased fivefold in the past 40 years.1 Almost all of these cancers arise from underlying Barrett’s oesophagus,2 a condition described by Australian-born Norman Barrett in 19573 in which the normal oesophageal squamous epithelium is partially replaced by an intestinal metaplastic columnar epithelium. This narrative review discusses the epidemiology of Barrett’s oesophagus and its relationship to cancer, considers recent developments around screening and surveillance, and briefly reviews the management of dysplasia and early adenocarcinoma arising in Barrett’s oesophagus. It is based on comprehensive Australian guidelines recently published by Cancer Council Australia (http://wiki.cancer.org.au/australia/Guidelines: Barrett%27s).4

Definition

In the Australian guidelines (as in most other international guidelines), a diagnosis of Barrett’s oesophagus requires two components: first, endoscopic evidence of a salmon-pink coloured columnar epithelium extending above the gastro-oesophageal junction and partially replacing the normal tubular oesophageal squamous epithelium; and second, biopsies from the oesophageal columnar epithelium showing evidence of intestinal metaplasia, with the presence of mucin-containing goblet cells (Box 1).46 Under Australian guidelines, patients with a columnar-lined oesophagus on endoscopy but no evidence of intestinal metaplasia on biopsy do not meet the definition for Barrett’s oesophagus; the significance of this finding is uncertain, and we discuss the management of such patients below.

The length of the columnar epithelium at endoscopy is described using the Prague C (circumferential length) and M (maximal length) criteria (Box 2).7 Barrett’s oesophagus is defined as long segment when maximal segment length is ≥ 3 cm and as short segment when maximal length is < 3 cm.

Prevalence

Because Barrett’s oesophagus is asymptomatic and requires endoscopic examination and histological confirmation to establish the diagnosis, estimates of prevalence in unselected populations are scarce. The arguably best data were derived from a sample of 1000 Swedish residents recruited at random from the community who underwent upper gastrointestinal endoscopy, of whom 16 were identified with Barrett’s oesophagus (5 long segment, 11 short segment).8 Well conducted surveys in comparable populations (the United States and Europe) suggest community prevalence < 5%, with estimates converging around 2%; Australian data are limited to studies of patients referred for endoscopic investigation of symptoms.911 There is evidence that Australian detection rates have increased recently, with higher proportions of patients who undergo upper gastrointestinal endoscopy being diagnosed with Barrett’s oesophagus in consecutive surveys (rising from 0.3% in 1990 to 1.9% in 2002).10

Risk factors

Pooled analyses and meta-analyses of high quality epidemiological studies have consistently identified age, male sex, gastro-oesophageal reflux, central obesity and smoking as risk factors for Barrett’s oesophagus. In most populations, Barrett’s oesophagus is twice as common in men as in women,12 and prevalence rises with age.13

The longstanding clinical association between Barrett’s oesophagus and acid regurgitation or heartburn has been confirmed in research studies; a recent meta-analysis concluded that symptoms of gastro-oesophageal reflux increased the risks of long segment Barrett’s oesophagus more than fivefold.14 In addition, factors that promote reflux, such as hiatal hernia, are also observed more frequently in patients with Barrett’s oesophagus than among endoscopy controls with non-erosive reflux disease.15

While obesity is an established risk factor for oesophageal adenocarcinoma, epidemiologic studies have reported inconsistent associations between body mass index and Barrett’s oesophagus.16 However, studies measuring abdominal obesity (eg, waist circumference, waist–hip ratio) have identified two-to-threefold higher risks for high versus low waist circumference.16 Strong evidence of a likely causal association between obesity and Barrett’s oesophagus came from a Mendelian randomisation analysis, in which investigators demonstrated that people with a strong genetic propensity to develop obesity have significantly higher risks of Barrett’s oesophagus than those with a weak genetic propensity to obesity.17 The mechanisms remain speculative, but include mechanical (increased pressure on the lower oesophageal sphincter promoting reflux), metabolic and hormonal pathways. Importantly, the association between abdominal obesity and Barrett’s oesophagus is observed in people with and without reflux symptoms, indicating that mechanical reflux does not explain the whole effect.18 Metabolic factors are strongly implicated, with recent investigations reporting positive associations with markers of the metabolic syndrome, including insulin resistance19 and high serum concentrations of leptin.2022 Increasingly, it seems likely that male–female differences in fat deposition and metabolism may account for some of the observed sex-specific differences in the prevalence of Barrett’s oesophagus.23

Many other lifestyle exposures have been assessed as possible risk factors for Barrett’s oesophagus, two of which have been consistently implicated. Smoking increases the risk of the condition by about 50%24,25, whereas past infection with Helicobacter pylori reduces risk by about 50%.26,27 Previously, it was hypothesised that H. pylori infection inhibits gastric acid production and thus reduces acid-associated damage.27 Recent studies suggest that, in Western populations, H. pylori infection occurs predominantly in the antrum and likely reduces the risk of Barrett’s oesophagus by disrupting ghrelin and leptin pathways.28,29

Aside from the factors described above, no others have been consistently associated with the disease. Thus, despite considerable investigation, there is no evidence that alcohol is a risk factor.3033 Similarly, several well conducted case–control studies34,35 have investigated the role of aspirin and other non-steroidal anti-inflammatory drugs, based on strong and consistent inverse associations with oesophageal adenocarcinoma in observational and experimental studies. However, there is no evidence that this class of drugs alters a person’s risk of Barrett’s oesophagus. Relatively few studies have examined dietary factors and no conclusions can be drawn.

In the past 5 years, several large scale genome-wide association studies have identified a number of single nucleotide polymorphisms significantly associated with Barrett’s oesophagus.36 Moreover, there appears to be considerable genetic overlap between patients with Barrett’s oesophagus and patients with oesophageal adenocarcinoma, lending weight to the notion that these two conditions share similar causal origins.37,38 This is a rapidly moving field, but the clinical utility of these findings remains unknown.

Progression to cancer

Clinical interest in Barrett’s oesophagus stems largely from the concern that the condition is a precursor or risk marker for adenocarcinoma of the oesophagus. Most cases of oesophageal adenocarcinoma arise from underlying Barrett’s metaplasia in which there is a histological progression over time from low grade dysplasia (LGD) to high grade dysplasia (HGD) and subsequent intramucosal and invasive carcinoma (metaplasia–dysplasia–carcinoma sequence). Early oesophageal adenocarcinoma refers to invasion of the carcinoma beyond the basement membrane into the lamina propria (T1a on the current tumour–node–metastasis staging system) or superficial submucosa (T1b), but no deeper. Early oesophageal adenocarcinoma represents 6–12% of patients presenting with oesophageal cancer.39,40

The key question relates to the rate at which patients diagnosed with Barrett’s oesophagus progress to cancer. Early studies, largely conducted in tertiary referral centres, suggested rates as high as 1–2 per 100 patients per year. Since the year 2000, a number of large, population-based, record linkage studies have observed considerably lower progression rates for patients with uncomplicated Barrett’s oesophagus, converging at around 1–3 per 1000 patients per year (an order of magnitude lower than earlier reports).4145 The risk of progression is greater in those with dysplasia46 and those with long segment Barrett’s oesophagus.47

Considerable uncertainty remains about progression rates among Barrett’s oesophagus patients with LGD. In the community, LGD patients progress to HGD or cancer at a rate of about 1.5% per annum, whereas a recent European academic centre-based study reported much higher progression rates to HGD or cancer (about 13% per annum).42,48 The explanation appears to be that patients attending academic centres are reviewed by multiple expert gastrointestinal pathologists, and up to 75% of community referral LGD patients are downstaged to non-dysplastic Barrett’s oesophagus following expert review. Among the downstaged patients, progression rates to HGD or cancer of about 0.5% per year have been observed,48 similar to those reported from community-based studies.42 Studies from other academic centres of progression rates of patients with expert-confirmed LGD are awaited.

Little is known about lifestyle factors that increase or decrease the rate of progression to cancer. The literature underpinning this area is limited in scope and challenged by methodological issues such as small sample sizes, losses to follow-up, possible selection bias and confounding. Notwithstanding these limitations, it would seem that men with Barrett’s oesophagus progress to cancer at about twice the rate of women,46,49 and smokers progress at twice the rate of non-smokers.50,51 While prospective observational studies suggest that non-steroidal anti-inflammatory drugs,52,53 proton pump inhibitors54 and statins52,55 might retard progression to cancer, to date there are no randomised trials to support such conclusions and caution is warranted. Clinical factors associated with high rates of progression include longer segment length,45,46,50,52 and the presence of nodules,56 ulceration57 and strictures57 on endoscopy.

Screening

Screening is the process of identifying new cases of disease in an unselected population. Endoscopic screening for Barrett’s oesophagus in an unselected population with gastro-oesophageal reflux symptoms is not recommended, as it is not cost-effective. Focused endoscopic screening programs in those at greatest risk for Barrett’s oesophagus improve cost-effectiveness.58 Guidelines published by the British Society of Gastroenterology in 2014 recommend that endoscopic screening be considered in patients with chronic gastro-oesophageal reflux symptoms and multiple risk factors for Barrett’s oesophagus (at least three of aged 50 years or older, Caucasian background, male sex, and obesity). They suggest that the threshold of multiple risk factors should be lowered in the presence of a family history including at least one first-degree relative with Barrett’s oesophagus or oesophageal adenocarcinoma.59

For more widespread Barrett’s oesophagus screening to be considered, the costs of detection need to be reduced substantially with no compromise in accuracy. Studies of less costly screening methods (eg, ultrathin endoscopes, cytosponges) have yielded promising results but it is too early for these to be recommended at a population level.60,61

Endoscopic surveillance

Surveillance is the strategy of systematically following up patients with a known precursor condition to reduce (or prevent) the harms of cancer progression. The aim is to detect progression early, so that disease can be treated with the least invasive method, thereby reducing morbidity and mortality from cancer. The decision to commence endoscopic surveillance should be individualised for each patient, after considering factors such as age, comorbidities and the patient’s wishes and ability to participate in a long term surveillance program.

Endoscopic surveillance in Barrett’s oesophagus involves careful and meticulous examination of the Barrett’s segment with a high resolution white light endoscope, followed by biopsies from the segment. It is recommended that biopsies be taken according to the Seattle protocol, with biopsies of any mucosal irregularity (labelled separately) and quadrantic biopsies every 2 cm, unless there is known or suspected dysplasia, in which case quadrantic biopsies should be taken every centimetre. In the presence of erosive oesophagitis, it is recommended that acid suppression be maximised and surveillance endoscopy repeated in 2–3 months. This allows the oesophagitis to heal, thereby permitting underlying (masked) lesions to be identified and further biopsies to be taken.

The interval between surveillance endoscopies depends on segment length and the presence of dysplasia (Box 3). In patients with Barrett’s oesophagus with no current or past dysplasia, follow-up endoscopy is recommended every 2–3 years in those with long segment disease, and every 3–5 years in those with short segment disease. Follow-up and management of patients with dysplasia is discussed below.

In some patients, a columnar-lined oesophagus is found at endoscopy but no intestinal metaplasia or dysplasia is seen histologically. The biological implications of this finding remain uncertain. The Australian guidelines recommend follow-up intervals based on segment length: < 1 cm, no endoscopic follow-up; 1–< 3 cm, 3–5 years; and ≥ 3 cm, 2–3 years.4

Although endoscopic surveillance in Barrett’s oesophagus is the current recommended practice, there is no direct evidence from randomised trials for its effectiveness or cost-effectiveness. Economic modelling studies suggest that current surveillance practices are unlikely to be cost-effective, and that identifying patients at high risk of progression to oesophageal adenocarcinoma substantially improves cost-effectiveness.39,62,63 The future hope is that a combination of clinical, endoscopic, blood or tissue markers might be used to develop risk stratification tools for identifying high risk patients most likely to benefit from surveillance and early intervention.64

Management of gastro-oesophageal reflux disease

In patients with Barrett’s oesophagus and gastro-oesophageal reflux symptoms, proton pump inhibitor treatment is recommended at a dose titrated to control symptoms and heal reflux oesophagitis. If proton pump inhibitors fail to control gastro-oesophageal reflux symptoms or heal reflux oesophagitis, surgical fundoplication can be considered.5 There is no strong evidence to suggest that medical or surgical therapy of gastro-oesophageal reflux disease leads to any substantial regression in segment length or influences progression to cancer.65

Management of low grade dysplasia

Management of LGD patients is currently uncertain, as new data suggest cancer progression rates are higher in patients whose LGD has been confirmed by an expert pathologist.48 A recent multicentre European randomised study of radiofrequency ablation in patients with expert-confirmed LGD found that control patients undergoing intensive endoscopic surveillance had a progression rate to cancer of 8.8%, while patients in the intervention arm had a progression rate to cancer of 1.5%.66 The Australian guidelines recommend that those with LGD be either closely monitored with frequent endoscopic assessment and biopsies every 6 months or referred to an expert centre for ongoing follow-up and consideration of ablative therapy of the Barrett’s segment.4 The decision regarding management of patients with LGD needs to take into account the features of the Barrett’s segment and histology as well as patient age, fitness and preference.

Management of indefinite for dysplasia

Indefinite for dysplasia is reported when biopsies from the Barrett’s segment show some histological features of true dysplasia but other processes (eg, inflammation) cannot be excluded as a cause for the changes. As with LGD and HGD, such biopsies should be reviewed by a second pathologist, ideally an expert gastrointestinal pathologist. If indefinite for dysplasia remains the diagnosis, then Australian guidelines recommend that the patient be placed on maximal acid suppression and undergo repeat endoscopy with dysplasia protocol biopsies in 6 months.4

Management of high grade dysplasia and early oesophageal adenocarcinoma

Patients with HGD or early oesophageal adenocarcinoma should be referred to an expert centre that has integrated expertise in endoscopy, imaging, surgery and histopathology. This allows the initial diagnosis to be confirmed by a second pathologist (ideally an expert gastrointestinal pathologist) and allows assessment and management by a multidisciplinary team.

Until a decade ago, the only definitive management option for patients with HGD or early oesophageal adenocarcinoma was oesophagectomy. Because of the low risk of metastatic disease in cancers confined to the mucosa (1–2% for T1a lesions),67 the past decade has seen a number of endoscopic techniques developed to manage these conditions. These techniques can be divided in to two groups: resection (endoscopic mucosal resection [EMR] and endoscopic submucosal dissection); and ablation (radiofrequency ablation [RFA], argon plasma coagulation, photodynamic therapy and cryotherapy). In Australia, EMR and RFA are the most commonly used resection and ablation techniques, respectively (Box 4 and Box 5). In EMR, the oesophageal mucosa is aspirated into a cap on the end of the endoscope, a band applied and the captured mucosa and submucosa resected and retrieved endoscopically. In RFA, thermal injury delivered by an endoscopically placed device is used to destroy the oesophageal mucosa. Although these endoscopic methods do carry a small risk of complications (pain, bleeding, perforation and stricture formation), they are substantially less morbid, less expensive and more organ-preserving than surgery.68

Initial management of patients with histologically confirmed HGD and early oesophageal adenocarcinoma involves detailed endoscopic assessment and staging of the Barrett’s segment, with EMR of any visible lesions and biopsies of the Barrett’s segment according to the Seattle protocol. EMR of visible lesions enables accurate histological staging of the depth of invasion; studies have shown that EMR can change staging assessments in 48% of patients.69

Endoscopic treatment of high grade dysplasia

In patients with HGD without adenocarcinoma, further endoscopic treatment of the remaining Barrett’s segment is advised because of the risk of metachronous lesions. Treatment options for the residual flat segment vary from patient to patient, depending on factors such as segment length, the presence of a circumferential segment or the presence of an oesophageal stricture and involve EMR and/or endoscopic ablation. Follow-up studies of endoscopic therapy in HGD have shown promising long term results, with complete eradication of dysplasia and metaplasia in 89% of patients at 2 years.70 Longer term outcome studies are awaited. Post-treatment oesophagitis may be associated with decreased success rates of endoscopic therapy. It is therefore recommended that endoscopically treated patients receive ongoing medical therapy with a proton pump inhibitor to control gastro-oesophageal reflux symptoms and to prevent and heal oesophagitis.5 If medical therapy is unable to achieve these goals, surgical fundoplication may be considered. Long term, frequent endoscopic surveillance following treatment is recommended because of the risk of recurrence and metachronous lesions.

Endoscopic treatment of early oesophageal adenocarcinoma

In patients with early oesophageal adenocarcinoma and favourable histology (T1a; size, < 2 cm; well differentiated grade; no lymphovascular invasion; clear resection margins), further endoscopic treatment of the remaining Barrett’s segment can be planned.71 Treatment of the residual segment is advised because of the risk of future metachronous lesions within the segment. The endoscopic method for treating the residual flat dysplastic and non-dysplastic mucosa varies depending on patient factors, but will typically involve EMR and/or RFA. Australian guidelines recommend that ablation should only be used to treat flat dysplastic and non-dysplastic mucosa, and not as primary endoscopic therapy for early oesophageal adenocarcinoma.4

Because of the higher risks of lymph node metastases in T1b lesions (12–50%), surgically fit patients with T1b lesions should be offered oesophagectomy as a potentially curative treatment.40,72 In those patients who are unfit or unwilling to have surgery, endoscopic treatment with or without adjuvant therapy can be offered, but recognising the significant risk of lymph node metastasis that will remain undiminished by endoscopic therapy.73,74

Metachronous lesions or recurrent oesophageal adenocarcinoma have been described in up to 15% of patients undergoing endoscopic therapy for T1a lesions; therefore, long term, frequent post-treatment endoscopic surveillance is recommended. In most cases, lesions found on surveillance can be successfully managed endoscopically, with an overall 94% long term complete remission rate.75 In patients for whom endoscopic therapy is unsuccessful or not appropriate, oesophagectomy should be considered. Surgery in patients with HGD or early oesophageal adenocarcinoma carries a lower perioperative mortality rate (1.6%) than surgery for more advanced oesophageal adenocarcinoma.76

Conclusion

Barrett’s oesophagus describes a metaplastic change to the epithelium of the lower oesophagus that predisposes the person affected to oesophageal adenocarcinoma. While risks of progression are not as high as previously assumed, they are not insignificant, posing a challenge for clinical management. Australian guidelines have been developed to assist practitioners in this area.4 New endoscopic techniques for treating dysplasia and early adenocarcinoma are now available that have markedly lower morbidity than older approaches. In the future, it is possible that new screening and surveillance technologies may prove cost-effective for identifying and managing patients with Barrett’s oesophagus in the community.

Box 1 –
Biopsies from normal oesophagus and Barrett’s oesophagus


A: Normal oesophageal squamous mucosa. B: A segment of columnar-lined oesophagus showing intestinal metaplasia with goblet cells highlighted by Alcian blue staining.

Source: A Clouston, with permission from Cancer Council Australia.

Box 2 –
Endoscopic classification of Barrett’s oesophagus using the Prague criteria7


Prague classification of Barrett’s oesophagus showing the circumferential extent of metaplasia (C) and maximal extent of metaplasia (M) above the true position of the gastro-oesophageal junction (GOJ). This example is classified as C3 M6, with 3 cm of circumferential metaplasia and 6 cm of maximal extent of metaplasia above the GOJ.

Box 3 –
Algorithm for recommended endoscopic surveillance schedule for Barrett’s oesophagus


Source: This graphic is licensed under the Creative Commons Attribution-ShareAlike 3.0 Australia license.

Box 4 –
Endoscopic mucosal resection (EMR)


A: C3 M4 Barrett’s oesophagus; after careful inspection, a focal abnormality was noted at 2 o’clock. B: Focal EMR was performed for staging, confirming high grade dysplasia. C: C7 M8 Barrett’s oesophagus; using a distal attachment cap for improved visualisation, a nodular lesion with slight depression was noted at 12–2 o’clock. D: This area is completely excised by EMR; histology confirmed Barrett’s oesophagus with high grade dysplasia and focal area of intramucosal adenocarcinoma (T1a).

Source: Reproduced with permission from Whiteman et al.4

Box 5 –
Radiofrequency ablation (RFA)


A: C5 M7 Barrett’s oesophagus with high grade dysplasia previously treated by endoscopic mucosal resection and RFA, showing residual disease remaining at 7 o’clock proximally and 12–4 o’clock distally. B: Focal RFA to sites of residual Barrett’s oesophagus. C: C2 M4 Barrett’s oesophagus previously treated by RFA for flat high grade dysplasia. D: Residual Barrett’s oesophagus is treated by focal RFA.

Source: Reproduced with permission from Whiteman et al.4

Gluten content of imported gluten-free foods: national and international implications

Coeliac disease (CD) is the only common disease for which strict dietary compliance is the sole treatment. Sensitivity to gluten varies between patients with CD, so that restricting levels in food to under one part per million (ppm) would protect the maximum number of patients.1 In a daily diet of 500 g food, 1 ppm is equivalent to 0.5 mg, the amount in 1/5000 of a slice of wheat flour bread containing 2.5 g gluten.

International food codes require that foods labelled “gluten-free” (GF) contain less than 20 ppm gluten; in Australia and New Zealand, however, a “no detectable gluten” standard applies.24 Current laboratory techniques have a reporting limit of 1 ppm, and a detection limit of 0.5 ppm gluten in food. We assessed the compliance of imported GF-labelled foods with the local food standard, as well as the international capacity of industry to comply with Australian standards, given commercially available analytical reporting and detection limits.

A total of 169 GF-labelled food items manufactured overseas were purchased from four retailers in Perth, Western Australia. The countries of origin were in Europe (nine countries), Asia (nine), and North (two) and South America (five); the food categories included crackers, bread and biscuits (41 items), cereals, flour and grains (37), condiments and sauces (30), spices (21), pasta (16), drinks and soups (15), and confectionary and snacks (nine).

We used a sandwich enzyme-linked immunosorbent assay (ELISA) gliadin detection kit (ESGLISS-48, ELISA Systems). Testing complied with strict food chemistry testing protocols: five variable concentration calibration standards and blank solution tests were used, calibration standards performance was confirmed every 15 samples, internal control materials were employed, and duplicate random samples (1 in 10) from each ELISA plate were tested. All positive results were confirmed on a stored original food sample.

Gluten was detected in 24 of 169 products (14%), of which 20 had unquantifiable but detectable levels (< 1 ppm) and four had quantifiable levels (three, 1.0 ppm; one, 1.1 ppm). Gluten was detected in products supplied from each of the four continents and from each food category (except pasta and drinks/soups).

Our findings, in conjunction with those of 2008 and 2010 surveys of foods mostly produced in Australia,5 have three important implications. Firstly, people with CD can confidently consume GF-labelled products purchased in Australia. Secondly, a marked tightening of international GF standards is readily achievable by industry; the gluten levels in the foods we analysed were all below 1.5 ppm, less than one-tenth of the standard set by the Codex Alimentarius of < 20 ppm.2 Thirdly, we recommend that authorities revise the current Australian GF standard of “no detectable gluten”4 to “≤ 1 ppm”, as it is not practical or reasonable for industry to comply with the stricter standard. In our survey, 14% of products were non-compliant with the current Australian standard, but none contained more than 1.1 ppm gluten.

Irritable bowel syndrome, dyspepsia and other chronic disorders of gastrointestinal function

New diagnostic criteria and knowledge are changing how patients are treated

In this issue of the MJA, we highlight a number of topics of major interest in gastroenterology, including Barrett’s oesophagus,1 the risks of proton pump inhibitors,2 biosimilars for inflammatory bowel disease,3 and gluten intolerance.4

Chronic or recurrent gastrointestinal symptoms are frequently encountered in primary care.5 Most patients who present with gastrointestinal symptoms do not, however, have inflammatory bowel disease, cancer or another sinister pathology, but rather an unexplained or functional gastrointestinal disorder (FGID).6 The best known FGID is the irritable bowel syndrome (IBS), but there are other FGIDs that need to be recognised, as there is effective management that can improve people’s lives.69 The expert consensus is that clinicians should strive to make a positive clinical diagnosis of an FGID on the basis of the patient’s history, and not simply wait for negative test results.6 In 2016, new international guidelines on diagnosis were published, the updated Rome (IV) Criteria (www.theromefoundation.org),69 and all clinicians who see patients with chronic gastrointestinal symptoms should be familiar with them.

IBS is not a diagnosis of exclusion, but a characteristic symptom complex that can usually be identified by asking a few simple questions. Patients with IBS present with long standing abdominal pain, directly linked to a disturbed bowel habit (diarrhoea, constipation, or both); they often also have bloating (sometimes with visible distention). The pain is often relieved (but is sometimes aggravated) by defaecation, and at the onset of or during pain the stool is often altered in frequency or form (ranging from liquid to separate nut-like lumps).6 IBS does not cause vomiting, dysphagia, weight loss, nocturnal diarrhoea, bleeding, or anaemia; if these features are present, another diagnosis should be considered and the patient referred for further investigation. Psychological distress (anxiety or depression) commonly accompanies IBS, and there is increasing evidence that in some cases these symptoms begin after and are secondary to the gut disturbances, including dysbiosis and moderate inflammation, which can induce a circulating low grade cytokine storm.5,10

Unless there are specific red flags or severe symptoms, testing of people with clear-cut IBS should be limited; a full blood count (detecting anaemia, for example) and elevated levels of plasma C-reactive protein (or of stool calprotectin) might suggest inflammatory bowel disease.6 If diarrhoea fails to respond to simple interventions, coeliac disease, which can mimic IBS symptoms, should be ruled out by assessing tissue transglutaminase levels; total IgA levels should also be measured, as an IgA deficiency will cause false negative test results.6 In older patients (particularly women) with diarrhoea unresponsive to therapy, microscopic colitis, which can be confused with IBS, should be considered; the diagnosis requires colonoscopy and biopsy (but the yield is low).6 New onset IBS symptoms, including constipation, bloating, lower abdominal pain and early satiety, in a post-menopausal woman should raise suspicion of ovarian cancer (although it is rare).

Another cause of constipation that can be confused with IBS is dyssynergic defaecation, which can be a learned behaviour: some patients strain to defaecate, but at the same time involuntarily contract the external anal sphincter, which should be relaxed. A rectal examination can screen for this problem, and biofeedback training can provide long term relief in about 70% of patients.8 A further frequently unrecognised possibility in patients taking narcotics (for any reason) is narcotic bowel syndrome. Paradoxically, opiates often aggravate chronic pain, leading the patient to take increasing doses that aggravate rather than relieve abdominal pain, resulting in constipation; opiate withdrawal may be beneficial.7

There are further FGIDs that should not be overlooked. A patient who presents with “vomiting” may actually be experiencing effortless regurgitation. The patient’s history will be the best guide; the vomiting reflex makes it impossible to keep vomitus in the mouth and to then spit it out. Effortless regurgitation of food after meals is usually related to rumination syndrome, a learned behavioural response now recognised in otherwise healthy adults and children;9 diaphragmatic re-breathing training applied during and after meals can reduce and even eliminate the problem.11 Patients presenting with genuine vomiting may report that the attacks occur as clear episodes lasting a few days, and that they are reasonably well between attacks; cyclic vomiting syndrome should be considered in these cases, also recognised as occurring in adults and children.9 If the patient indicates that their vomiting is improved by a hot shower or bath (which they will do compulsively), it is highly suggestive of cannabinoid hyperemesis syndrome, and eliminating cannabis use (which many are reluctant to do) usually provides relief.9

Dyspepsia is a common presenting complaint. Early satiety (inability to finish a normal meal) and postprandial fullness are more prevalent than epigastric pain, but all can occur together; most of these patients have functional (non-ulcer) dyspepsia (FD).9,12 Helicobacter pylori is recognised not only as a cause of peptic ulcer, but also of FD, and treatment can provide long term relief, albeit only in a minority of cases.13 A newly recognised but common syndrome is duodenal eosinophilia in FD; a duodenal biopsy will indicate low grade inflammation, but the pathologist needs to count eosinophils in five high power magnification fields to avoid overlooking the abnormality.14 This key finding has opened up new treatment opportunities, and even hopes for a cure.12

FGIDs are important and costly conditions.69 Diagnosis depends in many cases on taking a good history; pathology tests supplement clinical judgement, but should not dominate deliberation by the clinician. There is no evidence that a negative endoscopy reassures an FGID patient;15 a positive diagnosis should be based, when possible, on a suggestive history. New insights into the pathogenesis of FGIDs, including the observation of subtle structural changes, suggest that many of these disorders are organic in nature, and cures for some may be available in the near future.12

Biosimilars in inflammatory bowel disease

Cost savings are welcome but evidence supporting equivalence of biosimilar and originator drugs is currently limited

The management of inflammatory bowel disease has undergone major changes in the last decade with the availability on the Pharmaceutical Benefits Scheme (PBS) of targeted biological therapies. The first of these was the anti-tumour necrosis factor α (anti-TNF-α) monoclonal antibody infliximab, followed by another anti-TNF-α antibody adalimumab, and, more recently, the first gut-specific T-cell trafficking inhibitor vedolizumab, an anti-α-4 β-7 integrin monoclonal antibody. These drugs have resulted in a shift in the management paradigm from symptom control and the minimisation of exposure to corticosteroids to now aiming for healing of the intestinal mucosa, prevention of damage and subsequent disability.1

The development of biologic medication is comparatively long and the manufacturing process very expensive, resulting in a high cost for these agents.2 In Australia, the most expensive single drug in absolute dollar value for the 2015 financial year was adalimumab, with biologic agents making up five of the top eight most costly drugs and accounting for over 12% of the total PBS spend.3 Given the increasing incidence of diseases that may be best managed by biologic agents, and the prolonged duration of therapy involved, the costs of these drugs are rising annually. These cost increases could pose a significant risk to the sustainability of the PBS system.

The patents for the initial biologic agents are starting to expire, which has led to the development of what are known as biosimilar versions of the originator product. These competitor drugs have created pressure to reduce the cost for the health system. The first biosimilar to infliximab was listed on the PBS in December 2015.

Biologic therapies are very different from chemically synthesised drugs, typically being large protein-containing agents produced from recombinant DNA and cell culture techniques, with complex post-translational modification and glycosylation. The technique of production can result in significant variability even between batches of production and requires strict quality assurance and in vitro assessments.4 The Therapeutic Goods Administration (TGA) has harmonised with and adopted a number of the guidelines of the European Medicines Agency regarding the assessment and approval of biosimilar medicines. To be considered a biosimilar medicine in Australia, the new product must have “demonstrable similarity in physicochemical, biological and immunological characteristics, efficacy and safety”.4 Despite this, these drugs are not considered to be identical or to have demonstrated bioequivalence with the originator biological medicine.

The major difference in the approval process between an originator drug and a biosimilar is that if the originator drug has more than one indication, the efficacy and safety of the biosimilar may only need to be demonstrated in one indication and this will be extrapolated to the other disease indications in which the originator drug is approved. The randomised controlled trials for the biosimilar infliximab CT-P13 (now commercially available in Australia) were only required in ankylosing spondylitis and rheumatoid arthritis and not Crohn disease or ulcerative colitis.5,6 The listing for the biosimilar infliximab on the PBS covers all the indications of the originator infliximab.

Cost savings accompany the listing of biosimilar agents on the PBS, with a mandated 16% drop in the PBS rebate and a move from the F1 to F2 formulary, where the drugs are then subject to application of the PBS price disclosure policy. This assesses the actual cost of supplying the drug to retail pharmacies and results in further adjustment and reduction of the PBS rebate over time to more accurately reflect the cost price.7

Despite the welcome cost reductions that have accompanied the arrival of the first biosimilars, unanswered questions remain about their long term interchangeability with the originator product. All biologics are immunogenic and can result in antibody formation, reactions, and loss of efficacy with time. Up to 20% of patients on maintenance therapy may develop antibodies to anti-TNF-α monoclonal antibodies.8 Given that biosimilar drugs are not identical, there is a theoretical risk that switching between agents may result in the development of neutralising anti-drug antibodies (ADAs) and subsequent loss of response. At present, there are some reassuring data from the open label extension studies of the PLANETAS and PLANETRA studies, where there were no significant differences in the rate of ADA formation between patients who continued on the biosimilar product and those who had a single switch from originator infliximab to the biosimilar infliximab at 1 year; however, trough drug levels were not reported.9,10 ADAs in the presence of low or absent drug levels are strongly associated with clinical loss of efficacy.11 Since the introduction of the biosimilar infliximab in Europe, several countries have mandated a single switch. The early data are reassuring but, as yet, only reported in small numbers and in abstract form, and a large Norwegian randomised controlled trial has recently been completed (https://clinicaltrials.gov/ct2/show/NCT02148640). Further reassuring data were seen in the cross-reactivity of ADA from patient sera to the originator infliximab having near identical binding to the biosimilar infliximab CT-P13; however, this has not been demonstrated in reverse.12 The vast majority of ADAs to anti-TNF-α monoclonal antibodies appear to be against the fragment antigen-binding region and may be neutralised by the addition of TNF-α. This reaction to TNF-α would be expected to be identical for originator and biosimilar agents and less prone to interference due to glycosylation and conformational changes.13

At present, studies have investigated a single switch between the originator and the biosimilar anti-TNF-α agent, whereas multiple switch and switch-back strategies have not been assessed. The Australian government has stated that biosimilar and originator anti-TNF-α agents can be considered interchangeable at the point of dispensing from the pharmacy, as is the case with small-molecule generic medicines. This practice known as “a-flagging” and requires patient consent.4 This may result in patients electing to receive a different anti-TNF-α agent at each time point of dispensing. Under the legislation, the only way a prescriber can ensure that a patient is continued on the initially prescribed biologic agent, be that either a biosimilar or an originator biologic, is to tick the “brand substitution not permitted” box on the prescription.

This decision has caused the greatest concern for prescribing clinicians and representative bodies. The absence of data to suggest adverse reactions or the development of ADA from multiple switching does not imply safety.

At the point of registration, biosimilars are required to satisfy the criteria of similarity to the originator, but the TGA has stated that it is “inevitable that reference and biosimilar medicines will diverge to some degree after comparability has been established”.14 In theory, this increases the chance of antigenic changes developing, and no clinical studies have assessed this to date. There has been no additional pharmacovigilance program instituted to monitor the outcomes of a-flagging, with only the drug sponsor required to develop a risk management plan and a reliance on voluntary reporting by prescribers of adverse outcomes to the TGA. This could be considered equivalent to conducting a clinical trial on the Australian public without the means to accurately capture data such as loss of response, requirement for corticosteroid therapy, or milder adverse reactions that may not result in reporting. However, a consultation process by the government on this with relevant stakeholders is ongoing.

Infliximab is only given intravenously, but the next biologic agents to come off patent that will result in biosimilars entering the market will be self-injectable (for example, etanercept and adalimumab for rheumatoid arthritis). The parenteral administration of these agents is far more complex than the taking of an oral agent and requires familiarity and ability to use the delivery devices. Further, many patients utilise and are dependent on patient support programs that are supplied by third party providers while being funded by the pharmaceutical companies. The viability of these important programs for patients who are potentially undergoing switches between biologic products is unknown.

A significant number of inflammatory bowel disease patients also require dose escalation to maintain clinical response, beyond the fixed dosing regimens funded by the PBS. At present, the compassionate access programs of the pharmaceutical companies provide these additional doses, with the PBS recently rejecting a submission to provide dose tailoring. With the potential for a patient to receive multiple versions of the same biologic, where there are no safety data supporting this practice, the provision of compassionate doses is also under threat.

The arrival of biosimilars is welcomed by clinicians for the cost savings they bring to our health system, but ongoing studies and pharmacovigilance are required in a framework that captures clinical response data. The decision to allow a-flagging in this area of limited evidence has caused concerns for clinicians and patients alike. Ongoing education of prescribers, pharmacists and patients is required, and the minimisation of unnecessary switches until more safety data are available is recommended.