×

A review of maturity onset diabetes of the young (MODY) and challenges in the management of glucokinase-MODY

Case presentation

A 63-year-old lean female of Asian ethnicity was referred to our service in 2006 with a 12-year history of well controlled type 2 diabetes (T2D) in the absence of micro- or macrovascular complications. She had undetectable β-cell antibodies. Her fasting glucose levels were 6–7 mmol/L and her glycated haemoglobin (HbA1c) level was 7.3% (56 mmol/mol). She was previously diagnosed with gestational diabetes mellitus (GDM) in three of five pregnancies, requiring insulin with the fourth pregnancy. All children were born without complication and of normal weight. Her father and five of six siblings were diagnosed with T2D. Over time, her management included diet and exercise, metformin 850 mg three times a day, modified release gliclazide 60 mg daily, and pioglitazone 45 mg daily. Ten years after referral, her HbA1c level was 7.6% (60 mmol/mol). She trialled basal insulin (glargine), but it was ceased as it was apparently ineffective. Her weight remained stable and her HbA1c levels showed little variation with escalating oral therapy. She developed postmenopausal osteoporosis and pioglitazone was ceased. Her daughter, who was also lean, was diagnosed with GDM during routine antenatal care. Given the autosomal dominant penetrance of diabetes in the family, she underwent genetic testing for maturity onset diabetes of the young (MODY) subtype 2 due to a glucokinase gene mutation (GCK-MODY), for which she tested positive. Our index patient also underwent genetic testing, and similarly tested positive for the same heterozygous mutation (aberrant splicing of intron 8c.1019+1G>A).

After being treated for more than 20 years, the patient was advised to cease treatment. She did so reluctantly, mainly due to the years of advice stressing the importance of treatment adherence. Her HbA1c level remained at 7.8% (62 mmol/mol) 3 months after treatment cessation. A 1-week continuous glucose monitoring study revealed fasting glucose levels of 7.5–8.4 mmol/L with the largest postprandial glucose excursion of about 3.0 mmol/L.

Literature search and sources

The sources used in this narrative review were obtained from original publications or reviews from groups renowned for their work in the definitions and genetics of MODY subtypes. Other publications were obtained from the MEDLINE and EMBASE databases and limited to English language; they were preferably recent publications (within < 10 years) and published in high impact journals. Information on specific genetic mutations and clinical phenotypes for the MODY subtypes were also obtained from the Online Mendelian Inheritance in Man online catalogue (www.omim.org).

What is MODY?

MODY is a heterogeneous group of monogenic diabetes disorders due to pancreatic β-cell dysfunction.1,2 Patients with MODY have early onset of diabetes and typically lack features of insulin resistance or autoimmunity. The MODY subtypes, of which there are currently 14, were first identified in the 1970s.35 They have an estimated population prevalence of 1.1:1000, or about 1–2% of diabetes cases (Box 1) in white Europeans, but are present in every race and ethnicity.6

The three most common MODY subtypes are mutations of hepatocyte nuclear factor 1A (HNF1A, MODY3), HNF4A (MODY1) and GCK genes. The GCK mutation, known as MODY subtype 2 (MODY2), or more recently as GCK-MODY, constitutes 10–60% of all MODY cases (Box 2).2,911 Rarer mutations resulting in β-cell dysfunction are also considered as separate MODY subtypes, and include alterations to insulin promoter factor 1 (MODY4), HNF1B (MODY5), and neurogenic differentiation factor 1 (MODY6) (Appendix). Patients with MODY5 constitute 5% of all MODY subtypes; MODY5 has been named the “renal cysts and diabetes syndrome,” as it often encompasses other urogenital malformations, pancreatic atrophy and deranged liver function tests.

The reference list includes succinct and lengthier reviews for further reading on MODY subtypes7,10,12,13 and on GCK-MODY.2,7,14

MODY subtypes 1 (HNF4A) and 3 (HNF1A)

Although driven by different mutations, the clinical phenotypes due to alterations of the HNF4A (MODY1) and HNF1A (MODY3) are best regarded as similar entities, because the features and management are similar.7,10,15 It is believed that mutations in HNF4A and HNF1A, which function as transcription factors, specifically result in dysfunction of the α, β and pancreatic polypeptide cells within pancreatic islets, resulting in reduced or delayed insulin secretion in response to glucose.15,16 In general, both MODY1 and MODY3 may present with mild diabetes, although usually postprandial blood glucose excursions are greater than those seen in GCK-MODY (ie, ≥ 5 mmol/L).17 Clinical features of MODY3, in addition to those listed in Box 2, include young onset diabetes usually before the age of 25 years in at least one family member, not normally requiring insulin initially, with generally good glycaemic control with less insulin than anticipated, detectable C-peptide in the presence of a blood glucose level (BGL) of over 8 mmol/L, family history spanning at least two generations, postprandial glucose excursions over 5 mmol/L with or without normal fasting glycaemia, absence of pancreatic autoantibodies and glycosuria when BGLs are under 10 mmol/L (given the low renal threshold for glucose wasting).18 These patients usually have a profound response to low doses of sulfonylurea therapy,16,19 with one randomised cross-over trial demonstrating about a 5-fold greater response with gliclazide compared with metformin. Patients also typically lack features of metabolic syndrome or insulin resistance (eg, obesity, acanthosis nigricans, elevated or normal high density lipoprotein cholesterol, and normal triglycerides).10,12

In contrast, MODY1 (HNF4A) is much less common, although the clinical features are similar to MODY3 (HNF1A), aside from a later age at diagnosis and the lack of pronounced glycosuria. Patients with MODY1 also share sensitivity to sulfonylureas. Offspring of women with MODY1 are often born with macrosomia (> 4.4 kg in 56% of carriers) and there may be transient neonatal hyperglycaemia.8 Clinical suspicion should be raised when there is a strong family history of pronounced macrosomia, or less commonly, if there is diazoxide (a medication used to treat hypoglycaemia) responsive neonatal hyperinsulinism in the context of familial diabetes.

Like T2D, both MODY1 and MODY3 are progressive forms of diabetes, and insulin secretion reduces over time.13 It is expected that micro- and macrovascular complications should be screened for, especially retinopathy and nephropathy. Treatment with insulin may be needed in 30–40% of affected individuals.12 Mutations in HNF4A favourably affect lipid biosynthesis and are associated with a 50% reduction in serum triglyceride levels and a 25% reduction in certain serum apolipoproteins.10

MODY2 (GCK-MODY) is often misdiagnosed

Based on the frequency of diagnoses, referral rates and prevalence in the United Kingdom, it is likely that GCK-MODY is underdiagnosed (or misdiagnosed as T2D) as more than 80% of patients with GCK-MODY do not undergo genetic testing.20 The condition is driven by an inactivating, heterozygous mutation of GCK, the glycolytic enzyme that catalyses the conversion of glucose to glucose 6-phosphate, the initial step in the chain of glucose metabolism in the β cell, consequently required for the release of insulin.21 In GCK-MODY, GCK is abnormal and functions at a higher glucose sensing threshold, earning its reputation as the “glucose sensor” of the β cell and the hepatocyte.22

The clinical phenotype is asymptomatic, mild hyperglycaemia present from childhood, usually ranging from 5.4 to 8.3 mmol/L. Most patients have an HbA1c level of 5.6–7.3% (41–56 mmol/mol) if they are less than 40 years old, or 5.9–7.6% (41–60 mmol/mol) if they are more than 40 years old.23

Special groups

All children with fasting hyperglycaemia need exclusion of GCK-MODY

Chronic childhood hyperglycaemia is exceptionally abnormal and, therefore, GCK-MODY along with type 1 diabetes (T1D) are the major differential diagnoses to consider, as GCK-MODY is present in 10–60% of all children with fasting hyperglycaemia.2 One cohort study of 82 children with fasting hyperglycaemia (BGL, ≥ 5.5 mmol/L) and negative β-cell antibodies found a GCK mutation in 48% of the cases.24 The major discriminating features favouring T1D are the presence of one or more islet cell antibodies, more pronounced hyperglycaemia, requirement for insulin within 5 years of diagnosis, and a stimulated C-peptide level lower than 200 pmol/L, as these are usually lacking in GCK-MODY.1,25

Pregnant women with GCK-MODY may need treatment

Epidemiological studies suggest that GCK-MODY is present in 1–2% of mothers diagnosed with GDM, and it usually presents as asymptomatic, mild fasting hyperglycaemia.6 A lower body mass index (BMI, < 25 kg/m2) and a fasting glucose level greater than or equal to 5.5 mmol/L have sensitivity and specificity of 68% and 96%, respectively. It is estimated that among lean women with mild fasting hyperglycaemia, the number of women needed to test is 2.7 to detect a single case of GCK-MODY.6 With new diagnostic thresholds adopted in Australia defining the diagnosis of GDM (ie, fasting BGL, 5.1–6.9 mmol/L),11 it is likely that more cases will be detected incidentally. Treatment in mothers with a known GCK-MODY mutation is indicated only if the fetus has a confirmed normal genotype (via chorionic villus sampling or amniocentesis) or if there is sonographic evidence of accelerated fetal growth on ultrasound, since this likely reflects fetal hyperinsulinaemia as the fetus attempts to overcome maternal hyperglycaemia. Treatment is with insulin, which is normally ceased postpartum.2,26,27

Diagnosis

Mild, fasting hyperglycaemia in younger, slimmer patients

There are no distinct clinical features of GCK-MODY. Suspicion is based on the findings of persistently elevated fasting hyperglycaemia (5.4–8.3 mmol/L), HbA1c levels of 5.8–7.6% (40–60 mmol/mol), young age (< 30 years old), non-obese phenotype, post-prandial glucose excursions lower than 3 mmol/L, and autosomal dominant pattern of inheritance of diabetes.2,7 With respect to the latter, a strong clinical clue is that many relatives of patients with known GCK-MODY will have been diagnosed with prediabetes, T1D or T2D, yet they rarely require insulin despite being diagnosed for many decades, and seemingly few, if any, develop complications. Despite this, about 20% of family members with GCK-MODY receive treatment with oral hypoglycaemic therapy and a minority with insulin.4,28,29

Genetic testing is the gold standard

Confirmation of GCK-MODY is performed by molecular genetic testing using Sanger sequencing and requires 5–10 mL of ethylenediaminetetraacetic acid (EDTA)-treated blood. There are over 620 gene mutations identified throughout the ten pancreatic β-cell exons of the GCK gene in more than 1400 families.30 Samples can be sent to a number of laboratories.31,32 For example, one laboratory’s cost and processing time (4–8 weeks) will depend on whether the mutation is known to be due to a GCK mutation (cost ∼ $600) or either of HNF4A or HNF1A (∼ $800).2 A 16-gene MODY panel may also be requested for about $1145. Local laboratories can also perform the analysis for GCK mutations for $745 with a turn-around time of 4 weeks.32 Other mutations (ie, HNF4A, HNF1A) may be analysed by requesting a MODY 10-gene panel (next generation sequencing), inclusive of GCK gene mutation testing. A 4 mL EDTA blood sample is required (or 2 μg genomic DNA) and the cost is about $1100 with a 4-week turn-around time. As whole genome sequencing becomes more widely available, testing for heritable diabetes syndromes will become easier to access and new syndromes will be discovered (this information is current at the time of printing).

Testing patients greatly influences management

Because a diagnosis of GCK-MODY will significantly alter management, the clinician should be alert for suspected cases and refer suitable patients for genetic testing. However, as our case illustrates, in patients treated with diabetes medications for many years, the physician should discuss testing in an unbiased manner, without assuming that the patient will embrace a positive result that will allow them to cease therapy. If patients are amenable to ceasing treatment, as in our patient, this may cause significant stress and anxiety due to a feeling of guilt and perceived future morbidity. This is due to multiple previous clinical discussions with the patient stressing the importance of treatment adherence and tight glycaemic control. This is similarly important in patients with MODY3, in whom a positive diagnosis allows cessation of insulin and a switch to a sulfonylurea, which is likely to have been administered in a basal-bolus regimen or via an insulin pump for many years. Patients should be alerted that confirming a diagnosis of GCK-MODY not only significantly influences the number of investigations and reduces the treatment burden to them, but it also carries implications for relatives who may be undiagnosed, with offspring having a 50% chance of inheriting the gene.

To treat or not to treat

Arguments against treatment

With the exception of pregnancy, GCK-MODY has been regarded as a lifelong subtle abnormality in glucose homeostasis that is not progressive and shows little deterioration over time.16,33 This is in contrast to MODY3 (20–50% of cases), MODY1 (∼ 5% of cases)7 as well as T1D and T2D. GCK-MODY should therefore be considered a distinct clinical entity.2 As the fasting hyperglycaemia is often mild, varies little with time, and rarely results in the development of micro- or macrovascular complications, treatment is thought unlikely to change clinical outcomes.2,33 In a recent, large cross-sectional study involving GCK-MODY patients with a mean duration of 49 years, patients developed only mild background retinopathy when compared with healthy controls. Moreover, macrovascular complications developed in 4% of GCK-MODY patients versus 30% in patients with T2D, possibly reflecting the more favourable lipid profile in this condition.33

It is also known that the mild fasting hyperglycaemia in patients with GCK-MODY is resistant to oral diabetes therapy as well as dietary changes, due to the altered set point at which glucose homeostasis is maintained by the loss-of-function mutation of GCK.28 Therefore, treatment may not alter a patient’s glycaemic control or their trajectory towards developing complications as a result of mild fasting hyperglycaemia.

Arguments for treatment

As with the rest of the population, which is affected by genetic susceptibility, advancing age and rising rates of obesity, patients with GCK-MODY may also concurrently develop the metabolic derangements typical of T2D, such as progression of insulin resistance and β-cell failure.34 For example, one retrospective study of 33 patients with GCK-MODY over an 11-year period illustrated a small but significant deterioration in fasting (6.8–7.1 mmol/L) and 2-hour glucose levels (8.2–9.0 mmol/L), as well as decreases in insulin sensitivity when baseline and repeat oral glucose tolerance tests were compared.34 This was also associated with a mean increase in BMI from 19.2 to 22.3 kg/m2. More recently, it has been suggested that patients with GCK-MODY should be considered for treatment when the HbA1c level clearly and repeatedly exceeds 7.6 (60 mmol/mol).2,23 However, the question of whether to treat or not, based on a specific HbA1c level in patients with GCK-MODY, remains controversial; notwithstanding, HbA1c itself has limitations in predicting the development of microvascular complications.35

The verdict is divided

The decision to treat the patient should take into consideration the patient’s age, the current mild to moderate hyperglycaemia, the observation of postprandial glucose intolerance, the patient’s preference and the suboptimal HbA1c level, which may increase the risk of both micro- and macrovascular complications. This is in the context of an anticipated trajectory of deteriorating glycaemic metabolism that often accompanies advancing age and weight gain. This would naturally be weighed against the risks, cost and inconvenience of multiple investigations and the need for medical appointments, frequent self-monitoring of glucose levels, cost of glucose test strips, as well as patient anxiety.36 Furthermore, many patients may suffer from side effects from pharmacologic therapy; notwithstanding, weight gain, hypoglycaemia (especially if on sulfonylurea or insulin), gastrointestinal upset and vitamin B12 deficiency with metformin, as well as the adverse metabolic consequences to bone metabolism, bladder cancer risk and heart failure with thiazolidinediones, as in our index patient, should be considered. To date, there are no data on the efficacy of dipeptidyl peptidase 4 inhibitors, glucagon-like peptide-1 receptor agonists, or sodium glucose cotransporter 2 inhibitors, in these patients. Therefore, a careful examination, by an attentive clinician, of the patient’s goals, quality of life, comorbidities and an estimation of benefit, should form the basis when considering the decision to treat.

Genetic testing is underutilised but may be cost-effective

The burden and cost, both personally and to the community, are difficult to estimate when considering the implementation of a screening strategy at a national level. A recent cost-analysis simulation of a one-time genetic screening test (with a cost of US$2580) for the three most common MODY subtypes (GCK, HNF1A, HNF4A) — which account for more than 90% of all MODY cases — within the first year of diagnosis, was undertaken in a hypothetical cohort of young individuals (aged 25–40 years old) with a diagnosis of diabetes.36 The study assumed that the prevalence of GCK-MODY was 6% (similar to other countries), and when diagnosed, patients with GCK-MODY received no treatment. The screening test yielded an average small gain of 0.012 quality-adjusted life years and an incremental cost-effectiveness ratio of US$50 000.36 The cost-effectiveness extends to children, and arguably more so, with savings of about €1500 per year from time of diagnosis, as intensive treatment for presumed T1D in children is reduced to conservative management in the case of a positive diagnosis of GCK-MODY.37

It is not just MODY; diabetes genes are common in the general population

It is worth noting that not all genetic causes of diabetes can be ascribed simply to monogenic (single gene) mutations such as in MODY, or that there are a small number of rare genes inherited within generational lines that specifically affect an individual’s risk of developing diabetes. This approach, although clinically useful, is simplistic and may inadvertently overlook the fact that, on the whole, the population carries multiple, common genetic alterations in a single gene (ie, variants) that may collectively increase the risk of developing diabetes.38 A recent large analysis of exomes (protein-coding regions which comprise a fraction, 1–2%, of the whole human genome), from 6500 subjects with T2D matched to an equal number of healthy controls from five ethnic groups, has cast doubt on the evidence that rare or low frequency disease-associated variants affect the risk of developing diabetes. The authors note that most of the diabetes-associated genetic variants are quite common in the population.39

Conclusion

Despite the availability of genetic testing, there are a significant number of patient- and physician-related factors that may be prohibitive to uptake, including the perceived lack of possibilities for treatment (if coexistent MODY and T2D develop over time, many would argue that it may not change management if hyperglycaemia is mild; however, we believe that it makes a difference to management and monitoring) and prevention, cost implications of a positive diagnosis to patients, and lack of awareness of MODY as a diagnosis.40 These factors should all be discussed with the patient when considering genetic or genomic testing. The patient should be counselled regarding the treatment implications of a positive diagnosis, including the possibility that they may have not required the treatment they were prescribed many years prior. The points raised by this review will be increasingly relevant to the medical practitioner given the rapid development of genetic and genomic testing.

Box 1 –
Subtypes of diabetes according to relative prevalence


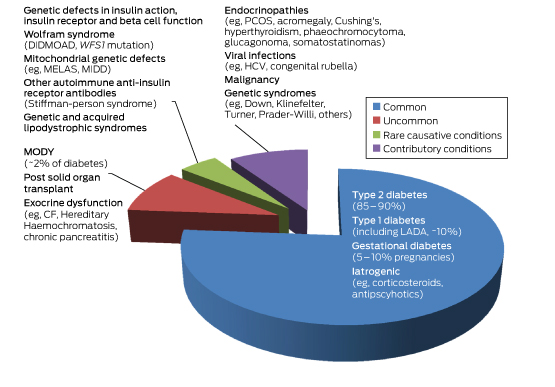
CF = cystic fibrosis. DIDMOAD = diabetes insipidus diabetes mellitus optic atrophy deafness. GDM = gestational diabetes. HCV = hepatitis C virus. LADA = latent autoimmune diabetes of the adult. MELAS = mitochondrial myopathy, encephalopathy lactic acidosis and stroke-like episodes. MIDD = maternally inherited diabetes. MODY = maturity onset diabetes of the young. PCOS = polycystic ovarian syndrome. WFS1 = wolframin gene.

Box 2 –
Prevalence, genetic and key clinical features of the common forms of diabetes and subtypes of maturity onset diabetes of the young (MODY)

Type 2 diabetes

Type 1 diabetes

Gestational diabetes

MODY1

MODY2

MODY3


Prevalence

1 in 13 people (∼ 870 000 in Australia)

10% of all diabetes (∼ 170 000 in Australia)

5–10% of all pregnancies

∼ 5%*

10–60%*

20–50%*

Causative mutation

Multiple polymorphisms (eg, class II HLA genes)

Multiple polymorphisms

Multiple polymorphisms

HNF4A7,8

GCK2

HNF1A10

Clinical features

Older (usually > 45 years), overweight or obese, often family history, insulin resistance

Slim, family history of autoimmune disorders, usually childhood or early adolescence or adulthood (includes LADA)

Older (> 40 years); pre-pregnancy obesity (BMI, > 30 kg/m2); family history (30%) and ethnicity; previous GDM; PCOS; macrosomic babies, diagnosed 24–28 weeks’ gestation

Young age (< 25 years), strong family history of diabetes, absent antibodies, detectable C-peptide

Diagnostic glucose and HbA1c

75 g OGTT: fasting BGL, ≥ 7 mmol/L; random or 2-h postprandial BGL, ≥ 11.1 mmol/L; HbA1c, ≥ 6.5% (48 mmol/mol)

Similar to type 2 diabetes

75 g OGTT: fasting BGL, 5.1–6.9 mmol/L;1-h, ≥ 10 mmol/L; 2-h, 8.5–11 mmol/L11

As with type 2 diabetes; postprandial glucose excursions, ≥ 5 mmol/L

Fasting BGL, 5.4–8.3 mmol/L; postprandial glucose excursions, ≤ 3 mmol/L, HbA1c, 5.8–7.6% (40–60 mmol/mol)

As for MODY1

Treatment

Diet, exercise, OHG, injectable GLP1 RA, insulin

Insulin

Diet, exercise, metformin, insulin

Respond to sulfonylureas, 30–40% apparent insulin-requiring

None required (controversial)

As for MODY1

Special features

Progressive β-cell dysfunction with development of micro- and macrovascular complications

Negative C-peptide and DKA without insulin (outside of honeymoon period), positive antibodies in majority to GAD, IA-2, ICA, IAA and ZnT8

Hyperglycaemia remits postpartum

Glycosuria common; develop micro- and macrovascular complications as in type 1 and 2 diabetes

Favourable lipid profile; lean; minimal or no micro- or macrovascular complications; minimal effect of treatment on glycaemic control

As for MODY1; strong family history of macrosomic babies


* Denotes approximate percentage prevalence of all MODY subtypes. DKA = diabetic ketoacidosis. GAD = glutamic decarboxylase autoantibody. GCK = glucokinase gene. GDM = gestational diabetes mellitus. GLP1 RA = glucagon-like peptide 1 receptor agonists. HLA = human leukocyte antigen. HNF1A = hepatocyte nuclear factor 1α gene. HNF4A = hepatocyte nuclear factor 4α gene. IA-2 = insulinoma-associated-2 autoantibody. IAA = insulin autoantibody. ICA = islet cell cytoplasmic autoantibody. LADA = latent autoimmune diabetes of the adult. OGTT = oral glucose tolerance test. OHGs = oral hypoglycaemic therapy. PCOS = polycystic ovarian syndrome. ZnT8 = zinc transporter 8 autoantibody.

Health care homes: lessons from the Diabetes Care Project

Better care coordination, e-health tools and funding systems are essential for chronic disease management

One of the biggest health care challenges in Australia is ensuring that people with chronic diseases receive the care they need in a high quality and sustainable way. Today, one-third of the population — about 7 million people — have one or more chronic conditions, accounting for 85% of the total burden of disease, 90% of all deaths, 40% of general practitioner visits and 60% of disease-allocated health expenditure.1,2 As the National Health and Hospital Reform Commission noted in 2009, these patients often have great difficulty accessing appropriate care and “end up literally ricocheting between multiple specialists and hospitals, not getting access to community support services, and having endless diagnostic tests as each health professional works on a particular ‘body part,’ rather than treating the whole person”.3

In response to this challenge, and drawing on local and international experience,46 the commission recommended the concept of a health care home. The proposal was that people with chronic and complex health problems who chose to enrol with a single primary health care service as their health care home would be supported through a package of funding to strengthen continuity and coordinated, multidisciplinary care and health outcomes.3 The Diabetes Care Project (DCP) was a pilot of the health care home concept, conducted and evaluated from 2011 to 2014.7,8

In 2015, the Australian Government established the Primary Health Care Advisory Group (PHCAG) to re-examine this problem, and it recently announced that, from 1 July 2017, it would begin implementing a trial of health care homes in seven primary health network regions across the country.9,10 The health care home concept, as defined by PHCAG, aims to “provide holistic support and coordinated care for patients [and] support enhanced team based care … [while being] underpinned by shared information … [and] supported by new payment models”.9 Under the proposed model, eligible people with chronic diseases will be able to enrol with a GP practice or Aboriginal medical service, which will “co-ordinate all of the medical, allied health and out-of-hospital services required as part of a patient’s tailored care plan”.10 This will involve significant changes for both Medicare and the wider health care system. Moreover, funding to support people enrolled in health care homes will be bundled together into regular quarterly payments, signalling a move away from the current fee-for-service payment system for this population (except where a health problem does not relate to their chronic disease).

There have been various definitions of medical homes and health care homes described in the literature.1114 The concept of the health care home proposed by the government is similar to the approach tested in the DCP, and it is timely to reflect on how lessons learned during that trial could inform current efforts to introduce a health care home model in Australia.7,8

The DCP was one of the largest randomised controlled trials of coordinated care for people with a chronic disease ever conducted. It involved 184 general practices and 7781 people with diabetes in South Australia, Victoria and Queensland from 2011 to 2014. Practices were randomised into a control group or one of two intervention groups. Group 1 received a new information technology system and regular updates on their performance, and group 2 received the same interventions as group 1 plus a new funding model similar to that being proposed by PHCAG for the new health care homes. After 18 months, participants in group 2 showed an improvement in the mean glycated haemoglobin (HbA1c) level (the primary endpoint of the trial), while group 1 showed no benefits (Box).

How can these findings help us design and implement an effective health care home model for Australia?

First, the DCP highlighted that modifying current funding mechanisms is important if we are to create a health care system more suited to the needs of people with chronic and complex conditions. Better information systems and quality improvement processes alone were not sufficient to improve health outcomes in the trial. However, combining these changes with a new funding model that made it easier for providers to coordinate a patient’s care and that rewarded quality care made a significant difference. Although designing and implementing changes to funding systems is never easy (the status quo will always have a strong pull), this finding demonstrates that such changes can have a considerable impact on health outcomes for people with chronic diseases.

Second, the results from the DCP showed the challenge of implementing e-health tools and better information systems without sufficient focus on support to encourage their adoption. One of the most surprising findings from the DCP was that group 1 did not show any improvement in health outcomes. A closer look at the data suggests that this may, in part, reflect this group’s limited use of cdmNet — an online service that allows clinicians to access a shared electronic health record, automatically send referrals, generate pre-populated electronic care plans and display aggregated information about the health of their enrolled patients. In group 2, GPs used cdmNet twice as often, practice nurses used it three times as often, and allied health providers used it six times as often as their counterparts in group 1. Care facilitators in group 2 also relied heavily on cdmNet to prioritise tasks and identify the problems they could help with. Both intervention groups received the same training and technical support, but it is likely that cdmNet was used more in group 2 because the tool automated payments to practices and allied health providers (which made it much easier for them to get paid) and care facilitators reinforced its use in practices. As these results suggest, it is not sufficient to simply give people new health tools. Instead, these tools must be incorporated into the day-to-day model of care and people must be provided with compelling reasons for using them to have a meaningful impact on care delivery and health outcomes.

Last, the data gathered during the DCP highlight the importance of coordination between primary and secondary care. In the year before the trial, hospital costs accounted for almost half of total health care expenditure in the enrolled population.8 These costs were unevenly distributed, with 5% of participants accounting for about 50% of hospital costs, and 20% of participants accounting for over 80% of hospital costs. Despite this, people who were hospitalised more frequently did not receive a significantly greater allocation of chronic disease management and allied health funding than people in better health. In future programs, improved information sharing between primary and secondary care may help identify those most at risk of repeated hospitalisations and allow better targeting of resources to keep people well and reduce avoidable hospitalisations.

Shifting our health system towards a health care home model is a challenging task, and it is unlikely that initial attempts will be perfect. For this reason, it is important that implementation is accompanied by thorough and ongoing evaluations of the impact of this model on health outcomes, patient experience and value for money. The resulting data can then be used to inform refinements where necessary. In the longer term, the findings can be used to answer broader questions about the health care home model, such as: which people benefit most from the program? what is the clinician experience and how is clinical practice impacted? what is the ideal mix of fee-for-service, population-based funding and payment for outcomes? how do providers manage switching between the health care home model for some people and normal fee-for-service visits for others? and is the health care home model reducing hospital costs in the long term?

The government has indicated that a review of the health care home model will be considered in 2018 to determine whether it will be implemented in other parts of the country.15 Establishing the evaluation framework from the outset will strengthen the implementation and the value of the results, paving the way towards better-coordinated and more appropriate care for those with the greatest health needs.

Box –
Diabetes Care Project interventions and results8

Group

Interventions

Results


Group 1

cdmNet: an online care planning and shared health record tool for clinicians and patients.Regular reporting to practices on their clinical performance compared with peers.

No change in HbA1c level (the primary endpoint).

Group 2

cdmNet: an online care planning and shared health record tool for clinicians and patients.Regular reporting to practices on their clinical performance compared with peers.Flexible payments of $130–$350 to practices, and $140–$666 for allied health care per year (which replaced funding for GP management plans and team care arrangements).Incentive payments of up to $150 per patient per year tied to quality of care, improvements in HbA1c and patient experience.Funding for a salaried care facilitator, shared between several practices.

Improvement in HbA1c level of 0.2 percentage points across the whole population (the primary endpoint).Larger improvements for people with starting HbA1c above target range (eg, 0.6 percentage point improvement for people with HbA1c above 9%).Statistically significant improvements in blood pressure, blood lipids, waist circumference, depression, diabetes-related stress, care plan take-up, completion of recommended annual cycles of care and allied health visits.


Sarcopenia: a potential cause and consequence of type 2 diabetes in Australia’s ageing population?

Obesity epidemics have developed concurrently with population ageing worldwide. More than 40% of adults who were aged 25–29 years in 2000 will be obese by the time they reach the age of 60–64 years.1 The increasing prevalence of type 2 diabetes has mirrored obesity epidemics. There are about one million people living with type 2 diabetes in Australia, and more than 90% of these individuals are aged 40 years or older.2 Worldwide, the highest age-specific prevalence of any diabetes (19%) is observed in those aged 60–79 years, and this age group will also have the greatest proportional increase in patients with any diabetes by 2035.3

A characteristic of ageing that has been under-investigated as a potential contributor to the risk of type 2 diabetes, and functional deficits common to this condition, is sarcopenia. We performed a non-systematic search of the MEDLINE and Embase databases using search terms including (but not limited to) “sarcopenia”, “muscle mass”, “physical performance”, “diabetes” and “insulin resistance”, with additional review of our personal reference libraries, to identify recent scientific literature investigating the effects of sarcopenia on the risk of type 2 diabetes, the progression of sarcopenia in older adults with existing type 2 diabetes, and potential therapies beneficial for both conditions.

Defining and diagnosing sarcopenia

The term sarcopenia, from the Greek for “poverty of flesh”, was first proposed in 1989 as a descriptor for age-related muscle wasting by Irwin Rosenberg, who commented that “no decline with age is more dramatic or potentially more functionally significant than the decline in lean body mass”.4 Although this decline in muscle mass with age has consequences for health, subsequent research has found that loss of muscle strength during ageing outpaces loss of muscle mass by up to five times,5 and that low muscle strength is more consistently associated with functional decline than low muscle mass.6 Accordingly, experts now describe sarcopenia as a multidimensional condition requiring assessment of muscle mass, muscle strength and physical performance.

The development of clinically relevant operational definitions for sarcopenia and the recent establishment of an International Classification of Diseases, 10th revision, clinical modification (ICD-10-CM) code for the condition7 have provided the first real impetus for clinicians to diagnose sarcopenia in a systematic fashion.8 Box 1 summarises three current operational definitions and their appropriate measurement techniques and thresholds. Although the lack of consensus on a single operational definition of sarcopenia is a barrier to its clinical assessment, the condition can be diagnosed using relatively inexpensive equipment requiring minimal time and expertise. For example, the European Working Group on Sarcopenia in Older People (EWGSOP) defines sarcopenia as the presence of low appendicular lean mass (generally assessed by dual-energy x-ray absorptiometry, but can also be assessed by portable bioelectrical impedance analysis equipment) in addition to low hand grip strength (measured by hydraulic hand grip dynamometer) or gait speed9 over a short (4 m) walkway. The International Working Group on Sarcopenia10 and the Foundation for the National Institutes of Health (FNIH) Biomarkers Consortium Sarcopenia Project11 state that sarcopenia can be assessed using the same equipment, but with different thresholds.

There is justification for sarcopenia case finding in health care. Although sarcopenia prevalence estimates are influenced by the operational definition applied, as many as 30% of community-dwelling older adults may have the condition, depending on demographic characteristics including age and ethnicity.12 Sarcopenia is consistently a predictor of poor quality of life, difficulties with activities of daily living, mobility disability, falls, fractures, institutionalisation and mortality, independent of other comorbidities.8,9 The costs of sarcopenia to health services in Australia are likely to be substantial, given that annual health-related costs for older Dutch adults were about three times higher for individuals with sarcopenia than for those without the condition.13

Sarcopenia in the pathogenesis of type 2 diabetes

The metabolic outcomes of sarcopenia have received less attention than the functional consequences in the research literature, but they are no less relevant clinically. There are several pathways by which age-related changes in skeletal muscle may contribute to insulin resistance (Box 2). Skeletal muscle is the largest insulin-sensitive tissue in the body and accounts for 80% of glucose uptake under euglycaemic hyperinsulinaemic conditions. Skeletal muscle insulin resistance is a key process in the development of type 2 diabetes, which may be observed decades before β-cell failure and hyperglycaemia develop.14 It is likely that significantly lower skeletal muscle mass results in reduced capacity for glucose disposal in older adults with sarcopenia.

In addition to a loss of mass during ageing, muscle undergoes numerous composition changes that are often described as declines in muscle quality. These declines in quality partly explain the faster rate of loss of muscle strength compared with loss of mass, and may also increase the risk of insulin resistance. Ageing skeletal muscle has reduced oxidative capacity, resulting in increased production of reactive oxygen species, which contributes to oxidative mitochondrial DNA mutagenesis and pro-inflammatory processes.15 Both mitochondrial dysfunction and chronic low-grade inflammation are associated with insulin resistance.15 Also, during ageing, there is an increase in infiltration of skeletal muscle by ectopic fat, including intramyocellular lipids (IMCL) and adipocytes located between muscle groups (intermuscular) and between muscle fascicles (intramuscular). Both IMCL and intramuscular and intermuscular adipose tissue (IMAT) have been implicated in insulin resistance.16 Paradoxically, high levels of IMCL are reported in endurance athletes, suggesting that high levels are beneficial for some individuals. IMAT-derived adipocytes may deleteriously affect muscle metabolism and insulin sensitivity through increased local secretion of pro-inflammatory adipokines, and intermuscular fat may also impair insulin action through reducing blood flow to muscle.16

Using peripheral quantitative computed tomography imaging of calf muscles, we have observed that overweight and obese women aged 50–89 years with type 2 diabetes have a 70% larger IMAT cross-sectional area and 4% lower muscle density (indicating higher levels of intramuscular adipose tissue) than women without type 2 diabetes matched by age and body mass index (both P ≤ 0.05, our unpublished data) (Box 3). In the Look AHEAD trial of middle-aged to older adults in the United States, participants with type 2 diabetes had 0.5 kg more IMAT than did controls without diabetes.17 IMAT, but not subcutaneous adipose tissue, is positively correlated with insulin resistance in type 2 diabetes, despite constituting a much smaller proportion of total body fat.18

Leg muscle mass, strength and functional performance are significantly lower in older patients with type 2 diabetes compared with healthy controls,19 but few prospective studies have investigated the risk of incident type 2 diabetes in older adults with sarcopenia. Among obese participants in the English Longitudinal Study of Ageing, there was a more than threefold increased risk of self-reported incident type 2 diabetes over 6 years for those whose baseline hand grip strength was in the sarcopenic range according to the FNIH definition.20 In the Osteoporotic Fractures in Men study, older men in the highest quartile for insulin resistance (among those without type 2 diabetes), defined by the homoeostasis model assessment of insulin resistance, had a twofold increased likelihood of a 5% decline in total lean body mass over almost 5 years.21 An 11-year follow-up of the Health, Aging and Body Composition (Health ABC) Study found a 40–60% decrease in the risk of incident type 2 diabetes among normal-weight women with greater abdominal and thigh muscle area; but greater muscle mass predicted an increased risk in overweight and obese women.22 It is possible that larger IMAT depots in the muscles of obese women explain this controversial finding.

Factors including inflammation, comorbidities and low levels of physical activity also predispose patients with type 2 diabetes to an increased risk of sarcopenia. In the Health ABC Study, thigh muscle size declined twice as fast over 6 years in older women with type 2 diabetes compared with women without diabetes,23 and strength declined by one-third more over 3 years in older patients with type 2 diabetes compared with those without diabetes.24 Patients in the US over the age of 60 years with type 2 diabetes were found to have poorer balance and increased likelihood of falls in the previous 12 months compared with patients without diabetes.25 In a prospective analysis of the Study of Osteoporotic Fractures, older women with insulin-treated type 2 diabetes at baseline had an almost threefold increased risk of falling more than once a year over an average of 7 years, compared with patients without diabetes.26 Conditions common to type 2 diabetes, such as hypoglycaemia, poor vision and peripheral neuropathy, undoubtedly contribute to the increased falls risk in older adults with diabetes, but poor physical function is also clearly important. In a secondary analysis of the North Carolina Established Populations for Epidemiologic Studies of the Elderly and Women’s Health Initiative trials, a one-third higher risk of incident fracture was observed for older women with type 2 diabetes, but this association was mediated by poor physical function.27 Thus, poor muscle function may partly explain why older patients with type 2 diabetes have more fractures than those without diabetes, despite generally having higher bone mineral density.28 Furthermore, the increased mortality risk for normal-weight compared with overweight patients with type 2 diabetes appears to be mediated by their smaller relative muscle size.29

Concurrent therapies for type 2 diabetes and sarcopenia

There is little evidence that common pharmacological therapies for type 2 diabetes are beneficial in preventing or reversing sarcopenia in older adults. On the contrary, metformin, the first-line pharmacological therapy for diabetes, is an AMP-activated protein kinase agonist and may cause autophagic muscle cell death, while insulin stimulates muscle protein synthesis in young but not older adults, suggesting it provides no protection from age-related muscle wasting.30

Lifestyle modification, particularly weight loss, is a key therapeutic component for type 2 diabetes, with modest weight loss (5–10% of bodyweight) contributing to improved glucose control.31 However, weight loss can include declines in muscle mass and may result in undesirable metabolic and functional consequences, particularly in patients with type 2 diabetes and sarcopenia. For this reason, exercise that promotes gains in muscle mass and function should be a component of lifestyle modification for older adults with type 2 diabetes. A 6-month randomised controlled trial of high-intensity progressive resistance training plus moderate weight loss versus moderate weight loss alone in 36 overweight older adults showed threefold greater decreases in glycated haemoglobin levels in the resistance training group.32 Furthermore, this group had significantly higher lean body mass and muscle strength at follow-up compared with the weight loss-alone group, despite similar reductions in fat mass. Similarly, in postmenopausal women with obesity, glucose infusion rates increased significantly after 16 weeks of aerobic plus resistance (involving weight machines) exercise, but not aerobic exercise alone.33

Clearly, resistance training requiring access to large equipment such as weight machines is not feasible in most clinical settings. Nevertheless, exercise programs requiring minimal equipment may improve physical performance in older adults with type 2 diabetes. In the US Lifestyle Interventions and Independence for Elders (LIFE) study, more than 1600 participants aged 70–89 years with poor physical performance were randomly assigned to a structured physical activity or a health education intervention. The exercise group, who completed moderate walking, ankle weights, balance and flexibility exercises, had about 30% reduced risk for 2.5-year mobility disability compared with those receiving health education, and similar benefits were reported for those with and without type 2 diabetes.34 A meta-analysis of resistance band training, which uses inexpensive elastic bands to progressively increase resistance, suggests that this type of training may result in significant improvements in leg strength but not in glycated haemoglobin levels.35 Thus, lower-intensity resistance training programs are likely to be effective in preventing functional decline in older patients with type 2 diabetes, but further research is required to determine whether they can also provide improvements in metabolic health.

An area of recent research focus that is important to the prescription of lifestyle modification programs for older patients with type 2 diabetes is resistance to the beneficial effects of exercise. As many as 15–20% of individuals with type 2 diabetes obtain no improvements in glucose homoeostasis, insulin sensitivity or muscle mitochondrial density after supervised exercise interventions, despite adequate adherence.36 Furthermore, in a study investigating the effects of 5 months of aerobic or resistance training on physical function in overweight and obese women aged 65–79 years, 13%, 30% and 30% showed no improvement in aerobic capacity, knee extension strength and physical performance, respectively.37 It has been hypothesised that poor exercise responsiveness within skeletal muscle occurs as a result of attenuated expression of key fuel metabolism genes, including peroxisome proliferator-activated receptor γ coactivator-1α, peroxisome proliferator-activated receptor β/δ and pyruvate dehydrogenase kinase. Studies investigating regulators of the transcription of these genes may therefore have success in enhancing adaptations to exercise.36

Inflammation, low 25-hydroxyvitamin D (25(OH)D) status and poor muscle quality are all common in people with type 2 diabetes and may contribute to poor exercise responsiveness. Almost 20% of sedentary adults with elevated plasma C-reactive protein (CRP) concentrations have no improvement in fasting insulin levels after an endurance training program.38 We have found that older adults with high baseline levels of both 25(OH)D (≥ 50 nmol/L) and physical activity (≥ 10 000 steps/day) gained 2 kg less body fat over 5 years compared with those who had low 25(OH)D levels but high levels of physical activity, suggesting that adequate 25(OH)D levels enhance the benefits of physical activity for body composition in older adults.39 In support of this, the greatest improvements in physical performance in frail Japanese older adults after 3 months of exercise were observed in those with higher baseline 25(OH)D levels (> 67.5 nmol/L).40 Older women with adequate vitamin D status also demonstrated greater fat oxidation during exercise.41

We have previously proposed that low vitamin D status promotes adipogenesis, leading to increased IMAT deposition.42 Given older adults with high baseline IMAT levels have blunted improvements in muscle function after exercise,43 it is possible that increased IMAT and associated skeletal muscle inflammation is a mechanism through which low vitamin D status contributes to poor exercise responsiveness. Vitamin D supplementation has, to date, shown few benefits for metabolic health and physical function, although studies have been limited by inadequate sample sizes, doses and durations, and by inclusion of vitamin D-replete participants.44 This therapy is only likely to be effective in those who achieve replete 25(OH)D levels from initial low levels. A 12-month weight loss intervention combined with 2000 IU/day of vitamin D showed no effect on body composition compared with placebo.45 However, participants whose 25(OH)D levels reached ≥ 75 nmol/L lost 3 kg more bodyweight and 2% more body fat than did those whose 25(OH)D levels were < 75 nmol/L.

Although Australian guidelines currently recommend dietary protein intakes of 1 g/kg/day for adults aged over 70 years, intakes of 1.2 to 1.6 g/kg/day may be most effective for enhancing exercise-induced muscle gains, and there is no evidence of renal disorders with these intakes.46 Managing weight loss in older patients with type 2 diabetes while increasing the proportion of energy from protein may be best accomplished by reducing carbohydrate intake.47 High protein intakes may also support weight loss by increasing satiety. A 4-month cluster randomised controlled trial of 100 female nursing home residents found that progressive resistance training combined with 1.3 g/kg/day of red meat resulted in greater gains in muscle mass and strength and decreases in fat mass, relative to resistance training alone.48 Muscle protein synthesis in response to protein supplementation in older adults may also be enhanced by adequate vitamin D status. Daily supplementation of 2 g β-hydroxy β-methylbutyrate (a metabolite of leucine), 5 g arginine and 1.5 g lysine for 12 months in older adults resulted in significant improvement in knee extension strength only for those whose baseline 25(OH)D levels were ≥ 75 nmol/L.49 Similarly, in older adults with sarcopenia, exercise plus daily whey protein (22 g), essential amino acids (11 g, including 4 g leucine) and vitamin D (100 IU) resulted in almost 2 kg greater gain in lean mass compared with exercise alone, as well as significant gains in hand grip strength and declines in CRP levels.50 Nevertheless, further research is required to confirm the effects of dietary supplementation in patients with type 2 diabetes and sarcopenia.

Conclusions

The prevalence and socio-economic burden of sarcopenia will increase in Australia in coming years, but sarcopenia presently receives little attention in clinical settings, likely due in large part to a lack of clarity about its definition and assessment. Expert groups have attempted to reduce this confusion by providing clinical guidelines and, while further work is required to achieve a consensus operational definition of sarcopenia, diagnosis can now be easily integrated into clinical practice. The establishment of the ICD-10-CM code will enable improved reporting of the condition.

Through integrating sarcopenia case finding into clinical practice, this previously under-appreciated risk factor for type 2 diabetes in older adults can be systematically monitored, and lifestyle modification for primary and secondary prevention much better targeted. The evidence presented here shows that older adults with sarcopenia are at risk of developing type 2 diabetes, and those with prevalent type 2 diabetes show an accelerated loss of muscle mass and function that may increase the risk of further metabolic and functional declines. Interventions that reverse or halt progression of sarcopenia in patients with type 2 diabetes are likely to have important health benefits, given that the evidence suggests poor muscle mass and function substantially mediate associations of type 2 diabetes with incident fractures and mortality.

Including progressive resistance training in lifestyle modification programs should be considered for older patients with sarcopenia, type 2 diabetes or both. Clinicians need to be cognisant that individual responses to exercise vary considerably in patients with type 2 diabetes, and beneficial metabolic and functional outcomes are more likely to be obtained when adherence and responsiveness to the therapy are closely monitored, as with pharmacotherapy. Exercise programs should also be regularly adapted to support ongoing improvements in muscle mass and function. Ensuring adequate vitamin D status and maintenance of dietary protein intakes during energy restriction may optimise the effects of exercise interventions targeting type 2 diabetes and sarcopenia in older adults, thereby delaying onset of morbidity and loss of independence related to both conditions.

Box 1 –
Suggested measurement techniques and thresholds for components of sarcopenia according to current consensus definitions

Component

Thresholds

Method and equipment


European Working Group on Sarcopenia in Older People9

Low muscle mass

Appendicular lean mass adjusted for height (m2):Men: < 7.26 kg/m2Women: < 5.50 kg/m2

Whole-body DXA and stadiometer

Skeletal muscle mass adjusted for height (m2):Men: < 8.87 kg/m2Women: < 6.42 kg/m2

BIA and stadiometer

Low muscle strength

Hand grip strength:Men: < 30 kgWomen: < 20 kg

Hydraulic hand grip dynamometer

Poor physical performance

Gait speed: ≤ 0.8 m/s

4 m walkway and stop watch

International Working Group on Sarcopenia10

Low muscle mass

Appendicular lean mass adjusted for height (m2):Men: ≤ 7.23 kg/m2Women: ≤ 5.67 kg/m2

Whole-body DXA and stadiometer

Poor physical performance

Gait speed: < 1.00 m/s

4 m walkway and stop watch

Foundation for the National Institutes of Health Biomarkers Consortium Sarcopenia Project11

Low muscle mass

Appendicular lean mass adjusted for BMI (kg/m2):Men: < 0.789Women: < 0.512

Whole-body DXA, stadiometer and weight scales

Low muscle strength

Hand grip strength:Men: < 26 kgWomen: < 16 kg

Hydraulic hand grip dynamometer


BIA = bioelectrical impedance analysis. BMI = body mass index. DXA = dual-energy x-ray absorptiometry.

Box 2 –
Potential pathways by which sarcopenia contributes to insulin resistance in ageing*


* Components of sarcopenia are shown in the blue boxes. Green arrows indicate possible bidirectional relationships, illustrating mechanisms by which sarcopenia may be accelerated in people with type 2 diabetes.

Box 3 –
Transverse peripheral quantitative computed tomography images of the mid-calf highlighting IMAT in age- and BMI-matched obese older women (A) without and (B) with type 2 diabetes*


BMI = body mass index. IMAT = intramuscular and intermuscular adipose tissue. * IMAT is indicated by the green pixels located in the black muscle compartment. Both women had a BMI of 35 kg/m2 and were aged 75 years, but the woman with type 2 diabetes (B) had greater subcutaneous fat, a smaller muscle cross-sectional area (649 v 752 cm) and twice as much IMAT (28.5 v 14 cm) as the woman without type 2 diabetes (A). The woman with type 2 diabetes also had poor muscle function, meeting the European Working Group on Sarcopenia in Older People definition of sarcopenia (gait speed ≤ 0.8 m/s and hand grip strength < 20 kg).

Diabetes management — keeping up to date

The management of type 2 diabetes (T2D) is rapidly evolving with the introduction of an increasing number of new medicines, updating of guidelines and emerging clinical outcome data. Medicine selection for treatment of T2D has become increasingly complex — especially when considering the Pharmaceutical Benefits Scheme subsidy of certain medicine combinations. On the other hand, some things have not changed; optimising glycaemic control, managing risk of complications and promoting a healthy lifestyle are still the cornerstones of diabetes care. Despite the new medicines available for the treatment of T2D, prescribers should continue to individualise their choice of therapy at each point of escalation based on patient and medicine factors.

Beyond selecting the most appropriate therapy lies the challenge of improving adherence to diabetes medicines. Better adherence to medicines ensures that patients achieve their glycaemic targets and reduce the risk of short and long term diabetes complications. It is important to assess adherence before intensifying diabetes therapy, which may help identify adverse events.

An emerging change, opportunity and challenge for prescribers will be the use of biosimilars in diabetes management, beginning with insulin analogues. Biological agents come with their own set of efficacy and safety considerations, which may influence prescribing in primary care settings. The diabetes environment is soon to be affected by these considerations by way of the new insulin glargine biosimilar.

By being better informed about medicine choices, health professionals can help people with T2D to achieve improved glycaemic control, reduce associated long term complications and minimise medicine-related adverse effects. The new educational program from NPS MedicineWise — “Type 2 diabetes: what’s next after metformin?” — provides general practitioners, pharmacists, practice nurses and diabetes educators with the latest evidence on second and third line medicines for lowering blood glucose levels and with strategies for improving adherence to metformin therapy. To access the educational program, visit www.nps.org.au/diabetes.

Endocrine Society of Australia position statement on male hypogonadism (part 2): treatment and therapeutic considerations

The Endocrine Society of Australia commissioned this position statement to update its 2000 guidelines for testosterone prescribing1 and to inform the recommended management of men with androgen deficiency in light of recent regulatory changes to the Pharmaceutical Benefits Scheme.2 Part 1 of this position statement dealt with the assessment of male hypogonadism, including the indications for testosterone therapy.3 This article, Part 2, focuses on treatment and therapeutic considerations for male hypogonadism, particularly considering the ongoing debate about the risk of cardiovascular events related to testosterone treatment.4 The methods used to develop the position statement are detailed in Part 1.3

Recommendations

Cardiovascular events

The current evidence regarding testosterone treatment and cardiovascular outcomes is contradictory and inconclusive.4 There have been no adequately powered randomised controlled trials (RCTs) of testosterone treatment with cardiovascular events as a pre-specified outcome. One RCT has shown an increase in cardiovascular events with testosterone treatment in older men with mobility limitations, many of whom had diabetes or pre-existing cardiovascular disease.5 However, event numbers were small and may have been due to chance. Another RCT in a similar population of frail or intermediate-frail older men has not confirmed this finding.6 In the United States, the Testosterone Trials reported no difference in cardiovascular events between treatment and placebo arms of the study over 1 year.7 A recently published RCT showed no effect of testosterone treatment over 3 years on two measures of pre-clinical atherosclerosis (carotid intima media thickness and coronary calcification).8 One meta-analysis showed an increased risk of broadly defined vascular-related events with testosterone therapy but, due to methodological limitations, these data are not definitive.9 Another meta-analysis showed no evidence of any increase in major cardiovascular events relating to testosterone therapy.10 A recent meta-analysis showed no significant increase in cardiovascular events related to testosterone treatment when all administration routes were grouped.11

Some observational studies in older men have shown increased risk, and some decreased risk, of cardiovascular events, or improved survival with testosterone treatment.4 A recent retrospective observational study of US veterans (whose indications for testosterone treatment were not made clear) suggested that men with low baseline testosterone levels who achieved normalisation of circulating testosterone levels after treatment had better outcomes compared with men who did not normalise testosterone levels or did not receive treatment.12 Comparable Australian studies are lacking. However, no firm conclusion can be drawn from these non-randomised retrospective studies — which did not account for the reasons some men were treated and others not, and often used prescription or insurance databases with limited population coverage and clinical information — due to the potential for multiple sources of bias and confounding. A review of the existing data commissioned by the US Food and Drug Administration (FDA) found no convincing increase of major adverse cardiac events in men treated with testosterone and highlighted the deficiencies of available retrospective studies.13 Nevertheless, the FDA mandated labelling of US testosterone products to warn about a possible increased risk of venous thromboembolism, heart attack and stroke, and recommended a new prospective study of sufficient power to evaluate safety.14 Overall, until better evidence is available, it seems prudent to use testosterone treatment with a degree of caution in older men with known cardiovascular disease, especially in men without pathological hypogonadism.

Testosterone formulations and side effects

The effects of testosterone in different tissues vary as a result of the metabolism of testosterone into its active metabolites by the enzymes 5α-reductase (an amplification pathway that converts testosterone to 5α-dihydrotestosterone [DHT], an androgen with enhanced potency acting on the androgen receptor) and aromatase (a diversification pathway that converts testosterone to oestradiol, which acts on the oestrogen receptor).15 Each of these hormones is increasingly recognised as being critical for male health. DHT drives genital differentiation in the male fetus (acting on the urogenital sinus derivatives that form the prostate and external genitalia), while oestradiol is a major determinant of male bone density and has additional roles in the brain, metabolism and possibly sexual function.16,17 In many ways, testosterone is “three hormones in one” — an important physiological consideration when using testosterone rather than other androgens for replacement therapy regimens.

Testosterone preparations available in Australia, with their route of administration, dosing and side effects, are shown in Box 1. The more common adverse effects include polycythaemia, elevation of prostate-specific antigen (PSA) levels (which includes an expected effect of testosterone replacement at the start of treatment, but may also detect subclinical or latent prostate cancer), acne and oily skin, reduced sperm production and impaired fertility. Less common adverse effects include gynaecomastia, male pattern balding (which can be familial) and weight gain, as well as fluctuations in mood, libido or hot flushes, which reflect stop–start treatment or excessive fluctuations in serum testosterone levels. Other reported side effects include difficulty passing urine, muscle pain, priapism and increased blood pressure. Refer to prescribing information for further details of formulation-specific side effects.

Monitoring of testosterone therapy

Efficacy

The best clinical measure of adequate restoration of androgen status is identification and monitoring of the man’s leading symptom. These clinical features are highly variable between men but highly reproducible within any man and distinctive to that individual.18 Timing of hormone sampling relative to the most recent dose is important in monitoring the adequacy of testosterone replacement therapy, with the goal being to evaluate steady-state blood levels. This is feasible with injectable and transdermal products, using the trough (ie, pre-next dose sampling), but not with oral testosterone, due to its capricious pharmacokinetics. Random blood sampling without regard to the timing of the most recent dose is uninformative and not recommended. In patients using injectable or transdermal testosterone products, trough testosterone levels should be within the lower part of the reference interval for eugonadal men. In patients with testicular failure (primary or hypergonadotropic hypogonadism), persistent elevation of serum luteinising hormone levels during treatment may indicate inadequate testosterone dosage, frequency or compliance. Periodic monitoring of bone density (at intervals of 1–2 years) may assist in evaluating extent and chronicity of pre-treatment androgen deficiency, as well as adequacy of replacement therapy.19

Safety

There is no convincing evidence that men with pathological hypogonadism treated with testosterone have any increased risk of benign or malignant prostate disease, although men with lifelong androgen deficiency due to Klinefelter syndrome are relatively protected against prostate cancer.20 A recent meta-analysis of 22 RCTs involving 2351 participants treated for up to 36 months found no association of testosterone treatment with prostate cancer.21 Similarly, an analysis from a population-based linked cancer registry did not find any association of testosterone therapy with high-grade prostate cancer.22 Given that population screening for prostate cancer by measuring serum PSA levels is not recommended, as it is not sufficiently safe and cost-effective,23 monitoring for prostate disease during testosterone treatment should be undertaken as appropriate for eugonadal men of similar age (ie, based on individualised clinical assessment and judgement). However, when there is a reasonable possibility of substantive pre-existing prostate disease, digital rectal examination and PSA testing are required before testosterone treatment is commenced, so that pre-existing prostate cancer is not missed. Although PSA monitoring during testosterone therapy has become widely used,24 it is possible that routine PSA testing could essentially constitute PSA screening for prostate cancer and may lead to overdiagnosis and harm from interventions for clinically insignificant organ-confined prostate cancers.

Elevation of haemoglobin (or haematocrit [packed cell volume]) levels above the normal reference interval may occur with testosterone treatment, particularly in smokers. Haematology profile should be assessed 3 months after initiation of testosterone treatment and then monitored on an annual basis. Secondary polycythaemia induced by testosterone treatment should prompt evaluation of other aggravating hypoxic conditions, such as smoking, sleep apnoea and respiratory failure. It can usually be managed by reduction of the testosterone dose (and/or frequency), but may rarely require venesection. In men with obstructive sleep apnoea, low testosterone levels are related primarily to obesity and will improve with weight loss. Treatment with continuous positive airway pressure improved testosterone levels in one study, but not in another study or a meta-analysis.2527 Testosterone treatment only transiently worsens the severity of obstructive sleep apnoea,28 which, unless severe and untreated, need not be considered an absolute contraindication to its use (see Part 1, Box 4).3

Product-specific safety issues (Box 1)

Injectable testosterone preparations are relatively contraindicated in patients who have bleeding disorders or who are taking anticoagulants, where deep intramuscular injection carries a risk (although low) of haematoma formation.29 Transdermal preparations are preferable in this setting. In all patients, injectable preparations carry a risk of pain, bruising and pulmonary oil microembolism, which results in cough at the time of injection.29,30

All transdermal preparations remain on the skin for some hours after application. These should be applied after morning showering, then covered with clothing to avoid direct skin transfer and risk of virilisation among children or women in intimate contact with the patient.

Conclusions

Different formulations of testosterone are available for replacement therapy to relieve symptoms and signs of androgen deficiency in men with pathological hypogonadism, and can be personalised to individual men. There is no evidence that appropriate use of testosterone therapy increases the risk of prostate cancer. Testosterone replacement may be safely used among men with pathological hypogonadism at any age. A cautious approach to testosterone replacement is warranted in older, frail men, particularly in those with a history of cardiovascular disease. In complex cases, evaluation by an endocrinologist is recommended.

The recommendations given in this position statement are based on data from a limited number of RCTs, as well as non-randomised clinical studies and observational studies. As such, further research is warranted, which may have an impact on the recommendations. Key research questions for future well controlled clinical trials are presented in Box 2.

Box 1 –
Testosterone formulations currently available in Australia

Preparation

Advantages

Disadvantages and adverse effects

Testosterone level monitoring


Testosterone gel 1% (Testogel, Besins Healthcare)

  • 50 mg sachets (or pump pack)
  • Daily

  • Can be self-administered
  • Pump applicator option available

  • Chance for inadvertent transfer to close contacts (spouse, children, nurses)
  • Must cover application site
  • Variation in blood testosterone levels

  • Morning, before application, after use for 7 days

Testosterone undecanoate (Reandron 1000, Bayer)

  • 1 g intramuscular injection
  • 3-monthly

  • Convenience
  • Compliance

  • Slow to reach steady-state blood testosterone levels
  • Cannot be self-administered
  • Injection site pain
  • Post-injection cough due to pulmonary oil microembolism
  • Deep intramuscular injection unsuitable for men with coagulopathies or thrombocytopenia

  • Morning, before fourth injection; aim for trough level of 10–15 nmol/L
  • Allow a further 2–3 injections after dose adjustment before rechecking

Testosterone transdermal solution (Axiron, Eli Lilly)

  • 60 mg (2 × 30 mg applications)
  • Daily

  • Can be self-administered

  • Chance for inadvertent transfer to close contacts (spouse, children, nurses)
  • Pump applicator required
  • Must be administered in the axilla and cover application site
  • May not wash, shower or swim within 2 hours of application

  • After 2 weeks, trough level taken 2–8 hours after application

Testosterone cream 5% (Androforte, Lawley)

  • 2 mL
  • Daily

  • Can be self-administered

  • Chance for inadvertent transfer to close contacts (spouse, children, nurses)
  • Must cover application site
  • Variation in blood testosterone levels

  • Morning, before application, on the 15th day after starting treatment

Testosterone esters (Sustanon, Aspen; or Primoteston, Bayer)

  • 250 mg intramuscular injection
  • Fortnightly

  • Fewer treatment episodes may improve compliance

  • Frequency of injections
  • Fluctuation in blood testosterone levels
  • Injection site pain
  • Fluctuation in mood or libido
  • Excessive erythrocytosis

  • Baseline and at intervals during treatment

Testosterone patch (Androderm, Allergan)

  • 2.5 mg or 5.0 mg
  • Daily

  • Can be self-administered

  • Skin irritation
  • Limited scope for dose variation

  • Morning, after evening application

Testosterone undecanoate oral (Andriol, Merck Sharp & Dohme)

  • 40 mg capsule
  • 2–3 times per day

  • Can be self-administered

  • Frequent dosing required (2–3/day)
  • Marked variation in blood testosterone levels
  • Gastrointestinal intolerance

  • After 2 weeks

Box 2 –
Key research questions for well controlled clinical trials

  • Does testosterone therapy provide meaningful health benefits in older men without pathological hypogonadism?
  • Does testosterone treatment improve weight loss, in addition to lifestyle measures?
  • Is testosterone an effective and safe treatment for preventing progression of pre-diabetes to type 2 diabetes in men?
  • Does testosterone therapy among men without pathological hypogonadism influence the risk of heart attacks or strokes?
  • What is the role of testosterone therapy in men with suppression of the hypothalamic–pituitary–testicular (HPT) axis from opioids?
  • What is the optimal management of men with prolonged suppression of the HPT axis as a result of recreational misuse of androgens?
  • What is the effect of depression and treatment of depression on function of the HPT axis?
  • Is there a therapeutic role for partial oestrogen blockade (eg, using clomiphene) and aromatase inhibition (eg, using anastrozole, letrozole) to improve suppressed HPT axis function in men?
  • Is there a role for pharmacological androgen therapy with 5α-dihydrotestosterone in men with specific diseases, to increase muscle or bone mass, aid wound healing or treat other systemic illness?

Evaluation of the performance and outcomes for the first year of a diabetes rapid access clinic

Diabetes rapid access clinics (DRACs) have been identified by the New South Wales Agency for Clinical Innovation as a key component of an integrated diabetes model of care.1 This cost-effective model provides fast and comprehensive outpatient review and has been shown to circumvent hospital admission, decrease hospital length of stay and improve patient outcomes.25 Based on this approach, a nurse practitioner-led DRAC was established in February 2015 at Royal North Shore Hospital (RNSH) in Sydney as a pilot program to assess the suitability of the DRAC for scalability across the Northern Sydney Local Health District (NSLHD).

The DRAC is an outpatient clinic, operating on weekdays, which adopts the principle that high-risk patients who present to the emergency department (ED) could be diverted from hospitalisation if they were well enough for outpatient management of their condition (Appendix). Patients are referred from general practice, the ED or the endocrinologist on call and require rapid review (within 72 hours) of complex diabetes problems, such as an episode (or episodes) of severe hypoglycaemia, recurring mild hypoglycaemia or hyperglycaemia not needing hospitalisation.

We prospectively collected data during the first year since inception of the DRAC, with a particular focus on reasons for referral and cost evaluation. The study was approved by the NSLHD Human Research Ethics Committee (RESP/16/62).

Within the first year of the DRAC pilot program at RNSH, 61 patients attended the clinic. About a quarter of these patients (n = 15) would have been hospitalised had they not been reviewed at the DRAC and they were successfully managed as outpatients. Although these patients met the criteria for admission, they were deemed appropriate for the DRAC by the endocrinologist on call. In addition, 26% of the patients were referred back to general practice, while the remainder required ongoing endocrinologist review. Most patients presented with hyperglycaemia-related problems (n = 40; 66%; Box), including 15 patients with newly diagnosed diabetes. A further 11 patients presented with severe hypoglycaemia. Within 30 days of review at the DRAC, one patient presented to the ED and required hospitalisation.

Using a conservative costing approach, whereby patients were assumed to be uncomplicated with an average length of stay of 2.5 days (based on data from the NSLHD Performance Unit), the cost analysis demonstrated that for 15 patients for whom hospitalisation was avoided, about $46 700 would have been incurred in their inpatient stay. The DRAC was established through a restructure of existing services; however, if nursing costs associated with running the DRAC were included (about $23 400), the analysis showed that the cost of management in the clinic was half the cost of an inpatient stay (Box).

A nurse practitioner-led DRAC was successfully established at a tertiary referral hospital in NSW. Our preliminary evaluation has demonstrated improved patient outcomes and assistance for general practice in managing ongoing outpatient diabetes-related problems. In addition, for a quarter of patients presenting to the DRAC, hospitalisation was prevented. Future directions include the expansion of the DRAC across the local health district and the incorporation of a “hotline” to assist general practitioners with urgent and complex diabetes management.

Box –
Royal North Shore Hospital Diabetes Rapid Access Clinic (DRAC) evaluation: overview of patient demographics and cost analysis data

Patient demographic

No. of patients*


Patients seen (February – December 2015)

61

Male

42

Mean age, years (SD)

56 ± 16

Mean glycated haemoglobin value (SD)

9.7% ± 2.5%

Mean duration of diabetes, years (SD)

13 ± 13

Type 1 diabetes

14 (23%)

Type 2 diabetes

47 (77%)

Reason for referral to DRAC

Newly diagnosed type 1 diabetes

2

Newly diagnosed type 2 diabetes

13

Hyperglycaemia

25

Hypoglycaemia (severe)

11

Other

10

Cost analysis

No. of hospitalisations prevented

15 (25%)

Hospitalisation cost per day

$1245

Average length of stay, days

2.5

Total hospitalisation cost that would have been incurred

$46 687.50

Cost of nursing at DRAC

$23 339.52

Cost management difference

$23 347.98


* Data are number of patients unless otherwise indicated. † One patient sent to the emergency department via DRAC — not diabetes related.

Contemporary type 1 diabetes pregnancy outcomes: impact of obesity and glycaemic control

The known  Type 1 diabetes in pregnant women is associated with complications for both mother and baby. Optimal glycaemic control reduces the likelihood of these adverse outcomes.

The new  The mean body mass index of Australian women with type 1 diabetes is greater than that of women without diabetes. Even with multidisciplinary specialist care and good glycaemic control, their likelihood of adverse outcomes was greater than for women without diabetes because of this additional risk factor.

  The implicationsPre-conception care is important, but optimising glycaemic control is not sufficient to prevent complications associated with type 1 diabetes during pregnancy. Preventing obesity in childbearing women with type 1 diabetes requires greater attention.

Type 1 diabetes accounts for 5–10% of diabetes diagnoses, and is a well recognised and important risk factor for a number of complications during pregnancy.1 Women with type 1 diabetes have a higher risk of miscarriage, hypertensive complications and obstetric interventions, and their babies have an increased risk of congenital malformations, stillbirth, macrosomia and birth trauma.2

In 1989, the St Vincent Declaration set a 5-year goal of improving pregnancy outcomes for women with type 1 diabetes so that they approximated those of women without diabetes.3 Although the Diabetes Control and Complications Trial showed that improvements are possible,4 they have not been seen in observational studies.5,6

There are many gaps in the published literature about pregnancy outcomes for women with type 1 diabetes and their babies. Some studies have not distinguished the risks associated with type 1 and type 2 diabetes,7,8 others have used less informative composite outcomes79 or have not accounted for important confounders, such as maternal age, obesity and glycaemic control.5,1012 The interaction between the effects of type 1 diabetes, glycaemic control and body mass index during pregnancy are not well understood, and there are no Australian data on this question. We accordingly aimed to compare contemporary adverse pregnancy outcomes in women with or without type 1 diabetes who were managed in a specialist maternity centre with optimal health care. Further, we explored the influence of obesity and glycaemic control on pregnancy outcomes in women with type 1 diabetes.

Methods

Study design and population

This historical cohort study included all singleton births of at least 20 weeks’ gestation at Monash Health, including Clayton, Dandenong and Casey hospitals. Monash Health is one of Australia’s largest public maternity networks (7500 births each year), providing quaternary care facilities and specialised endocrine, diabetes nurse educator, obstetric, midwifery and neonatal services.

Data were obtained from the Birthing Outcomes System (BOS) database for the period 1 January 2010 – 31 December 2013. Data were collated prospectively by midwives from the first antenatal visit until delivery and discharge. The database contains routinely recorded standardised pregnancy and neonatal health information collected for statutory data reporting, including demographic data, medical history, and information about antenatal care and complications.

More than 80% of women with type 1 diabetes attended pre-conception care, half of whom attended a pre-conception and early pregnancy clinic at our service. From 12 weeks’ gestation, all attended a specialised multidisciplinary diabetes and maternity service. Care for women without diabetes was provided by midwives and obstetric staff at general antenatal clinics. Following delivery, babies were admitted to the special care nursery if they needed specialised care and observation; this is routine for babies of women with type 1 diabetes. Babies were admitted to the neonatal intensive care unit (NICU) only if they had potentially life-threatening conditions.

Antenatal characteristics and maternal and neonatal outcomes for mothers with type 1 diabetes and women with normal glucose tolerance were compared. Women with type 2 diabetes and gestational diabetes mellitus (GDM) were excluded. All women were screened for GDM at 24–28 weeks’ gestation with a 75 g oral glucose tolerance test; GDM was diagnosed if the fasting blood glucose concentration was 5.5 mmol/L or more, or the 2-hour level was 8.0 mmol/L or more. Women with risk factors were screened early for GDM and unrecognised diabetes. “Pre-existing diabetes” was recorded if reported by the woman and validated by a clinician reviewing individual medical records for type of diabetes, treatment, and the presence of microvascular complications. Glycated haemoglobin (HbA1c) levels were measured at booking and every 4–6 weeks thereafter by high performance liquid chromatography (HA-8160 Automatic Glycohemoglobin Analyzer, Arkray Adams; coefficient of variation, 1.4%).

Outcomes

The primary outcomes were large for gestational age (LGA; > 90th percentile) and small for gestational age babies (SGA; < 10th percentile), with weights adjusted for gestational age and sex according to Australian birthweight percentiles.13 Secondary maternal outcomes were induction of labour (IOL), caesarean delivery, pre-term birth (< 37 weeks’ gestation), gestational hypertension (new onset hypertension from 20 weeks’ gestation, with blood pressure ≥ 140/90 mmHg) and pre-eclampsia (hypertension with proteinuria > 300 mg/24 hours, spot urine protein:creatinine ratio ≥ 0.03 g/mmol, or renal, hepatic, neurological or haematological involvement). Secondary neonatal outcomes were admission to an NICU, hypoglycaemia (blood glucose level < 2.6 mmol/L), jaundice requiring phototherapy, and respiratory distress syndrome. Shoulder dystocia and Apgar scores below 7 at 5 minutes were reported for vaginal deliveries. Major congenital malformations and perinatal death (stillbirths at 20 weeks’ gestation or later, and neonatal deaths up to 28 days post partum or while the mother was an inpatient) were reported.

Statistical analyses

Maternal characteristics are reported for the two groups of women as descriptive statistics. Categorical data were compared using Pearson χ2 or Fisher exact tests; continuous data were compared using Student t tests or Mann–Whitney U tests as appropriate. Multivariable logistic regression analysis generated crude and adjusted odds ratios (ORs, aORs respectively) and 95% confidence intervals (CIs) for each outcome for women with type 1 diabetes (reference category: women without diabetes). Covariates that were clinically or statistically significant (P < 0.1) in the univariable analysis were included in multivariable models. Area under the curve and the likelihood ratio test were used to determine the most parsimonious multivariable models. Potential confounders analysed included maternal age, body mass index (BMI) at the first antenatal visit, region of birth, parity, smoking status, and gestational age. We accounted for repeated measurements in an individual by adjusting analyses for clustering. A subanalysis of data for women with type 1 diabetes assessed the effect of obesity and glycaemic control. P < 0.05 (two-sided) was deemed statistically significant. Analyses were performed in Stata 12 (StataCorp).

Ethics approval

The study was approved by the Monash Health Human Research Ethics Committee (reference, 14001Q, 2013).

Results

Maternal and neonatal health characteristics

Outcomes for 107 pregnancies in 94 women with type 1 diabetes and 27 075 pregnancies in 21 370 women without diabetes were analysed. The mean BMI was higher for women with type 1 diabetes than for women without diabetes (P = 0.01) (Box 1); 66% were overweight or obese, compared with 45% of women without diabetes (data not shown). Women with type 1 diabetes were more likely to have been born in Australia (P < 0.001), but there were no significant differences in age, parity or smoking status. A greater proportion of babies born to women with type 1 diabetes were girls (65% v 49%; P = 0.002) and the mean gestation time was about 2 weeks shorter (37.3 v 39.4 weeks; P < 0.001), but there was no significant difference in mean birthweight (Box 1).

Primary and secondary outcomes

The odds for women with type 1 diabetes giving birth to LGA babies was higher than for women without diabetes, after adjustment for BMI and other confounders (adjusted OR [aOR], 7.9; 95% CI, 5.3–11.8). There was no difference in the likelihood of SGA births. Women with type 1 diabetes had a greater likelihood of IOL (aOR, 3.0; 95% CI, 2.0–4.5) and caesarean delivery (aOR, 4.6; 95% CI, 3.1–7.0) than those without diabetes (Box 2). Among those who gave birth to LGA babies, the proportion of women with type 1 diabetes who had caesarean deliveries was greater than for women without diabetes (62% v 35%; aOR, 3.0; 95% CI, 1.6–5.4); a significant difference was also found for women who gave birth to non-LGA babies (62% v 26%; aOR, 5.1; 95% CI, 2.9–8.9) (data not shown). Women with type 1 diabetes had a higher rate of pre-term births (aOR, 6.7; 95% CI, 4.5–10.0) (Box 2), as well as a higher rate of pre-term caesarean deliveries (39% v 11%; aOR, 4.7; 95% CI, 2.8–7.9) (data not shown) but not of pre-term IOL (20% v 11%; aOR, 1.9; 95% CI, 0.9–4.0). There was no significant difference in maternal hypertensive complications.

Babies of women with type 1 diabetes were more likely than those of women without diabetes to be admitted to an NICU (aOR, 3.4; 95% CI, 1.8–6.4), and to have hypoglycaemia (aOR, 10.3; 95% CI, 6.8–15.6), jaundice (aOR, 5.1; 95% CI, 3.3–7.7), respiratory distress (aOR, 2.5; 95% CI, 1.4–4.4) or shoulder dystocia (aOR, 8.2; 95% CI, 3.6–18.7) (Box 2). While there was no difference in the odds of NICU admission for pre-term babies of women with and without type 1 diabetes (aOR, 0.64; 95% CI, 0.29–1.42), they were higher for term babies of women with type 1 diabetes (aOR, 4.3; 95% CI, 1.3–13.8) (data not shown). There was an interaction between type 1 diabetes and gestation time for the likelihood of hypoglycaemia: the odds were higher for term babies of women with type 1 diabetes (aOR, 22; 95% CI, 13–37) than for pre-term babies of women with type 1 diabetes (aOR, 2.9; 95% CI, 1.5–5.3) (data not shown). The odds of an Apgar score under 7 at 5 minutes was not significantly different in the two groups after adjustment for gestation time (Box 2).

There was no difference in the likelihood of congenital malformations, but that of perinatal death was higher for babies of mothers with type 1 diabetes, after adjustment for congenital malformations (aOR, 5.5; 95% CI, 2.4–12.8) (Box 2). There were five stillbirths (5 per 100 live births) to women with type 1 diabetes (three terminations because of malformations, two intra-uterine deaths at 34 and 37 weeks) and two neonatal deaths (2 per 100 live births: one termination, one instance of lung disease in an extremely premature baby). Among women without diabetes, there were 284 stillbirths (1 per 100 live births) and 110 neonatal deaths (0.4 per 100 live births); of these babies, 53 and 34 respectively had malformations.

Subgroup analysis for women with type 1 diabetes

The mean HbA1c level of women with type 1 diabetes during pregnancy was 53 mmol/mol (SD, 13). The median levels were 61 mmol/mol during the first, 52 mmol/mol during the second, and 51 mmol/mol during the third trimester. Nephropathy was documented in 14 women (15%) and retinopathy in 19 (20%), but microvascular complications were not associated with adverse outcomes. When analysed as a continuous variable, increased BMI was associated with increased odds of congenital malformations after adjustment for age and first trimester HbA1c levels (aOR [for kg/m2 difference in BMI], 1.5; 95% CI, 1.03–2.2). It was not associated with an increased likelihood of the primary outcomes, LGA and SGA babies, nor with increased odds for the secondary outcomes. When BMI was analysed as a categorical variable, however, obese women with type 1 diabetes were more likely to give birth to LGA babies than normal weight women, after adjustment for age and first trimester HbA1c levels (aOR, 3.7; 95% CI, 1.02–13.2) (Box 3).

A one percentage point increase in mean HbA1c level during pregnancy was associated with increased odds of pre-term birth (aOR, 1.9; 95% CI, 1.1–3.0) and perinatal death (aOR, 5.1; 95% CI, 1.5–17.5), but not with other adverse outcomes. Women with a mean HbA1c level of 64 mmol/mol or more were less likely to give birth to LGA babies than those with levels below 53 mmol/mol (aOR, 0.20; 95% CI, 0.05–0.80) (Box 4). Pre-eclampsia and nephropathy were not associated with a change in the odds for LGA births (data not shown). Each one percentage point increase in first trimester HbA1c level was associated with an increasing likelihood of pre-term birth (aOR, 2.5; 95% CI, 1.4–4.3) and perinatal death (aOR, 4.5; 95% CI, 1.1–18.4) and a reduced likelihood of an LGA baby (aOR, 0.62; 95% CI, 0.40–0.97) (Box 4). Second and third trimester HbA1c levels were not correlated with adverse outcomes (data not shown).

Discussion

We compared pregnancy outcomes for women with type 1 diabetes with those for women without diabetes in a large study in a quaternary public health care setting. Mean BMI was greater and the mean duration of gestation shorter for women with type 1 diabetes than for women without diabetes; the likelihood of IOL was three times, of caesarean delivery five times, and of pre-term birth seven times that for women without diabetes. The odds of babies of women with type 1 diabetes being admitted to an NICU were three times those of neonates with mothers without diabetes; the odds of their being LGA and having hypoglycaemia, jaundice, respiratory distress, shoulder dystocia or perinatal death were also increased. In women with type 1 diabetes, obesity was associated with an increased likelihood of macrosomia and congenital malformations in their babies. Higher HbA1c levels were associated with an increasing likelihood of pre-term birth and perinatal death, and reduced odds of an LGA birth.

Obstetric decisions about the mode of birth are largely driven by hospital protocol. We observed high rates of IOL and caesarean deliveries among women with type 1 diabetes, comparable with those reported in the United Kingdom14 and New Zealand,15 but higher than those in Nordic countries,10,12 where the reported mean BMI of women was lower. The difference in the proportions of pre-term births to women with and without type 1 diabetes (39% v 8%) was greater than reported in a recent systematic review (25% v 6%).6 While similar rates were reported in Denmark (41.7% v 6%),5 a much lower rate among women with type 1 diabetes was reported in Sweden (21% v 5%).12 Further, women in our study who gave birth before term were more likely to require a caesarean delivery. These differences may reflect the higher risk status of our cohort, given its higher proportion of overweight women, as the hospital protocol recommends earlier delivery for women at risk of adverse outcomes.

Neonatal outcomes were less than optimal for babies of women with type 1 diabetes. We found the likelihood of an LGA baby was eight times that for women without diabetes, and that it was independent of obesity, confirming the findings of an earlier study.12 Excess gestational weight gain16 and dyslipidaemia17 were associated with increased odds of giving birth to an LGA child, and this requires further study. Increased rates of hypoglycaemia, jaundice, respiratory distress and shoulder dystocia have similarly been associated with LGA births to mothers with type 1 diabetes.18 The odds of babies of women with type 1 diabetes being admitted to an NICU were three times those of other neonates; this compares favourably with the greater than 5-fold likelihood of admission reported by other Australian investigators,8 and may be related to our policy of routine special care nursery observation of such babies. LGA births and related adverse outcomes remain problems despite the modern management of pregnant women with type 1 diabetes, highlighting the importance of active monitoring.

The harmful effects of obesity in the general obstetric population are recognised. Scandinavian research identified that type 1 diabetes and obesity are synergistic risk factors for maternal and neonatal complications, with diabetes the stronger risk factor.11 The study found increased rates of congenital malformation in obese women with type 1 diabetes, but the authors did not examine glycaemic control.11 We found that maternal obesity in women with type 1 diabetes, after adjustment for glycaemic control, was associated with a nearly 4-fold likelihood of LGA births; further, each 1 kg/m2 increase in BMI was associated with a 50% increase in the likelihood of congenital malformations after adjustment for age and first trimester HbA1c levels. Optimal reproductive health therefore requires strategies for assisting women with type 1 diabetes to avoid excess weight prior to conception.

Type 1 diabetes is associated with an increased risk of congenital malformations and perinatal death, which may result from poor glycaemic control during conception and the first trimester of pregnancy.6,9 A systematic review reported a 2-fold risk of congenital malformations and an approximately 4-fold risk of perinatal death in women with type 1 diabetes compared with women without diabetes.6 We similarly found that the odds of perinatal death for babies of women with type 1 diabetes were four times those of other neonates, but there were no differences in the rates of congenital malformations. The women in our study had reasonable glycaemic control, and elevated HbA1c levels during the entire pregnancy and during the first trimester were associated with an increased incidence of perinatal death, but HbA1c levels were not predictive of congenital malformations after 20 weeks’ gestation. Comparisons with existing literature are difficult because of the differing periods during which congenital malformations were monitored.

The association between glycaemic control and other neonatal morbidity is less evident. A retrospective study of women with pre-existing diabetes found no association between first trimester HbA1c levels and adverse maternal or fetal outcomes.7 More recently, a prospective trial of women with type 1 diabetes in the UK found that HbA1c levels of 42–46 mmol/mol at 26 weeks’ gestation were associated with LGA births, and HbA1c levels of 48–52 mmol/mol were associated with pre-term birth, pre-eclampsia and a need for neonatal glucose infusion.19 In our cohort, there was a continuous relationship between glycaemic control throughout gestation and during the first trimester with rates of pre-term birth and perinatal death, underscoring the importance of optimal pre-conception and early antenatal glycaemic control.

Higher first trimester HbA1c levels were also associated with a reduced likelihood of an LGA birth. This is possibly related to closer monitoring of and earlier intervention in women with poor glycaemic control. Third trimester HbA1c levels were not linked with neonatal hypoglycaemia, jaundice or respiratory distress in our diabetes group. It is notable that another study found no relationship between HbA1c levels during pregnancy and neonatal hypoglycaemia or macrosomia, although maternal glucose levels during labour were negatively correlated with those of the neonate.20 We recommend intensified management in order to optimise maternal HbA1c levels, but acknowledge the limitations of this approach during pregnancy.1 Glucose level variability may be more informative when making decisions, especially later in gestation, and this question should be investigated further.

Limitations to our study include the absence of data on pre-conception glycaemic control, diabetes duration, and gestational weight gain. As we only analysed births from 20 weeks’ gestation, we may have under-represented the proportion of pregnancies with congenital malformations that did not continue beyond 20 weeks. Odds estimates are less precise for some of the rarer outcomes, and we cannot exclude an unrecognised type 2 error. The non-matched study design may have reduced the efficiency of the study and our ability to control for known confounders. Further, the large number of women in the non-diabetes group may have led to deflation of P values; that is, the statistical significance of between-group differences may have been exaggerated by the disparate sizes of the two groups. Strengths of our study include the fact that the large number of participants enabled us to address key gaps in our knowledge, with a broad range of standardised outcomes. Attention to confounders such as obesity and glycaemic control, unlike many previous investigations, improves the generalisability of our results.

Conclusion

We have addressed gaps in the literature by investigating a contemporary cohort of women with type 1 diabetes receiving multidisciplinary care, taking both BMI and glycaemic control into consideration. We found that type 1 diabetes in pregnant women, including those with reasonable glycaemic control, was associated with an increased likelihood of adverse obstetric and neonatal outcomes even when optimally managed in a quaternary setting. Increased HbA1c levels, even after correcting for maternal BMI, do not fully account for the increased frequency of adverse outcomes for women with type 1 diabetes. The higher BMI of pregnant women with type 1 diabetes was associated with a higher incidence of LGA births, independent of glycaemic control, highlighting the importance of controlling both weight and hyperglycaemia in these women. Further research could provide insights into how best to optimise pre-conception and antenatal care for women with type 1 diabetes in order to minimise the associated risks.

Box 1 –
Demographic and health characteristics of mothers with and without type 1 diabetes, and health characteristics of their neonates

Women with type 1 diabetes

Women without diabetes

P


Number

107

27 075

Maternal age (years), mean (SD)

29.3 (5.3)

29.4 (5.4)

0.76

Maternal body mass index (kg/m2) at booking visit, mean (SD)

27.3 (5.0)

25.7 (5.9)

0.01

Country of birth

Australia or New Zealand

95 (89%)

12 806 (47.3%)

< 0.001

Europe or Americas

8 (7%)

1850 (6.8%)

0.79

Africa

2 (2%)

1798 (6.6%)

0.05

Asia

2 (2%)

10 620 (39.2%)

< 0.001

Parity

0.40

Primiparous

51 (48%)

11 805 (43.6%)

Parous

56 (52%)

15 269 (56.4%)

Smoker

24 (22%)

4703 (17.4%)

0.20

Neonate sex

0.002

Boy

37 (35%)

13 896 (51.3%)

Girl

70 (65%)

13 156 (48.6%)

Gestation at birth (weeks), median (IQR)

37.3 (34.6–38.1)

39.4 (38.4–40.4)

< 0.001

Birth weight (g), mean (SD)

3230 (997)

3305 (649)

0.26


Box 2 –
Maternal and neonatal adverse outcomes for women with and without type 1 diabetes

Women with type 1 diabetes

Women without diabetes

Odds ratio (95% CI)Reference category: women without diabetes


Crude odds ratio

Adjusted odds ratio


Number

107

27 075

Large for gestational age baby

47 (44%)

2087 (7.7%)

9.4 (6.4–13.8)

7.9 (5.3–11.8)*

Small for gestational age baby

7 (7%)

3964 (14.7%)

0.41 (0.19–0.88)

0.52 (0.24–1.12)

Induction of labour

51 (48%)

5738 (21.2%)

3.4 (2.3–5.0)

3.0 (2.0–4.5)

Caesarean delivery

66 (62%)

7116 (26.3%)

4.5 (3.1–6.7)

4.6 (3.1–7.0)

Pre-term birth

42 (39%)

2186 (8.1%)

7.4 (5.0–10.9)

6.7 (4.5–10.0)

Gestational hypertension

2 (2%)

527 (2.0%)

0.96 (0.24–3.9)

0.86 (0.21–3.5)§

Pre-eclampsia

5 (5%)

645 (2.4%)

2.0 (0.8–5.0)

1.8 (0.7–4.5)§

Neonatal intensive care unit admission

11 (11%)

727 (2.7%)

4.3 (2.3–8.1)

3.4 (1.8–6.4)

Hypoglycaemia

41 (38%)

1074 (4.0%)

15.0 (10.1–22.3)

10.3 (6.8–15.6)**

Jaundice requiring phototherapy

40 (37%)

1737 (6.4%)

8.7 (5.9–12.9)

5.1 (3.3–7.7)

Respiratory distress requiring resuscitation

16 (15%)

1039 (3.8%)

4.4 (2.6–7.5)

2.5 (1.4–4.4)

Shoulder dystocia††

7 of 41 (17%)

498 of 19 958 (2.5%)

8.1 (3.5–18.2)

8.2 (3.6–18.7)

Apgar score under 7 at 5 min††

7 of 40 (17%)

577 of 19 887 (2.9%)

7.1 (3.1–16.1)

2.7 (0.90–8.1)**

Congenital malformation

4 (4%)

996 (3.7%)

1.02 (0.4–2.8)

1.05 (0.39–2.9)

Perinatal death

7 (7%)

394 (1.5%)

4.7 (2.2–10.3)

4.3 (1.9–9.9)

Perinatal death, excluding congenital malformation

7 (7%)

307 (1.2%)

6.1 (2.8–13.3)

5.5 (2.4–12.8)


All outcomes adjusted for age and body mass index. Additional adjustments: * adjusted for parity, smoking status and country of birth; † adjusted for pre-eclampsia, smoking status and country of birth; ‡ adjusted for parity and pre-eclampsia; § adjusted for parity; ¶ adjusted for smoking status and country of birth; ** adjusted for gestation. †† Reported for vaginal delivery only.

Box 3 –
Association between maternal body mass index and pregnancy outcomes for 107 women with type 1 diabetes

Women with type 1 diabetes

Odds ratio (95% CI)


Crude odds ratio

Adjusted odds ratio


Body mass index as continuous variable (per 1 kg/m2 difference in body mass index)

Large for gestational age baby

47 (44%)

1.06 (0.98–1.14)

1.08 (0.98–1.18)*

Small for gestational age baby

7 (8%)

1.07 (0.93–1.24)

1.06 (0.91–1.22)

Induction of labour

51 (48%)

0.98 (0.91–1.06)

0.99 (0.91–1.07)

Caesarean delivery

66 (62%)

1.03 (0.95–1.12)

1.03 (0.94–1.12)

Pre-term birth

42 (39%)

0.98 (0.91–1.06)

0.99 (0.90–1.09)

Hypertensive complications††

7 (7%)

1.08 (0.93–1.25)

1.07 (0.93–1.24)

Hypoglycaemia

41 (38%)

1.03 (0.95–1.11)

1.03 (0.92–1.14)§

Jaundice

40 (37%)

1.01 (0.94–1.10)

0.99 (0.88–1.10)§

Shoulder dystocia‡‡

7 (17%)

1.07 (0.92–1.24)

1.10 (0.93–1.29)

Congenital malformation

4 (4%)

1.22 (1.01–1.48)

1.51 (1.03–2.23)**

Perinatal death

7 (7%)

0.77 (0.61–0.98)

0.91 (0.70–1.17)*

Body mass index as categorical variable

Large for gestational age baby (n = 47)

Normal weight (< 25.0 kg/m2)

13 (28%)

1.00

1.00

Overweight (25.0–29.9 kg/m2)

18 (38%)

1.5 (0.6–3.6)

2.7 (0.77–9.2)

Obese (≥ 30.0 kg/m2)

16 (34%)

2.2 (0.8–5.9)

3.7 (1.02–13.2)


All variables adjusted for age. Additional adjustments: * adjusted for mean HbA1c level; † adjusted for parity and smoking status; ‡ adjusted for mean HbA1c level and pre-eclampsia; § adjusted for third trimester HbA1c level; ¶ adjusted for gestation; ** adjusted for first trimester HbA1c level. †† Pre-eclampsia and gestational hypertension. ‡‡ Reported for vaginal delivery only.

Box 4 –
Association between maternal HbA1c  levels across gestation and pregnancy outcomes for 107 women with type 1 diabetes

Women with type 1 diabetes

Odds ratio (95% CI)


Crude odds ratio

Adjusted odds ratio


HbA1clevel as continuous variable

Large for gestational age baby

47 (44%)

0.75 (0.51–1.1)

0.74 (0.48–1.1)

Small for gestational age baby

7 (8%)

0.99 (0.47–2.1)

1.1 (0.49–2.5)

Induction of labour

51 (48%)

0.93 (0.65–1.3)

0.93 (0.61–1.4)*

Caesarean delivery

66 (62%)

0.97 (0.67–1.4)

1.1 (0.76–1.7)

Pre-term birth

42 (39%)

2.0 (1.3–3.2)

1.9 (1.1–3.0)

Hypertensive complications§

7 (7%)

0.70 (0.28–1.7)

0.72 (0.27–1.9)

Hypoglycaemia

41 (38%)

0.94 (0.65–1.4)

0.93 (0.63–1.4)

Jaundice

40 (37%)

1.06 (0.74–1.5)

0.69 (0.41–1.2)

Shoulder dystocia

7 (17%)

1.01 (0.54–1.9)

1.5 (0.52–4.1)

Congenital malformation

4 (4%)

1.3 (0.64–2.7)

2.0 (0.60–6.8)

Perinatal death

7 (7%)

3.8 (1.4–10.3)

5.1 (1.5–17.5)

First trimester HbA1clevel as continuous variable (per one percentage point difference in HbA1c level)

Large for gestational age baby

47 (44%)

0.61 (0.41–0.93)

0.62 (0.40–0.97)

Pre-term birth

42 (39%)

2.3 (1.4–3.8)

2.5 (1.4–4.3)

Perinatal death

7 (7%)

2.5 (1.2–5.1)

4.5 (1.1–18.4)

HbA1clevel as categorical variable

Large for gestational age baby (n = 47)

< 53 mmol/L

23 (52%)

1

1

53–63 mmol/L

18 (41%)

1.3 (0.51–3.1)

1.05 (0.41–2.7)

≥ 64 mmol/L

2 (7%)

0.20 (0.05–0.76)

0.20 (0.05–0.80)


All variables adjusted for age and body mass index. Additional adjustments: * adjusted for smoking status; † adjusted for parity; ‡ adjusted for gestation. § Pre-eclampsia and gestational hypertension. ¶ Reported for vaginal delivery only.

Preventing all the complications of hyperglycaemia: not a straightforward task

Individualised multifactorial treatment strategies are required to optimise outcomes

Epidemiological studies have found positive relationships between measures of glycaemia and adverse fetal and maternal pregnancy outcomes,1 macrovascular disease2,3 and the microvascular complications of diabetes.2,3 The relationship between glycaemia and microvascular disease is more complicated, as there is an inflection point below which the risk is very low, but beyond which it rises sharply. The inflection point of the relationship between glycaemia values and the prevalence of retinopathy has been used to determine both the glucose tolerance test values and the glycated haemoglobin (HbA1c) level used to diagnose diabetes (see Figure 1 in reference 3).

Epidemiological studies have also found that the prevalence of hyperglycaemia associated with pregnancy,4,5 macrovascular disease6 and microvascular complications7,8 is modified — usually increased — by other known risk factors. For pregnancy, the independent adverse effects of obesity and maternal weight gain are well documented,4,5 so that the conclusion reached by Abell and colleagues9 in this issue of the MJA is not surprising: “Poor glycaemic control is not wholly responsible for adverse outcomes, reinforcing the importance of other risk factors, such as obesity and weight gain.”

Although the association between hyperglycaemia and the adverse effects of diabetes is clear, an association does not establish cause and effect. However, randomised controlled clinical trials have shown the benefits of better glycaemic control in pregnancy for reducing the incidence of fetal adiposity and macrosomia, of maternal pre-eclampsia, and of microvascular complications in both type 1 and type 2 diabetes. An unexpected finding from long term follow-up studies was that improved glycaemic control early in the course of diabetes had a very long lasting benefit with regard to microvascular and macrovascular complications in both type 1 and type 2 diabetes, even though improved control had been lost at the end of the intervention period.1012 This long lasting effect has been labelled the “legacy effect”, or “metabolic memory”.

With regard to macrovascular disease, the situation is more complex, particularly in type 2 diabetes. Long term follow-up of the United Kingdom Prospective Diabetes Study7 and of the Diabetes Control and Complications Trial for type 1 diabetes11 found that better early glycaemic control in newly diagnosed patients reduced the long term risk of cardiac infarction or of dying from any cause. On the other hand, more intensive treatment of pre-existing type 2 diabetes in high risk patients in the Action to Control Cardiovascular Risk in Diabetes (ACCORD) trial was not associated with any reduction in macrovascular disease incidence or mortality in either the long or short term.12 However, a small single-centre study in a different health system showed that a multifactorial intervention in a population at risk of cardiovascular disease, including better glycaemic control (but less than that achieved in the ACCORD trial), resulted in a significant decrease in mortality.12

To add to the complexity, the initial effect of better glycaemic control is to increase the risk of retinopathy. Although this risk declines with time,11 the initial deterioration can threaten vision and may require therapy.

From the above, it can be seen that the benefits of better glycaemic control are not simple, nor are the effects always positive or immediate in onset. Classical cardiovascular risk factors influence the risk of both macrovascular and microvascular complications in patients with diabetes.6,7 Multifactorial interventions that treat the classical macrovascular risk factors of hypertension, hypercholesterolaemia and smoking have been shown to reduce the incidence of both microvascular and macrovascular complications.13

Do these factors influence our treatment of diabetes? What degree of glycaemic control should be targeted? The Australian Diabetes Society recommends that targets for glycaemic control be individualised.14 Factors that will influence the target include the risks to the patient associated with the degree of hyperglycaemia and the potential benefits of tighter glycaemic control, as well as the risks associated with tighter control. In particular, patients with reduced life expectancy (particularly older patients) and those with a high risk of cardiovascular disease probably require less tight glycaemic control. Treatment should, of course, be holistic, including attention to any other relevant risk factors.

The legacy effect6,7,10 should strongly influence the therapeutic targets, particularly in younger, recently diagnosed patients, who can often achieve excellent glycaemic control with little risk of hypoglycaemia. It is crucial that the treatment targets and rationale should be discussed with the patient.

The problem with modern endocrinology

Improved doctor–patient communications and more research are necessary

The problem with endocrinology is that patients and doctors sometimes talk a different language. This is because there are many areas of uncertainty. How aggressively should the management of diabetes or osteoporosis be pursued? Should borderline thyroid function tests or testosterone be treated? What is the best diet for a patient with type 2 diabetes?

A patient with diabetes wants to know if he is going to die young, go blind or end up on dialysis. The doctor tells him that his glycated haemoglobin and LDL cholesterol levels are slightly elevated at 7.2% and 2.1 mmol/L, respectively, and his blood pressure is healthy. A patient with osteoporosis on treatment wants to know if her bones are getting healthier. The doctor says her bone mineral density is increasing. A patient with abnormal thyroid function test results or a slightly low testosterone level wants to know if this indicates illness and needs treatment. The doctor says she does not know but offers hormone replacement because it seems logical, is quick and is often what the patient wants.

Modern research often uses surrogate endpoints because the real outcomes are very hard to measure. Are we fixing the blood tests but not the patient? We are trying to do better. New studies in diabetes look at cardiovascular outcome and sometimes even cardiovascular mortality or overall mortality. Bone research has for years now investigated clinically significant fractures rather than just bone mineral density.

This issue of the MJA tackles these issues in four major areas of endocrinology: diabetes, osteoporosis, thyroid disease and male hypogonadism. It is likely these diseases involve half the population over 50 years of age.

In diabetes, new studies look at cardiovascular outcomes, time to dialysis or transplant, and sometimes overall mortality. New treatments include new drugs as well as new approaches to patient management. To keep up to date, we can read studies that describe real endpoints not surrogates. A cure for either type 1 or type 2 diabetes seems as far away as ever but treatments and outcomes continue to improve. However, this has not stopped the recurrent admission to hospital of patients with diabetes. Better general practice systems for managing patients with chronic disease are required to prevent the merry-go-round of recurrent emergency department visits and hospitalisation of patients with diabetes.1 Behavioural innovation is crucial to improving the health of a million Australians living with type 2 diabetes.2

One of the biggest communication challenges in diabetes management is what to advise the patient about the best diet. This remains unclear — most studies are short term with small numbers. How do we choose among options such as the CSIRO, Mediterranean, low fat, low carb and Paleo diets? In this issue, Andrikopoulos assists by discussing diabetes and the Paleo diet.3 Most recommendations still suggest a low joule, low fat, high complex carbohydrate diet.

In osteoporosis management, the problem is different. How to get the patients to take drugs with proven efficacy but with very rare, but frightening side effects? The currently available bisphosphonates and denosumab reduce fractures by up to 50% but 1 in 100 000 patients will experience dead bone in the mouth (osteonecrosis of the jaw) or an atypical femoral fracture, with the bone suddenly giving way.4 For the doctor, the risk–benefit equation obviously favours treatment. Not so for the patient. We need to improve our communication on this issue.

The management of thyroid disease seems straightforward enough — anti-thyroid drugs for hyperthyroidism and thyroxine replacement therapy for hypothyroidism. But what about patients with either high or low levels of thyroid-stimulating hormone but with normal thyroxine and triiodothyronine levels? Does treatment fix the blood test or the patient? Unfortunately, it is still not clear but the narrative review by Walsh in this issue suggests a practical approach.5 Five per cent of the population have a thyroid nodule. The patient just wants to know whether it is cancer and if they will die of it. Multiple ultrasounds and fine needle biopsies later, the doctor reassures the patient and says “we will watch it”. Frequently, surgical resection reveals benign disease. Better diagnostic pathways are required.

Last, what about communication in the field of men’s health. Low testosterone seems to be a straightforward problem easily solved by testosterone replacement. It is a quick consultation and the patient gets what he wants — patient, doctor and pharmaceutical company are happy. But is it good medicine? Alas no. It takes time to explain that the low testosterone measurements are not a disease and that the likely cause of the symptoms often lies elsewhere. The Endocrine Society of Australia position statement in this issue helps define the problems and suggests a decision making strategy.6

The answers to many of these challenges lie in two approaches — better communication at the clinical level and more research, both basic and clinical.

Osteoporosis treatment: a missed opportunity

Minimal trauma fractures remain a major cause of morbidity in Australia, affecting one in two women and one in four men over the age of 60 years.1 Mortality is increased after all minimal trauma fractures, even after minor fractures.2 Hip fractures are particularly devastating, leading to decreased quality of life, increased mortality and loss of functional independence.3

Defining osteoporosis

Bone mineral density (BMD) is expressed in relation to either “young normal” adults of the same sex (T score) or to the expected BMD for the patient’s age and sex (Z score). Osteoporosis is defined as a T score ≤ 2.5 SDs below that of a “young normal” adult, with fracture risk increasing twofold to threefold for each SD decrease in BMD.4,5 A BMD Z score less than −2 indicates that BMD is below the normal range for age and sex, and warrants a more intensive search for secondary causes. Importantly, osteoporosis is also diagnosed after a minimal trauma fracture, irrespective of the patient’s T score.

Absolute fracture risk

Treatment for osteoporosis is recommended for patients with a high absolute fracture risk. This includes older Australians (post-menopausal women and men aged over 60 years) with T scores ≤ −2.5 at the lumbar spine, femoral neck or total hip, and patients with a history of a minimal trauma fracture.6 There is a major gap between evidence and treatment in secondary fracture prevention, with fewer than 20% of patients presenting with a minimal trauma fracture being treated or investigated for osteoporosis.7,8 However, it is important that patients with a low fracture risk, including younger women without clinical risk factors and T scores ≤ −2.5 at “non-main-sites” (eg, lateral lumbar spine or Ward’s triangle in the hip) are not treated.9 Absolute fracture risk calculators incorporate osteoporosis risk factors with BMD to stratify fracture probability.10 It is therefore important for clinicians to assess absolute fracture risk. Two of several absolute fracture risk calculators are commonly used to aid clinicians in this regard: the Garvan Fracture Risk Calculator11 and the Fracture Risk Assessment Tool (FRAX) developed by the World Health Organization.

The Garvan Fracture Risk Calculator estimates absolute fracture risk over 5 and 10 years (http://www.garvan.org.au/bone-fracture-risk/). It may be used in men and women aged over 50 years, and incorporates age, sex, BMD at the spine or femoral neck, falls and fracture history. A potential limitation of this tool is that it does not include other clinical risk factors. The country-specific FRAX tool calculates the 10-year probability of hip fracture and major osteoporotic fracture in patients aged 40–90 years. It incorporates femoral neck BMD with ten clinical risk factors. Limitations include underestimation of fracture risk in patients with multiple minimal trauma fractures, an inability to adjust the risk for dose-dependent exposure, a lack of validation for use with BMD of the spine, and exclusion of falls.

Role of fracture risk calculators in 2016

The role of absolute fracture risk calculators in clinical practice is evolving. In addition to their individual limitations, there is a lack of evidence that their use leads to effective targeting of drug therapy to those deemed to be at high risk of fracture,12 and prospective studies are needed. In particular, country-specific intervention thresholds based on absolute fracture risk need to be validated clinically. However, fracture risk calculators are useful for identifying patients with low fracture risk who do not require treatment.

Special patient groups

Limited evidence-based guidance is available for treating osteoporosis in several groups, including patients with post-transplantation osteoporosis, type 1 diabetes mellitus, chronic kidney disease (creatinine clearance < 30 mL/minute), neurological, respiratory and haematological diseases, and young adults and pregnant women. Such patients require individualised management.

Osteoporosis prevention using non-pharmacological therapies

Lifestyle approaches (adequate dietary calcium intake, optimal vitamin D status, participation in resistance exercise, smoking cessation, avoidance of excessive alcohol, falls prevention) act as a framework for improving musculoskeletal health at a population-based level.6,1316

Calcium and vitamin D

The current Australian recommended daily intake (RDI) of calcium is 1300 mg per day for women aged over 51 years, 1000 mg per day for men aged 51–70 years and 1300 mg per day for men aged over 70 years.17 Adverse effects of calcium supplementation include gastrointestinal bloating, constipation,18 and renal calculi.19 There is controversy about the efficacy of calcium in preventing osteoporotic fractures.6,19,20 Further work is required with studies powered to investigate cardiac outcomes in men and women receiving calcium supplementation to meet current RDIs. Higher dietary calcium intake is also associated with reductions in mortality, cardiovascular events and strokes.21 Dietary sources of calcium are the preferred sources. Calcium supplementation should be limited to 500–600 mg per day, and used only by those who cannot achieve the RDI with dietary calcium.15

The main source of vitamin D is through exposure to sunlight. Institutionalised or housebound older people are at particularly high risk of vitamin D deficiency. Inadequate vitamin D status is defined as a serum 25-hydroxyvitamin D (25(OH)D) level < 50 nmol/L in late winter/early spring; in older individuals such inadequate vitamin D levels are associated with muscular weakness and decreased physical performance.22 Increased falls and fractures occur at 25(OH)D levels < 25–30 nmol/L.23,24 Adults aged 50–70 years and those over 70 years require at least 600 IU to 800 IU of vitamin D3 daily, with larger daily doses required to treat vitamin D deficiency.25

Exercise

Community-based high speed, power training, multimodal exercise programs increase BMD and muscle strength, with a trend to falls reduction.26 Thus, exercise is recommended both to maintain bone health and reduce falls. It should be individualised to the patient’s needs and abilities, increasing progressively as tolerated by the degree of osteoporosis-related disability.

Falls prevention

Falls are the precipitating factor in nearly 90% of all appendicular fractures, including hip fractures,3 and reducing falls risk is critical in managing osteoporosis. Reducing the use of benzodiazepines, neuroleptic agents and antidepressants reduces the risk of falls,27 and, among women aged 75 or more years, muscle strengthening and balance exercises reduce the risk of both falls and injuries.28

Antiresorptive therapy for osteoporosis

Post-menopausal osteoporosis results from an imbalance in bone remodelling, such that bone resorption exceeds bone formation. Antiresorptive drugs decrease the number, activity and lifespan of osteoclasts,29 preserving or increasing bone mass with a resulting reduction in vertebral, non-vertebral and hip fractures. These drugs include bisphosphonates (oral or intravenous),3035 oestrogen36,37 and selective oestrogen receptor-modulating drugs,38 strontium ranelate and denosumab, a human monoclonal antibody against receptor activator of nuclear factor κB-ligand (RANKL).39

Antiresorptive treatments for osteoporosis are approved for reimbursement on the Pharmaceutical Benefits Scheme (PBS) for men and post-menopausal women following a minimal trauma fracture, as well as for those at high risk of fracture, on the basis of age (> 70 years) and low BMD (T score < −2.5 or −3.0). Bisphosphonates are also approved for premenopausal women who have had a minimal trauma fracture. In patients at high risk of fracture, osteoporosis therapy reduces the risk of vertebral fractures by 40–70%, non-vertebral fractures by about 25%, and hip fractures by 40–50%.3040

Bisphosphonates

Mechanism of action and efficacy. Bisphosphonates are stable analogues of pyrophosphate. They bind avidly to hydroxyapatite crystals on bone and are then released slowly at sites of active bone remodelling in the skeleton, leading to recirculation of bisphosphonates. The terminal half-lives of bisphosphonates differ; for alendronate it is more than 10 years,41 while for risedronate it is about 3 months.42

Alendronate prevents minimal trauma fractures. Therapy with alendronate reduces vertebral fracture risk by 48% compared with placebo. Similar reductions in the risk of hip and wrist fractures were seen in women treated with alendronate who had low BMD and prevalent vertebral fractures.33,34,43 A randomised, double-blind, placebo-controlled trial of post-menopausal women assigned to risedronate therapy or placebo for 3 years showed vertebral and non-vertebral fracture risks were respectively reduced by 41% and 39% by risedronate.35 Three years of treatment with zoledronic acid in women with post-menopausal osteoporosis reduced the risk of morphometric vertebral fracture by 70% compared with placebo, and reduced the risk of non-vertebral and hip fracture by 25% and 41% respectively.30

Adverse effects. The main potential adverse effects of oral bisphosphonates are gastrointestinal (including reflux, oesophagitis, gastritis and diarrhoea). Oral bisphosphonates should not be given to patients with active upper gastrointestinal disease, dysphagia or achlasia. Intravenous bisphosphonates are associated with an acute phase reaction (fever, flu-like symptoms, myalgias, headache and arthralgia) in about a third of patients, typically within 24–72 hours of receiving their first infusion of zoledronic acid, but is reduced significantly on subsequent infusions.30 Treatment with antipyretic agents, including paracetamol, improves these symptoms. Treatment with bisphosphonates may also lower serum calcium concentrations, but this is uncommon in the absence of vitamin D deficiency.44,45 Bisphosphonates are not recommended for use in patients with creatinine clearance below 30–35 mL/min.

Less common adverse effects associated with long term bisphosphonate therapy include osteonecrosis of the jaw (ONJ) and atypical femoral fracture (AFF). Overemphasis of these uncommon adverse effects by patients has led to declining osteoporosis treatment rates.46

Jaw osteonecrosis. ONJ is said to occur when there is an area of exposed bone in the maxillofacial region that does not heal within 8 weeks after being identified by a health care provider, in a patient who was receiving or had been exposed to a bisphosphonate and did not have radiation therapy to the craniofacial region.47 Risk factors for ONJ include intravenous bisphosphonate therapy for malignancy, chemotherapeutic agents, duration of exposure to bisphosphonates, dental extractions, dental implants, poorly fitting dentures, glucocorticoid therapy, smoking, diabetes and periodontal disease.48,49 The risk of ONJ is about 1 in 10 000 to 1 in 100 000 patient-years in patients taking oral bisphosphonates for osteoporosis.47 Given the prolonged half-life of bisphosphonates, temporary withdrawal of treatment before extractions is unlikely to have a significant benefit and is therefore not recommended.50

Atypical femur fractures. Clinical trial data clearly support the beneficial effect of bisphosphonates in preventing minimal trauma fractures. However, oversuppression of bone remodelling may allow microdamage to accumulate, leading to increased bone fragility.51 Cases of AFF and severely suppressed bone remodelling after prolonged bisphosphonate therapy52 have prompted further research and recent guideline development.53 However, this finding is not universal. AFFs occur in the subtrochanteric region or diaphysis of the femur and have unique radiological features, including a predominantly transverse fracture line, periosteal callus formation and minimal comminution, as shown in Box 1.53 AFFs have been reported in patients taking bisphosphonates and denosumab, but about 7% of cases occur without exposure to either drug. AFFs appear to be more common in patients who have been exposed to long term bisphosphonate therapy, with a higher risk (113 per 100 000 person-years) in patients who receive more than 7–8 years of therapy.53 Although many research questions remain unanswered, including aetiology, optimal screening and management of these fractures, the risk of a subsequent AFF is reduced from 12 months after cessation of bisphosphonate treatment.

Duration of therapy. Concerns about the small but increased risk of adverse events after long term treatment with bisphosphonates (Box 2) have led to the development of guidelines on the optimal duration of therapy.54 For patients at high risk of fracture, bisphosphonate treatment for up to 10 years (oral) or 6 years (intravenous) is recommended. For women who are not at high risk of fracture after 3 years of intravenous or 5 years of oral bisphosphonate treatment, a drug holiday of 2–3 years may be considered (Box 3). However, it is critical to understand that “holiday” does mean “retirement”, and those patients should continue to have BMD monitoring after 2–3 years.

Hormone replacement therapy

Hormone replacement therapy (HRT) is effective in preventing and treating post-menopausal osteoporosis. Benefits need to be balanced against thromboembolic and vascular risk, breast cancer risk (for oestrogen plus progesterone), and duration of therapy. HRT is most suitable for recently menopausal woman (up until age 59 years), particularly for those with menopausal symptoms. In women with an early or premature menopause, HRT should be continued until the average age of menopause onset (about 51 years), or longer in the setting of a low BMD. Oral or transdermal oestrogen therapy (in women who have had a hysterectomy) and combined oestrogen and progesterone therapy preserve BMD,55 and were also shown to reduce the risk of hip, vertebral and total fractures compared with placebo in the Women’s Health Initiative (WHI).37,56

In the initial WHI analysis, combined oral oestrogen and progesterone therapy for 5.6 years in post-menopausal women aged 50–79 years (who were generally older than women who used HRT for control of menopausal symptoms), many of whom had cardiovascular risk factors, was shown to increase the risk of breast cancer, stroke and thromboembolic events.57 However, subsequent reanalysis of WHI data has established the efficacy and safety of HRT in younger women up until 10 years after menopause, or the age of 59 years, when the benefits of treatment outweigh the risks. In women with a history of hysterectomy, oral oestrogen therapy alone has a better benefit–risk profile, with no increases in rates of breast cancer or coronary heart disease.56

Women commencing HRT should be fully informed about its benefits and risks. Cardiovascular risk is not increased when therapy is initiated within 10 years of menopause,58,59 but the risk of stroke is elevated regardless of time since menopause. It is also recommended that doctors discuss smoking cessation, blood pressure control and treatment of dyslipidaemia with women commencing HRT.

Selective oestrogen receptor modulator (SERM) drugs

The SERM raloxifene has beneficial oestrogen-like effects on bone, but has oestrogen antagonist activity on breast and endometrium. Treatment with raloxifene for 3 years reduced vertebral fractures by 30–50% compared with placebo in post-menopausal women.38 However, there was no reduction in non-vertebral fractures. Consequently, raloxifene is useful in post-menopausal women with spinal osteoporosis, particularly those with an increased risk of breast cancer. Raloxifene therapy is also associated with a 72% reduction in the risk of invasive breast cancer.60 Raloxifene may exacerbate hot flushes, and women receiving raloxifene have a greater than threefold increased incidence of thromboembolic disease, comparable with those receiving HRT.36,56 Raloxifene therapy is also associated with an increased risk of stroke,61 particularly in current smokers.

Denosumab

Denosumab is a human monoclonal antibody with specificity for RANKL, which stimulates the development and activity of osteoclasts. Denosumab mimics the endogenous inhibitor of RANKL, osteoprotegerin, and is given as a 60 mg subcutaneous injection once every 6 months. Denosumab reduces new clinical vertebral fractures by 68%, with a 40% reduction in hip fracture and a 20% reduction in non-vertebral fractures compared with placebo over 3 years.39,62

The adverse effects of denosumab include small increases in the risks of eczema, cellulitis and flatulence.39 Hypocalcaemia, particularly in patients with abnormal renal function, has also been reported,63 and denosumab is contraindicated in patients with hypocalcaemia. Jaw osteonecrosis has been reported in patients receiving denosumab for osteoporosis, as have AFFs.64,65

Strontium ranelate

Strontium ranelate increases bone formation markers and reduces bone resorption markers, but is predominantly antiresorptive, as increases in the rate of bone formation have not been demonstrated.66 Strontium ranelate significantly reduces the risk of vertebral and non-vertebral fractures.6769 The most frequent adverse effects associated with strontium ranelate are nausea, diarrhoea, headache, dermatitis and eczema.67,68 Cases of a rare hypersensitivity syndrome (drug reaction, eosinophilia and systemic symptoms [DRESS]) have been reported, and strontium ranelate should be discontinued if a rash develops. Strontium ranelate treatment was associated with an increased incidence of venous thromboembolism70 and, more recently, with a small increase in absolute risk of acute myocardial infarction. Strontium ranelate is contraindicated in patients with uncontrolled hypertension and/or a current or past history of ischaemic heart disease, peripheral arterial disease and/or cerebrovascular disease.71 This drug is now a second-line treatment for osteoporosis, only used when other medications for osteoporosis are unsuitable, in the absence of contraindications.

Anabolic therapy for osteoporosis

Teriparatide

Teriparatide increases osteoblast recruitment and activity to stimulate bone formation.40 In contrast to antiresorptive agents, which preserve bone microarchitecture and inhibit bone loss, teriparatide (recombinant human parathyroid hormone [1–34]) stimulates new bone formation and improves bone microarchitecture. Teriparatide reduced the risk of new vertebral fractures by 65% in women with osteoporosis who have had one or more baseline fractures40 and also reduced new or worsening back pain. Non-vertebral fractures are also reduced by 53% by teriparatide, but studies have been underpowered to detect reductions in the rate of hip fracture. Side effects include headache (8%), nausea (8%), dizziness and injection-site reactions. Transient hypercalcaemia (serum calcium level, > 2.60 mmol/L) after dosing also occurred in 3–11% of patients receiving teriparatide.

Teriparatide has a black box warning concerning an increased incidence of osteosarcoma in rats that were exposed to 3 and 60 times the normal human exposure over a significant portion of their lives. Teriparatide is therefore contraindicated in patients who may be at increased risk of osteosarcoma, including those with a prior history of skeletal irradiation, Paget’s disease of bone, an unexplained elevation in bone-specific alkaline phosphatase, bone disorders other than osteoporosis, and in adolescents and children.

In Australia, the maximum lifetime duration of teriparatide therapy is 18 months. However, the antifracture benefit increases the longer the patient remains on treatment, with non-vertebral fractures being reduced for up to 2 years of treatment compared with the first 6 months of treatment, and for up to 2 years following cessation of treatment.72 In addition, increases in the rates of trabecular and cortical bone formation continue for up to 2 years of treatment, refuting the outmoded concept of a limited “anabolic window” of action for this drug.73 Importantly, following teriparatide therapy, the accrued benefits will be lost if antiresorptive therapy is not immediately instituted. Teriparatide reimbursement through the PBS is restricted to patients who have had two minimal trauma fractures and who have a fracture after at least a year of antiresorptive therapy, and who have a BMD T score below −3. However, the rate of teriparatide use in Australia is among the lowest in the world (David Kendler, University of British Columbia, Canada, personal communication).

Future directions

Three new anti-osteoporosis drugs are in clinical development.

“Selective” antiresorptive drugs

A novel “selective” antiresorptive drug, odanacatib, is a cathepsin K inhibitor that has the advantage of not suppressing bone formation, as do traditional or “non-selective” antiresorptive drugs. Clinical trial data in the largest ever osteoporosis trial, published in abstract form, show that odanacatib, given as a weekly tablet, reduces vertebral, non-vertebral and hip fractures with risk reductions similar to those seen with bisphosphonates. Adverse events were reported and include atypical femur fractures, morphea and adjudicated cerebrovascular events.74 The benefit–risk profile of this drug is currently being clarified.

Anabolic drugs

The two other new drugs are anabolic agents. Abaloparatide, an analogue of parathyroid hormone-related protein (1–34), selectively acts on the type 1 parathyroid hormone receptor to stimulate bone formation. It is given as a daily injection.75 It reduces vertebral and non-vertebral fractures, but data for hip fracture are lacking.76 Abaloparatide reduced major osteoporotic fractures by 67% compared with placebo.77 Abaloparatide will also have a black box warning about osteogenic sarcoma in rats. The final drug, romosozumab, is a monoclonal antibody that targets an inhibitor of bone formation, sclerostin, and is given as 2-monthly injections for 12 months. Trial data comparing reductions in fractures with placebo are awaited, and a head-to-head trial comparing the antifracture efficacy of romosozumab with alendronate is ongoing.

Conclusion

Osteoporosis treatment represents a missed opportunity for medical practitioners. Despite a growing number of effective therapies, where the benefits far outweigh the risks, only a minority of patients presenting to the health care system with minimal trauma fractures are being either investigated or treated for osteoporosis.

The time to close this gap between evidence and treatment is long overdue and will require systems-based approaches supported by both the federal and state governments. One such approach is fracture liaison services, which have proven efficacy in cost-effectively reducing the burden of fractures caused by osteoporosis, and are increasingly being implemented internationally. General practitioners also need to take up the challenge imposed by osteoporosis and become the champions of change, working with the support of specialists and government to reduce the burden of fractures caused by osteoporosis in Australia.

Box 1 –
Bilateral atypical femoral fractures in an older woman after bisphosphonate therapy for 9 years*


* Note the characteristic findings of a predominantly transverse fracture line, periosteal callus formation and minimal comminution on the left, and the periosteal reaction on the lateral cortex on the right femur, indicating an early stress fracture.

Box 2 –
Balancing benefits and risks of bisphosphonate therapy with other lifetime risks*


* Adapted from Adler, et al.54

Box 3 –
Approach to the management of post-menopausal women on long term bisphosphonates therapy for osteoporosis*


DXA = dual-energy x-ray absorptiometry. * Adapted from Adler, et al.54 † Includes age > 70 years; clinical risk factors for fracture and osteoporosis; fracture risk score on fracture risk calculation tools above the Australian treatment threshold. ‡ Cessation of treatment for 2–3 years.