×

Availability of highly sensitive troponin assays and acute coronary syndrome care: insights from the SNAPSHOT registry

Recent community campaigns on the warning signs of a heart attack have significantly increased the number of patients presenting to emergency departments (EDs) with possible acute coronary syndrome (ACS).1 Concomitantly, the advent of assays with improved sensitivity for detecting circulating cardiac troponins (cTn) — which are fundamental to the diagnosis of acute myocardial infarction (AMI) — has allowed the detection of low concentrations of these biomarkers,2 and an increase in proportions of ED patients with AMI has been reported.3

There has also been an associated increase in the number of patients with an elevated cTn level that is not attributable to an unstable coronary artery plaque resulting in an ACS.3 It is recommended that patients in the ED who have an elevated troponin level have further assessment and/or management of the underlying cause, which often includes admission to hospital with resulting use of resources.4 Thus, there is continued debate among clinicians about the overall utility of these highly sensitive assays, and questions about the overall population benefits.

The diagnosis of myocardial infarction (MI) requires a characteristic dynamic profile of myocyte necrosis of cardiac biomarker(s), preferably a troponin (troponin I and T).2 There are many assays for detecting these troponins, and these vary in analytical performance. There are two defining characteristics of a highly sensitive assay — it must have a coefficient of variation (a measure of analytical imprecision) of less than 10% at the 99th percentile of a healthy reference population, and should reliably measure results accurately in at least 50% of such a population.5 A scoring system has been proposed for assays, whereby highly sensitive assays should all be deemed “guideline acceptable”.5,6

The SNAPSHOT ACS study,7 a prospective audit of the management of consecutive patients admitted with suspected ACS during a 2-week period in Australia and New Zealand, allowed a unique opportunity to assess the real-time implications of the assays used. At the time of the audit, some centres in Australia and New Zealand had access to an assay with higher sensitivity (Roche hsTnT), while many continued to use the fourth generation cTnT assay or one of various cTnI assays. In this study we aimed to explore differences in the investigation, treatment, diagnosis and inpatient clinical course for patients whose management included the use of highly sensitive versus other troponin assay results.

Methods

The SNAPSHOT ACS study was conducted from 14 to 27 May 2012 in Australia and New Zealand, and has previously been described in detail.7 Briefly, it was developed as a collaborative quality improvement initiative between the Cardiac Society of Australia and New Zealand, the Heart Foundation of Australia, the Australian Commission on Safety and Quality in Health Care, the George Institute for Global Health, and health networks or state governments across Australia. Hospital participation, study protocols, recruitment, data collection and ethics approvals have been previously published.7

Over the audit period, consecutive patients having a first admission with a suspected or confirmed ACS were included. Patients were classified by primary discharge diagnosis into one of five diagnostic categories: (i) ST-segment-elevation MI/left bundle branch block (STEMI/LBBB); (ii) non-STEMI (NSTEMI); (iii) unstable angina and ischaemic chest pain; (iv) unlikely ischaemic chest pain, and (v) other diagnosis.

Each site recorded the troponin assay being used (including the troponin — I or T), and the upper limit of its reference interval (clinical decision cut-point). The Roche hsTnT assay (Roche Elecsys Troponin T with the clinical decision cut-point of 14 ng/L) has improved precision and meets the guideline-acceptable criteria.5,6,8 At the time of the study this was the only assay with higher precision in use in the two countries, and we refer to it in this study as the hs (highly sensitive) assay. The analytical profile of all other assays could collectively be termed sensitive or contemporary assays which were grouped into a single category termed “sensitive” assays. Hospitals that reported using both troponin T and troponin I assays where the upper limit of the reference interval for the troponin T assay was consistent with the hs assay cut-point of 14 ng/L were classified as having the hs test available.

Patients were grouped according to the binary troponin assay classification (hs assay or sensitive assay) that was used at the enrolling hospital. Patients who were subsequently transferred were analysed according to the assay used at the enrolling institution.

A common case record form was used for collating patients’ characteristics, recommended therapies for ACS and inhospital events, and logistical details of patient transfers between hospitals, and hospital resources were obtained.7

Inhospital events of death, new or recurrent MI, stroke, cardiac arrest or worsening heart failure were predefined (Appendix 1). Formal adjudication of events was not possible, but 2%–5% of all case record forms were monitored for data accuracy and quality by coordinators across all jurisdictions. Irrespective of the assay type, in accordance with the universal definition of AMI,2 a change in troponin level was required to define the diagnosis of NSTEMI (Appendix 1).

Statistical analysis

We present patient characteristics, investigations, and therapies among patients surviving to hospital discharge, and inhospital events. These are tabulated as unadjusted descriptive statistics stratified by troponin assay type (hs or sensitive) in the entire patient population and among those with a final diagnosis of ACS.

As indicators of the time to care, we compared the time to angiography and the overall length of stay between hospitals performing hs assays and sensitive assays. Because these data were highly skewed, we present unadjusted comparisons only.

Two main methods were used to attempt to yield an unbiased estimate of major cardiac event risk by type of assay. One involved using propensity score matching (producing an analysis subset of 3106 successfully matched patients) and a generalised estimating equation (GEE) to evaluate the association between assay type and outcome, accommodating hospital-level clustering. Within this analysis, a propensity score of likelihood for having care provided by a hospital that had the hs assay available was developed; this included age, sex, diagnosis, Global Registry of Acute Coronary Events (GRACE) risk score, prior MI, prior coronary artery bypass grafting (CABG), atrial fibrillation, prior stroke, peripheral vascular disease, prior renal disease, prior cancer, prior dementia, need for assistance with activities of daily living, residence in a nursing home, and Australian Institute of Health and Welfare (AIHW) hospital classification. Patients from a hospital with hs assays available were matched to those in a hospital without hs assays within a ± 2% difference in propensity score, yielding a cohort of 3106 patients (1545 and 1559 patients in the hs and sensitive troponin assay groups, respectively).

The second method involved an inverse probability-weighted (IPW) model with regression-adjusted estimators to estimate the averages of the predicted outcomes among patients who were treated with and without the availability of an hs assay for troponin in all patients. In this model, clinical and hospital variables used to estimate the probability of troponin assay type included diagnostic classification, GRACE score, glomerular filtration rate < 60 mL/min/1.73 m2, a history of diabetes and prior MI alongside metropolitan location of the hospital, an onsite cardiac service and catheter laboratory, and AIHW hospital classification. The association between troponin assay type and outcome was then further adjusted for the clinical variables described above, although no clustering on enrolling hospital was possible in this model.

A P value of < 0.05 was considered statistically significant and, as this was an exploratory analysis, no adjustment was undertaken for multiple comparisons. Analyses were undertaken using Stata version 13 (Statacorp).

Results

A total of 4398 patients were enrolled in 286 hospitals; data on troponin assay type was available for 4371 patients from 283 hospitals. Of these 283 hospitals, 156 (55%) used an hs troponin assay (Appendix 2). Most patients presented to hospitals that used the hs assay, of which 46 (29%) were principal referral hospitals or hospitals in major cities, with 21 (13%) being private hospitals (Appendix 2). There was no difference in the likelihood of use of hs assays compared with sensitive assays in institutions where cardiac services, including primary percutaneous coronary intervention, (PCI) were possible.

The characteristics of patients presenting to hospitals according to the assay type used are shown in Appendix 3. Patient discharge diagnoses according to the type of assay used are shown in Box 1.

Box 2 shows the use of resources for patients tested with the two groups of assays. Patients who presented to a hospital using an hs assay underwent more non-invasive investigations (eg, exercise stress tests). However, there was no difference between hospitals using the two groups of assays in the rates of angiography, PCI or CABG. Higher rates of angiography and PCI were observed among patients with a final diagnosis of ACS, and these differences persisted within the propensity-matched models (odds ratio [OR] for angiography, 1.58; 95% CI, 1.16–2.14; P = 0.003, and OR for PCI, 1.32; 95% CI, 1.0–1.73; P = 0.043)

Inhospital treatment for the cohort diagnosed with ACS varied in terms of the medications prescribed. Significant differences in the use of guideline-recommended therapy4 were observed, specifically in treatment with angiotensin-converting enzyme inhibitors and β-blockers (Box 2).

Box 3 shows that 442 patients had inhospital major adverse cardiac events; this represented 9.1% of patients in hospitals using an hs assay and 11.7% of patients in hospitals using a sensitive assay (P = 0.005). Using the two approaches (GEE and IPW) to assessing the association between assay type and outcome showed a consistently lower rate of inhospital events, including recurrent heart failure, in patients where an hs assay was used. By the GEE approach, the use of an hs troponin assay was associated with an odds ratio of 0.75 (95% CI, 0.60–0.94; P = 0.014). Similarly, by the IPW analysis, we estimated an event rate of 11.2% in patients in hospitals using sensitive troponin assays, with an average effect of a 2.3% absolute reduction in these events in patients in hospitals using the hs assay (P = 0.018).

Exploring the factors potentially influencing differences in outcome, we observed a shorter median delay in time to angiography in hospitals where the hs assay was available (38 hours; interquartile range [IQR], 14–72 hours for the hs assay v 43 hours; IQR, 19–75 hours for the sensitive assay; P = 0.0136), but no difference in total length of stay (2.5 days; IQR, 1.1–4.8 days for the hs assay v 2.6 days; IQR, 1.1–4.9 days for the sensitive assay; P = 0.43).

Discussion

The SNAPSHOT ACS registry provides several important insights into the use of highly sensitive troponin assays in the care of patients with suspected ACS.

Patients with suspected ACS who were cared for in hospitals using the hs troponin assay had a lower proportion of NSTEMI and a higher proportion of non-cardiac chest pain as final diagnoses. This contrasts with research cohorts where re-adjudication of diagnoses of individual ED patients showed an increased rate of diagnosis of NSTEMI when more highly sensitive assays were used.3 This observation may be explained by our study including more patients with suspected ACS who eventually had an alternative diagnosis (eg, arrhythmia, heart failure and pulmonary disease). The SNAPSHOT registry found a lower proportion of patients diagnosed with unstable angina in sites that used the hs assay. As elevated troponin levels are required for a diagnosis of AMI,2 this finding is not surprising. However, this is the first time that the magnitude of effect of troponin assays on AMI diagnoses has been reported in an Australian and New Zealand population.

There was no pattern in the type of institution that had access to the hs assay despite the perception that large metropolitan hospitals and private facilities would have greater access to the newer assays. Patients tested with hs assays had higher rates of non-invasive investigations than those tested with the other assays. There was no difference between hospitals using the sensitive or hs assay in terms of having cardiac intensive care, echocardiography or PCI services onsite. Hospitals using the hs assay did not have higher rates of angiography or PCI, consistent with no increase in the proportion of patients with ACS as their final diagnosis. Therefore, use of the hs assay may well drive a higher rate of some investigations, including non-invasive tests.

A significant finding was that, for patients at hospitals using the hs assay, inhospital rates of major adverse cardiac events were lower. The most substantial difference was a lower rate of inhospital heart failure in institutions where hs assays were used. This was seen in the overall population and in the ACS cohort. A modest reduction in the delay to angiography without a reduction in the length of stay was observed among patients in hospitals using hs assays. However, the availability of high-sensitivity troponin testing may lead to a larger number of patients at lower risk of ACS, or without an eventual diagnosis of ACS, being admitted. Appropriately designed randomised clinical trials informed by high-quality ACS registries are needed to determine the true incremental value of high-sensitivity troponin testing.

A number of limitations of our study must be considered. Assays may have been misclassified in terms of troponin type (I or T) and the clinical cut-offs reported. Patients were grouped according to the assay used at the hospital they presented to, and we assumed all management was informed by these results. Further, troponin testing results were not available for patients transferred from or to non-participating centres.

In conclusion, the use of highly sensitive troponin assay results in managing patients admitted with suspected ACS is associated with an increase in non-ACS diagnoses with no increase in MI diagnoses. There was a lower rate of major inhospital events, predominantly heart failure, which may be attributable to the larger proportion of non-ACS diagnoses. There is an ongoing need to determine the incremental value of the widespread introduction of highly sensitive troponin assays into routine clinical practice.

1 Discharge diagnoses of 4371 consecutive patients having a first admission with a suspected or confirmed acute coronary syndrome grouped by the type of cardiac troponin assays in use at the hospital to which they presented

Final diagnosis

Sensitive assay

Highly sensitive assay

Total

P


STEMI/LBBB

156 (8.9%)

262 (10.0%)

418 (9.6%)

0.004

NSTEMI

434 (24.8%)

570 (21.7%)

1004 (23.0%)

Unstable angina/likely ischaemic

395 (22.6%)

530 (20.2%)

925 (21.2%)

Chest pain, unlikely cardiac

448 (25.6%)

742 (28.3%)

1190 (27.2%)

Other

314 (18.0%)

520 (19.8%)

834 (19.1%)

Total

1747 (100%)

2624 (100%)

4371 (100%)


STEMI = ST-segment elevation myocardial infarction. LBBB = left bundle branch block. NSTEMI = non-ST-segment elevation myocardial infarction.

2 Resources used for all 4371 patients* having a first admission with a suspected acute coronary syndrome (ACS) and those with (2347) and without (2024) ACS diagnoses according to the type of cardiac troponin assay used


ACS diagnosis


Non-ACS diagnosis


All patients


Investigations and treatments

Sensitive
assay

Highly sensitive assay

P

Sensitive
assay

Highly sensitive assay

P

Sensitive
assay

Highly sensitive assay

P


Tests


Exercise stress test

54 (5.5%)

116 (8.5%)

0.005

97 (12.7%)

259 (17.6%)

< 0.001

151 (8.6%)

375 (14.3%)

< 0.001

Echocardiography

318 (32.3%)

544 (39.9%)

< 0.001

146 (19.2%)

272 (21.6%)

0.198

464 (26.6%)

816 (31.3%)

0.001

Stress echocardiography

14 (1.4%)

25 (1.8%)

0.439

12 (1.6%)

54 (4.3%)

0.001

26 (1.5%)

79 (3.0%)

0.001

Stress nuclear scan

36 (3.7%)

29 (2.1%)

0.026

38 (5.0%)

45 (3.6%)

0.118

74 (4.2%)

74 (2.8%)

0.011

Computed tomography coronary angiogram

27 (2.7%)

63 (4.6%)

0.019

23 (3.0%)

50 (4.0%)

0.270

50 (2.9%)

113 (4.1%)

0.014

Angiogram

524 (53.2%)

802 (58.9%)

0.006

133 (17.5%)

155 (12.3%)

0.001

657 (37.6%)

957 (36.5%)

0.446

Procedures


Percutaneous coronary intervention

279 (28.3%)

452 (33.2%)

0.012

5 (0.6%)

3 (0.2%)

0.146

284 (16.3%)

455 (17.3%)

0.349

Coronary artery bypass graft

63 (6.4%)

93 (6.8%)

0.678

1 (0.1%)

4 (0.3%)

0.415

64 (3.7%)

97 (3.7%)

0.954

Inhospital therapy


Aspirin

914 (92.8%)

1273 (93.5%)

0.523

598 (78.5%)

858 (68.0%)

< 0.001

1512 (86.6%)

2131 (81.2%)

< 0.001

Intravenous heparin

319 (32.4%)

552 (40.5%)

< 0.001

52 (6.8%)

100 (7.9%)

0.363

371 (21.2%)

652 (24.9%)

0.006

Low-molecular-weight heparin

543 (55.1%)

685 (50.3%)

0.021

241 (31.6%)

281 (22.3%)

< 0.001

784 (44.9%)

966 (36.8%)

< 0.001

GP IIb/IIIa inhibitor

67 (6.8%)

123 (9.0%)

0.051

3 (0.4%)

1 (0.1%)

0.123

70 (4.0%)

124 (4.7%)

0.258

Discharge treatment


Aspirin

823 (86.6%)

1166 (87.6%)

0.493

423 (55.6%)

637 (50.5%)

0.028

1246 (72.9%)

1800 (69.8%)

0.028

Other antiplatelet therapy

585 (61.6%)

850 (63.9%)

0.266

128 (16.8%)

213 (16.9%)

0.963

713 (41.7%)

1061 (41.1%)

0.706

β-blocker

697 (73.4%)

928 (69.7%)

0.058

298 (39.1%)

442 (35.0%)

0.065

995 (58.2%)

1366 (53%)

0.001

ACEi or AR2B

674 (71.0%)

819 (61.5%)

< 0.001

351 (46.1%)

544 (43.1%)

0.194

1025 (60.0%)

1362 (52.8%)

< 0.001

Statin

789 (84.0%)

1088 (81.7%)

0.160

381 (50.0%)

604 (47.9%)

0.351

1179 (69.0%)

1689 (65.5%)

0.017

Inhospital cardiac rehabilitation

411 (43.3%)

545 (41.0%)

0.269

103 (13.5%)

110 (8.7%)

0.001

514 (30.1%)

654 (25.4%)

0.001

Outpatient cardiac rehabilitation

464 (48.8%)

591 (44.4%)

0.036

104 (13.7%)

109 (8.6%)

< 0.001

568 (33.2%)

699 (27.1%)

0.036


ACEi = angiotensin-converting enzyme inhibitor. AR2B = angiotensin-II receptor blocker. GP = glycoprotein.

* Sensitive assay, 1747; highly sensitive assay, 2624. † Values derived from univariate (unadjusted) analyses. ‡ Calculated among the 4288 patients (ACS diagnosis, 2281; non-ACS diagnosis, 2007) discharged alive.

3 Inhospital major adverse cardiac events, including death, myocardial infarction, cardiac arrest* in total, and new-onset heart failure stratified by the availability of highly sensitive and sensitive troponin assays (unadjusted [univariate] analysis)


Patients with an ACS diagnosis


All patients


Major adverse cardiac events

Sensitive assay

Highly sensitive assay

P

Sensitive assay

Highly sensitive assay

P


Died in hospital

35 (3.6%)

31 (2.3%)

0.065

38 (2.2%)

45 (1.7%)

0.275

MI/further MI after admission

31 (3.2%)

47 (3.5%)

0.686

33 (1.9%)

52 (2.0%)

0.828

Inhospital heart failure

113 (11.5%)

122 (9.0%)

0.045

140 (8.0%)

155 (5.9%)

0.007

Total

164 (16.7%)

187 (13.7%)

0.050

204 (11.7%)

238 (9.1%)

0.005


ACS = acute coronary syndrome. MI = myocardial infarction. * Included in the total.

The Australian medical response to Typhoon Haiyan

Our well equipped civilian professionals made a rapid and valuable contribution to internationally coordinated aid

On the morning of 8 November 2013, category 5 Typhoon Haiyan (known locally as Typhoon Yolanda) made first landfall over Eastern Samar province in the Philippines. Sustained, damaging winds of 235 km/h gusting to 275 km/h were accompanied by a tidal storm surge and subsequent inundation. The official number of fatalities stands at 6190, with 28 626 injuries attributed to the event, and over 16 million people affected.1

On 9 November, as reports indicated the scale of the disaster, the government of the Philippines officially requested international humanitarian assistance. Eastern Samar and Leyte provinces, including the major population centre of Tacloban (population 220 000) sustained catastrophic damage.

As part of a $40 million assistance package, the Australian Government deployed a field hospital and a fully self-sustaining civilian medical team with a mandate to assist the Philippines Department of Health in immediate postdisaster medical care. The first Australian medical assistance team (AUSMAT) of 37 medical, nursing, paramedical and logistics professionals deployed on 13 November with over 28 tonnes of equipment. They were relieved on 27 November by a second team of 37.

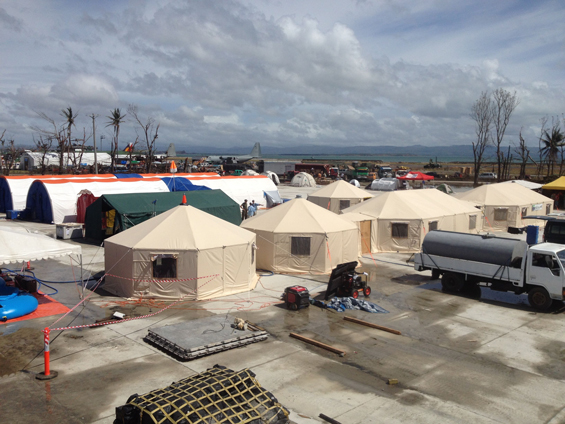
At the direction of the Philippines Department of Health, a field hospital with 35 inpatient beds, two operating tables, an outpatient clinic and a resuscitation room was deployed to Tacloban, the most critically affected population centre. Clinical activity commenced 7 days after Typhoon Haiyan made landfall — one of the fastest deployments of a foreign field hospital to a sudden-onset disaster.2 The field hospital was registered as a Type 2 facility under the new World Health Organization guidelines for foreign medical teams in sudden-onset disasters.3 This was the first occasion on which a host government was able to use the WHO guidelines to assess the contribution of foreign medical teams.

The AUSMAT field hospital rapidly became a critical adjunct to the overall medical response in Tacloban, providing surgical and trauma care while the major local referral centre gradually restored its own surgical services. The surgical casemix, reflecting the nature of the disaster, comprised a high proportion of traumatic injuries from high-velocity debris. As the deployment continued, individuals with minor to moderate injuries, but who had not yet sought medical care, presented with wound infections that were frequently exacerbated by intercurrent type 2 diabetes. Many of these patients had either been searching for lost family or attempting to rebuild their homes and livelihoods, but not attending to their own need for health care.

During a 23-day operational period, 238 surgical procedures were performed, of which 90 were considered major. A total of 2734 patients were seen. Based on average numbers of outpatients, this meant that, for the time it was operational, the AUSMAT field hospital was as busy as the Royal Darwin Hospital emergency department. In addition to surgical patients, our clinicians treated patients with a variety of acute and chronic medical conditions, ranging from respiratory tract infections and diarrhoeal illness through to uncontrolled hypertension.

Operation Philippines Assist marked two critical points in the evolution of Australia’s capacity to provide professional, emergent medical relief after sudden-onset disasters. It was the first occasion on which a clinical team comprising members from each state and territory was deployed (it also included an orthopaedic surgeon and logistician from the New Zealand Medical Assistance Team). This was also the AUSMAT field hospital’s first deployment overseas as part of an Australian response.

Historical perspective on AUSMAT

Previous responses funded by the Australian Government to regional natural disasters such as those in Aceh, Yogyakarta, Samoa and Christchurch were managed through the state-based disaster medical assistance teams model, with involvement of some multijurisdictional teams. Since 2010, the AUSMAT concept, derived from the global movement towards professional, trained medical disaster-relief teams, has become the national model for medical disaster response. AUSMAT training and deployment is primarily coordinated via the Darwin-based National Critical Care and Trauma Response Centre under the auspices of the Australian Government Department of Health. Each state and territory has a coordination focal point linking local health departments to the national team.

Since 2010, over 400 health professionals and medical logisticians have undergone specific and tailored training to deliver care in typical austere, resource-poor environments. The team member training course focuses on safety and security, cultural awareness, team dynamics in the field and familiarisation with equipment. Its centrepiece is a high-fidelity 36-hour simulated deployment to a fictitious nation where each key competency is tested in field conditions. Specific courses for surgeons and anaesthetists, team leaders and medical logisticians have also been developed.

AUSMAT also has a nationally agreed set of standards governing all aspects of deployment including vaccination and predeparture health checks, in-country codes of conduct and postdeployment psychological debriefing. These standards, documented in the national AUSMAT manual,4 have been endorsed by the Australian Health Protection Principal Committee and ensure that the Australian Government maintains a consistent and predictable medical response to regional disasters.

The need for standards in disaster response

Sudden-onset disasters attract a wide variety of responders, from clinicians trained specifically in humanitarian and disaster response to well meaning but untrained individuals or teams. As seen over a number of natural disasters in the 20th and 21st centuries, significant harm to a disaster-affected population can be caused by foreign medical teams who are either untrained in disaster medicine or poorly resourced and not self-sufficient.5

Analysis of responses to the 2010 Haiti earthquake provided clear evidence of the effects of underprepared and underresourced teams. A review of the surgical response in Haiti found that amputation rates varied considerably between foreign surgical teams, from 1% of surgical procedures to over 45%. The lowest rates occurred among specialised orthoplastic teams experienced in limb salvage.6

One account of a trauma team’s experience in Haiti documents the rapid overwhelming of the team by the scale of the disaster, forcing them to self-evacuate. The authors suggest that individual and institutional medical responders partner with experienced disaster-relief organisations to “facilitate the personnel from the more developed countries to learn how to live and work under unfamiliar austere circumstances”.7

Typhoon Haiyan was a typical natural disaster in that it attracted responders with varied training and differing levels of self-sufficiency, ranging from skilled government teams from Australia, Japan, Korea and Belgium, and well known non-government organisations (NGOs) such as the International Committee of the Red Cross and Médecins Sans Frontières, through to individuals who were essentially “disaster tourists”. In between were many small NGOs and philanthropic organisations. Frequently, the AUSMAT team was asked to supply medications or other supplies to teams that had arrived in the country inadequately equipped to provide effective care. Typically, these teams were not participants in the WHO and Philippines Department of Health global health cluster coordination process.

An extensive body of literature points to the key competencies required by medical disaster responders. Clinical medicine, public health and disaster incident management are the core disciplines practised by disaster health professionals.8

Similarly, the AUSMAT concept is firmly rooted in the philosophy that disaster health professionals must have key clinical and humanitarian competencies. First, they must be registered to practise in their stated profession. Too often, clinicians, under the pretext of saving lives at all costs, extend themselves far beyond their scope of practice without following the fundamental principle of medical practice — first do no harm.

Second, health professionals must be able to perform their clinical specialty in a disaster context. It is outdated practice to pluck individuals from their clinical practice in developed-world tertiary hospitals and deposit them in a disaster zone, expecting them to be able to function in austere circumstances with limited resources. Not only does poor patient care result, but it may cause psychological and professional distress for the clinician. Fortunately, in Australia, the clinical experience of many doctors and nurses in rural and remote settings means they are ideally suited to the demands of practice in an austere environment.

Finally, to appreciate the context in which they work, health professionals must have a set of core humanitarian competencies. These range from an understanding of international humanitarian norms through to self-management skills in the field and an ability to operate safely and securely in difficult circumstances.

AUSMAT’s efficient and timely deployment to Tacloban demonstrated the importance of preparedness and consistency. A repository of well trained and prepared clinicians and support staff with a suite of appropriate skills meant an effective response could be mounted. While training is obviously required for preparedness, the importance of an agreed consistency in disaster training is less obvious. The AUSMAT response to Typhoon Haiyan showed well the advantages of both.

The need for qualified and capable medical professionals to be deployed to assist disaster-affected populations will continue into the future. It is the responsibility of organisations rendering assistance to ensure that personnel are trained in the nuances of humanitarian and disaster medicine and to adhere to the new international standards for deployment of foreign medical teams.


The devastation of Tacloban in the wake of Typhoon Haiyan was mirrored across the Philippine provinces of Leyte and Eastern Samar


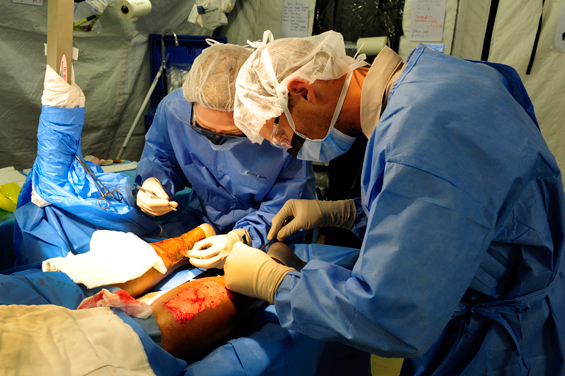
Surgeons Vaughan Poutawera (New Zealand) and Cea-Cea Moller (South Australia) complete a skin graft for a diabetic patient with typhoon-related injuries


The Australian field hospital in Tacloban, with outpatient tents in the foreground and wards and operating theatre behind (blue-and-white tents)

Survey of alcohol-related presentations to Australasian emergency departments

Alcohol consumption in excess of that recommended in the National Health and Medical Research Council (NHMRC) alcohol guidelines1 is the norm in Australia.2 One in five Australians and New Zealanders drink at a level that increases their lifetime risk of alcohol-related disease or injury.3,4 Almost half of Australians aged over 18 years (44.7%) reported consuming an amount of alcohol on a single occasion in the preceding year that put them at an increased risk of acute injury.3

Emergency physicians are at the forefront of responding to and treating the consequences of alcohol-related harm. This ranges from treating alcohol intoxication and severe injuries sustained as a direct result of intoxication, to managing the acute complications of chronic alcohol-related conditions. While emergency departments (EDs) anecdotally see a high proportion of patients with alcohol-related injuries and conditions, there are very few national or state and territory prevalence data.

At present, it is not mandatory for Australian or New Zealand EDs to screen for or collect alcohol-related presentation data. Consequently, attempts to quantify alcohol-related presentations to EDs through existing datasets are likely to provide underestimates.

The literature to date has focused largely on alcohol screening and intervention strategies, and on patients with alcohol-related injuries presenting to EDs. Australasian studies have investigated the association between injuries and alcohol consumption in EDs and found that 17%–35% of total injury presentations to EDs involved alcohol consumption.58

Several small-scale prospective studies have attempted to quantify all alcohol-related presentations at a single site or local level.9,11 They found rates of alcohol-related harm ranging from 5% to 9% of all ED presentations. There have also been some site-specific studies of the impact of alcohol-related presentations on the ED workforce.12,13 Previous attempts to quantify harm on a regional level have been limited by having to rely on retrospective data and the use of diagnostic codes. These studies are likely to underestimate the true prevalence of alcohol-related presentations. For example, a Western Australian study found that alcohol-related attendances to metropolitan EDs during 2002–2006 represented around 0.8% of all ED attendances.14

This study is the first large-scale, binational point prevalence study of alcohol harm in EDs to be carried out in Australia and New Zealand. The data will be used to establish the scale of alcohol-related presentations to EDs. It will provide a benchmark for further surveys, and enable informed community debate on this important public health issue.

Methods

We conducted a survey-based point prevalence study of EDs in Australia and New Zealand using a validated point prevalence “snapshot” method previously used to study access block.15 All EDs in Australia and New Zealand accredited by the Australasian College for Emergency Medicine (ACEM) for specialty training and non-accredited EDs that are part of the Emergency Medicine Education and Training (EMET) teaching network were included. Paediatric-only EDs were excluded from our analysis because alcohol-related presentations are rare among children. A survey instrument consisting of eight questions (Box 1) was developed and piloted by a reference group of emergency physicians and researchers.

Participating EDs were asked to nominate a site coordinator and provide a telephone number for the night of the survey. Each site coordinator was emailed the survey instrument and the list of definitions of alcohol-related presentations (Box 2). Site coordinators were asked to educate all staff rostered on at the time of the survey.

The clinical definition of alcohol-related presentations (Box 2) was developed by the reference group using a consensus approach. International statistical classification of diseases and related health problems, 10th revision (ICD-10) codes for alcohol intoxication were used.16 Broadly, the definition included presentations that were directly or indirectly related to alcohol consumption, as judged by the senior doctor in the ED at the time of the survey. Direct presentations were divided into injuries (intentional and unintentional), intoxication and medical conditions related to alcohol use. Indirect presentations were for intentional or unintentional injuries caused by a third party who was affected by alcohol. This definition was used as a guide for data collectors only. Individual types of alcohol harm were not recorded as this would have increased complexity and possibly reduced the response rate.

The survey was conducted at 02:00 local time, on Saturday 14 December 2013. The time and date was chosen by the researchers as being feasible for ED clinicians to complete the survey. The site coordinators received a reminder email the day before, and a short message service text message at 01:30 on the survey date. Data could be returned by fax, email or telephone. Where data were not returned by 02:10 local time, sites were contacted by telephone and further follow-up was undertaken in order to maximise response rates.

The Australian Capital Territory Health Department (ACT Health) Human Research and Ethics Committee’s Low Risk Sub-Committee approved this study, and site-specific governance approval was obtained. The primary outcome was the proportion of alcohol-related presentations in each ED at that point in time. For analysis, EDs were stratified by role delineation and by state and country. To maintain confidentiality and statistical meaning, we report aggregate data only. Data analysis was by descriptive statistics. Comparisons were undertaken using χ2 and t tests, as appropriate.

Results

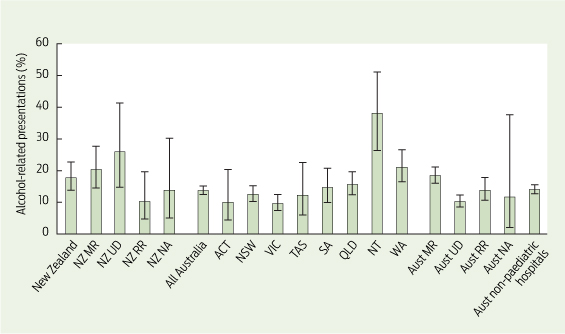
All 126 ACEM-accredited hospitals in Australia and New Zealand were invited to participate. Seven of these (mostly paediatric and private hospitals) declined. A further nine non-accredited hospitals also agreed to submit data. At the time of the survey, a further two hospitals declined, and 22 did not provide data, as shown in Box 3. The 106 responding hospitals identified 2766 patients in EDs at 02:00, of whom 395 (14.3%; 95% CI, 13.0%–15.6%) had presented because of alcohol consumption. This is an average number of patients per ED of 3.8 in Australia and 4.0 in New Zealand (Box 4). The overall differences between Australia and New Zealand were only of borderline significance, with overlapping 95% CIs (P = 0.05). Breakdown of rates by jurisdiction and role delineation are shown in Box 5.

The distribution of alcohol-related presentations among hospitals was skewed toward the left, with a range from zero (one New Zealand hospital, eight non-paediatric Australian hospitals) to 15 (one Australian hospital) and a median of two, with proportions ranging from 0 to 50% and a median of 12.5%. In total, one New Zealand hospital and nine Australian hospitals (representing five states and territories) reported their prevalence of alcohol-related presentations to be more than a third of patients in the ED.

Discussion

In this study, we quantified the point prevalence of patients with alcohol-related harm presenting to EDs on a binational scale. The study is representative of adult hospitals with an ED in Australia and New Zealand, having achieved an excellent geographic and role-related response rate. Our finding that one in seven patients in EDs in Australia and one in six in New Zealand present for reasons related to alcohol consumption indicates that previous research has underestimated the amount of alcohol-related harm presenting to Australasian EDs. It is notable that the prevalence was higher in Western Australia and much higher in the Northern Territory than in New South Wales and Victoria. Similarly, the much higher prevalence in major referral compared with urban district hospitals in Australia was expected, although it is of interest that this pattern was not repeated in New Zealand. Almost all EDs responding to this survey (91% in Australia and 93% in New Zealand) had at least one, and in some cases up to 15, alcohol-related presentations at the time of the data collection. This shows that alcohol-related harms are widespread and not just confined to metropolitan “hot-spots”.

In the absence of national datasets in Australia or New Zealand on alcohol-related presentations to EDs, our point prevalence study provides important evidence on the extent of the impact of alcohol misuse and the resultant impact on the acute health care sector.

Our study has several potential limitations. It represents a single point in time and, while providing an estimate of point prevalence, incidence cannot be estimated. The prevalence is likely to change over the time of day, day of the week and perhaps seasonally. We performed the survey in the pre-Christmas period, and this may have resulted in a higher proportion of alcohol-related presentations than might occur at other times of the year. Collecting more precise prevalence data would further clarify the extent of presentations of patients with alcohol-related harms to EDs, and inform preventive strategies and interventions.16 We therefore intend to undertake further research, including a 7-day prevalence study.

Non-responder bias may have resulted in EDs with differing rates of presentation of patients with alcohol-related harm not completing the survey. EDs with a low census of alcohol-related presentations may have been less motivated to respond compared with those with a high census. While our definition of “alcohol-related” was based on ICD-10 codes, there is no internationally validated definition. This may have resulted in an underestimate of alcohol-related harm.

Measurement errors related to the definition of alcohol-related harm may have occurred. Ascertainment bias may have occurred with patients who appeared intoxicated being assumed to be intoxicated with alcohol, whereas their symptoms may instead have been caused primarily by other drugs. While our definition did include indirect alcohol-related harm, it is likely that the data collection method would underestimate the true prevalence of indirect harm. Despite our use of site coordinators to train responding staff, the study design meant that most data were collected by busy clinical staff. Further standardisation of the measurement and recording of alcohol-related presentations that can be implemented in the context of busy EDs17 would assist, but would need to be resourced.

Our study happened to coincide with Operation Unite,18 a proactive binational policing initiative targeting alcohol-related antisocial behaviour in precincts across Australia and New Zealand, and heightening community awareness of the issue of excessive alcohol consumption. We acknowledge the potential confounding effects of this policing and public awareness campaign on our point prevalence data, but cannot determine their extent.

Not enough is yet known about the impact of alcohol-related presentations on ED resources. While we didn’t specifically address this in our study, it is reasonable to extrapolate from our point prevalence data. Alcohol-related assaults on ED staff are common and appear to be increasing in frequency.12 Dealing with aggressive, intoxicated patients is resource-intensive and distressing for staff. It is likely that this will have a negative impact on the care of other patients in the ED, especially in a setting where one in three patient presentations are alcohol-related. This form of “innocent bystander” alcohol-related harm has not been quantified.

The contemporary discourse and policy response to alcohol misuse in the Australasian community emphasises law enforcement and regulatory initiatives. Our study draws attention to the important reality that alcohol misuse also has a significant impact on the health care system, as reflected in the very high prevalence of alcohol-related presentations in some EDs. As alcohol-related harm is an entirely preventable condition, and when hospitals in multiple jurisdictions report more than a third of their ED workload is due to this single cause, we contend that this represents a strong case for preventive public health interventions as a key component of a broad policy response to this issue.

Evidence-based alcohol policies, along with effective strategies and interventions to reduce alcohol-related harm, are now more available than ever before.19 These should inform national solutions to the widespread alcohol misuse and harms afflicting local communities across Australia and New Zealand, along with addressing current societal attitudes towards excessive drinking.

1 The eight questions in the survey instrument

1. Name of hospital?

2. Exact time data were collected?

3. Total number of patients waiting to be seen?

4. Number of patients with alcohol-related presentations* waiting to be seen?

5. Total number of patients currently being seen?

6. Number of patients with alcohol-related presentations* currently being seen?

7. If applicable, number of patients in the observation unit or short stay unit?

8. If applicable, number of patients with alcohol-related presentations* in the observation unit or short stay unit?


* Clinically intoxicated or presentation related to alcohol.

2 Definition of alcohol-related presentations

Direct presentations

1. Injuries

a. Unintentional injuries, including road traffic injuries, drowning, burns, poisoning and falls

b. Intentional injuries, which result from deliberate acts of violence against oneself or others

2. Intoxication

a. Alcohol involvement (blood alcohol concentration) as determined by breathalyser

b. Clinical intoxication: reasonable suspicion of any caring health professional (includes triage nurse if not yet seen by a doctor) that a patient is affected by recent alcohol consumption

c. Intoxication, but unrelated to clinical presentation

3. Medical condition as the result of the harmful use of alcohol

  • G31.2 Degeneration of nervous system due to alcohol
  • G62.1 Alcoholic polyneuropathy
  • G72.2 Myopathy due to other toxic agents
  • I42.6 Alcoholic cardiomyopathy
  • K29.2 Alcoholic gastritis
  • K70 Alcoholic liver disease
  • F10.3 Alcohol withdrawal state
  • F10.2 Alcohol dependence syndrome
  • Other medical conditions that the treating physician believes are attributable to or exacerbated by alcohol (eg, Wernicke’s encephalopathy, Korsakoff’s dementia, cirrhosis, alcoholic hepatitis, hepatic encephalopathy, Barrett’s oesophagus/Mallory–Weiss syndrome/peptic ulcer/chronic diarrhoea, infection)

4. Mental health

a. Mental health presentations due to alcohol intoxication

b. Mental health presentations due to harmful use of alcohol

c. Overdose involving alcohol alone or as co-ingestant

5. Social problems

a. Z72.1 Problems of lifestyle: alcohol use

Indirect presentations

1. Injuries

a. Intentional or unintentional injuries caused by a third party affected by alcohol

3 Participating hospitals and response rates by jurisdiction

Jurisdiction

Potential hospitals

Participating
hospitals

Response rate


ACT

2

2

100%

NSW

40

30

75%

Vic

27

21

78%

Tas

4

4

100%

SA

8

7

88%

Qld

22

16

73%

NT

2

2

100%

WA

11

10

90%

All Australia

116

92

79%

New Zealand

19

14

74%


ACT = Australian Capital Territory. NSW = New South Wales. NT = Northern Territory. Qld = Queensland. SA = South Australia. Tas = Tasmania. Vic = Victoria. WA = Western Australia.

4 Prevalence of alcohol-related presentations at a single point in time in Australian and New Zealand emergency departments (EDs), by status

Status

Australia


New Zealand


Total

No. alcohol-related
(%; 95% CI)

Total

No. alcohol-related
(%; 95% CI)


Waiting to be treated

571

95
(16.6%; 13.7%–20.0%)

86

24
(27.9%; 19.0%–38.8%)

Being treated

1425

194
(13.6%; 11.9%, 15.5%)

163

25
(15.3%; 10.4%–22.0%)

Being observed*

458

50
(10.9%; 8.3%–14.2%)

63

7
(11.1%; 5.0%–22.2%)

Total number in all EDs

2454

339
(13.8%; 12.5%–15.2%)

312

56
(17.9%; 13.9%–22.8%)


* The number being observed is based on a smaller sample as three New Zealand hospitals and 28 Australian hospitals reported not having observation units.

5 Prevalence of alcohol-related presentations as a proportion of all patients in Australian and New Zealand emergency departments


MR = major referral. NA = not accredited. RR = regional referral. UD = urban district.
Abbreviations correspond to Australasian College for Emergency Medicine role delineation.

“After-hours” staffing of trauma centres and outcomes among patients presenting with acute traumatic coagulopathy

Deficiencies in trauma care “after hours” (18:00–07:00) have been well recognised.1 Such deficiencies may be caused by the differential availability of senior staff and resources for complex procedures, fatigue of personnel and/or increased prehospital logistical difficulties (eg, flight restrictions for helicopters at night). Resource allocation and staffing are substantially more expensive after hours, and a finding of an association between time of presentation and outcomes could be used to justify improved staffing in trauma centres outside “business” hours.

Compared with patients admitted “in hours”, patients admitted after hours following injury may be intrinsically at higher risk of death by virtue of a different casemix or increased severity of illness. Crude mortality rates have been previously reported to be significantly higher among people admitted with trauma at night, compared with during the day, but no significant association has been shown after adjusting for injury severity.25

In recent years, mortality after trauma has been steadily decreasing, secondary to preventive strategies and improved trauma systems.68 Accordingly, in advanced trauma systems, a smaller proportion of inhospital trauma deaths are now preventable. Potential changes to trauma care that could influence mortality therefore affect only a small proportion of the overall trauma population.

Among the overall population of an advanced trauma system, where most deaths are not preventable, the adverse effect of an after-hours model of care may therefore be underestimated. We hypothesise that the effect of any differences in trauma care could be emphasised if patient populations at higher risk of adverse outcomes are analysed.

Patients presenting to the emergency department with acute traumatic coagulopathy (ATC) are at high risk of adverse outcome.911 Mortality measured at hospital discharge remains high, with most deaths occurring in the first 24 hours.12,13 Delayed or suboptimal resuscitation may result in rapid progression of patients to the “triad of death”, with worse outcomes.14 Therefore, we chose to examine mortality in this clearly defined group of patients with complex injuries, and to examine the effect of the after-hours model of trauma care among them.

Methods

The state of Victoria, Australia, has one paediatric and two adult major trauma services located in metropolitan Melbourne. Major trauma triage guidelines direct about 85% of major trauma patients to a major trauma service for definitive treatment. The Alfred Trauma Registry prospectively records prehospital and hospital data on all major trauma patients, defined as those having an Injury Severity Score greater than 15, requiring urgent surgery or intensive care unit admission, or dying in hospital.

After hours was defined as the period between 18:00 and 07:00, 7 days a week. In the after-hours period, the following specialties were off-site, but on call: emergency physician (02:00–07:00), trauma surgeon (18:00–07:00), intensive care physician (23:00–08:00), haematologist (17:00–07:00) and radiologist (19:00–07:00). The number and seniority of nursing staff in the emergency department and intensive care unit in hours and after hours were similar, but extra staff on administrative duties were present during the day and available to be called on for clinical duties. Nursing staff levels in the operating theatre suite decreased at 18:00, and further at 21:00, to levels facilitating only urgent surgery until 24:00; staff were available on call to open extra theatre capacity, as needed, but with a short delay. The number of laboratory scientists in the haematology laboratory decreased at 17:00 and again at 22:00 until 07:00; again, with potential for recall.

Patients and definitions

All patients with ATC presenting between 1 January 2006 and 31 December 2011 were included. ATC was defined as an international normalised ratio (INR) greater than 1.5 on the first sample of blood taken after presentation to hospital.11,15,16 Patients receiving anticoagulation treatment were included. A massive transfusion was defined as ≥ 5 units of red cells in the first 4 hours after injury.17 Patients who received blood or blood products before presentation were excluded. The shock index was defined as heart rate divided by systolic blood pressure, and the first measured value on presentation was used.18 Mortality, as recorded at hospital discharge, was the primary outcome measure.

This study was approved by the Alfred Hospital Research and Ethics Committee.

Statistical analysis

Normally distributed continuous variables are presented as mean (standard deviation), while ordinal or skewed data are presented as median (interquartile range). The Student t test was used to calculate statistical significance between two means, the Wilcoxon rank-sum test was used for difference between two medians and the χ2 test was used for difference between two proportions.

Results from univariate analyses are reported as unadjusted odds ratios (ORs) with 95% confidence intervals. Variables exhibiting an association (P < 0.25) with the exposure of interest (after hours) and the primary outcome (mortality) were entered into a multivariable logistic regression model to determine the effect of confounders on the association between after-hours presentation and death.19 Significance for trends in mortality rates was determined using a Wilcoxon-type test for trend across ordered groups and is reported using z scores.20 Results from the multivariable regression model are reported as adjusted ORs with 95% confidence intervals. All analyses were performed using Stata, version 11.0 (Statacorp).

Results

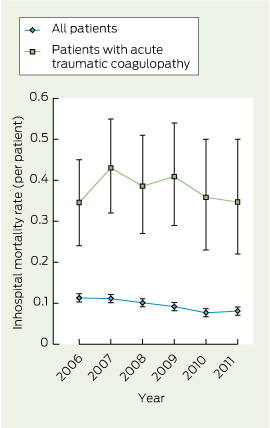
During the study period, there were 5915 major trauma presentations, of which 3147 patients (53.2%) presented after hours. Among all major trauma presentations, inhospital mortality among patients presenting after hours was 9.1% compared with a mortality of 10.1% among patients presenting at other times (P = 0.18). There were 398 patients (6.7%) who presented with ATC. Among all major trauma presentations, there was a significant trend in reduction of mortality over time (z score, − 3.44; P = 0.01), but the trend in mortality rates among patients with ATC was not statistically significant (z score, − 0.40; P = 0.69). Overall inhospital mortality rates are shown in Box 1.

A summary of demographics, vital signs at presentation and injury characteristics of patients with ATC is shown in Box 2. Of the patients with ATC, 197 presented after hours, 85 (43.1%) of whom died in hospital; and 201 presented in hours, with 67 deaths (33.3%). After-hours presentation was associated with significantly higher mortality (OR, 1.51; 95% CI, 1.01–2.28).

A comparison of patients presenting in hours and after hours is shown in Box 3, showing similarly matched groups except for age (P < 0.01) and initial base deficit (P = 0.01). Variables exhibiting an association between time of presentation and outcome (age, Glasgow Coma Scale [GCS] score, urgent surgery or embolisation and initial base deficit) were entered into a logistic regression model. An independent association between presentation to hospital after hours and significantly higher mortality was observed (adjusted OR, 1.77; 95% CI, 1.10–2.87). Age (adjusted OR, 1.03; 95% CI, 1.02–1.04) and presenting GCS score (adjusted OR, 0.80; 95% CI, 0.77–0.85) were also independently associated with mortality. There was no association between requirement for urgent surgery or embolisation (adjusted OR, 1.08; 95% CI, 0.64–1.84) or initial base deficit (adjusted OR, 0.97; 95% CI, 0.94–1.01).

After repeating the analysis by including INR categorised into limits, as reported in Box 3, after-hours presentation continued to be associated with higher mortality (adjusted OR, 1.74; 95% CI, 1.07–2.83), along with age (adjusted OR, 1.03; 95% CI, 1.02–1.04), presenting GCS score (adjusted OR, 0.80; 95% CI, 0.76–0.85) and INR ≥ 3.0 (adjusted OR, 2.05; 95% CI, 1.03–4.11).

Among patients requiring urgent surgery or embolisation, mean time to theatre or radiology in hours was 3.9 (SD, 3.5), and was not significantly different to the time for patients who underwent urgent surgery or embolisation after hours (mean, 3.7 [SD, 3.7]; P = 0.73). Among patients who received a massive transfusion, the mean ratio of red blood cells to fresh frozen plasma administered in 4 hours was 0.54 (SD, 0.31) after hours and not significantly different to the mean ratio of 0.55 (SD, 0.28) in hours (P = 0.85). Cryoprecipitate was administered to 0.5% of patients after hours, compared with 1.5% in hours (P = 0.32).

Discussion

This study of 398 major trauma patients with ATC shows that a high proportion of such patients present to hospital after hours, when immediately available senior specialist expertise is substantially less. Compared with patients who present in hours, these patients were shown to have significantly higher odds of death when injury severity and demographics were adjusted for. Some aspects of management, such as blood product administration and time to access the operating theatre or radiology services, were similar between the groups.

In major trauma centres, equipment and tangible resource availability remains the same regardless of time of day. However, staffing levels vary, and there has been substantial debate about the importance of fully staffed trauma centres at all hours — including emergency physicians, trauma surgeons, anaesthetists, intensive care physicians, radiologists and broader support staff.2,2124 Despite controversy, most major trauma centres in the United States have developed a uniform 24-hour model of staffing, which is perceived as the ideal model of care.25 Analyses of the effect of after-hours presentations from these centres have the limitations of examining for a small effect in the overall population with a small event rate. A statistically significant effect of after-hours presentation on mortality has not been found in previous studies in fully staffed trauma systems.25 However, studying subgroups of trauma patients at high risk of preventable death is more likely to demonstrate an after-hours effect. A recent multivariable regression analysis of 191 patients with pelvic fractures and haemorrhage requiring angioembolisation at a large US trauma centre showed an almost 100% increase in mortality for patients treated after hours.26

The subgroup of patients with ATC differs from those with critical bleeding or those requiring massive transfusion.27 Among patients presenting with ATC, a substantial proportion of deaths will be unpreventable. In the remaining patients, haemostatic resuscitation and damage control surgery, if applicable, need to be optimised to achieve a favourable outcome. Rather than delivery of protocols, factors such as consistent levels of timely, coordinated care may be lacking after hours, and such details are beyond the scope of currently measured trauma quality indicators. However, if a demonstrated absolute difference of 10% improvement in outcomes could be achieved, this would equate to at least three lives saved per year, per trauma centre. Improved after-hours staffing could also be beneficial to other complex subgroups with high mortality rates, such as those presenting after traumatic cardiac arrest or those requiring massive blood transfusions.28,29 Equally, more senior clinical decision-making capacity on-site would support other key aspects of hospital performance and management of clinical risk.

The challenge for health policymakers is therefore to determine the cost-effectiveness of improved staffing in major trauma centres. Affecting a higher proportion of younger patients, the years of potential life lost because of injury far exceed those of cancer, heart disease, or stroke. Any such change should be accompanied by thorough vigilance to monitor its effect on staff fatigue and potential loss in popularity of critical care specialties. Such adverse effects, if observed, should be weighed against any benefits. In addition, to optimise outcomes, after-hours resources should be enhanced throughout the patients’ journeys, from prehospital to the wards or intensive care unit, and not just sporadically in isolated departments.

This study included all patients who presented with ATC to a level 1 adult trauma centre, but is limited in being a retrospective study from a single centre. However, it is worth noting that the after-hours effect size was of substantial magnitude, and higher when adjusted for age, injury severity, GCS score and base deficit. Several confounders were accounted for, but we may have inadequately controlled for casemix or injury severity. Similarly, variables measuring detailed patient management, for example, volumes of fluid and times, ventilator strategies and surgical techniques, were not measured, and are potential confounders. The Trauma and Injury Severity Score30 method of severity adjustment was not used, as a large proportion of values for respiratory rates were missing or artificial due to the high frequency of intubated patients. The Injury Severity Score and shock index were used, both of which have been previously validated for use after trauma.31

There may be other differences among in-hours trauma patients compared with after-hours, including higher drug and alcohol use or mechanism of injury. Wide variations in the definition of ATC have been previously highlighted,11,32 and it should be noted that repeating this analysis using definitions of lower specificity may dilute the sample with less severely injured patients, limiting validity. Finally, our centre is serviced by a mature prehospital system and is a busy level 1 trauma centre, receiving more than 1200 major trauma patients per year, most of whom are injured by blunt trauma. These results may not be applicable to smaller centres or those with different patient demographics.

Our findings suggest that difference in outcomes observed among patients who presented after-hours was not associated with particular routine processes or timely access to interventions. This generates the hypothesis that such differences could be associated with access to effective coordination by senior decisionmakers during complex resuscitations. Our findings may be applicable to other specialties, and further research is required focused on patients at high risk of adverse outcomes. The decision to prepare for time-critical conditions at all times of day requires quality of outcomes be balanced against the high cost of such care. The feasibility and effectiveness of such change is yet to be determined.

1 Overall annual inhospital mortality rates (95% confidence intervals) among patients presenting after major trauma, Alfred Trauma Registry, January 2006 to December 2011

2 Characteristics of patients with acute traumatic coagulopathy, Alfred Trauma Registry, January 2006 to December 2011, and univariate associations with mortality at hospital discharge

Variable

Summary

OR (95% CI) of death

P


Age in years, mean (SD)

51.8 (24.8)

1.01 (0.99–1.02)

0.15

Men, no. (%)

280 (70.4%)

1.00 (0.64–1.56)

0.99

Penetrating mechanism, no. (%)

20 (5.0%)

2.55 (1.01–6.39)

0.05

ISS, median (IQR)

34 (25–48)

1.02 (1.01–1.04)

< 0.01

GCS score, median (IQR)

3 (3–14)

0.85 (0.81–0.88)

< 0.01

GCS score < 9, no. (%)

218 (54.8%)

5.87 (3.61–9.54)

< 0.01

Shock index in beats per min/mmHg, mean (SD)

1.87 (4.11)

1.04 (0.99–1.09)

0.11

Shock index ≥ 1, no. (%)

165 (41.5%)

1.38 (0.91–2.09)

0.12

Positive FAST, no. (%)

120 (30.1%)

0.67 (0.42–1.05)

0.97

Haemoglobin in g/L, mean (SD)

106.8 (26.9)

0.99 (0.98–1.01)

0.09

INR, mean (SD)

2.4 (1.0)

1.49 (1.21–1.84)

< 0.01

INR category, no. (%)

> 1.5–2.0

198 (49.7%)

> 2.0–2.5

94 (23.6%)

1.2 (0.7–2.0)

0.52

> 2.5–3.0

44 (11.1%)

1.4 (0.7–2.8)

0.28

> 3.0

62 (15.6%)

2.9 (1.6–5.2)

< 0.01

Base deficit in mEq/L, mean (SD)

− 5.8 (7.0)

0.95 (0.92–0.97)

< 0.01

Urgent surgery or angiogram, no. (%)

222 (55.8%)

1.69 (1.12–2.56)

0.01

Red cell units in 4 hours, median (IQR)

0 (0–6)

0.99 (0.97–1.01)

0.28

Massive transfusion, no. (%)

113 (28.4%)

0.99 (0.63–1.55)

0.97

After-hours presentation

197 (49.5%)

1.51 (1.01–2.28)

0.04


FAST = focused assessment with sonography in trauma. GCS = Glasgow Coma Scale. INR = international normalised ratio. IQR = interquartile range. ISS = Injury Severity Score. OR = odds ratio.

3 Association of variables with time of presentation among patients with acute traumatic coagulopathy, Alfred Trauma Registry, January 2006 to December 2011

Variable

In hours (n = 201)

After hours (n = 197)

P


Age in years, mean (SD)

55.8 (23.5)

47.8 (25.4)

< 0.01

Men, no. (%)

137 (68.2%)

143 (72.6%)

0.33

Penetrating mechanism, no. (%)

10 (5.0%)

10 (5.1%)

0.96

Blunt mechanism, no. (%)

191 (95.0%)

187 (94.9%)

0.86

ISS, median (IQR)

34 (25–43)

34 (25–50)

0.52

GCS score,* median (IQR)

8 (3–15)

3 (3–15)

0.19

GCS score < 9,* no. (%)

113 (58.9%)

105 (53.6%)

0.29

Shock index* in beats per min/mmHg, mean (SD)

1.79 (4.0)

1.95 (4.24)

0.70

Shock index ≥ 1,* no. (%)

79 (39.7%)

86 (44.3%)

0.35

Positive FAST, no. (%)

56 (27.9%)

64 (32.5%)

0.31

Haemoglobin in g/L, mean (SD)

106.3 (26.1)

107.3 (27.7)

0.70

INR, mean (SD)

2.4 (1.0)

2.4 (1.1)

0.52

Base deficit in mEq/L, mean (SD)

− 4.9 (5.9)

− 6.7 (7.8)

0.01

Urgent surgery or embolisation, no. (%)

104 (51.7%)

118 (59.9%)

0.11

Massive transfusion, no. (%)

65 (32.3%)

48 (24.4%)

0.08

Red cell units in 4 hours, median (IQR)

0 (0–8)

0 (0–4)

0.06


* Data are missing for this category. FAST = focused assessment with sonography in trauma. GCS = Glasgow Coma Scale. INR = international normalised ratio. IQR = interquartile range. ISS = Injury Severity Score.

Rapid response systems

Rapid response systems (RRSs) have become a routine part of the way patients are managed in general wards of acute care hospitals (Box 1).1 They are used in most hospitals in Australasia, North America and the United Kingdom and are increasingly being used in other parts of the world. They operate across the whole hospital and aim for early identification of seriously ill patients, at-risk patients and patients whose condition is deteriorating, using abnormal observations and vital signs (calling criteria). If any of these criteria are breached, the bedside nurse or doctor triggers a rapid response by clinicians who have the expert skills, knowledge and experience to initiate a coordinated response to any hospital medical emergency.

Traditionally, the most junior doctor and the bedside nurse were the first-line management team caring for patients in acute care hospitals. Interns were expected to assess and manage patients with deteriorating conditions, with little experience in the complexities involved in caring for more seriously ill patients. In the early 1990s, it started to become evident that many potentially preventable deaths and serious adverse events were occurring in acute care hospitals.2,3

Errors were ascribed to the system in which clinicians operated, rather than to individual incompetence.4 Hospitals operated in silos, where patients were admitted under a specialist in one area of medicine. This has certain strengths, such as the admitting doctor being ultimately responsible for the patient’s care. It had been a successful mode of operation for some time, but several changes have made it less effective.5 The population of patients in hospitals has shifted from relatively young patients with a single diagnosis to increasingly older patients with multiple comorbidities who undergo more complicated diagnostic procedures and treatment regimens.6 The needs of these older patients cannot necessarily be met by a specialist with limited experience outside his or her own area of expertise.7 The consultant, even if immediately available, may not have the appropriate skills to recognise and manage seriously ill patients requiring critical care interventions. Similarly, the consultant’s team of trainees, although more immediately available, may not have had the training necessary to manage seriously ill patients.

Patients with deteriorating conditions were not being recognised. More than 80% of those who suffered a cardiac arrest in hospital had documented deterioration in vital signs in the 8 hours before the arrest.8 More than 50% of those who died in hospital without a do-not-resuscitate order had severe antecedent derangements in vital signs.9 About 70% of patients admitted to an intensive care unit (ICU) from the general wards had vital sign abnormalities for at least 8 hours before being admitted to the ICU.10 Patients with deteriorating conditions were also managed suboptimally. A recent report from the United Kingdom found that the three most common reasons for potentially avoidable mortality in UK hospitals were mismanagement of deterioration (35%), failure of prevention (26%) and deficient checking and oversight (10%).11 RRSs have the potential to overcome all these problems.

Establishing a system around patient needs

It is common in hospitals for clinicians in one specialty to seek the opinion of clinicians in another specialty by requesting a consultation. Typically, this is not time critical. However, when a patient’s condition is deteriorating, the consultation must be as prompt as possible. For this to occur, an agreed way of defining at-risk patients is needed. This underpins the need for a standardised and objective set of calling criteria superseding the usual consultation process. Early intervention is more effective than waiting until a patient is so seriously ill that he or she requires expensive and invasive management in an ICU or, even worse, waiting until he or she suffers a preventable cardiac arrest or dies a preventable death.1

Vital signs

Before the widespread implementation of RRSs, there was little research into one of the most common interventions in acute care hospitals — the measurement of vital signs. Vital signs have been routinely measured and charted since Florence Nightingale used them for hospitalised patients in the Crimean War. The largest study on RRS effectiveness found that almost 50% of patients who died, had a cardiac arrest or were admitted to an ICU did not have vital signs measured before the event.12 Respiratory rate, the most accurate predictor of serious illness, is often not measured and, when it is measured, the measurement is often inaccurate.12,13 These findings have focused attention on the appropriate frequency for vital sign measurement, especially because hospitalised patients in general wards are at high risk of clinical deterioration.11 Deterioration in a patient’s condition can conceivably occur in the period during which vital signs are not usually measured.

Calling criteria

Vital sign abnormalities include: low systolic blood pressure (usually < 90 mmHg); high or low respiratory rate (eg, < 4 breaths/min or > 30 breaths/min); and abnormal pulse rate (eg, < 40 beats/min or > 140 beats/min). Potentially life-threatening observational abnormalities include seizures, airway obstruction and sudden decrease in level of consciousness. Staff concern is also an important criterion, empowering bedside nurses or doctors to seek timely assistance if they are worried about a patient who does not fit any other criterion. In mature systems, staff concern is a common reason for urgent assistance.14 Oxygen saturation abnormality, when available, is also a useful criterion.

Australian hospitals usually employ an RRS in which one calling criterion triggers a response. Hospitals in other countries may use scores, by adding vital sign abnormalities to trigger different levels of response.15 This could add a level of complexity and inaccuracy, and might encourage clinicians to focus on numbers rather than observation of the patient. It also excludes staff concern as a reason for seeking urgent attention.

Some centres are exploring the concept of encouraging family and visitors to trigger an urgent response. It is early days but, so far, there does not appear to be misuse of the system.16 Use of pathology results to identify patients at an even earlier stage in illness has also been explored.17 Although objective calling criteria are important, awareness of the RRS in itself can change an organisation’s culture, moving it from a traditional hierarchical and silo-based one to one with universal awareness that there are at-risk patients in a hospital and timely assistance is available.

The response

As with calling criteria, there is much variation in how organisations provide an urgent response. Some hospitals maintain separate cardiac arrest and rapid response teams. In the UK, it is common to have an outreach system, where nurses pre-emptively identify and manage at-risk patients across the hospital.18 A two-tiered system, where a member of the admitting team may be called for less serious abnormalities, is used in many organisations.19

Based on the evidence that hospitals suboptimally recognise and manage seriously ill patients,14,810 it is important to involve clinicians who have the appropriate training when caring for these patients, who often have complex needs. It is not surprising, therefore, that many rapid response teams use ICU staff.20 However, depending on the hospital setting, the urgent response could be provided by a doctor, nurse or paramedic, or by staff from any department in the hospital, as long as they have the appropriate skills, knowledge and experience.21

Other factors

Implementing an organisation-wide system such as an RRS involves challenging the way clinicians interact, bypassing entrenched hierarchies and constructing a system centred on patient needs. This requires more than standardised calling criteria and a rapid response (Box 2). All clinicians in the hospital must be aware of the system and support it. Similarly, senior administrators need to endorse and resource the system. An organisation-wide education program is required to teach staff how the system works and to empower people to call for assistance when needed.

It is also important to continually monitor the system and close the loop by making outcome indicators available to people at all levels of the organisation, especially to those responsible for and participating in the system.22 Some outcome indicators include cardiac arrest rates (which usually range between 0.5 and 6.0 cardiac arrests per 1000 admissions) and crude mortality rates. To make mortality rates more meaningful, patients with do-not-resuscitate orders are excluded. Data on cardiac arrests and deaths can be further refined by examining whether there were calling criteria that were not responded to appropriately in the 24 hours before the event. This gives insight into potential preventability. Delays in the rapid response can also be a useful indicator of the system’s effectiveness.21 Another important outcome indicator is the number of calls per 1000 admissions — an increase in the rate of calls is associated with reductions in mortality and cardiac arrest rates.23

Do rapid response systems work?

ICUs and RRSs are both systems for managing seriously ill and at-risk patients, but little robust research has been done to show the effectiveness of either. The general intuitive principle with such systems is matching the right people — with the right skills and knowledge — with the right patients at the right time.

It has been established that ICUs and RRSs identify and treat patients with a similar level of mortality risk.24 In other words, the boundaries between patients in general wards and patients in ICUs and high-dependency units (HDUs) are becoming blurred. One of the functions of an RRS is to act as a triage system, to identify sick ward patients who require ICU or HDU therapy. A 200-bed hospital with a 20-bed ICU will probably have less need for an RRS than an 800-bed hospital with a 10-bed ICU, as the more at-risk patients will already be in a highly monitored environment. In each hospital, RRS use also depends on patient casemix, average level of comorbidity and types of interventions undertaken.

Nevertheless, RRSs have been subject to evaluation. Not surprisingly, single-centre, before-and-after studies have almost universally shown significant reductions in outcome indicators such as mortality and cardiac arrest rates.25,26 Many of these studies were conducted by one or two “champions” who provided clinical leadership. The largest cluster randomised trial was underpowered and produced inconclusive results,12 possibly due to the contamination of control hospitals, less than satisfactory implementation and adherence, and variability in the effectiveness of implementation. Nevertheless, in a post-hoc analysis, the study did show a significant reduction in mortality in adult intervention hospitals.23 The largest meta-analysis on RRSs has shown 21% and 38% reductions in mortality and cardiac arrest rates, respectively, in paediatric hospitals, and a 34% reduction in cardiac arrest rates in adult hospitals.20 However, it is impossible to randomly assign patients to a group that receives early intervention by a rapid response team and a group that does not. Similarly, because of the almost universal uptake of RRSs in many countries,1 it is difficult to randomly assign hospitals. Other research methods must, therefore, be used. A recent study has shown a strong correlation between uptake of RRSs in New South Wales hospitals and reductions in cardiac arrest and cardiac arrest-related mortality rates, both of which decreased by about 50% over an 8-year period.27

Research now needs to shift to determining the most effective response teams, evaluating the sensitivity and specificity of calling criteria, assessing the cost-effectiveness of implementing RRSs, and defining the most effective RRS implementation strategies. Moreover, possible negative effects of RRS implementation — such as de-skilling of staff and putting excessive pressure on existing resources — need to be evaluated.

In the coming months, the Journal will publish a series of articles that explore how RRSs have changed our approach to patient safety, how RRSs have influenced end-of-life care in acute care hospitals, and how the use of cardiopulmonary resuscitation and cardiac arrest teams is changing.

1 Features of a rapid response system

  • Defines seriously ill patients, at-risk patients and patients whose condition is deteriorating using abnormal observations and vital signs (calling criteria)
  • Provides rapid response to seriously ill patients and those whose condition is deteriorating
  • Operates across the whole organisation
  • Is designed around patient needs
  • De-emphasises the usual hierarchies and interprofessional barriers
  • Provides rapid consultation by experts in critical illness

2 Strategies for maximising the impact of a hospital rapid response system

  • Engage the support of all doctors and nurses
  • Ensure that there is leadership and support from senior hospital executives
  • Implement strategies that promote hospital-wide awareness of the system
  • Ensure an urgent response to any staff concern, whether life-threatening or not
  • Ensure a 24/7 response by staff with appropriate skills, knowledge and experience
  • Build outcome indicators into the system and ensure targeted feedback of data
  • Conduct regular multidisciplinary meetings to discuss individual cases and outcome indicators

Incidents resulting from staff leaving normal duties to attend medical emergency team calls

Clinical emergency response systems such as medical emergency teams (METs),1 rapid response teams,2 patient-at-risk teams3 and critical care outreach teams4 are now used in hospitals worldwide to manage patients who have unexpected clinical deterioration. Currently, the optimal staffing structure for these systems remains unknown.5,6

At our hospital, MET personnel are not rostered solely for staffing the MET. Instead, MET staff have normal hospital duties to perform and, when a MET call is activated, they temporarily forgo their normal duties to attend.

This study was instigated after reports of potential adverse events, such as delayed medication dispensing, occurring as a result of staff leaving normal duties to attend MET calls. Our review found no publications in this area. The primary objective was to determine the rate of adverse events and incidents occurring as a result of hospital staff leaving normal duties to attend MET calls.

Methods

This single-centre, structured interview- and questionnaire-based study was conducted over an 18-week period between 29 July and 15 December 2013. The study was conducted in a 650-bed university teaching hospital in Sydney, New South Wales. Participants were all hospital staff who were recorded as attending a MET call on the hospital campus during the study period.

The primary outcome measure was the rate of adverse events and incidents directly related to MET staff leaving normal duties to attend MET calls. Secondary outcome measures were the rates of such events according to staff occupation.

Our hospital used a two-tiered MET system.7,8 The first tier recommended early clinical review by ward teams, and the second tier activated the MET. The MET, led by a medical registrar, included an intensive care registrar, an anaesthetic registrar, three residents or interns, a clinical nurse consultant, and nursing staff from the cardiology department. Security and environmental services staff attended MET calls outside of hospital buildings.

All MET staff had normal hospital duties to perform, and would forgo those duties to attend MET calls. MET attendance to MET calls was mandatory.

In 2013, cardiac arrests comprised 4.1% of MET calls at the hospital.

All staff attending and providing assistance at MET calls had their details recorded on attendance logs. On weekdays after each MET call, trained interviewers would contact the staff listed. Staff who consented were interviewed using a structured interview form. The following data were collected: number of days since the MET call; staff designation; issues resulting from leaving normal duties to attend the MET call; mechanism of reporting, such as line manager or computerised incident reporting system; and self-reported estimated time spent at the MET call.

To avoid intruding on staff when they were not at work, interviewers were instructed to make reasonable attempts to contact staff either in person, or using their hospital pager or phone, during working hours only. Staff who could not be contacted were sent a written questionnaire version of the structured interview. Completion and return of the questionnaire was considered as consent to participate.

Ethics approval was obtained from the hospital’s Human Research and Ethics Committee (CH62/6/2013-030).

Study definitions

The lack of standardised definitions for adverse events was problematic. The National Health and Medical Research Council (NHMRC) did not have definitions for adverse events that were unrelated to pharmaceutical products or medical devices.9

The original study definition of adverse event was an “anticipated or unanticipated event that causes, or requires an intervention to prevent, an unfavourable change in a person’s condition”.10,11 Institutional approval for the study to proceed, however, was conditional on altering the definition to that used by NSW Health.12 An adverse event was therefore defined as “an unintended patient injury or complication from treatment that results in disability, death or prolonged hospital stay, and is caused by health care management”.12 An incident was defined as “any unplanned event resulting in, or with the potential for, injury, damage or other loss”.12

Daytime was defined as 08:00–15:59, evening as 16:00–11:59, and night-time as midnight to 07:59. The response rate was defined as the number of completed interviews divided by the number of eligible reporting units.13

All incidents were classified according to severity assessment codes12 (Appendix 1) by the hospital manager for clinical quality and risk. Incidents were coded as minimum, minor, moderate, major or serious. Incidents that caused no injury or increased level of patient care, which required no additional review, and led to no financial or service losses were coded as minimum. All incidents were reviewed by an independent safety monitor, and managed using normal hospital procedures.

Statistical analysis

The MET call rate preceding this study was 17.2 MET calls per 1000 admissions. If our study was conducted similarly to a previous study that ran for 131 days and had a response rate of 64.1%,14 we predicted that 312 MET calls would occur and 1630 interviews would be completed. This would provide a 95% confidence interval of ± 9.7% if the primary outcome measure rate was 200 per 1000 MET participant attendances.

Statistical analysis was performed by an independent statistician, using Interactive Statistical Calculation Pages (John C Pezzullo; http://statpages.org/confint.html#Binomial), and SPSS, version 22 (IBM Corporation). Rates were calculated with binomial 95% confidence intervals, and subgroups were compared using the Pearson χ2 test, where appropriate.

Results

The hospital admitted 17 445 patients in the study period, during which there were 332 MET calls (a mean of 2.6 MET calls per day). The MET call rate was 19.0 MET calls per 1000 admissions (95% CI, 17.1–21.2).

There were 2663 MET call participant attendances recorded. A mean of eight staff members were recorded at each MET call.

Interviews or questionnaires were completed for 1769 staff, a response rate of 66.4%. Interviewers completed 1490 interviews, and 279 written questionnaires were returned (84.2% and 15.8% of total response, respectively). The median time from MET call to interview and MET call to questionnaire completion was 5 days and 21 days, respectively.

Of staff members participating at MET calls, where staff designation was recorded (= 2392), 2087 were MET staff (87.2%), 289 were ward staff (12.1%), and 16 were bystanders (0.7%). Of participating staff, where profession was recorded (n = 2405) 1545 were medical staff (64.2%) and 832 were nursing staff (34.6%).

There were no adverse events recorded. There were 378 recorded incidents. The incident rate was 213.7 incidents per 1000 MET participant attendances (95% CI, 194.8–233.5), and 1.1 incidents per MET call.

Using the severity assessment code, there were two incidents (0.5%) classified as minor, and 376 incidents (99.5%) classified as minimum. There were no incidents classified as serious, major or moderate. Three incidents (0.8%) were reported on institutional incident reporting systems. The types of incidents and the proportions of each are shown in Box 1.

Of the two incidents classified as minor, in the first, a patient absconded from the ward and was subsequently found. In the second, a patient sustained a fall without injury. Both incidents occurred while the patient’s nurse had left the ward to attend a MET call.

The incident rate for completed interviews and written questionnaires was 222.1 and 168.5 per 1000 MET participant attendances, respectively (P = 0.045).

Medical staff and nursing staff reported 243.0 and 156.8 incidents per 1000 MET participant attendances, respectively (P < 0.001). The types of incidents and the proportions of each are shown by role (medical or nursing) in Box 2, and overall proportions by staff type in Box 3. Most incidents (127; 38.3%) occurred during daytime hours, 113 in the evening (34.0%) and 92 during night-time (27.7%) (Appendix 2).

The median time spent by staff at MET calls was 20 minutes. The proportion of staff who spent 30 minutes or fewer at a MET call was 74.9%. Staff who spent 60 minutes or longer at the MET call reported significantly more incidents (Appendix 3).

There were 21 occasions (6.3% or about once every 6 days) where two MET calls occurred within 30 minutes, and two occasions (0.6% or about once every 2 months) where three MET calls occurred within 30 minutes.

Discussion

This study demonstrated three key findings about when MET staff temporarily left normal duties to attend MET calls. First, no major patient harm occurred. Second, MET calls caused significant disruption to normal hospital routines and inconvenience to staff. This occurred despite most staff spending 30 minutes or less at MET calls. Third, problems that did occur were significantly underreported using normal hospital reporting systems.

The observation that medical staff reported more incidents than nursing staff is consistent with work arrangements. Ward nursing staff provide cover when fellow staff members are indisposed. Medical staff and specialist nursing staff are less likely to have cover because of the specialised nature of their work. Improving cover if MET duty is predicted to affect activities such as procedures, clinics, ward rounds or meal breaks may reduce disruption.

Reducing disruption could also be achieved by reducing the number of junior MET staff and adding a further tier to the MET system, where a smaller MET attends middle-tier MET calls. This would work best in hospitals where the cardiac arrest rates are low. Superfluous staff should also be dismissed to normal duties as soon as practical.

Absolving MET staff of normal duties may reduce disruption; however, a standalone MET at our institution was previously not deemed justifiable because of the low MET call rate.

Whether our results can be extrapolated to other hospitals is uncertain. Our MET call rate appears to be low. Other Australian studies document MET call rates of 8.7–71.3 calls per 1000 admissions.1520 Hospitals with different MET call rates or MET configurations are likely to have different incident rates and patterns.

The very low formal incident reporting rate is not unexpected, as conventional reporting systems are not designed to detect the problems that this study examined.

The main strength of our study was the large number of respondents. The response rate was reasonable, given our intention not to intrude on staff recreational time, and difficulties interviewing staff working outside of business hours or part-time.

There did not appear to be a reporting bias with the use of the written questionnaires, as more incidents were reported from direct interviews. However, recall bias may have occurred in participants surveyed using written questionnaires because of time delay.

This is the first study to quantify the problems resulting from staff leaving normal duties to attend MET calls. However, our results cannot be generalised to other institutions due to differences in patient care and MET systems. Future studies are needed to quantify these problems in different MET systems, and also to identify which method of staffing the MET results in the least amount of disruption, while ensuring appropriate patient care and maximising efficiency.

1 Types and proportions of incidents reported as a result of staff leaving normal duties to attend medical emergency team (MET) calls

2 Types and proportions of incidents reported as a result of medical and nursing staff leaving normal duties to attend medical emergency team (MET) calls

3 Proportion of incidents, with 95% confidence intervals, reported as a result of staff leaving normal duties to attend medical emergency team calls, by staff type

Splenic rupture: a rare complication of infectious mononucleosis

A 28-year-old man presented to the emergency department with acute left upper quadrant tenderness and postural hypotension. He reported having had fever and cervical tenderness for 1 week before his presentation.

Blood tests showed an elevated white cell count with reactive lymphocytosis. A test for infectious mononucleosis heterophile antibody was positive, consistent with recent infection.

A contrast scan of the abdomen showed splenomegaly with subcapsular haematoma.

Splenic rupture after infectious mononucleosis is rare (incidence, 0.1%–0.5%), but can have disastrous consequences if overlooked.1,2

Severe alkali burns from beer line cleaners warrant mandatory safety guidelines

To the Editor: Two patients at our tertiary referral eye hospital had received severe alkali burns to the face and eyes while cleaning beer lines. In hotels, pubs and clubs, beer lines are cleaned weekly using strong alkaline solutions at high pressure. In an accident, alkali released under high pressure can produce blinding damage.

Our patients were young, typical of workers at these venues, and their injuries have had major impacts on their lives. One incident involved the face (60%–80% of facial skin) and both eyes (grade IV1) of a 23-year-old man (Box) using a commercially available beer line cleaner (potassium hydroxide; pH, 14). His eyes were immediately irrigated with water. His initial visual acuity was hand movements in the right eye and light perception in the left eye. He had bilateral corneal opacification and ocular ischaemia with hypotony in the left eye. He was treated according to burns protocol,1 but a non-healing right corneal ulcer developed, requiring multiple operations. Bilateral reconstructive eyelid surgery was also needed.2 His vision is currently light perception and no light perception with hypotony, respectively, in his right and left eyes. He requires further surgery to preserve his remaining vision, as well as ongoing psychological and social support.

The second patient received a grade IV injury to her left eye in 2006. Multiple operations were needed to heal the ocular surface, along with psychological and social support. After 4 years of treatment, her final visual acuity was light perception. She returned to limited work late in 2010.

Alkali injuries to the eye are devastating as they cause liquefactive necrosis and pass rapidly through the cornea to the eye’s internal structures.3 Damage to the stem cells of the ocular surface and intraocular structures produces permanent, difficult-to-treat and often blinding ocular disease. First aid should include copious ocular irrigation with water before referral to an emergency department.

Neither patient was wearing safety glasses. We found there are no mandatory safety guidelines in Australia (http://www.safeworkaustralia.gov.au), the United Kingdom (http://www.hse.gov.uk) or the United States (http://www.osha.gov), and perhaps worldwide, for beer line cleaning. Although the product information recommends use of safety equipment, this is not enforced and the equipment is usually not sufficient. Most workplaces provide safety glasses, but these offer suboptimal protection from a splash injury. Non-vented safety goggles are needed for adequate protection and should be worn throughout the cleaning procedure, from set-up to clean-up. We suggest that mandatory guidelines are indicated, as although such injuries are uncommon, they are severe and debilitating in the working-age group, with significant costs to the individual, health system and society.

Severe facial and ocular burns soon after injury


A: Image shows the limbal and scleral ischaemia of the left eye and bilateral opaque corneas. The sunken appearance of the left eye, indicative of hypotony, is a very poor prognostic sign. B: A close-up view of the left eye, showing the cloudy cornea and limbal ischaemia.

After the Quality in Australian Health Care Study, what happened?

Milestones in Australia’s journey to high-quality care

The 1995 Quality in Australian Health Care Study (QAHCS) demonstrated the potential to improve the quality and safety of health care.13 Using a modified version of the earlier Harvard Medical Practice Study on medical negligence, the QAHCS focused on the more useful measure of preventability of medical error. The incidence of adverse events was higher than in the Harvard study, and at first the Australian rates were queried by government: 16.6% of hospital admissions were associated with an adverse event, of which 51.2% were judged to have high preventability. Many countries replicated the Australian study, using one medical reviewer rather than two as in the QAHCS, which reduced the estimate by about 3%. Overall, a consistent rate of about 10% of hospital admissions associated with an adverse event was seen in New Zealand, Japan, Singapore, the United Kingdom and Denmark. In 2012, a World Health Organization study on adverse events in developing countries showed a similar result.4

The Australian Government responded with a succession of initiatives: the Australian Council for Safety and Quality in Health Care was established by Australian health ministers in 2000 and operated until 2005; the Australian Commission on Safety and Quality in Health Care (ACSQHC) was created in 2006 and written into legislation with the National Health Reform Act 2011. The ACSQHC promulgated 10 national quality and safety standards as part of national accreditation processes. Health reform has also included the Independent Hospital Pricing Authority, the National Health Funding Body and the National Health Performance Authority. Linking costs to quality outcomes, combined with national comparative performance measures of safety, efficiency, access and patient experience, has to be considered a milestone in Australia’s journey to high-quality care.

Have the rates of adverse events declined? A repeat of the same study would be costly, and the changed context of health care would complicate interpretation. However, there have been significant process changes that reflect an increasing attention to quality. Federal and state governments are reporting infection rates and triage times. The Australian Council on Healthcare Standards reports annually on 360 indicators in Australasia and, for the years 2005–2012, more indicators improved (125) than worsened (38), with no significant trend for 62 indicators.5 For example, the proportions of emergency department presentations meeting the triage benchmarks increased by about 6% over the 8-year period.

Quality principles have been introduced into medical and health professional education and expanded as a research theme. Early on, the University of Newcastle introduced a quality-of-care project, winning Australian Council on Healthcare Standards student quality improvement awards.6 Other schools have followed, and national and international curricula have been developed from Australia.

Notwithstanding the good progress, there remains much to do to improve health care systems. There is increasing focus on process re-engineering, applications of reliability science, human factor mitigation strategies, teamwork, communication, patient-based care and greater application of evidence-based medicine.

Racism, health and constitutional recognition

Constitutional recognition is the next step to building a healthier nation, says the Australian Indigenous Doctors’ Association

The impacts of racism are significant,1 they matter, and racism is rightfully acknowledged as a determinant of health for Indigenous populations worldwide.2 Recent research shows that experiences of racism and discrimination remain prevalent in Australia, through race-hate talk, race-based exclusion and physical attack.3 Correspondingly, there is evidence associating racism with poor outcomes in contemporary and historical contexts, via colonisation and oppression.4

From before birth, we are connected to family, community, culture and place. These interactions continue through life to form relationships which are crucial to belonging and to the construction of identity. This includes relationships with people and place, such as the actions and responses of others. Knowing about your own history and culture elucidates contemporary cultural ways of being, by providing a connection to the knowledge of ancestors. These connections are viewed as protective factors and contribute to building a strong sense of self and identity.5

Protective factors are inextricably linked to health and wellbeing, making the protection and promotion of culture critical to improvements in Aboriginal and Torres Strait Islander health. For Aboriginal and Torres Strait Islander people, our culture is a source of strength, resilience, happiness, identity and confidence. This philosophy embeds the importance of cultural safety into our daily practice. We do this because we know Aboriginal and Torres Strait Islander people are more likely to access, and will experience better outcomes from, services that are respectful and culturally safe.6

Thus, a focus of the work of the Australian Indigenous Doctors’ Association (AIDA) is promoting culturally safe learning environments for Indigenous doctors and medical students, and culturally safe service delivery to Indigenous patients. Cultural safety is about overcoming the cultural power imbalances of places, people and policies to contribute to improvements in Aboriginal and Torres Strait Islander health.7

We work within a strengths-based framework because conveying positive messages has the potential to make a significant contribution to changing public perceptions and attitudes.8 The media is, however, not bound to report in this way; it often focuses on stories of deficit. This type of reporting can fuel racist attitudes.8

Negative framing in the media weighs into current debates about the Racial Discrimination Act 1975 (Cwlth)9 and the debate about amending Australia’s constitution to recognise Aboriginal and Torres Strait Islander peoples as the First Australians.10 AIDA continues to support the maintenance of robust antiracial vilification laws as a necessary mechanism contributing to shape a health system that is culturally safe and respectful to all who access it.

Constitutional recognition is the next step in developing a healthier nation. Recognising Indigenous Australians as the First Nations peoples will enrich the identity of the nation and make significant steps towards reconciling past injustices. The current Constitution still provides a head of power that permits the Commonwealth Parliament to make laws that discriminate on the basis of race.10 The previous occasion on which protections under the Racial Discrimination Act were suspended was when activities were being implemented under the Northern Territory Emergency Response. At the time, AIDA advocated for the reinstatement of Section 9 of the Racial Discrimination Act, owing to the negative impacts that the suspension placed on the health and wellbeing of Aboriginal and Torres Strait Islander people in the Northern Territory.11 Recognising our rightful place as First Nations people in the constitution lays a strong foundation for the health, wellbeing and unity of all Australians. While it will not wash away the grave injustices of the past, with such recognition there is capacity to heal the deep wounds that affect health outcomes and continue to weigh heavily on Australia as a nation.

The medical community has a role to play in promoting Aboriginal and Torres Strait Islander recognition in the constitution. AIDA, as the peak body for Aboriginal and Torres Strait Islander doctors and medical students, will work with its peers in the medical community, as well as more broadly, to support this constitutional reform to achieve the sustainable, unifying and positive benefits that are envisaged for all Australians.