×

Advice on professional standards submissions released for public comment

PROFESSOR ROBYN LANGHAM, CHAIR, MEDICAL PRACTICE COMMITTEE

One of the benefits of the National Registration and Accreditation Scheme is the transparent development and revision of all registered health practitioners’ professional standards.

Whenever one of the 14 national boards under the Scheme wishes to revise, update or expand its professional standards, it must undertake a public consultation process, which includes disseminating a discussion paper, inviting submissions, and publishing the submissions and outcomes.

This allows considerable public scrutiny of proposals by Boards that sometimes seek to expand their practitioners’ scopes of practice beyond their training and education, and without sufficiently heeding workforce or public safety considerations.

In March, the Medical Practice Committee provided advice on the AMA’s submissions to two professional standards released for public consultation.

The first was the draft revised Professional Practice Standards for pharmacists developed by the Pharmaceutical Society of Australia (PSA). The draft standards, which have not been updated since 2010, are comprehensive and set a high bar for pharmacist practice.

Our submission commended the PSA for emphasising that standards in collaborative care, ethics and professionalism, evidence-based practice, and quality use of medicines must underpin the application of all pharmacists’ professional practice standards.

However, we made recommendations to further strengthen and clarify some of the draft standards to enhance patient privacy, patient safety, the quality of patient health care, and the collaboration between medical practitioners and pharmacists in providing person-centred care and services.

For example, in upholding principles of providing safe, evidence-based, effective and cost-effective services, the AMA commented that pharmacists must limit screening and risk assessment to services that:

  • provide a demonstrated benefit to patients (actually lead to better health care outcomes);
  • complement and do not duplicate existing services provided by other health professionals or services (e.g. general practitioners, community-based clinics); and
  • do not lead to higher out-of-pocket costs for patients or higher costs to the health system as a whole.

 The AMA’s second submission responded to the Optometry Board of Australia’s (OBA) revised Endorsement for scheduled medicines registration standard, which sets out the requirements for an optometrist to have their registration endorsed to prescribe scheduled medicines. This standard was also last updated in 2010.

The OBA is proposing to remove the list of scheduled medicines (including prescription-only medicines) that is currently attached to the standard, and attaching it instead to the Guidelines for endorsement for use of scheduled medicines. Changes to the standard must be approved by the Australian Health Workforce Ministerial Council, while changes to the guidelines do not. So moving the list of medicines from the standard to the guidelines would mean the OBA could make changes to the list of medicines without Ministerial approval.

The OBA argues that the current situation is slow, inefficient and causes unnecessary delays to patient access to new medicines.

However, the AMA strongly opposes this proposal.

Australian Health Workforce Ministerial Council approval of the standard and the medicines list is an important measure, ensuring that there is additional scrutiny at the highest level of any changes to prescription-only medicines within an optometrist’s scope of practice.

Administrative efficiency should not compromise patient safety. No evidence has been provided to support the claim that patient access to appropriate eye care is being compromised because the list is attached to the standard or that removing the list from the standard will enhance delivery of care.

It’s important that the AMA is vigilant in ensuring that non-medical practitioner prescribing does not expand beyond their scope of practice, training and education.


Deconfounding confounding part 1: traditional explanations

The first article of this series1 presented a framework to assist in judging the presence of bias:

  • selection bias, or systematic error in how participants are identified or selected;

  • measurement bias, or systematic error in how variables are measured; and

  • analytical bias — also known as confounding — or systematic error in the measure of association or conclusion about causation, due to improper or incomplete analysis.

Selection and measurement bias should be managed pre-emptively by good design before the start of the study, but can be detected post hoc by critical appraisal. No statistical method removes the effect of selection or measurement bias post hoc, although there are methods that allow us to model different degrees of bias and evaluate the effect on the measure of association.1 Confounding is slightly different in that it can be adjusted for in the analysis, as long as its sources are understood and measured without too much error.

What is confounding?

A confounder has been traditionally defined as a variable associated with both the exposure and outcome of interest without being an intermediate on the causal pathway between them, which causes a spurious or distorted estimate of the exposure–outcome association. This may be conceptually difficult to understand in the abstract, so a concrete example is useful.

At the beginning of this series,1 we used the example of smoking (exposure) and dementia (outcome), and we postulated that alcohol may be a confounder. In this sense, alcohol is associated with smoking, that is, people who drink also tend to smoke, and alcohol may independently contribute to the risk of dementia. We may decide to study 100 people who smoke and 100 people who do not smoke and follow them over many years for the development of dementia (Box 1).

In our study, 30% of people who smoke and 18% of those who do not smoke develop dementia. The relative risk (RR) of developing dementia is therefore 30%/18% = 1.7. However, based on our clinical knowledge, we have identified alcohol as a potential confounder and we want to adjust for this variable in estimating the effect of smoking on dementia. We may perform this adjustment either by including alcohol as a covariate in a regression model or by stratifying on this variable. In this article, we will do the latter because it makes the relationship between the variables more obvious. Stratifying the sample into drinking and non-drinking groups means that we remove the effect of drinking from our analysis. One way to understand this is to consider that within the strata of drinking status, everyone has the same level of drinking; thus, there is no variation in this variable and no potential to influence the outcome. This is a simplification, but it is useful for demonstration purposes. The relationship between smoking and dementia stratified by drinking status is shown in Box 2.

The RR of dementia with smoking is one in each stratum of drinking status. How is it that combining two groups that individually show no association between smoking and dementia yields an overall group that shows an association? Summing the frequencies of the respective cells across the two 2 × 2 tables in the strata (Box 2) yields the same numbers as the overall 2 × 2 table (Box 1).

To understand how confounding works in this example, we need to see two relationships:

  • Drinking is associated with smoking: in Box 2, (25 + 25)/(25 + 25 + 10 + 10) = 50/70 ∼ 70% of people who drink also smoke, and (5 + 45)/(5 + 45 + 8 + 72) = 50/130 ∼ 40% of people who do not drink smoke.

  • Drinking is associated with dementia: the risk of dementia in people who do not drink (Box 2) is 10%, compared with 50% in people who drink (Box 2).

Drinking status is, therefore, a confounder of the relationship between smoking and drinking. Another way of understanding this is to recognise that in the overall table, what is labelled as the smoking group is actually a drinking group, and it is the drinking that is responsible for the development of dementia.

We may see this by rearranging the 2 × 2 tables (Box 2) by strata of smoking, and looking at the relationship between drinking and dementia (Box 3).

These tables show that the RR of dementia with drinking is 50%/10% = 5, regardless of whether smoking is present or absent, that is, RR = 5 in both strata (Box 3).

In this case, the effect of smoking was completely confounded by alcohol, and adjusting for alcohol reduced the effect of smoking to zero. In reality, many associations are only partially confounded, and the effect of smoking may have been reduced after adjustment for alcohol rather than removed. In other cases, confounding may be so extreme that the effect size is reversed after adjustment for the confounding variable — this is called Simpson’s paradox.

Why should a confounder not be an intermediate?

The last part of the definition of a confounder is that it should not be an intermediate between the exposure and the outcome, that is, the confounder should not be caused by the exposure. In the example, we could postulate that smoking led to drinking and that drinking is what caused the increased risk of dementia. In this case, adjusting for drinking would remove precisely the effect we were trying to see. The effect of smoking on dementia may be entirely mediated through drinking, in which case, adjusting for drinking would remove the effect we are trying to measure. On the other hand, the effect of smoking on dementia may be mediated partially through drinking and partially through other mechanisms, and therefore, adjusting for drinking would remove part of the effect of smoking. We may then speak about the total effect of smoking on dementia, which includes all pathways, and then tease out the direct effect (effect of smoking directly on dementia) or multiple indirect effects (effect of smoking on dementia via drinking or other intermediates).

The ultimate solution to confounding

In an observational study, we cannot ensure that all potential confounders are identified and accurately measured, and hence there is always the possibility of residual confounding. Some authors have suggested that the choice of a control exposure (which should have no association with the outcome) or a control outcome (which should have no association with the exposure) may be used to shed light on the possibility of residual confounding.2 However, using a randomised controlled trial (RCT) is the only way we can ensure that confounding is handled definitively. This is exemplified by the debate over hormone replacement therapy, where results from over 30 years of data from hundreds of observational studies — collected in different settings and analysed with adjustment for different potential confounders — were overturned by one large RCT.3 Why is the RCT so powerful? By randomly assigning a sufficiently large number of people to two (or more) groups, we achieve an even distribution of all known — and more importantly, unknown — confounders across the trial arms. Any difference in outcome between the two groups is due to the only difference between them: the intervention assigned. Nevertheless, this does not mean that results from all RCTs can be believed; between the time of randomisation (when all potential confounders are evenly balanced) and the time of analysis (when outcomes are measured), there are many opportunities for that even balance of confounders to be upset and we must use our critical appraisal skills to evaluate the validity of the trial.4

Box 1 –
Association of smoking and dementia

Dementia


Risk of outcome

Present

Absent


Smoking

30

70

30%

Non-smoking

18

82

18%


Box 2 –
Association of smoking and dementia stratified by non-drinking and drinking

Dementia


Risk of outcome

Present

Absent


Non-drinking

Smoking

5

45

10%

Non-smoking

8

72

10%

Drinking

Smoking

25

25

50%

Non-smoking

10

10

50%


Box 3 –
Association between drinking and dementia stratified by non-smoking and smoking

Dementia


Risk of outcome

Present

Absent


Non-smoking

Drinking

10

10

50%

Non-drinking

8

72

10%

Smoking

Drinking

25

25

50%

Non-drinking

5

45

10%


News briefs

Ice use adds up to 150 000 emergency room visits a year

Methamphetamine use adds between 29 700 and 151 800 additional emergency department visits in 1 year, according to researchers from Curtin University, the University of New South Wales, the University of Newcastle and Monash University. The study, published in Drug and Alcohol Review, estimated past year rates of health service utilisation (number of attendances for general hospitals, psychiatric hospitals, emergency departments, general practitioners, psychiatrists, counsellors or psychologists, and dentists) for three levels of methamphetamine use (no use, < weekly, ≥ weekly) using panel data from a longitudinal cohort of 484 dependent methamphetamine users from Sydney and Brisbane. “We estimate methamphetamine use accounted for between 28 400 and 80 900 additional psychiatric hospital admissions and 29 700 and 151 800 additional emergency department presentations in 2013,” the researchers wrote. “More frequent presentations to these services were also associated with alcohol and opioid use, comorbid mental health disorders, unemployment, unstable housing, attending drug treatment, low income and lower education.” They concluded that: “Better provision of non-acute health care services to address the multiple health and social needs of dependent methamphetamine users may reduce the burden on these acute care services.”

Mapping malaria drug opens new possibilities

International research led by the Walter and Eliza Hall Institute of Medical Research (WEHI) has for the first time mapped how one of the longest-serving malaria drugs works, opening the possibility of altering its structure to make it more effective and combat increasing malaria drug resistance. The study, published in Nature Microbiology, produced a precise atomic map of the frontline antimalarial drug mefloquine, showing how its structure could be tweaked to make it more effective in killing malaria parasites. The team used cryo-electron microscopy, which produces images of biological molecules in their natural state in unprecedented detail, to see exactly how and where the drug binds the malaria parasite. Mefloquine has been associated with some serious side effects, including neurological symptoms. Dr Wilson Wong, from WEHI, said that the detailed atomic map would enable future drug improvements. “We now know mefloquine binds to a hotspot of activity on the ribosome surface,” he said. “However, our map of the ribosome and drug-binding site showed the fit is not perfect. We were able to mimic this interaction with compounds that were able to block the protein machinery and kill the parasite more effectively.”

Prime Minister has prizes for our best scientists

The search is on again.

Each year the Federal Government honours Australia’s best scientists, innovators, and science teachers through the Prime Minister’s Prizes for Science.

The call has gone out for nominations for this year’s humble science heroes, promising early-career researchers, media-shy innovators, and modest teachers who deserve to have their work recognised on the national stage.

This is what they’re looking for:

·         heroes of Australian science who have made a significant contribution to the advancement of knowledge through science — people like Rick Shine, Graham Farquhar and Ingrid Scheffer:

·         exceptional innovators from both industry and research who have translated scientific knowledge into substantial commercial impact — like Michael Aitken, Colin Hall, Graeme Jameson, John O’Sullivan and Ian Frazer:

·         early to mid-career scientists whose research is already making, and will continue to have, an impact on our lives — like Kerrie Wilson, Jane Elith, Ryan Lister, Andrea Morello, Angela Moles, Matthew Hill and Tanya Monro: and

·         science teachers—primary and secondary — like Suzy Urbaniak, Ken Silburn, Richard Johnson and Rebecca Johnson, who are inspiring the next generation with a love of science and exploration.

The prize recipients will receive national recognition and meet leaders in science, industry, education and government at the prize dinner in the Great Hall of Parliament House, Canberra.

The prizes are:

·         $250 000 Prime Minister’s Prize for Science;

·         $250 000 Prime Minister’s Prize for Innovation;

·         $50 000 Prize for New Innovators;

·         $50 000 Frank Fenner Prize for Life Scientist of the Year;

·         $50 000 Malcolm McIntosh Prize for Physical Scientist of the Year;

·         Prime Minister’s Prize for Excellence in Science Teaching in Primary Schools ($50 000 shared between the recipient and their school); and

·         Prime Minister’s Prize for Excellence in Science Teaching in Secondary Schools ($50 000 shared between the recipient and their school).

Nominations close at 5.00 pm Canberra time, Wednesday 12 April 2017.

It’s simple to nominate in the first (shortlisting) stage, with an online form that requires:

·         details of the nominator, nominee(s), two supporters;

·         for the five science prizes: three external referees (two of whom must be based overseas);

·         an achievement summary of no more than 1 000 words;

·         a two-page curriculum vitae;

·         proof of Australian citizenship or permanent residency; and

·         for the early to mid-career awards: evidence that their research career spans no more than 10 years (or full time equivalent) from completion of their highest relevant tertiary qualification.

If a nomination is shortlisted, further material will be required in the final stage.

For eligibility, selection criteria, nomination guidelines and forms, visit: www.business.gov.au/scienceprizes or contact 13 28 46

For more examples of past recipients, visit: www.science.gov.au/pmscienceprizes

Chris Johnson

German Chancellor presented Australian statement on global health

German Chancellor Dr Angela Merkel has received a position statement on global health from Australian scientists.

Australian Academy of Science President, Professor Andrew Holmes, and his colleagues from the S20 Science Forum presented the position statement late in March ahead of the G20 Summit in July.

“The Ebola and Zika epidemics have shown how disease in one country can have global impact. Infectious diseases are causing at least 15 per cent of cancer cases. And 15 per cent of tuberculosis cases may be linked to type II diabetes,” Professor Holmes said.

This issues illustrate why health will be an important focus at the G20 Summit, along with economic growth and financial market regulation.

The Science Academies of the G20 states have drawn up recommendations on improving global health and are playing an active role in the G20.

In their joint statement, the Academies offer strategies and tools to tackle communicable and non-communicable diseases and to strengthen public health systems. The joint document provides a basis for the G20 Summit consultations.

Professor Holmes was in Germany for the Science 20 Dialogue Forum where the statement was presented.

“Global health – specifically the management of both infectious and non-infectious diseases – still causes issues world-wide for individuals, health systems and economies alike,” he said.

“We are calling for strong short and long-term evidence-based strategies to address these issues.”

In the statement the G20 Academies of Sciences call for:

  • the strengthening of healthcare and public health systems;
  • applying existing and emerging knowledge;
  • addressing the broader social and environmental determinants of health; 
  • reducing serious risk factors for disease through education and promotion of healthy life styles;
  • ensuring access to health resources globally; and
  • enhancing and extending robust strategies for surveillance and information-sharing. 

Furthering research is a prerequisite for providing knowledge and new tools to meet these challenges.

You can read the full statement at: www.science.org.au/media

Chris Johnson

AMA backs call for inquiry into institutionalised racism

The gap between health outcomes for Indigenous and non-Indigenous Australians will not be closed until systemic racism is rooted out of the health system, the Close the Gap Campaign says.

Releasing its 2017 Progress and Priorities Report on National Close the Gap Day on 16 March, the Campaign Steering Committee called for a national inquiry into institutionalised racism in hospitals and other healthcare settings.

“The reality for Aboriginal and Torres Strait Islander peoples is that we have a life expectancy at least 10 years shorter than non-Indigenous Australians. We need urgent action,” Close the Gap Campaign co-chair Jackie Huggins said.

The report found that four interacting factors within Australia’s health system continue to be ‘potentially lethal’ for many Indigenous people:

  • limited Indigenous-specific primary health care services;
  • Indigenous peoples’ under-utilisation of many mainstream health services and limited access to government health subsidies;
  • Increasing price signals in the public health system and low Indigenous private health insurance rates;  and
  • Failure to maintain real expenditure levels over time.

“The persistence of these factors reflects systemic racism; that is, racism that is ‘encoded in the policies and funding regimes, healthcare practices and prejudices that affect Aboriginal and Torres Strait Islander people’s access to good care differentially,” the report said.

“Failure to engage effectively with Aboriginal and Torres Strait Islander people through their elected peak organisations allows such racism to continue.

“The progress of the headline targets in the Closing the Gap strategy will continue to be disappointing until these issues are properly addressed.”

The AMA supported the call for the inquiry, and for knowledge of Indigenous culture to be built into medical school curricula.

AMA President Dr Michael Gannon, AMA Vice President Dr Tony Bartone, and all eight State and Territory AMA Presidents toured the Winnunga Nimmitjah Aboriginal Health Service in Canberra on Close the Gap Day.

Dr Gannon said that while Aboriginal community-controlled health centres like Winnunga Nimmitjah were vital for primary care, it was not realistic to have hospitals dedicated to treating Indigenous patients only.

“It’s so important that patients feel safe in the hospital setting, whether that’s the tertiary hospital setting or in secondary hospitals,” Dr Gannon told reporters.

“If patients don’t feel safe, if they don’t feel secure, if they’re exposed to racism, well that’s simply not good enough.

“So we support that call for the inquiry. It’s so important that primary health care services are very much driven and delivered by Indigenous communities, but we need to do better when, inevitably, like all other Australians, Aborigines and Torres Strait Islanders end up in hospital.”

Keeping medical curricula up to date with community needs was a constant challenge, but more needed to be done to teach medical students about Indigenous culture, he said.

“We talk a lot about the importance of positive experiences at medical student level, at junior doctor level, into specialist training level in rural areas, and the same should apply when it comes to Aboriginal and Torres Strait Islander health,” Dr Gannon said.

“If I reflect on my training as a medical student in Perth, seeing Aboriginal patients was in many ways sadly commonplace.

“But it’s so important that we give medical students across Australia, whether that’s in the rural clinical schools or in the middle of our big cities, exposure to Aboriginal and Torres Strait Islander patients and their wants and needs.”

Dr Gannon said that days like Close the Gap Day were a good opportunity to recognise the advances that have been made, but to realise that there is still so much work to do.

“It’s going to take time, when we look at the metrics, whether they’re in the area of health, whether they’re in the area of employment or education, it is going to take time,” he said.

“But I think that it’s important that at least once a year on National Close the Gap Day, that we reflect on how far we’ve come, and hopefully as every year goes by, we talk about the gap shrinking in whichever target we’re talking about.”

Maria Hawthorne


[Perspectives] Virtue in deficit: the 9-year-old hero

The bravest person I know is a 9-year-old boy. I came to know him by chance and his story profoundly moved me. I will call him Cain, after the impulsive and hot-tempered son of Adam. The Cain I know is also impulsive. He suffered extensive damage in utero due to prenatal alcohol exposure and was diagnosed with fetal alcohol spectrum disorder (FASD). His birth mother, who was herself in care as a child, had neither the education nor the resources to refrain from drinking during pregnancy. Cain was taken into care at birth, but it was too late.

[Correspondence] The US immigration ban: implications for medical education and the physician workforce

On Jan 27, 2017, a presidential executive order, which was later suspended, halted entry to the USA for 90 days for immigrant and non-immigrant persons from seven Muslim-majority countries (Iraq, Syria, Iran, Sudan, Libya, Somalia, and Yemen). New replacement orders seem to be in the making to, more or less, achieve the same goals. Although the media has covered the legal, political, and humanitarian impact of the order, we would like to describe the effect on medical education and the physician workforce in the USA.

Detecting the gallop: the third heart sound and its significance

Good technique and a reflective approach assist clinicians to identify an easily missed indicator of ventricular dysfunction

The term “gallop rhythm” was first coined in 1847 by Jean-Baptiste Bouillaud to describe the cadence of three heart sounds occurring in rapid succession. It was further described by his pupil Pierre Potain as follows:

One distinguishes therein three sounds, namely: two normal sounds of the heart and a superadded sound… It is a shock, a perceptible elevation; it is hardly a sound. If one applies the ear to the chest it is affected by a tactile sensation, perhaps more so than an auditory one… In addition to the two normal sounds, this bruit completes the triple rhythm of the heart… This is the bruit de gallop.1

Third heart sound (S3) and fourth heart sound gallops are indicators of underlying ventricular dysfunction; however, the term gallop is only used when the sounds are pathological.

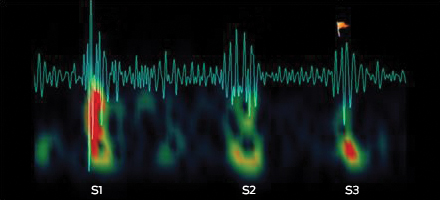
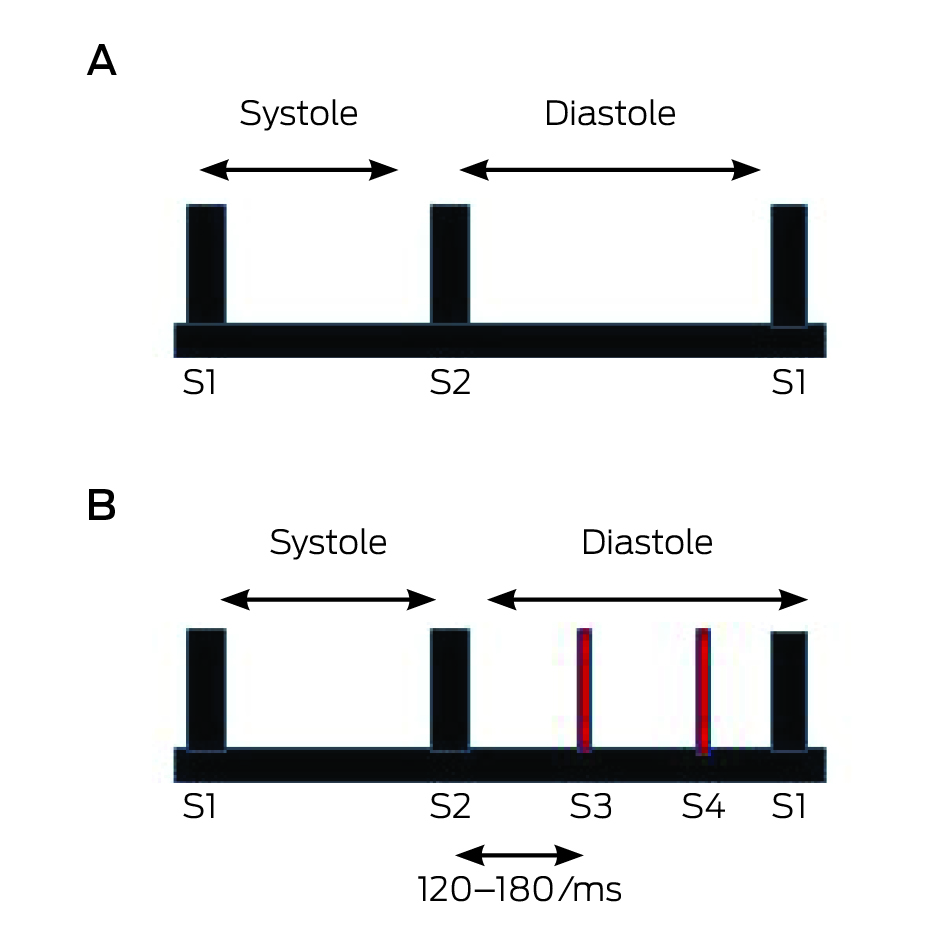
The S3 is a mid-diastolic, low pitched sound (Box 1). In early diastole, the ventricular pressure falls below atrial pressure, and the atrioventricular valves open initiating rapid ventricular filling. Filling slows as the ventricles reach the limit of their elasticity. It is thought that the S3 occurs in the presence of volume overload or ventricular dysfunction when the rapid filling phase ends abruptly.2 It is not completely clear whether the sound arises from vibrations in the valve cusps or tautening of the papillary muscles. Factors that affect S3 intensity include age, atrial pressure, unobstructed flow across the atrioventricular valve, rapidity of early diastolic filling, compliance of the ventricle, blood volume, ventricular cavity size, and patient positioning.

The sound is easily missed, as the level of clinical experience correlates with the ability to detect it.3 The S3 is a low frequency sound in the range of 20 to 70 Hz, with a thudding quality, easily masked by respiratory or environmental sounds.2 It is localised to a small area of the precordium, does not radiate and can be completely missed unless the bell or its equivalent is used during auscultation. An S3 can originate from the left or right ventricle. The differential diagnosis includes splitting of the second heart sound, opening snap of the mitral or tricuspid valve, tumour “plop” from atrial myxoma, or pericardial knock. An S3 is best detected when it is anticipated based on valuable clinical clues of heart failure or valvular pathology (Box 2).

While the sound challenges many clinicians, there are several strategies that can be effective in its detection. It is essential to tune out all other sounds, including systole, and focus on diastole alone (Box 3). As the sound itself may not be distinct or sharp like the first or second heart sounds, clinicians should become accustomed to recognising the cadence which could indicate its presence. An S3 originating in the left ventricle is best heard in the left lateral decubitus position (a position that brings the apex closest to the stethoscope), in held end expiration, and by using the bell or light pressure. It can be augmented by mild exertion which worsens left ventricular dysfunction. An S3 originating in the right ventricle is best heard along the left lower sternal border, sometimes in the epigastrium, and augmented during inspiration and manoeuvres that increase venous return.

The S3 is often physiological in asymptomatic children and young adults, but usually pathological in people over 40 years of age. It correlates with ventricular dysfunction or volume overload. Typical causes of ventricular dysfunction include ischaemic heart disease, cardiomyopathy, myocarditis and cor pulmonale. The S3 can also be heard in aortic and mitral regurgitation, and high output heart failure associated with anaemia, pregnancy, arteriovenous fistulae, thyrotoxicosis and left-to-right shunts.

The S3 can serve as a vital clue in the detection of patients with congestive cardiac failure as well as their risk stratification. The acute decompensated heart failure syndromes (ATTEND) registry study, a multivariate analysis performed in 4107 patients hospitalised with acute heart failure, suggested that the presence of the S3 was independently associated with increased in-hospital all-cause death (adjusted odds ratio [OR], 1.69; 95% CI, 1.19–2.41) and cardiac death (adjusted OR, 1.66; 95% CI, 1.08–2.54).4 Box 4 lists the haemodynamic significance of the presence of the S3.3,5,6

As elusive as the S3 might seem, good technique and reflective practice can help clinicians in eliciting the sound — a finding that provides clues to important cardiac pathology as well as severity of disease.

Box 1 –
Phonocardiogram from an abnormal heart, showing the third heart sound

Box 2 –
Symptoms of heart failure and associated physical examination findings


Symptoms of left-sided heart failure

Dyspnoea on exertion, orthopnoea, paroxysmal nocturnal dyspnoea, cough, wheeze

Symptoms of right-sided heart failure

Poor appetite, abdominal distension, right hypochondrial discomfort, oedema

Associated examination findings

Increased jugular venous pressure, oedema, resting tachycardia, displaced apical impulse, parasternal heave, murmurs of valvular dysfunction


Box 3 –
Normal heart sounds (A) and abnormal diastolic heart sounds showing the third and fourth sounds (B)

Box 4 –
Significance of the third heart sound: cardiovascular pathology

The third heart sound can be predictive of:

  • Depressed left ventricular ejection fraction of < 50% (likelihood ratio [LR], 4)
  • Depressed left ventricular ejection fraction of < 30% (sensitivity [Sn], 68–78%; specificity [Sp], 80–88%; LR, 4.1)
  • Post-operative pulmonary oedema (Sn, 17%; Sp, 99%; LR, 14.6)
  • Myocardial infarction in patients with chest pain (LR, 3.2)
  • Post-myocardial infarction mortality (LR, 8.0)

The time is now to act on inequalities

PROFESSOR STEPHEN LEEDER, EMERITUS PROFESSOR, PUBLIC HEALTH, UNIVERSITY OF SYDNEY

An appropriate response from Australia and its new Health Minister to the health problems our country is confronting would start with a goal-based strategic approach to inequality and the injustice and health disadvantage that travels with it.

Many social and political analysts agree that inequality has manifested itself as an immense force in recent elections, including the vote on Brexit and the elevation of Donald Trump. The core temperature in the social volcano reached a critical level as workers’ wages froze while top executives received ever more millions. Now the volcano has erupted. A period of prolonged social unrest and loss of confidence in political structures is predicted.

At the World Economic Forum in Davos, Switzerland last month, inequality received unusual attention. The Forum is traditionally for high-flying business magnates, princes of the financial world and others who have benefited immensely from recent decades of global economic progress. But this year the glitterati, as they checked their ski bindings, nervously added inequality to their agenda. Inequality they ranked as “the most important trend likely to determine development across the world over the next decade”.

Now inequality may seem remote from us, our patients and the health of our communities but it may be closer than we think.  Life expectancy and quality of health and life depend on life opportunities being relatively equal. Inequality is a powerful risk factor and as UK (nee Australian) epidemiologist Michael Marmot has shown and spoken forcefully in his 2016 ABC Boyer Lectures, can outweigh even smoking as a damage to health. 

Hear the rumble in the mountain and be afraid

Voices urging health professionals to heed the rumbles deep in the mountain include those of Marmot and Flinders University’s Professor Fran Baum.  And thank goodness that to an extent we have done so.  The Aussie “fair go” has contained the avarice of economic fundamentalists who would turn the torch of unfettered market forces on everything. And so Australia retains Medicare, public education and social welfare programs that mitigate potential catastrophes and life-long loss of opportunity.  With the exception of Indigenous health, our social gradients in life expectancy are not savage although far from top drawer compared, say, with Scandinavia. 

What to do?

We can analyse the statistics and note the extent of inequality and its effects, but it is quite another to work out what we might do about it.  

A recent article in the BMJ by Kate E Pickett and Richard G Wilkinson, epidemiologists at York University, reflected on the agitation on the Davos ski slopes. Inequality, they observed, “during the 20th century in most rich countries fell almost continuously from the 1930s to the 1970s but then increased dramatically from the 1980s”.

So presumably the deeply troubling levels of inequality that are driving current unrest can be undone.  As John Kennedy observed, man-made problems are generally amenable to man-made solutions.

Pickett and Wilkinson remind us that the late Tony Atkinson, an economist and activist who spent his lifetime concerned about inequality, identified several actions relating to taxation and minimum wages that he calculated could help.  So good minds have been at work.

Marmot has written extensively on what might be done about inequalities.  His reports, built on a strong base of evidence, focus on six areas for action: 

  • Give every child the best start in life;
  • Enable all children, young people and adults to maximise their capabilities and have control over their lives;
  • Create fair employment and good work for all;
  • Ensure healthy standard of living for all;
  • Create and develop healthy and sustainable places and communities; and
  • Strengthen the role and impact of ill-health prevention.


“Delivering these policy objectives,” he writes, “will require action by central and local government, the [national health authority], and the private sectors and community groups. National policies will not work without effective local delivery systems focused on health equity in all policies.” 

Conceivably many of us can do a bit about several of these goals. A big challenge demands a big response and an imaginative and creative political push.  It’s ages since we had a national health policy that made you stop and think with its depth and challenge.  Let’s help make it happen.