Forecasting life expectancy by age and sex is broadly used for research and planning of health sevices, social services, pensions, and economics, and has been developed at the national and multicountry levels.1–3 The basic idea for predicting life expectancy is closely related to the concept of epidemiological transition.4 However, the idea is neither entirely based on evidence nor well-defined methodologically.2 Improvement in life expectancy is achieved through reductions in infant and younger age mortality and the progressive delay of mortality among older people.
Preference: Economics
185
[Review] The Lancet Countdown: tracking progress on health and climate change
The Lancet Countdown: tracking progress on health and climate change is an international, multidisciplinary research collaboration between academic institutions and practitioners across the world. It follows on from the work of the 2015 Lancet Commission, which concluded that the response to climate change could be “the greatest global health opportunity of the 21st century”. The Lancet Countdown aims to track the health impacts of climate hazards; health resilience and adaptation; health co-benefits of climate change mitigation; economics and finance; and political and broader engagement.
Public hospitals – funding needed, not competition
ASSOCIATE PROFESSOR SUSAN NEUHAUS, CHAIR, AMA HEALTH FINANCING AND ECONOMICS COMMITTEE
Under its terms of reference, public hospital funding is a key focus for Health Financing and Economics’ work. How funding arrangements affect the operation of public hospitals and their broader implications for the health system has always been an important consideration for HFE, and for Federal Council and the AMA overall.
The AMA Public Hospital Report Card is one of the most important and visible products for AMA advocacy in relation to public hospitals.
The 2017 Report Card was released by the AMA President on 17 February 2017. The launch and the Report Card received extensive media coverage.
The Report Card shows that, against key measures relating to bed numbers, and to emergency department and elective surgery waiting times and treatment times, the performance of our public hospitals is virtually stagnant, or even declining.
Inadequate and uncertain Commonwealth funding is choking public hospitals and their capacity to provide essential services.
The Commonwealth announced additional funding for public hospitals at the Council of Australian Governments (COAG) meeting in in April 2016. The additional funding of $2.9 billion over three years is welcome, but inadequate.
As the Report Card and the AMA President made very clear, public hospitals require sufficient and certain funding to deliver essential services.
“Sufficient and certain” funding is also the key point in the AMA’s submission to the Productivity Commission’s inquiry into Reforms to Human Services, in relation to public hospitals. The Commission is expected to report in October 2017.
As part of this inquiry, the Productivity Commission published an Issues Paper seeking views on how outcomes could be improved through greater competition, contestability and informed user choice.
While the AMA believes there is clearly potential to improve outcomes of public hospital services, its submission highlighted that there are significant characteristics of Australia’s public hospitals that must be taken into account.
Health care is not simply a “product” in the same sense as some other goods and services. Public hospitals are not the same as a business entity that has full or even substantial autonomy over their customers and other inputs, processes, outputs, quality attributes, and outcomes.
Public hospitals work on a waiting list basis, usually defined by acuity of need, to manage demand for public hospital services. Private hospital services typically use price signals. There is limited scope to apply mechanisms for patient choice (such as choice of treating doctor) to access arrangements in public hospitals that are governed by waiting lists.
Public hospitals also operate within a highly developed framework of industrial entitlements for medical practitioners and other staff that are tightly integrated with State/Territory employment awards. These measures are intended to encourage recruitment and retention of medical practitioners to the public sector, offering stable employment conditions, continuity of service and portability of entitlements. They support teaching, training and research in the public sector as well as service delivery.
The freedom to choose between public and private hospital care, and the degree of choice available to patients in public hospitals as distinct from private patients, is an integral part of maintaining Australia’s balanced health care system. The broad distinction between public and private health care is generally understood by the community as a basic feature of the health system and part of Medicare arrangements, even though detailed understanding of how this operates, including what they are actually covered for in specific situations, is often lacking for many people.
Introducing private choice and competition elements into public hospital care will tend to blur the distinction between public and private health care, and reduce the perceived value of choice as a key part of the incentive framework for people choosing private health care.
The Commission’s Issues Paper proposes that increased competition will address equitable access for groups including in remote areas, benchmarking and matching of best practice, and greater accountability for performance. These are all worthwhile and important objectives in their own right. As such, they are already the focus of a range of initiatives.
Public hospitals are already subject to policies and requirements that address the same ends of improved efficiency, effectiveness and patient outcomes, including:
- Hospital pricing, now supported by a comprehensive, rigorous framework of activity based funding and the National Efficient Price;
- Safety and quality, supported by continuously developing standards, guidelines and reporting, including current initiatives to incorporate into pricing mechanisms;
- Improved data collection and feedback on performance including support for peer-based comparison.
The single biggest factor that will increase the returns from such initiatives is the provision of sufficient and certain funding. Increased competition, contestability and user choice will not address this need.
The AMA Public Hospital Report Card 2017 is at ama-public-hospital-report-card-2017
Variation in the fees of medical specialists: problems, causes, solutions
Greater transparency in setting charges may be the most efficient way to rein in excessive fees
Articles in this issue of the MJA1,2 and elsewhere3–5 have reported significant variation in the fees charged by specialist physicians and surgeons. These variations raise questions about excessive health care costs, as well as about barriers to access for patients.2,4,5
That costs are barriers to medical care in Australia has been reported by 8% of people who needed to see a medical specialist and by 19% of those needing to see a general practitioner.5 International studies have also found that cost is a barrier for those needing medical specialist or general practice care; Australian prices generally fall in the middle range of the countries surveyed, but are among the highest for patients with certain chronic conditions.6 Financial barriers are more significant for poorer, sicker people, and for those in remote areas,7 and in the long run may lead to poorer health and greater costs.
The causes of fee variations are essentially market-related. Supply and demand conditions vary across geographic and specialty markets, and areas with fewer doctors are likely to face higher fees.7 Price variations are also a symptom of the uncompetitive nature of markets for certain medical specialist services, so that some doctors are able to charge well above the levels commonly charged for these services. Whether supply is adequate depends on demand, and this in turn depends on the patients’ clinical needs, their ability and willingness to pay (both strongly linked to income),3 and their ability to find alternative care (in public hospitals, for instance). Supply — the services that will be provided at a given price — depends on doctor numbers, the hours they are prepared to work, and on their attitudes to charging, including views on altruism.
The future supply of medical specialists will be influenced by the growing number of graduates from medical schools, subject to specialist training capacities.8 Increasing medical specialist numbers would be expected to lead to increased bulk-billing and lower average fees, but may also increase the volume of services. Other consequences may be difficult to predict, including changes to employment arrangements, such as greater willingness to become salaried medical officers.
Some of the proposed solutions for reducing excessive fees and high co-payments are unlikely to have a substantial impact. For example, there are calls to remove the Medical Benefits Schedule (MBS) fee freeze.2 However, evidence from general practice9 and the MBS safety net10 suggest that increasing the levels of rebates would have minimal impact on out-of-pocket costs, as doctors are aware of what price “the market will bear”.1 More importantly, such changes are unlikely to reduce variations within medical specialties, or to reduce the extreme out-of-pocket fees charged by some practitioners.
Other self-regulatory solutions, such as professional colleges offering education about “reasonable” fee-setting (eg, the Royal Australasian College of Surgeons Code of Conduct11) have, in practice, not constrained fees. Colleges may find this role easier were government price setting more transparent and rules for setting MBS schedule fees more explicit.
Easier access to information may induce greater competition. Patients have little opportunity to verify claims of higher quality care by medical specialists, and it is difficult to shop around to find the best price. Unverified quality claims can lead to extensive price variation, despite there being little evidence that quality is correlated with price.2 Information for patients could be improved by a website where medical specialists report their fees (eg, myDr.com.au, healthdirect.gov.au), enabling patients and referring GPs to make clinically and financially informed choices. Equally importantly, transparent pricing could lead to price competition between medical specialists.
Extreme out-of-pocket costs could also be reduced by regulatory incentives and constraints within the Medicare system. Noting the constitutional need to avoid civil conscription, options could include removal of access to Medicare rebates for a service if the fee is extreme; introducing incentives, similar to GP bulk-billing incentives, that reward medical specialists for charging certain patient populations specified fees; or through more radical measures, such as making Medicare an opt-in system for doctors who agree to meet particular charging guidelines.
Variations in fees charged by particular medical and surgical specialist groups can generate barriers for patients. History suggests self-regulation is unlikely to change this situation, and increasing MBS rebates will have little effect. While the increasing numbers of specialists should put downward pressure on prices, the scale of this pressure is difficult to predict. If the government wants to improve the affordability of medical specialist services without incurring large, uncontrollable costs, direct regulation is one option, but one that is likely to generate considerable debate. Improving the transparency of pricing could increase competition and place downward pressure on unreasonable fee-setting, and may provide the most affordable and fair approach to the problem.
Variation in the costs of surgery: seeking value
Transparency is key to achieving affordability of health care
There is increasing concern about the sustainability of health care in Organisation for Economic Co-operation and Development (OECD) countries. Australia currently spends US$6140 per capita — or 9.1% of its gross domestic product — on health care.1 Moreover, there is evidence that health care costs, including out-of-pocket (OOP) expenses, are rising.2 In Australia, 68% of health care costs are funded through the public health system, with 32% from other sources, including private health insurers and OOP expenses.2 To encourage Australians to take out health insurance, the private health system is subsidised by a private health insurance rebate, which costs the public about $5 billion per year.2 Private health insurers derive their income from premiums, which have risen an average of just under 6% per year since 2012, well above the inflation rate or the consumer price index.3 Individual OOP expenses are also rising at an average rate of 6.2%; they have more than doubled in a decade and accounted for 17.8% of Australia’s $140 billion health care spending in 2013–14.2
Value is defined as the health outcomes achieved per dollar spent.4 Moreover, data on performance and outcomes are fundamental to the ability to determine value. Reports on variation across the country,5 including comparison with other OECD countries,6 may prompt a review of activity (the treatments and procedures the health system provides), but cannot determine their value without measurement of costs and outcomes.
To ensure high value, the procedures performed must be appropriately indicated, avoiding overservicing or selecting a particular treatment when its likelihood of success, compared with the alternatives, is limited. Health professionals have an ethical responsibility to avoid waste in health care — not only by better targeting resources, but also because “useless tests and treatments cause harm”.7
The interim report on the Medicare Benefits Schedule (MBS) review8 highlights a recurring theme of how to better inform the system through stakeholder feedback based on contemporaneous data. There is currently limited use of health care data, a lack of meaningful clinical reports and often a failure to engage clinicians in clinical governance. This includes costs and fees charged across the health system and informing consumer choice.
The Royal Australasian College of Surgeons (RACS) and Medibank, Australia’s largest private health insurer, have published reports on surgical variance, which detail the cost and outcomes of care in selected high volume procedures for general surgery, otolaryngology, urology, orthopaedics and vascular surgery.9
Data sources and analysis
The data in the reports were extracted from administrative claims — received by Medibank from private hospitals and specialists — for treatment provided to Medibank policy holders. This initial analysis looked at hospital separations with an admission date in 2014 and any follow-up hospital separation funded by Medibank within 6 months of discharge. The reports were compiled from hospital claims data, hospital casemix protocol data and MBS data relating to diagnoses, interventions and patient demographics. We analysed service use, including transfers to intensive care units (ICUs) and rehabilitation, and plotted outcomes based on length of stay, hospital acquired complications, re-admissions and re-operations. The data on costs included the Medicare item numbers billed, total costs of a hospital admission, cost of prostheses, and OOP expenses.
Procedures were identified by MBS code and selected on the basis of volume to ensure a sufficient spread across surgeons performing them. A principal procedure was identified for each hospital separation, and for most of them, this was the highest value MBS item fee from the medical claim. Where multiple MBS codes described a single procedure, the similar MBS codes were combined. Surgeon level analysis was limited to those with at least five procedures in the dataset. Medibank did not share the identity of the individual surgeon.
Hip replacement as an example
The RACS and Medibank reports on clinical variation focus on specific surgical procedures without risk adjustment.9 For patients who had hip or knee arthroplasty, there was wide variation in the length of stay, use of ICU bed days or rates of transfer to inpatient rehabilitation.
We have used hip replacement as an example in our discussion of costs, fees and value. The rates of hospital acquired complications were reassuringly low.
The cost of a surgical episode of care includes the sum of hospital, surgeon and other providers’ fees, the prosthesis, and pharmaceuticals. The use of ICU after the operation or transfer to rehabilitation following a surgical admission varied considerably. For the 299 surgeons who performed at least five procedures, the average separation cost of a surgeon ranged between $18 309 and $61 699 with a median of $26 661 (the average total cost per hospital separation was $27 310). High volume surgeons showed greater congruity and were closer to the median in terms of the overall cost of a hip replacement. There was little variation in regional (state and territory) total costs.9
Prices for hip prostheses varied from $4908 and $16 178, with a median of $10 727 (Box 1). In Australia, there is considerable disparity in the cost of prostheses when prices are compared between the public and private health systems.10 The amount paid by private health insurers for a prosthesis in the private sector can be twice the amount in public hospitals. Australia also pays a high price for prostheses when compared with other OECD countries.10 The government has recently announced a reduction in the price to be paid for items on the Prostheses List, reducing a hip prosthesis by 7.5%.11
OOP expenses
Medical practitioners in Australia, including surgeons, often augment the fee paid by Medicare and the private health insurer with a copayment paid by the patient. This is known as an OOP charge and is often resented by patients with private health insurance. There is considerable variability in the rebate a health fund will reimburse with regards to a provider’s fee and, therefore, some difference in gap payments is to be expected.
Medibank-insured patients who had a hip replacement incurred an OOP charge by the principal surgeon in 39% of separations, and the average OOP fee was $1778.9
For the 299 surgeons who performed at least five hip replacements, 142 (47%) did not charge any OOP. The average OOP charged ranged from none to $4057.9 The OOP surgical fee is a large but not the only component of gaps paid by patients. OOP charges for other medical services, including charges raised by the anaesthetist, assistant surgeon, and for diagnostics, were charged in 80% of the hospital separations, with an average charge per patient of $342.9
What is a reasonable fee?
The RACS recognises — as does the Australian Medical Association — that gaps are necessary and that, apart from the variability in insurance coverage, the underlying cause of gap fees is the failure of government reimbursement through Medicare to keep pace with inflation and the cost of providing a service.12 The RACS view is that the fees charged should be reasonable and in line with the skill, effort and risks associated with performing a procedure and providing perioperative care.13
Surgeons should not take advantage of the vulnerability of their patients. No one should need to access their superannuation, remortgage their home or resort to crowd funding to have surgery that is clinically indicated. In Australia, the public system is always available for emergency and urgent surgery. RACS has made explicit statements in this regard, published position statements12,13 and provided advice to patients. The RACS code of conduct14 makes clear what is expected of surgeons in setting and informing patients about fees.
There was also no correlation between the size of the fee charged and the quality of the surgery. Indeed, an unpublished analysis by the RACS and Medibank found that surgical fees charged were not correlated with the length of stay for any procedures studied (Box 2). Length of stay is a reasonable surrogate for quality in well defined, largely standardised unicomponent elective operations, such as joint replacement, which have well established post-operative and discharge protocols.
There is an opportunity to further reduce the length of stay after a joint replacement when comparing the Medibank Private results with the public sector in Victoria15 and Scotland.16 This reduction may be achieved without diminishing the quality; a shorter stay may make savings and increase in value.
Conclusion
The discussion around the affordability of health care must continue. As key members of the health care team, surgeons cannot ignore the total costs of surgical services, the components within that service or the fees associated with their individual activity. The Medibank and other administrative datasets inform us on variation in the components of value — clinical activity, outcomes, reimbursements and costs. Making the reports publicly available9 provides assurance of transparency and accountability and may better inform surgeons’ and patients’ choices in the future.
Box 1 –
Average prosthetic cost for hip replacements
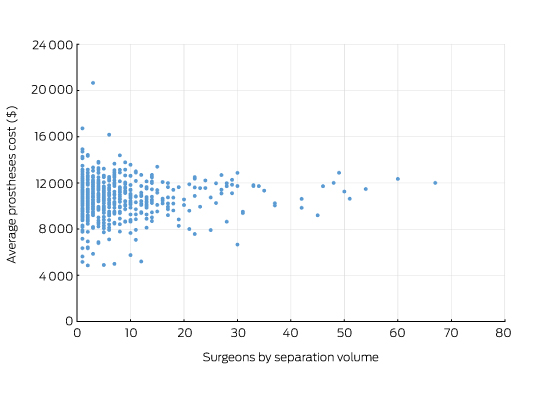
Source: Royal Australasian College of Surgeons and Medibank Surgical Variance Report for Orthopaedic Surgery.9 The data cover the claims paid by Medibank for Medibank policy holders during 2014. Separations that included either Medicare Benefits Schedule items 49318 or 49321 were recorded as the highest value procedural item on the medical claim.
Box 2 –
Total knee replacement: plot of the out-of-pocket fee charged by the surgeon and hospital length of stay showing no correlation
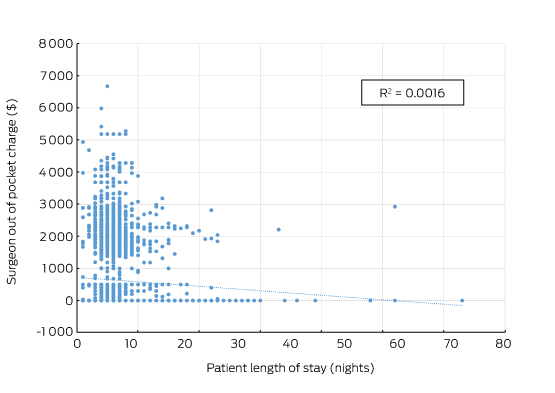
Source: Royal Australasian College of Surgeons and Medibank. The data cover the claims paid by Medibank for Medibank policy holders during 2014. Separations that included either Medicare Benefits Schedule items 49518 or 49521 were recorded as the highest value procedural item on the medical claim.
Improving safety and quality of public hospital services – a case of less $$ to do more?
A key focus for Health Financing and Economics Committee (HFE) is the pricing and funding of public hospitals.
This work includes monitoring public hospital funding through the federal Budget and public hospital expenditure as reported by the Australian Institute of Health and Welfare.
HFE also takes a close interest in hospital pricing through the operation of Activity Based Funding (ABF) and the National Efficient Price (NEP), managed by the Independent Hospital Pricing Authority (IHPA). Each year, IHPA publishes a consultation paper to inform the Pricing Framework of ABF and the NEP to apply for the following financial year.
The AMA has a direct and significant interest in the Pricing Framework for public hospital services as a critical element in the overall functioning of our hospital system.
The major new element in the proposed Pricing Framework for 2017-18 relates to options for incorporating safety and quality into the pricing and funding of public hospital services.
For 2017-18, IHPA has been directed by Federal, State and Territory governments to undertake specific work to integrate quality and safety into hospital pricing and funding. IHPA has been tasked to advise on pricing and funding options for sentinel events, preventable hospital acquired conditions, and avoidable hospital readmissions.
IHPA’s options are set out in its consultation paper on the Pricing Framework 2017-18.
The options involve reducing pricing and funding for services that do not meet safety and quality standards, for example, services that involve a preventable hospital acquired condition. The ‘logic’ appears to be that improved safety and quality will be achieved by imposing financial penalties and reducing hospital funding for poor safety and quality services.
At its October meeting, HFE was briefed by IHPA Chief Executive James Downie on hospital pricing issues and IHPA’s safety and quality options. HFE drew on this discussion to consider and make input to the AMA’s submission on the Pricing Framework.
The AMA has consistently advocated for the appropriate recognition of safety and quality in the ABF and NEP framework.
However, the AMA has significant concerns with how this longstanding gap in the framework is now to be addressed. Any approach that sets out to improve safety and quality by financially penalising hospitals that are already under-resourced to achieve safety and quality standards is misconceived.
Improving the safety and quality of public hospital services requires a framework of positive incentives for the achievement of relevant targets, supported by the full range of quality and safety mechanisms in place and available to public hospital system operators, doctors, nurses and other hospital staff.
These include improvements in data quality and information available to inform clinician practice, whole‑of‑system efforts to deliver improved patient outcomes, and incentives that work to the level of the clinical department to focus efforts and effect change, with local implementation, monitoring and information sharing needed.
An essential pre-condition for all such improvements is adequate funding for public hospitals.
Overall funding for public hospitals under the NEP has been, and continues to be, inadequate. This has direct consequences for the performance of public hospitals in key areas against the targets set by governments, as tracked and reported in the AMA Public Hospital Report Card.
A review of maturity onset diabetes of the young (MODY) and challenges in the management of glucokinase-MODY
Case presentation
A 63-year-old lean female of Asian ethnicity was referred to our service in 2006 with a 12-year history of well controlled type 2 diabetes (T2D) in the absence of micro- or macrovascular complications. She had undetectable β-cell antibodies. Her fasting glucose levels were 6–7 mmol/L and her glycated haemoglobin (HbA1c) level was 7.3% (56 mmol/mol). She was previously diagnosed with gestational diabetes mellitus (GDM) in three of five pregnancies, requiring insulin with the fourth pregnancy. All children were born without complication and of normal weight. Her father and five of six siblings were diagnosed with T2D. Over time, her management included diet and exercise, metformin 850 mg three times a day, modified release gliclazide 60 mg daily, and pioglitazone 45 mg daily. Ten years after referral, her HbA1c level was 7.6% (60 mmol/mol). She trialled basal insulin (glargine), but it was ceased as it was apparently ineffective. Her weight remained stable and her HbA1c levels showed little variation with escalating oral therapy. She developed postmenopausal osteoporosis and pioglitazone was ceased. Her daughter, who was also lean, was diagnosed with GDM during routine antenatal care. Given the autosomal dominant penetrance of diabetes in the family, she underwent genetic testing for maturity onset diabetes of the young (MODY) subtype 2 due to a glucokinase gene mutation (GCK-MODY), for which she tested positive. Our index patient also underwent genetic testing, and similarly tested positive for the same heterozygous mutation (aberrant splicing of intron 8c.1019+1G>A).
After being treated for more than 20 years, the patient was advised to cease treatment. She did so reluctantly, mainly due to the years of advice stressing the importance of treatment adherence. Her HbA1c level remained at 7.8% (62 mmol/mol) 3 months after treatment cessation. A 1-week continuous glucose monitoring study revealed fasting glucose levels of 7.5–8.4 mmol/L with the largest postprandial glucose excursion of about 3.0 mmol/L.
Literature search and sources
The sources used in this narrative review were obtained from original publications or reviews from groups renowned for their work in the definitions and genetics of MODY subtypes. Other publications were obtained from the MEDLINE and EMBASE databases and limited to English language; they were preferably recent publications (within < 10 years) and published in high impact journals. Information on specific genetic mutations and clinical phenotypes for the MODY subtypes were also obtained from the Online Mendelian Inheritance in Man online catalogue (www.omim.org).
What is MODY?
MODY is a heterogeneous group of monogenic diabetes disorders due to pancreatic β-cell dysfunction.1,2 Patients with MODY have early onset of diabetes and typically lack features of insulin resistance or autoimmunity. The MODY subtypes, of which there are currently 14, were first identified in the 1970s.3–5 They have an estimated population prevalence of 1.1:1000, or about 1–2% of diabetes cases (Box 1) in white Europeans, but are present in every race and ethnicity.6
The three most common MODY subtypes are mutations of hepatocyte nuclear factor 1A (HNF1A, MODY3), HNF4A (MODY1) and GCK genes. The GCK mutation, known as MODY subtype 2 (MODY2), or more recently as GCK-MODY, constitutes 10–60% of all MODY cases (Box 2).2,9–11 Rarer mutations resulting in β-cell dysfunction are also considered as separate MODY subtypes, and include alterations to insulin promoter factor 1 (MODY4), HNF1B (MODY5), and neurogenic differentiation factor 1 (MODY6) (Appendix). Patients with MODY5 constitute 5% of all MODY subtypes; MODY5 has been named the “renal cysts and diabetes syndrome,” as it often encompasses other urogenital malformations, pancreatic atrophy and deranged liver function tests.
The reference list includes succinct and lengthier reviews for further reading on MODY subtypes7,10,12,13 and on GCK-MODY.2,7,14
MODY subtypes 1 (HNF4A) and 3 (HNF1A)
Although driven by different mutations, the clinical phenotypes due to alterations of the HNF4A (MODY1) and HNF1A (MODY3) are best regarded as similar entities, because the features and management are similar.7,10,15 It is believed that mutations in HNF4A and HNF1A, which function as transcription factors, specifically result in dysfunction of the α, β and pancreatic polypeptide cells within pancreatic islets, resulting in reduced or delayed insulin secretion in response to glucose.15,16 In general, both MODY1 and MODY3 may present with mild diabetes, although usually postprandial blood glucose excursions are greater than those seen in GCK-MODY (ie, ≥ 5 mmol/L).17 Clinical features of MODY3, in addition to those listed in Box 2, include young onset diabetes usually before the age of 25 years in at least one family member, not normally requiring insulin initially, with generally good glycaemic control with less insulin than anticipated, detectable C-peptide in the presence of a blood glucose level (BGL) of over 8 mmol/L, family history spanning at least two generations, postprandial glucose excursions over 5 mmol/L with or without normal fasting glycaemia, absence of pancreatic autoantibodies and glycosuria when BGLs are under 10 mmol/L (given the low renal threshold for glucose wasting).18 These patients usually have a profound response to low doses of sulfonylurea therapy,16,19 with one randomised cross-over trial demonstrating about a 5-fold greater response with gliclazide compared with metformin. Patients also typically lack features of metabolic syndrome or insulin resistance (eg, obesity, acanthosis nigricans, elevated or normal high density lipoprotein cholesterol, and normal triglycerides).10,12
In contrast, MODY1 (HNF4A) is much less common, although the clinical features are similar to MODY3 (HNF1A), aside from a later age at diagnosis and the lack of pronounced glycosuria. Patients with MODY1 also share sensitivity to sulfonylureas. Offspring of women with MODY1 are often born with macrosomia (> 4.4 kg in 56% of carriers) and there may be transient neonatal hyperglycaemia.8 Clinical suspicion should be raised when there is a strong family history of pronounced macrosomia, or less commonly, if there is diazoxide (a medication used to treat hypoglycaemia) responsive neonatal hyperinsulinism in the context of familial diabetes.
Like T2D, both MODY1 and MODY3 are progressive forms of diabetes, and insulin secretion reduces over time.13 It is expected that micro- and macrovascular complications should be screened for, especially retinopathy and nephropathy. Treatment with insulin may be needed in 30–40% of affected individuals.12 Mutations in HNF4A favourably affect lipid biosynthesis and are associated with a 50% reduction in serum triglyceride levels and a 25% reduction in certain serum apolipoproteins.10
MODY2 (GCK-MODY) is often misdiagnosed
Based on the frequency of diagnoses, referral rates and prevalence in the United Kingdom, it is likely that GCK-MODY is underdiagnosed (or misdiagnosed as T2D) as more than 80% of patients with GCK-MODY do not undergo genetic testing.20 The condition is driven by an inactivating, heterozygous mutation of GCK, the glycolytic enzyme that catalyses the conversion of glucose to glucose 6-phosphate, the initial step in the chain of glucose metabolism in the β cell, consequently required for the release of insulin.21 In GCK-MODY, GCK is abnormal and functions at a higher glucose sensing threshold, earning its reputation as the “glucose sensor” of the β cell and the hepatocyte.22
The clinical phenotype is asymptomatic, mild hyperglycaemia present from childhood, usually ranging from 5.4 to 8.3 mmol/L. Most patients have an HbA1c level of 5.6–7.3% (41–56 mmol/mol) if they are less than 40 years old, or 5.9–7.6% (41–60 mmol/mol) if they are more than 40 years old.23
Special groups
All children with fasting hyperglycaemia need exclusion of GCK-MODY
Chronic childhood hyperglycaemia is exceptionally abnormal and, therefore, GCK-MODY along with type 1 diabetes (T1D) are the major differential diagnoses to consider, as GCK-MODY is present in 10–60% of all children with fasting hyperglycaemia.2 One cohort study of 82 children with fasting hyperglycaemia (BGL, ≥ 5.5 mmol/L) and negative β-cell antibodies found a GCK mutation in 48% of the cases.24 The major discriminating features favouring T1D are the presence of one or more islet cell antibodies, more pronounced hyperglycaemia, requirement for insulin within 5 years of diagnosis, and a stimulated C-peptide level lower than 200 pmol/L, as these are usually lacking in GCK-MODY.1,25
Pregnant women with GCK-MODY may need treatment
Epidemiological studies suggest that GCK-MODY is present in 1–2% of mothers diagnosed with GDM, and it usually presents as asymptomatic, mild fasting hyperglycaemia.6 A lower body mass index (BMI, < 25 kg/m2) and a fasting glucose level greater than or equal to 5.5 mmol/L have sensitivity and specificity of 68% and 96%, respectively. It is estimated that among lean women with mild fasting hyperglycaemia, the number of women needed to test is 2.7 to detect a single case of GCK-MODY.6 With new diagnostic thresholds adopted in Australia defining the diagnosis of GDM (ie, fasting BGL, 5.1–6.9 mmol/L),11 it is likely that more cases will be detected incidentally. Treatment in mothers with a known GCK-MODY mutation is indicated only if the fetus has a confirmed normal genotype (via chorionic villus sampling or amniocentesis) or if there is sonographic evidence of accelerated fetal growth on ultrasound, since this likely reflects fetal hyperinsulinaemia as the fetus attempts to overcome maternal hyperglycaemia. Treatment is with insulin, which is normally ceased postpartum.2,26,27
Diagnosis
Mild, fasting hyperglycaemia in younger, slimmer patients
There are no distinct clinical features of GCK-MODY. Suspicion is based on the findings of persistently elevated fasting hyperglycaemia (5.4–8.3 mmol/L), HbA1c levels of 5.8–7.6% (40–60 mmol/mol), young age (< 30 years old), non-obese phenotype, post-prandial glucose excursions lower than 3 mmol/L, and autosomal dominant pattern of inheritance of diabetes.2,7 With respect to the latter, a strong clinical clue is that many relatives of patients with known GCK-MODY will have been diagnosed with prediabetes, T1D or T2D, yet they rarely require insulin despite being diagnosed for many decades, and seemingly few, if any, develop complications. Despite this, about 20% of family members with GCK-MODY receive treatment with oral hypoglycaemic therapy and a minority with insulin.4,28,29
Genetic testing is the gold standard
Confirmation of GCK-MODY is performed by molecular genetic testing using Sanger sequencing and requires 5–10 mL of ethylenediaminetetraacetic acid (EDTA)-treated blood. There are over 620 gene mutations identified throughout the ten pancreatic β-cell exons of the GCK gene in more than 1400 families.30 Samples can be sent to a number of laboratories.31,32 For example, one laboratory’s cost and processing time (4–8 weeks) will depend on whether the mutation is known to be due to a GCK mutation (cost ∼ $600) or either of HNF4A or HNF1A (∼ $800).2 A 16-gene MODY panel may also be requested for about $1145. Local laboratories can also perform the analysis for GCK mutations for $745 with a turn-around time of 4 weeks.32 Other mutations (ie, HNF4A, HNF1A) may be analysed by requesting a MODY 10-gene panel (next generation sequencing), inclusive of GCK gene mutation testing. A 4 mL EDTA blood sample is required (or 2 μg genomic DNA) and the cost is about $1100 with a 4-week turn-around time. As whole genome sequencing becomes more widely available, testing for heritable diabetes syndromes will become easier to access and new syndromes will be discovered (this information is current at the time of printing).
Testing patients greatly influences management
Because a diagnosis of GCK-MODY will significantly alter management, the clinician should be alert for suspected cases and refer suitable patients for genetic testing. However, as our case illustrates, in patients treated with diabetes medications for many years, the physician should discuss testing in an unbiased manner, without assuming that the patient will embrace a positive result that will allow them to cease therapy. If patients are amenable to ceasing treatment, as in our patient, this may cause significant stress and anxiety due to a feeling of guilt and perceived future morbidity. This is due to multiple previous clinical discussions with the patient stressing the importance of treatment adherence and tight glycaemic control. This is similarly important in patients with MODY3, in whom a positive diagnosis allows cessation of insulin and a switch to a sulfonylurea, which is likely to have been administered in a basal-bolus regimen or via an insulin pump for many years. Patients should be alerted that confirming a diagnosis of GCK-MODY not only significantly influences the number of investigations and reduces the treatment burden to them, but it also carries implications for relatives who may be undiagnosed, with offspring having a 50% chance of inheriting the gene.
To treat or not to treat
Arguments against treatment
With the exception of pregnancy, GCK-MODY has been regarded as a lifelong subtle abnormality in glucose homeostasis that is not progressive and shows little deterioration over time.16,33 This is in contrast to MODY3 (20–50% of cases), MODY1 (∼ 5% of cases)7 as well as T1D and T2D. GCK-MODY should therefore be considered a distinct clinical entity.2 As the fasting hyperglycaemia is often mild, varies little with time, and rarely results in the development of micro- or macrovascular complications, treatment is thought unlikely to change clinical outcomes.2,33 In a recent, large cross-sectional study involving GCK-MODY patients with a mean duration of 49 years, patients developed only mild background retinopathy when compared with healthy controls. Moreover, macrovascular complications developed in 4% of GCK-MODY patients versus 30% in patients with T2D, possibly reflecting the more favourable lipid profile in this condition.33
It is also known that the mild fasting hyperglycaemia in patients with GCK-MODY is resistant to oral diabetes therapy as well as dietary changes, due to the altered set point at which glucose homeostasis is maintained by the loss-of-function mutation of GCK.28 Therefore, treatment may not alter a patient’s glycaemic control or their trajectory towards developing complications as a result of mild fasting hyperglycaemia.
Arguments for treatment
As with the rest of the population, which is affected by genetic susceptibility, advancing age and rising rates of obesity, patients with GCK-MODY may also concurrently develop the metabolic derangements typical of T2D, such as progression of insulin resistance and β-cell failure.34 For example, one retrospective study of 33 patients with GCK-MODY over an 11-year period illustrated a small but significant deterioration in fasting (6.8–7.1 mmol/L) and 2-hour glucose levels (8.2–9.0 mmol/L), as well as decreases in insulin sensitivity when baseline and repeat oral glucose tolerance tests were compared.34 This was also associated with a mean increase in BMI from 19.2 to 22.3 kg/m2. More recently, it has been suggested that patients with GCK-MODY should be considered for treatment when the HbA1c level clearly and repeatedly exceeds 7.6 (60 mmol/mol).2,23 However, the question of whether to treat or not, based on a specific HbA1c level in patients with GCK-MODY, remains controversial; notwithstanding, HbA1c itself has limitations in predicting the development of microvascular complications.35
The verdict is divided
The decision to treat the patient should take into consideration the patient’s age, the current mild to moderate hyperglycaemia, the observation of postprandial glucose intolerance, the patient’s preference and the suboptimal HbA1c level, which may increase the risk of both micro- and macrovascular complications. This is in the context of an anticipated trajectory of deteriorating glycaemic metabolism that often accompanies advancing age and weight gain. This would naturally be weighed against the risks, cost and inconvenience of multiple investigations and the need for medical appointments, frequent self-monitoring of glucose levels, cost of glucose test strips, as well as patient anxiety.36 Furthermore, many patients may suffer from side effects from pharmacologic therapy; notwithstanding, weight gain, hypoglycaemia (especially if on sulfonylurea or insulin), gastrointestinal upset and vitamin B12 deficiency with metformin, as well as the adverse metabolic consequences to bone metabolism, bladder cancer risk and heart failure with thiazolidinediones, as in our index patient, should be considered. To date, there are no data on the efficacy of dipeptidyl peptidase 4 inhibitors, glucagon-like peptide-1 receptor agonists, or sodium glucose cotransporter 2 inhibitors, in these patients. Therefore, a careful examination, by an attentive clinician, of the patient’s goals, quality of life, comorbidities and an estimation of benefit, should form the basis when considering the decision to treat.
Genetic testing is underutilised but may be cost-effective
The burden and cost, both personally and to the community, are difficult to estimate when considering the implementation of a screening strategy at a national level. A recent cost-analysis simulation of a one-time genetic screening test (with a cost of US$2580) for the three most common MODY subtypes (GCK, HNF1A, HNF4A) — which account for more than 90% of all MODY cases — within the first year of diagnosis, was undertaken in a hypothetical cohort of young individuals (aged 25–40 years old) with a diagnosis of diabetes.36 The study assumed that the prevalence of GCK-MODY was 6% (similar to other countries), and when diagnosed, patients with GCK-MODY received no treatment. The screening test yielded an average small gain of 0.012 quality-adjusted life years and an incremental cost-effectiveness ratio of US$50 000.36 The cost-effectiveness extends to children, and arguably more so, with savings of about €1500 per year from time of diagnosis, as intensive treatment for presumed T1D in children is reduced to conservative management in the case of a positive diagnosis of GCK-MODY.37
It is not just MODY; diabetes genes are common in the general population
It is worth noting that not all genetic causes of diabetes can be ascribed simply to monogenic (single gene) mutations such as in MODY, or that there are a small number of rare genes inherited within generational lines that specifically affect an individual’s risk of developing diabetes. This approach, although clinically useful, is simplistic and may inadvertently overlook the fact that, on the whole, the population carries multiple, common genetic alterations in a single gene (ie, variants) that may collectively increase the risk of developing diabetes.38 A recent large analysis of exomes (protein-coding regions which comprise a fraction, 1–2%, of the whole human genome), from 6500 subjects with T2D matched to an equal number of healthy controls from five ethnic groups, has cast doubt on the evidence that rare or low frequency disease-associated variants affect the risk of developing diabetes. The authors note that most of the diabetes-associated genetic variants are quite common in the population.39
Conclusion
Despite the availability of genetic testing, there are a significant number of patient- and physician-related factors that may be prohibitive to uptake, including the perceived lack of possibilities for treatment (if coexistent MODY and T2D develop over time, many would argue that it may not change management if hyperglycaemia is mild; however, we believe that it makes a difference to management and monitoring) and prevention, cost implications of a positive diagnosis to patients, and lack of awareness of MODY as a diagnosis.40 These factors should all be discussed with the patient when considering genetic or genomic testing. The patient should be counselled regarding the treatment implications of a positive diagnosis, including the possibility that they may have not required the treatment they were prescribed many years prior. The points raised by this review will be increasingly relevant to the medical practitioner given the rapid development of genetic and genomic testing.
Box 1 –
Subtypes of diabetes according to relative prevalence
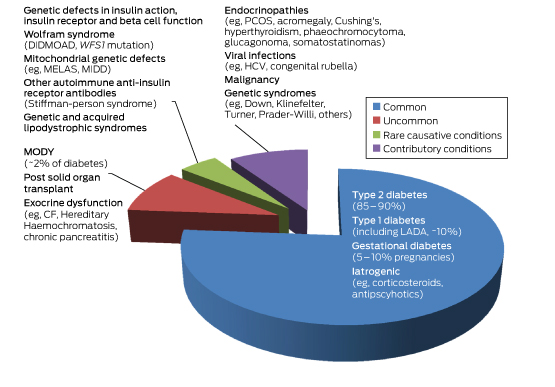
CF = cystic fibrosis. DIDMOAD = diabetes insipidus diabetes mellitus optic atrophy deafness. GDM = gestational diabetes. HCV = hepatitis C virus. LADA = latent autoimmune diabetes of the adult. MELAS = mitochondrial myopathy, encephalopathy lactic acidosis and stroke-like episodes. MIDD = maternally inherited diabetes. MODY = maturity onset diabetes of the young. PCOS = polycystic ovarian syndrome. WFS1 = wolframin gene.
Box 2 –
Prevalence, genetic and key clinical features of the common forms of diabetes and subtypes of maturity onset diabetes of the young (MODY)
|
|
Type 2 diabetes |
Type 1 diabetes |
Gestational diabetes |
MODY1 |
MODY2 |
MODY3 |
|||||||||
|
|
|||||||||||||||
|
Prevalence |
1 in 13 people (∼ 870 000 in Australia) |
10% of all diabetes (∼ 170 000 in Australia) |
5–10% of all pregnancies |
∼ 5%* |
10–60%* |
20–50%* |
|||||||||
|
Causative mutation |
Multiple polymorphisms (eg, class II HLA genes) |
Multiple polymorphisms |
Multiple polymorphisms |
GCK2 |
HNF1A10 |
||||||||||
|
Clinical features |
Older (usually > 45 years), overweight or obese, often family history, insulin resistance |
Slim, family history of autoimmune disorders, usually childhood or early adolescence or adulthood (includes LADA) |
Older (> 40 years); pre-pregnancy obesity (BMI, > 30 kg/m2); family history (30%) and ethnicity; previous GDM; PCOS; macrosomic babies, diagnosed 24–28 weeks’ gestation |
Young age (< 25 years), strong family history of diabetes, absent antibodies, detectable C-peptide |
|||||||||||
|
Diagnostic glucose and HbA1c |
75 g OGTT: fasting BGL, ≥ 7 mmol/L; random or 2-h postprandial BGL, ≥ 11.1 mmol/L; HbA1c, ≥ 6.5% (48 mmol/mol) |
Similar to type 2 diabetes |
75 g OGTT: fasting BGL, 5.1–6.9 mmol/L;1-h, ≥ 10 mmol/L; 2-h, 8.5–11 mmol/L11 |
As with type 2 diabetes; postprandial glucose excursions, ≥ 5 mmol/L |
Fasting BGL, 5.4–8.3 mmol/L; postprandial glucose excursions, ≤ 3 mmol/L, HbA1c, 5.8–7.6% (40–60 mmol/mol) |
As for MODY1 |
|||||||||
|
Treatment |
Diet, exercise, OHG, injectable GLP1 RA, insulin |
Insulin |
Diet, exercise, metformin, insulin |
Respond to sulfonylureas, 30–40% apparent insulin-requiring |
None required (controversial) |
As for MODY1 |
|||||||||
|
Special features |
Progressive β-cell dysfunction with development of micro- and macrovascular complications |
Negative C-peptide and DKA without insulin (outside of honeymoon period), positive antibodies in majority to GAD, IA-2, ICA, IAA and ZnT8 |
Hyperglycaemia remits postpartum |
Glycosuria common; develop micro- and macrovascular complications as in type 1 and 2 diabetes |
Favourable lipid profile; lean; minimal or no micro- or macrovascular complications; minimal effect of treatment on glycaemic control |
As for MODY1; strong family history of macrosomic babies |
|||||||||
|
|
|||||||||||||||
|
* Denotes approximate percentage prevalence of all MODY subtypes. DKA = diabetic ketoacidosis. GAD = glutamic decarboxylase autoantibody. GCK = glucokinase gene. GDM = gestational diabetes mellitus. GLP1 RA = glucagon-like peptide 1 receptor agonists. HLA = human leukocyte antigen. HNF1A = hepatocyte nuclear factor 1α gene. HNF4A = hepatocyte nuclear factor 4α gene. IA-2 = insulinoma-associated-2 autoantibody. IAA = insulin autoantibody. ICA = islet cell cytoplasmic autoantibody. LADA = latent autoimmune diabetes of the adult. OGTT = oral glucose tolerance test. OHGs = oral hypoglycaemic therapy. PCOS = polycystic ovarian syndrome. ZnT8 = zinc transporter 8 autoantibody. |
|||||||||||||||
Doctor accreditation under review
Health economist Professor Michael Woods will look at ways to encourage collaboration between the health professions as part of a review of accreditation systems.
The Independent Review has been commissioned by the Australian Health Ministers’ Advisory Council to examine the effectiveness of the accreditation system “to ensure that the educational programs provide a sustainable registered health profession workforce that is flexible and responsive to the changing health needs of the Australian community”.
Among his terms of reference, Professor Woods, who is Professor of Health Economics at the University of Technology Sydney, has been asked to report on the cost effectiveness of the accreditation regime, as well as options to streamline the process and “opportunities for increasing consistency and collaboration across professions”.
The review is being conducted at a sensitive time.
The AMA has been in discussion with several professional groups including the Pharmacy Society of Australia about ways to improve coordination and collaboration, and has backed the incorporation of non-prescribing pharmacists as part of a GP-led primary health care team.
But a number of groups, most notably in pharmacy and chiropractic, have earned the AMA’s ire over attempts to encroach on the medical profession’s field of practice and expertise, driven by concerns that it might put patients at risk of harm.
These concerns have been underlined by a direction from the nation’s health ministers, meeting at COAG Health Council last month, for the Chiropractors Board of Australia and Australian Health Practitioner Regulation Agency to provide them with “evidence of any treatments provided by chiropractors that are not appropriately within the chiropractic scope of practice and may be harmful to patients”.
The ministers asked the agencies to advise on “potential regulatory responses”.
Professor Woods is due to complete his review by the end of 2017.
Adrian Rollins
[Perspectives] Winnie Yip: tracking health policy and economics in China
Although not born into an academic family—her father was a Hong Kong businessman—it didn’t take Winnie Yip long to discover the rewards of learning. And at the best institutions. A degree in economics from the University of California, Berkeley, was followed, in 1994, by a PhD at the Massachusetts Institute of Technology. Then it was research at Harvard and Oxford and now Harvard again—this time as its newly appointed Professor of the Practice of International Health Policy and Economics. The reward she’s acquired over this time is an international reputation in both these topics.
The economic benefits of eliminating Indigenous health inequality in the Northern Territory
The known Although there are estimates of Indigenous health expenditure, little information is available regarding the total economic burden of Indigenous health inequality.
The new Indigenous health inequality is a substantial economic deadweight, costing the Northern Territory an estimated $16.7 billion between 2009 and 2013 (43% from lost life-years, 35% from lost productivity, 22% from higher direct health costs), equivalent to 19% of the NT gross state product.
The implications Closing the Indigenous gap will have far-reaching potential benefits for the economic future of the NT.
The Northern Territory covers one-sixth of the Australian landmass, but includes only 1% of its population. Aboriginal and Torres Strait Islander (Indigenous) people constitute about 27% of the NT population (compared with 2.5% nationally) (Box 1).1 Compared with the rest of the population, Indigenous Australians have disproportionate levels of social isolation, poverty, unemployment, lack of education, and inadequate access to health care.2 They also suffer poorer health; for Indigenous people in the NT born between 2010 and 2012, life expectancy at birth was 63 (men) and 69 years (women),3 17 and 14 years less than for non-Indigenous Territorians.
There is consensus that closing the health gap between Indigenous and non-Indigenous Australians requires concerted efforts by all sections of society. In 2009, Australian governments announced a vision for eliminating this gap within a generation: that is, by 2031 (“Closing the Gap”).4 The main focus was on broad consultations with Indigenous people about a range of measures, including health, childcare, schooling and economic participation.4
In this regard, two important questions were asked but remained largely unexplored:
-
How much does the Indigenous health gap cost society?
-
What are the potential economic benefits if the gap were to be eliminated?
The purpose of our study was to provide basic information on the potential economic benefits of reducing the Indigenous health gap, by quantifying the magnitude of the economic burden associated with Indigenous health inequality in the NT on the basis of standard cost-of-illness methodology and using the most recent data.5–7
Methods
Life expectancy was calculated using population and death data for 2009–2013. Indigenous and non-Indigenous resident population and death registration data were gathered from the Australian Bureau of Statistics and the Australian Coordinating Registry.8 The cost-of-illness approach was adopted for estimating the costs associated with the Indigenous health gap from a societal perspective; that is, all costs were included, regardless of who paid or received the payment: individuals, health care providers, Indigenous and non-Indigenous populations, or a government.7 This approach casts light on the overall magnitude and distribution of the economic costs of illness. All values were expressed in 2011 Australian dollars to account for inflation.
The total monetary value of the Indigenous health gap was estimated by calculating cost differences between the Indigenous and non-Indigenous populations in three categories: direct health costs (hospital, primary care, and other health services, including public health);9 indirect costs associated with lost productivity (missed income, welfare payments, and missed tax revenue, assuming equal opportunity for employment for Indigenous and non-Indigenous people);7 and intangible costs associated with premature deaths (based on years of life lost, YLL).7
Direct health costs were derived from data on overall health expenditure for Australia and expenditure for Indigenous people specifically;9,10 expenditure for non-Indigenous people was calculated by subtracting Indigenous expenditure from total expenditure. The cost differential (excess cost) for Indigenous health care was estimated by calculating the difference between actual expenditure on Indigenous health care and the estimated expenditure if the per capita costs were the same as for non-Indigenous NT residents.
A workforce supply and demand framework was used to assess the indirect costs caused by lost productivity, based on census data and other sources for employment, taxation and welfare payment data (Box 2).1,7,11 Indirect costs (productivity loss) encompassed excess welfare payments by governments, missed tax revenue, and lost efficiencies for the economy related to inadequate human capital development and human resources utilisation. The estimation of indirect costs is described in the Appendix.
The intangible costs attributable to the higher burden of disease were estimated by multiplying the excess YLLs by the value of a statistical life-year (VSLY).12 The YLLs were calculated using NT death data linked with the age-specific life expectancies from the Australian Burden of Disease (BOD) study.13 Following the BOD methodology, YLLs were not discounted for future years, and were costed at $120 000 per life-year, based on the review by Access Economics.12 Sensitivity analysis was undertaken with VSLY assumed to be $50 000, $100 000 or $140 000 per YLL. General inflation rates were applied to pricing the VSLY between 2009 and 2013.
Ethics approval
This study was endorsed by the Human Research Ethics Committee of the NT Department of Health and the Menzies School of Health Research (reference, HREC-2015-2400).
Results
Between 1 January 2009 and 31 December 2013, 9867 deaths of NT residents were registered; 62% were males, and 47% were Indigenous Australians (mean age at death, 51 years v 67 years for non-Indigenous deaths). Life expectancy at birth for Indigenous men and women was 64 and 69 years respectively, each 15 years lower than for non-Indigenous residents (79 and 84 years respectively).
Over the 5-year study period, direct health costs totalled $9.3 billion (2011 dollars), of which 58% were incurred by Indigenous patients (Box 3), more than double their proportion of the NT population. Per capita expenditure for Indigenous patients was 3.2 times that for non-Indigenous patients (based on total 5-year estimated resident population numbers: Indigenous, 345 968; non-Indigenous, 819 551). This ratio was slightly higher for hospital (3.5) than for primary care and other services (each 3.1). The total excess direct health costs were estimated at $3.7 billion during the 5 years, equivalent to about 40% of total expenditure (Box 3).
The indirect costs arising from lost productivity were estimated by matching the Indigenous supply–demand balance (equilibrium) with that of the non-Indigenous workforce (Box 2). The excess costs associated with lost productivity attributable to the Indigenous health gap were estimated to be $1.17 billion in 2011, of which $359 million (31%) were excess welfare payments, $293 million (25%) foregone tax revenue, and $515 million (44%) lost efficiencies (Appendix). The total costs of lost productivity attributed to Indigenous health inequality totalled $5.8 billion during 2009–2013 (Box 4). Wage responsiveness (elasticity) of demand was 1.8, and responsiveness of supply of the Indigenous workforce was 1.5, indicating that the demand and supply for the Indigenous workforce were respectively 80% and 50% higher than those for the non-Indigenous workforce (each 1.0 for demand and supply; Box 2). Based on Box 2, about 20 000 extra jobs at the average wage level would be required to close the gap, equivalent to a 14% expansion of the NT economy.
The intangible cost (burden of disease) estimates were based on excess YLLs. Over the 5-year period, there were 153 458 YLLs in the NT, 87 439 of which (57%) were attributable to Indigenous people, a rate that was 3.1 times that for the non-Indigenous population. The excess 59 571 Indigenous YLLs was equivalent to a total cost of $7.2 billion between 2009 and 2013 (Box 4). Intangible costs comprised the largest category of excess costs in the NT (43%), substantially higher than either direct health costs (22%) or indirect costs caused by lost productivity (35%) (Box 4).
The total costs resulting from Indigenous health inequality in the NT during 2009–2013 were estimated to be about $16.7 billion, equivalent to nearly one-fifth of the NT gross state product (GSP) for this period (Box 4).14 This result suggests that eliminating the Indigenous health gap could potentially save $745 million each year in direct health costs alone. In the medium and long term, closing the gap would save $13 billion in indirect and intangible costs over 5 years; savings in direct health costs would be less than one-quarter of the total long term financial benefit of closing the gap.
The results of our sensitivity analysis are included in the Appendix.
Discussion
We present evidence that Indigenous health inequality in the NT is both substantial and costly. The total costs attributable to Indigenous health inequality between 2009 and 2013 amounted to $16.7 billion, equivalent to 19% of GSP, a measure of the size of the NT economy. As a comparison, the costs of health inequalities for African, Asian and Hispanic Americans in the United States were estimated to be US$1.24 trillion during 2003–2006, corresponding to 2.4% of the American gross domestic product (GDP).5 The life expectancy gap between black and white Americans was only 4 years in 2010,15 as opposed to the 15 years between the Indigenous and non-Indigenous populations in the NT. A European Union study showed that the cost associated with socio-economic health inequalities was equivalent to 9.4% of GDP.6 Using the general equilibrium what-if analysis, an earlier Deloitte Access Economics study reported that the Indigenous employment gap imposed a cost of close to 10% of GSP in the NT.2 Our study found that 40% of direct health costs in the NT were associated with Indigenous health inequality, higher than the corresponding figures in the US (30%) and EU studies (20%).5,6
Our findings suggest that there would be enormous financial benefits for the NT in the longer term should closing the gap become a reality. The evidence we have presented implies that the total potential long term benefits would be $3.3 billion annually in real terms, and a boost of nearly 20% of GSP in relative terms (Box 4), double the projection by the Deloitte study (9% over 20 years).2 A possible explanation for this difference may be the different focuses of the studies: the Deloitte analysis concentrated on employment, whereas we assessed much broader benefits from a societal perspective. Closing the gap is feasible: between 1994 and 2008, Indigenous employment in Australia increased by 55–70%.16
There are many contributors to health inequality in the NT. Poverty is a cause and consequence of ill health, and the Indigenous population is particularly vulnerable to poverty, especially in remote areas. For example, the NT market basket survey of food and drink prices found that in 2014 they were 54% higher in remote than in urban areas.17 After adjusting for these higher prices, the real income of the average Indigenous person living in a remote community was only 29% of the overall NT average. Thirty per cent of NT Indigenous people are located 50 kilometres or more from a primary school and 100 kilometres or more from a health clinic. Remote areas lack economies of scale; 87% of NT Indigenous communities have populations of less than 100 people. Strategies for redressing health disparities should consider how the impact of remoteness might be ameliorated. Solutions may include ensuring access to essential government services for people residing in remote areas, and facilitating resettlement for those who wish to move to larger population centres.18 Overcoming the effects of remoteness, improving public housing, and raising living standards are necessary prerequisites for closing the gap,19 and will also allow economies of scale and a larger population base, which mean that education and health services can be provided more efficiently. This, in turn, will facilitate better access to labour markets for Indigenous people.
Economic growth in Indigenous communities is fundamental to improving Indigenous health and saving Indigenous human resources in the longer term.11 Closing the Indigenous health gap must therefore be seen more broadly as being dependent on closing gaps in both education and employment. We found that the income responsiveness of demand and supply (elasticity) for the Indigenous workforce was much greater than for the non-Indigenous population (80% and 50% higher respectively). This remarkable finding is consistent with other studies which have found that the response to improving education and employment opportunities is greater for remote Indigenous than for non-remote non-Indigenous populations.20 That poor Indigenous health can be improved by reducing poverty is a testable hypothesis, as it focuses on tackling the root cause of ill health, and contributes to economic growth and prosperity.
Several technical health economic innovations were explored in our analysis. We adopted the cost-of-illness approach for assessing health inequality, a technique successfully applied in a recent US study.5 We incorporated BOD data into our analysis; this is the first study to use such data to estimate the costs of health inequality. We developed a supply and demand model of the NT workforce, using empirical data to determine the indirect costs of lost productivity attributable to the Indigenous health gap.
There were several potential limitations to our study. First, we acknowledge that our cost estimates of health inequality may not be precise. The indirect and intangible cost estimates were based on economic modelling and a pre-specified VSLY; however, it is likely that the assumed VSLY was conservative.12 Second, we made no allowance for a definite timeframe for closing the gap, primarily because this depends on the implementation of the Closing the Gap policy. Third, our costings may be incomplete, as we did not include transport, capital, informal care and crime-related costs. Finally, there was no in depth discussion of possible solutions for health-related inequality. Genetic factors play only a limited role in Indigenous health inequality21 when compared with more important and interconnected political and socio-economic factors, such as lower living standards, income and employment, lack of access to education2,21 and primary health care,22 and social isolation.18
Notwithstanding these limitations, our study indicates that, should the aspirations of the Closing the Gap initiative be realised, savings will be far greater in terms of improved productivity and saved human life-years than in direct health care service costs. The complete benefits of closing the gap will flow from economic development.
Our study shows that Indigenous health inequality is a costly economic deadweight in terms of lost life-years, lost productivity, and higher expenditure on health and social security. Our analysis provides a strong economic case for making investments to close the Indigenous health gap. The cost estimates highlight the enormous opportunity costs caused by this gap, and the potential cost savings to be made by closing it, not to mention the non-pecuniary benefits of a more just society.
Box 1 –
Baseline demographic and socio-economic data for Indigenous and non-Indigenous people in the Northern Territory, 2011*
|
|
Indigenous residents |
Non-Indigenous residents |
|||||||||||||
|
|
|||||||||||||||
|
Population |
56 778 (26.8%) |
155 165 (73.2%) |
|||||||||||||
|
Completed year 12 |
9% |
42% |
|||||||||||||
|
Employed |
22% |
62% |
|||||||||||||
|
Weekly personal income, mean |
$398 |
$991 |
|||||||||||||
|
Residing in remote area |
63% |
6% |
|||||||||||||
|
|
|||||||||||||||
|
* Source: Australian Bureau of Statistics 2011 Census.1 |
|||||||||||||||
Box 2 –
Estimated supply and demand curves in the Indigenous and non-Indigenous labour markets, Northern Territory, 2011
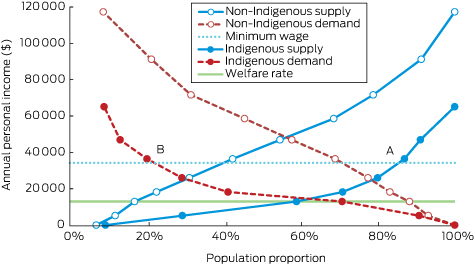
Data sources: Australian Bureau of Statistics 2011 Census, Basic Community Profile and Indigenous Profile, Northern Territory.1 At the minimum wage, approximately 85% of the Indigenous working-age population (point A) would be willing to supply labour, compared with a demand for Indigenous labour at this level of only 22% (point B).
Box 3 –
Direct health costs for Indigenous and non-Indigenous people in the Northern Territory, 2009–2013, by area of expenditure ($ million, 2011)
Box 4 –
Cost estimates of Indigenous health inequality in the Northern Territory, 2009–2013 ($ million, 2011)
|
|
Direct health costs |
Indirect costs |
Intangible costs |
Total excess costs |
GSP |
Total excess costs as proportion of GSP |
|||||||||
|
|
|||||||||||||||
|
2009 |
630 |
1100 |
1218 |
2947 |
15 887 |
18.6% |
|||||||||
|
2010 |
679 |
1133 |
1260 |
3071 |
16 456 |
18.7% |
|||||||||
|
2011 |
786 |
1167 |
1332 |
3284 |
16 870 |
19.5% |
|||||||||
|
2012 |
835 |
1202 |
1936 |
3973 |
18 131 |
21.9% |
|||||||||
|
2013 |
796 |
1238 |
1429 |
3463 |
19 463 |
17.8% |
|||||||||
|
2009–2013 |
3725 (22.2%*) |
5838 (34.9%*) |
7175 (42.9%*) |
16 739 |
86 806 |
19.3% |
|||||||||
|
|
|||||||||||||||
|
GSP = Gross state product. * Proportion of total excess costs. |
|||||||||||||||